An orphan cbb3-type cytochrome oxidase subunit supports Pseudomonas aeruginosa biofilm growth and virulence
- Columbia University, United States
Abstract
Hypoxia is a common challenge faced by bacteria during associations with hosts due in part to the formation of densely packed communities (biofilms). cbb3-type cytochrome c oxidases, which catalyze the terminal step in respiration and have a high affinity for oxygen, have been linked to bacterial pathogenesis. The pseudomonads are unusual in that they often contain multiple full and partial (i.e. ‘orphan’) operons for cbb3-type oxidases and oxidase subunits. Here, we describe a unique role for the orphan catalytic subunit CcoN4 in colony biofilm development and respiration in the opportunistic pathogen Pseudomonas aeruginosa PA14. We also show that CcoN4 contributes to the reduction of phenazines, antibiotics that support redox balancing for cells in biofilms, and to virulence in a Caenorhabditis elegans model of infection. These results highlight the relevance of the colony biofilm model to pathogenicity and underscore the potential of cbb3-type oxidases as therapeutic targets.
https://doi.org/10.7554/eLife.30205.001eLife digest
Bacteria often form communities called biofilms to make them stronger and more ‘invincible’. However, when these communities become too crowded, oxygen levels can drop, which makes it harder for them to survive. Some types of bacteria, such as Pseudomonas aeruginosa, have found different ways to cope with lower levels of oxygen. For example, they produce enzymes that use oxygen more efficiently or are better at scavenging low concentrations of oxygen.
When organisms – including bacteria – produce energy, they break down nutrients into small molecules to extract electrons. These electrons are then transported along their membrane until they reach their final destination – an oxygen molecule. Studies of P. aeruginosa grown in the laboratory have shown that it uses several types of enzymes called terminal oxidases to complete this last electron transfer. The bacterium can also make chemicals that help to shuttle electrons to remote oxygen sources. For example, they can produce compounds called phenazines that can transport electrons and also compensate for low oxygen levels.
However, the conditions in biofilms can be very different to those in a laboratory environment, and until now it was not known what role the different oxidases play in biofilm communities, or how phenazines can compensate for low oxygen levels.
To investigate this further, Jo et al. studied P. aeruginosa in an artificial biofilm environment and in a nematode worm host. The results showed that a specific part of the terminal oxidases – a protein called CcoN4 – was necessary for P. aeruginosa to grow optimally in both instances. Mutant bacteria that lacked CcoN4 struggled to survive. Moreover, bacteria containing CcoN4 were able to deliver the electrons to phenazines. This suggests that CcoN4 is also needed for phenazines to work properly.
This study shows that blocking terminal oxidases that contain CcoN4 can weaken P. aeruginosa and consequently its ability to cause infections. Furthermore, these types of terminal oxidases are only found in bacteria, which makes them attractive targets for potential drugs that would have minimal side effects on the host’s metabolism. P. aeruginosa infections are a leading cause of death for people suffering from cystic fibrosis, a genetic condition that affects the lungs and the digestive system. A better understanding of what makes P. aeruginosa so infectious will help to find new treatments for these patients.
https://doi.org/10.7554/eLife.30205.002Introduction
Among the oxidants available for biological reduction, molecular oxygen (O2) provides the highest free energy yield. Since the accumulation of O2 in the atmosphere between ~2.4 and 0.54 billion years ago (Kirschvink and Kopp, 2008; Dietrich et al., 2006b), organisms that can use it for growth and survival, and tolerate its harmful byproducts, have evolved to exploit this energy and increased in complexity (Knoll and Sperling, 2014; Falkowski, 2006). At small scales and in crowded environments, rapid consumption of O2 leads to competition for this resource and has promoted diversification of bacterial and archaeal mechanisms for O2 reduction that has not occurred in eukaryotes (Brochier-Armanet et al., 2009). The various enzymes that allow bacteria to respire O2 exhibit a range of affinities and proton-pumping efficiencies and likely contribute to competitive success in hypoxic niches (Morris and Schmidt, 2013). Such environments include the tissues of animal and plant hosts that are colonized by bacteria of high agricultural (Preisig et al., 1996) and clinical (Way et al., 1999; Weingarten et al., 2008) significance.
The opportunistic pathogen Pseudomonas aeruginosa, a colonizer of both plant and animal hosts (Rahme et al., 1995), has a branched respiratory chain with the potential to reduce O2 to water using five canonical terminal oxidase complexes: two quinol oxidases (bo3 (Cyo) and a bd-type cyanide-insensitive oxidase (CIO)) and three cytochrome c oxidases (aa3 (Cox), cbb3-1 (Cco1), and cbb3-2 (Cco2)) (Figure 1A). Several key publications have described P. aeruginosa’s complement of terminal oxidases and oxidase subunits, revealing features specific to this organism (Williams et al., 2007; Comolli and Donohue, 2004; Alvarez-Ortega and Harwood, 2007; Arai et al., 2014; Kawakami et al., 2010; Jo et al., 2014). P. aeruginosa is unusual in that it encodes two oxidases belonging to the cbb3-type family. These enzymes are notable for their relatively high catalytic activity at low O2 concentrations and restriction to the bacterial domain (Brochier-Armanet et al., 2009; Pitcher and Watmough, 2004). (The P. aeruginosa cbb3-type oxidases are often referred to as cbb3-1 and cbb3-2; however, we will use ‘Cco1’ and ‘Cco2’ for these enzymes, consistent with the annotations of their encoding genes.) Most bacterial genomes that encode cbb3-type oxidases contain only one operon for such a complex, which is induced specifically under conditions of O2 limitation (Cosseau and Batut, 2004). In P. aeruginosa, the cco2 operon is induced during growth at low O2 concentrations, but the cco1 operon is expressed constitutively at high levels (Comolli and Donohue, 2004; Kawakami et al., 2010).
Figure 1
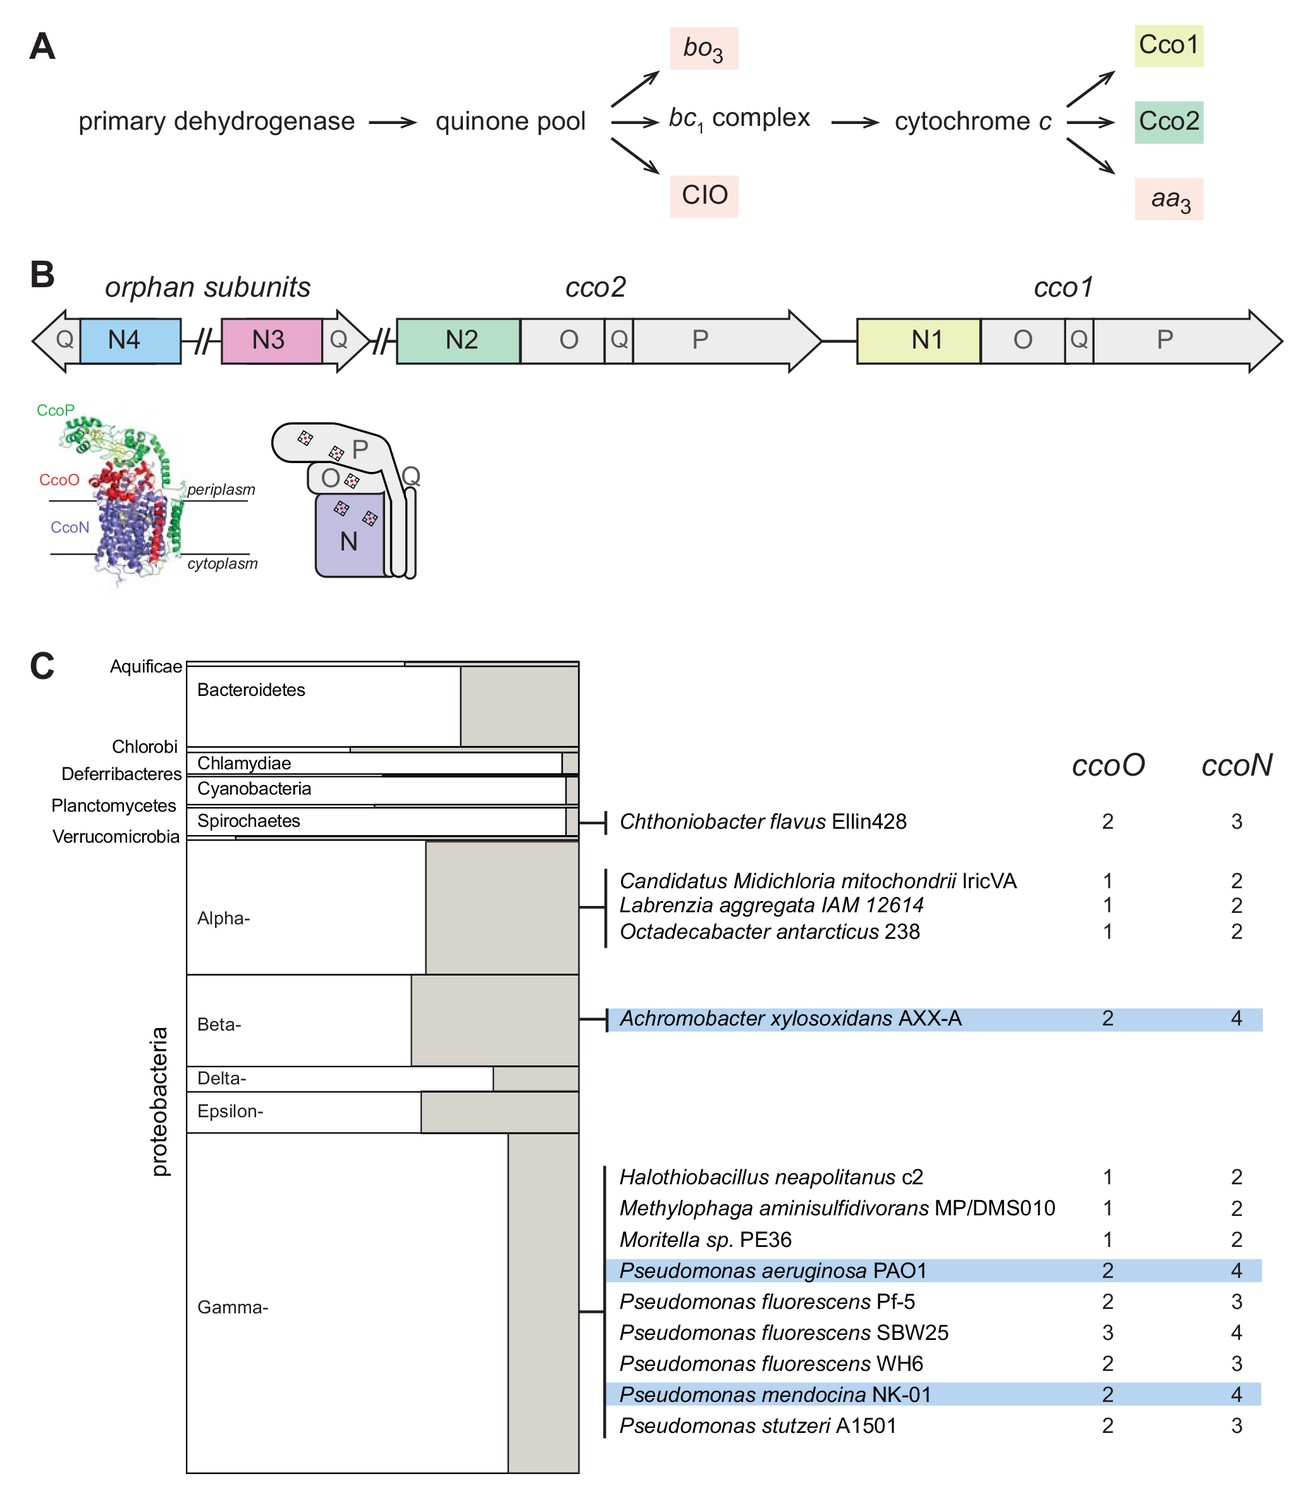
The respiratory chain and arrangement of cco genes and protein products in P. aeruginosa, and the phylogenetic distribution of orphan ccoN genes.
(A) Branched electron transport chain in P. aeruginosa, containing five canonical terminal oxidases. (B) Organization of cco genes in the P. aeruginosa genome. The cartoon of the Cco complex is based on the Cco structure from P. stutzeri (PDB: 3mk7) (Buschmann et al., 2010). (C) Left: graphical representation of the portion of genomes in each bacterial phylum that contain ccoO and N homologs. The clades Chrysiogenetes, Gemmatimonadetes, and Zetaproteobacteria were omitted because they each contain only one species with ccoO and N homologs. The height of each rectangle indicates the total number of genomes included in the analysis. The width of each shaded rectangle represents the portion of genomes that contain ccoN homologs. Middle: genomes that contain more ccoN than ccoO homologs (indicating the presence of orphan ccoN genes) are listed. Right: numbers of ccoO and ccoN homologs in each genome. Blue highlights genomes containing more than one orphan ccoN homolog.
An additional quirk of the P. aeruginosa terminal oxidase complement lies in the presence of genes for ‘orphan’ cbb3-type subunits at chromosomal locations distinct from the cco1 and cco2 operons. While the cco1 and cco2 operons, which are chromosomally adjacent, each contain four genes encoding a functional Cco complex (consisting of subunits N, O, P, and Q), the two additional partial operons ccoN3Q3 and ccoN4Q4 each contain homologs coding for only the Q and catalytic N subunits (Figure 1B). Expression of the ccoN3Q3 operon is induced under anaerobic denitrification conditions (Alvarez-Ortega and Harwood, 2007), and by nitrite exposure during growth under 2% O2 (Hirai et al., 2016). During aerobic growth in liquid cultures, ccoN4Q4 is induced by cyanide, which is produced in stationary phase (Hirai et al., 2016). However, additional expression studies indicate that ccoN4Q4 transcription is influenced by redox conditions, as this operon is induced by O2 limitation (Alvarez-Ortega and Harwood, 2007) and slightly downregulated in response to pyocyanin, a redox-active antibiotic produced by P. aeruginosa (Dietrich et al., 2006a).
In a recent study, Hirai et al. characterized the biochemical properties and physiological roles of P. aeruginosa cbb3 isoforms containing combinations of canonical and orphan subunits (Hirai et al., 2016). In a strain lacking all of the aerobic terminal oxidases, expression of any isoform conferred the ability to grow using O2, confirming that isoforms containing the orphan N subunits are functional. When preparations from wild-type, stationary-phase P. aeruginosa cells were separated on 2D gels and probed with anti-CcoN4 antibody, this subunit was detected at the same position as the assembled CcoNOP complex, showing that CcoN4-containing heterocomplexes form in vivo. Furthermore, the authors found that the products of ccoN3Q3 and ccoN4Q4 contributed resistance to nitrite and cyanide, respectively, during growth in liquid cultures under low-O2 conditions. While these results provide insight into contributions of the cbb3 heterocomplexes to growth in liquid cultures, potential roles for N3- and N4-containing isoforms in biofilm growth and pathogenicity have yet to be explored.
The biofilm lifestyle—in which cells grow in a dense community encased in a self-produced matrix—has been linked to the establishment and persistence of infections in diverse systems (Edwards and Kjellerup, 2012; Rybtke et al., 2015). Biofilm development promotes the formation of O2 gradients such that cells at a distance from the biofilm surface are subjected to hypoxic or anoxic conditions (Werner et al., 2004). Using a colony morphology assay to study redox metabolism and its relationship to community behavior, we have shown that O2 limitation for cells in biofilms leads to an imbalance in the intracellular redox state. This can be relieved by a change in community morphology, which increases the surface area-to-volume ratio of the biofilm and therefore access to O2 for resident cells (Kempes et al., 2014). For P. aeruginosa cells in biofilms, the intracellular accumulation of reducing power can also be prevented by production and reduction of endogenous antibiotics called phenazines, which mediate extracellular electron transfer to oxidants available at a distance (Dietrich et al., 2013). We have found that biofilm-specific phenazine production contributes to pathogenicity in a murine model of acute pulmonary infection (Recinos et al., 2012), further illustrating the importance of phenazine-mediated redox balancing for P. aeruginosa cells in communities.
Because of the formation of an O2 gradient inherent to the biofilm lifestyle, we hypothesized that the differential regulation of the P. aeruginosa cco operons affects their contributions to metabolic electron flow in biofilm subzones. We evaluated the roles of various cbb3-type oxidase isoforms in multicellular behavior and virulence. Our results indicate that isoforms containing the orphan subunit CcoN4 can support survival in biofilms via O2 and phenazine reduction and contribute to P. aeruginosa pathogenicity in a Caenorhabditis elegans ‘slow killing’ model of infection.
Results
A small minority of bacterial genomes encode cbb3-type oxidase subunits in partial (‘orphan’) operons
Biochemical, genetic, and genomic analyses suggest that the CcoN and CcoO subunits, typically encoded by an operon, form the minimal functional unit of cbb3-type oxidases (Ducluzeau et al., 2008; de Gier et al., 1996; Zufferey et al., 1996). CcoN is the membrane-integrated catalytic subunit and contains two b-type hemes and a copper ion. CcoO is membrane-anchored and contains one c-type heme. Additional redox subunits and/or subunits implicated in complex assembly, such as CcoQ and CcoP, can be encoded by adjacent genes (Figure 1B). ccoNO-containing clusters are widely distributed across phyla of the bacterial domain (Ducluzeau et al., 2008). We used the EggNOG database, which contains representative genomes for more than 3000 bacterial species (Huerta-Cepas et al., 2016) to obtain an overview of the presence and frequency of cco genes. Out of 3318 queried bacterial genomes, we found 467 with full cco operons (encoding potentially functional cbb3-type oxidases with O and N subunits). Among these, 78 contain more than one full operon. We also used EggNOG to look for orphan ccoN genes by examining the relative numbers of ccoO and ccoN homologs in individual genomes. We found 14 genomes, among which Pseudomonas species are overrepresented, that contain orphan ccoN genes (Figure 1C), and our analysis yielded three species that contain more than one orphan ccoN gene: Pseudomonas mendocina, Pseudomonas aeruginosa, and Achromobacter xylosoxidans. P. mendocina is a soil bacterium and occasional nosocomial pathogen that is closely related to P. aeruginosa, based on 16S rRNA gene sequence comparison (Anzai et al., 2000). A. xylosoxidans, in contrast, is a member of a different proteobacterial class but nevertheless is often mistaken for P. aeruginosa (Saiman et al., 2001). Like P. aeruginosa, it is an opportunistic pathogen that can cause pulmonary infections in immunocompromised individuals and patients with cystic fibrosis (De Baets et al., 2007; Firmida et al., 2016). Hirai et al. previously reported a ClustalW-based analysis of CcoN homologs specifically from pseudomonads, which indicated the presence of orphan genes in additional species not represented in the EggNOG database. These include P. denitrificans, which contains two orphan genes (Hirai et al., 2016).
CcoN4-containing isoforms function specifically in biofilms to support community morphogenesis and respiration
During growth in a biofilm, subpopulations of cells are subjected to regimes of electron donor and O2 availability that may create unique metabolic demands and require modulation of the respiratory chain for survival (Alvarez-Ortega and Harwood, 2007; Borriello et al., 2004; Werner et al., 2004). We therefore investigated the contributions of individual cco genes and gene clusters to P. aeruginosa PA14 biofilm development using a colony morphology assay, which has demonstrated sensitivity to electron acceptor availability and utilization (Dietrich et al., 2013). Because the Cco1 and Cco2 complexes are the most important cytochrome oxidases for growth of P. aeruginosa in fully aerated and O2-limited liquid cultures (Alvarez-Ortega and Harwood, 2007; Arai et al., 2014), we predicted that mutations disabling the functions of Cco1 and Cco2 would affect colony growth. Indeed, a mutant lacking both the cco1 and cco2 operons (‘∆cco1cco2’) produced thin biofilms with a smaller diameter than the wild type. After 5 days of development, this mutant displayed a dramatic phenotype consisting of a tall central ring feature surrounded by short ridges that emanate radially (Figure 2A, Figure 2—figure supplement 1A). ∆cco1cco2 colonies were also darker in color, indicating increased uptake of the dye Congo red, which binds to the extracellular matrix produced by biofilms (Friedman and Kolter, 2004). Surprisingly, a strain specifically lacking the catalytic subunits of Cco1 and Cco2 (‘∆N1∆N2’), while showing a growth defect similar to that of ∆cco1cco2 when grown in liquid culture (Figure 2C), showed biofilm development that was similar to that of the wild type (Figure 2A, Figure 2—figure supplement 1A).
Figure 2 with 4 supplements see all
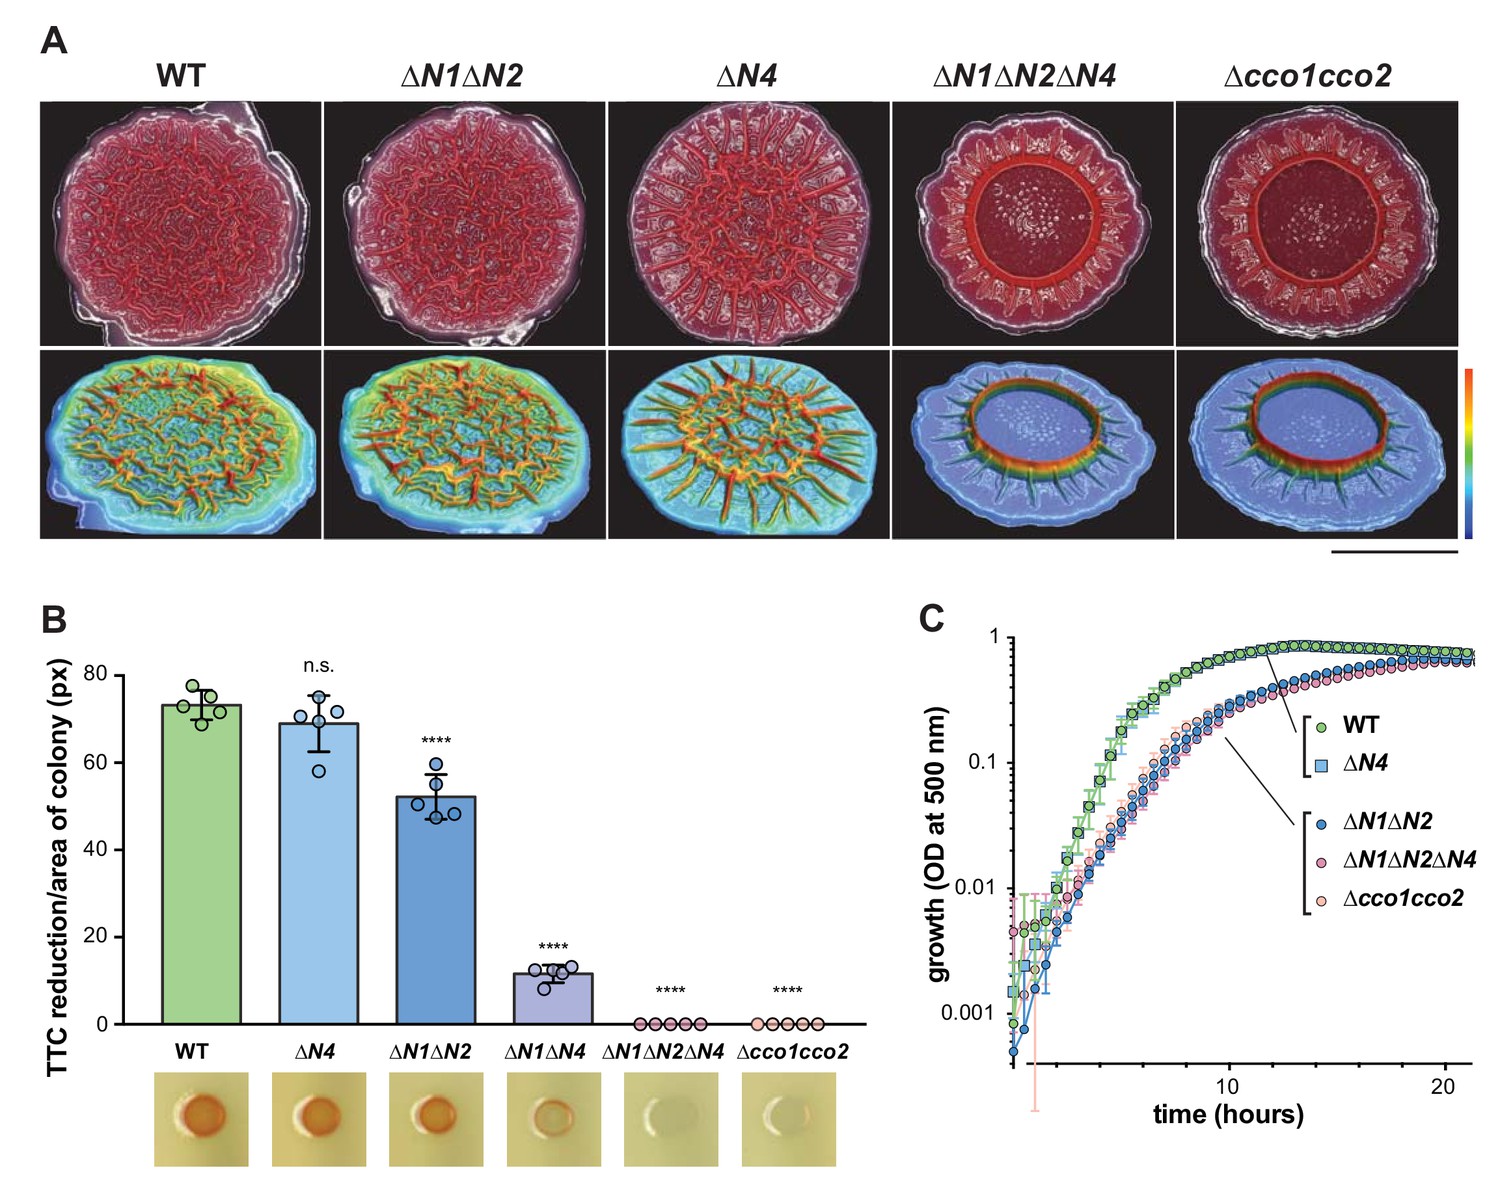
CcoN4-containing heterocomplexes make biofilm-specific contributions to morphogenesis and respiration.
(A) Top: Five-day-old colony biofilms of PA14 WT and cco mutant strains. Biofilm morphologies are representative of more than 10 biological replicates. Images were generated using a digital microscope. Scale bar is 1 cm. Bottom: 3D surface images of the biofilms shown in the top panel. Images were generated using a wide-area 3D measurement system. Height scale bar: bottom (blue) to top (red) is 0–0.7 mm for WT, ∆N1∆N2, and ∆N4; 0–1.5 mm for ∆N1∆N2∆N4 and ∆cco1cco2. (B) TTC reduction by WT and cco mutant colonies after 1 day of growth. Upon reduction, TTC undergoes an irreversible color change from colorless to red. Bars represent the average, and error bars represent the standard deviation, of individually-plotted biological replicates (n = 5). p-Values were calculated using unpaired, two-tailed t tests comparing each mutant to WT (****p≤0.0001). (C) Mean growth of PA14 WT and cco mutant strains in MOPS defined medium with 20 mM succinate. Error bars represent the standard deviation of biological triplicates.
As it is known that CcoN3 and CcoN4 can form functional complexes with subunits of the Cco1 and Cco2 oxidases in P. aeruginosa PAO1 (Hirai et al., 2016), this led us to hypothesize that Cco isoforms containing the orphan subunits CcoN3 and/or CcoN4 could substitute for Cco1 and Cco2 in the biofilm context. Deleting ccoN3 (‘∆N3’ or ‘∆N1∆N2∆N3’) did not have an observable effect on biofilm development when mutants were compared to respective parent strains (Figure 2—figure supplement 1A). However, the phenotype of a ‘∆N1∆N2∆N4’ mutant was consistent with our model, as it mimicked that of the ∆cco1cco2 mutant in both liquid-culture and biofilm growth (Figure 2A and C, Figure 2—figure supplement 1A). Furthermore, we found that a mutant lacking only ccoN4 (‘∆N4’) displayed an altered phenotype in that it began to form wrinkle structures earlier than the wild type (Figure 2—figure supplement 1A), which developed into a disordered region of wrinkles inside a central ring, surrounded by long, radially emanating ridges (Figure 2A). Reintroduction of the ccoN4 gene into either of these strains restored the phenotypes of the respective parent strains (Figure 2—figure supplement 1A). Deletion of either ccoN2 or ccoN3 in the ∆N4 background did not exacerbate the colony phenotype seen in ∆N4 alone. However, the ‘∆N1∆N4’ double mutant showed an intermediate phenotype relative to ∆N4 and ∆N1∆N2∆N4 (Figure 2—figure supplement 1B), suggesting some functional redundancy for CcoN1 and CcoN4. The developmental pattern of the ∆N4 colony is reminiscent of those displayed by mutants defective in phenazine production and sensing (Figure 2—figure supplement 1A) (Dietrich et al., 2008; 2013; Sakhtah et al., 2016; Okegbe et al., 2017). Although ∆N4 itself showed a unique phenotype in the colony morphology assay, its growth in shaken liquid cultures was indistinguishable from that of the wild type (Figure 2C). Finally, deleting the three non-cbb3-type terminal oxidases (‘∆cox∆cyo∆cio’), did not affect biofilm morphology (Figure 2—figure supplement 2C). These results suggest that CcoN4-containing Cco isoforms play physiological roles that are specific to the growth conditions encountered in biofilms.
Next, we asked whether CcoN4 contributes to respiration in biofilms. We tested a suite of cco mutants for reduction of triphenyl tetrazolium chloride (TTC), an activity that is associated with cytochrome c oxidase-dependent respiration (Rich et al., 2001). The ∆cco1cco2 mutant showed a severe defect in TTC reduction, which was recapitulated by the ∆N1∆N2∆N4 mutant. As in the colony morphology assay, this extreme phenotype was not recapitulated in a mutant lacking only CcoN1 and CcoN2, indicating that CcoN4 contributes to respiratory activity in PA14 biofilms. Although we did not detect a defect in TTC reduction for the ∆N4 mutant, we saw an intermediate level of TTC reduction for ∆N1∆N4 compared to ∆N1∆N2 and ∆N1∆N2∆N4, further implicating the CcoN4 subunit in this activity (Figure 2B).
A recent study demonstrated a role for CcoN4 in resistance to cyanide, a respiratory toxin that is produced by P. aeruginosa (Hirai et al., 2016). The altered biofilm phenotypes of ∆N4 mutants could therefore be attributed to an increased sensitivity to cyanide produced during biofilm growth. We deleted the hcn operon, coding for cyanide biosynthetic enzymes, in wild-type, phenazine-null (∆phz), and various cco mutant backgrounds. The biofilm morphologies and liquid-culture growth of these strains were unaffected by the ∆hcnABC mutation, indicating that the biofilm-specific role of CcoN4 explored in this work is independent of its role in mediating cyanide resistance (Figure 2—figure supplement 2). Additionally, we examined genomes available in the Pseudomonas Genome Database for the presence of homologs encoding CcoN subunits (ccoN genes) and enzymes for cyanide synthesis (hcnABC) (Winsor et al., 2016) and did not find a clear correlation between the presence of hcnABC and ccoN4 homologs (Figure 2—figure supplement 3).
Together, the effects of cco gene mutations that we observed in assays for colony morphogenesis and TTC reduction suggest that one or more CcoN4-containing Cco isoform(s) support respiration and redox balancing, and is/are utilized preferentially in comparison to CcoN1- and CcoN2-containing Cco complexes, in biofilms. We performed a sequence alignment of the CcoN subunits encoded by the PA14 genome and identified residues that are unique to CcoN4 or shared uniquely between CcoN4 and CcoN1, which showed the strongest functional redundancy with CcoN4 in our assays (Figure 2—figure supplement 4A). We also threaded the CcoN4 sequence using the available structure of the CcoN subunit from P. stutzeri (Buschmann et al., 2010) and highlighted these residues (Figure 2—figure supplement 4B). It is noteworthy that most of the highlighted residues are surface-exposed, specifically on one half of the predicted CcoN4 structure, where they may engage in binding an unknown protein partner or specific lipids. In contrast, sites that have been described as points of interaction with CcoO and CcoP are mostly conserved, further supporting the notion that CcoN4 can interact with these subunits in Cco complexes.
Different CcoN subunits are required for competitive fitness in early or late colony development
To further test CcoN4’s contribution to growth in biofilms, we performed competition assays in which ∆N4 and other mutants were grown as mixed-strain biofilms with the wild type. In each of these assays, one strain was labeled with constitutively expressed YFP so that the strains could be distinguished during enumeration of colony-forming units (CFUs). Experiments were performed with the label on each strain to confirm that YFP expression did not affect fitness (Figure 3—figure supplement 1A,B). When competitive fitness was assessed after 3 days of colony growth (Figure 3A), ∆N4 cells showed a disadvantage, with the wild type outcompeting ∆N4 by a factor of two. This was similar to the disadvantage observed for the ∆N1∆N2 mutant, further suggesting that the orphan subunit CcoN4 plays a significant role in biofilm metabolism. Remarkably, deletion of ccoN4 in mutants already lacking ccoN1 and ccoN2 led to a drastic decrease in fitness, with the wild type outcompeting ∆N1∆N2∆N4 by a factor of 16. This disadvantage was comparable to that observed for the mutant lacking the full cco operons (∆cco1cco2), underscoring the importance of CcoN4-containing isoforms during biofilm growth.
Figure 3 with 1 supplement see all

CcoN4 confers a competitive advantage in biofilms, particularly when O2 becomes limiting.
(A) Relative fitness of various YFP-labeled cco mutants when co-cultured with WT in mixed-strain biofilms for 3 days. Error bars represent the standard deviation of biological triplicates. p-Values were calculated using unpaired, two-tailed t tests (**p≤0.01; ***p≤0.001; ****p≤0.0001). (B) Time course showing relative fitness, over a period of 3 days, of various cco mutants when co-cultured with WT in mixed-strain biofilms. Results are shown for experiments in which the WT was co-cultured with various ‘labeled’ strains, that is, those that were engineered to constitutively express YFP. (See Figure 3—figure supplement 1 for results from experiments in which the labeled WT was co-cultured with unlabeled mutants.) Error bars represent the standard deviation of biological triplicates. (C) Change in thickness over 3 days of development for colony biofilms of WT and ∆phz as assessed by thin sectioning and DIC microscopy. After the onset of wrinkling, thickness was determined for the base (i.e. the ‘valley’ between wrinkles). Error bars represent the standard deviation of biological triplicates. (D) O2 profiles of colonies at selected timepoints within the first 3 days of biofilm development. Gray point markers indicate measurements made in the agar directly below the colony. Error bars denote standard deviation of biological triplicates.
To further explore the temporal dynamics of N subunit utilization, we repeated the competition assay, but sampled each day over the course of 3 days (Figure 3B). The fitness disadvantage that we had found for strains lacking CcoN1 and CcoN2 was evident after only 1 day of growth and did not significantly change after that. In contrast, the ∆N4-specific decline in fitness did not occur before the second day. These data suggest that the contributions of the various N subunits to biofilm metabolism differ depending on developmental stage.
DIC imaging of thin sections from wild-type colonies reveals morphological variation over depth that may result from decreasing O2 availability (Figure 3—figure supplement 1C). We have previously reported that 3-day-old PA14 colony biofilms are hypoxic at depth (Dietrich et al., 2013) and that O2 availability is generally higher in thinner biofilms, such as those formed by the phenazine-null mutant ∆phz. We have proposed that the utilization of phenazines as electron acceptors in wild-type biofilms enables cellular survival in the hypoxic zone and promotes colony growth (Okegbe et al., 2014). The relatively late-onset phenotype of the ∆N4 mutant in the competition assay suggested to us that CcoN4 may play a role in survival during formation of the hypoxic colony subzone and that this zone could arise at a point between 1 and 2 days of colony growth. We measured O2 concentrations in wild-type and ∆phz biofilms at specific time points over development, and found that O2 declined similarly with depth in both strains (Figure 3D). The rate of increase in height of ∆phz tapered off when a hypoxic zone began to form, consistent with the notion that the base does not increase in thickness when electron acceptors (O2 or phenazines) are not available. Although we cannot pinpoint the exact depth at which the O2 microsensor leaves the colony base and enters the underlying agar, we can estimate these values based on colony thickness measurements (Figure 3C). When we measured the thickness of wild-type and ∆phz biofilms over 3 days of incubation, we found that the values began to diverge between 30 and 48 hr of growth, after the colonies reached ~70 µm in height, which coincides with the depth at which O2 becomes undetectable. ∆phz colonies reached a maximum thickness of ~80 µm, while wild-type colonies continued to grow to ~150 µm (Figure 3C). In this context, it is interesting to note that the point of divergence for the increase in wild-type and ∆phz colony thickness—between 30 and 48 hr—corresponds to the point at which CcoN4 becomes important for cell viability in our mixed-strain colony growth experiments (Figure 3B). We hypothesize that this threshold thickness leads to a level of O2 limitation that is physiologically relevant for the roles of phenazines and CcoN4 in biofilm metabolism.
cco genes show differential expression across biofilm subzones
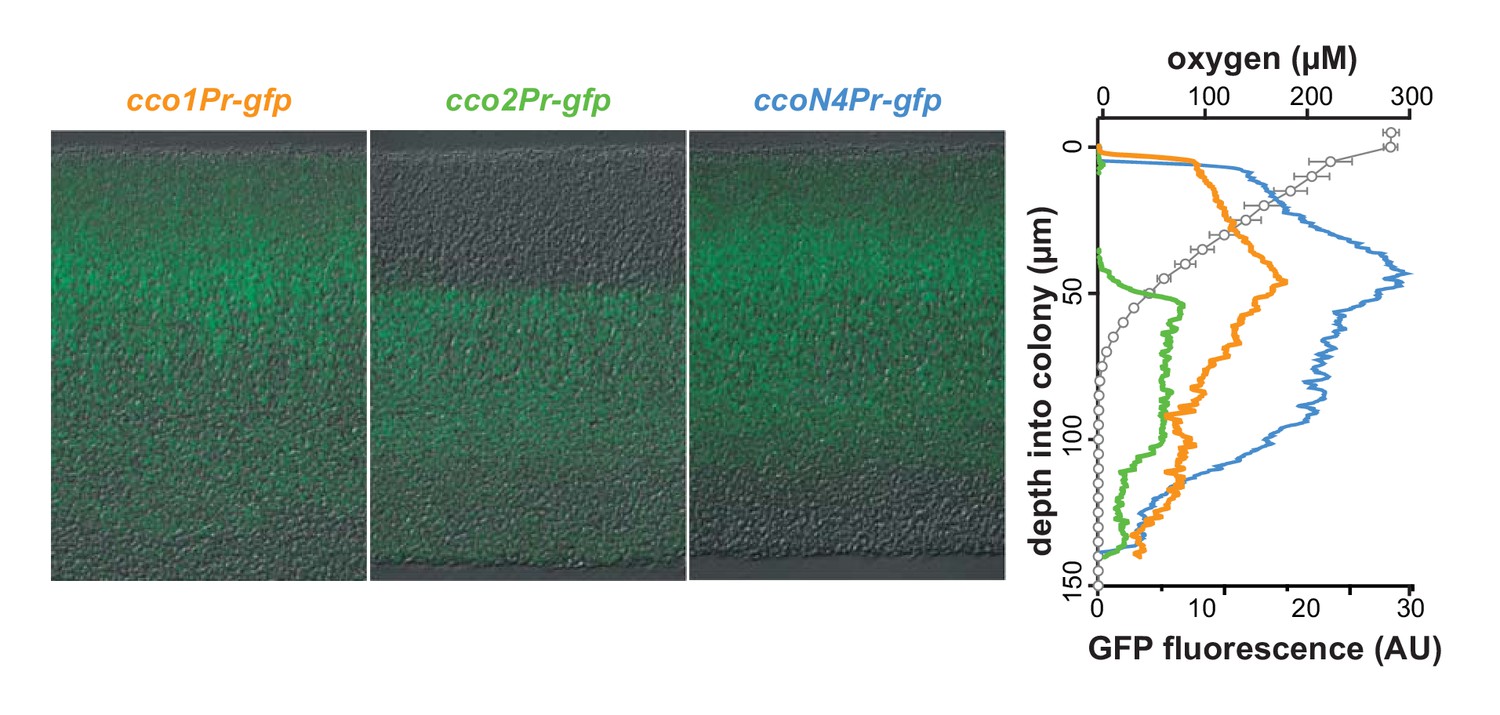
P. aeruginosa’s five canonical terminal oxidases are optimized to function under and in response to distinct environmental conditions, including various levels of O2 availability (Arai et al., 2014; Kawakami et al., 2010; Alvarez-Ortega and Harwood, 2007; Comolli and Donohue, 2004). Furthermore, recent studies, along with our results, suggest that even within the Cco terminal oxidase complexes, the various N subunits may perform different functions (Hirai et al., 2016). We sought to determine whether differential regulation of cco genes could lead to uneven expression across biofilm subzones. To test this, we engineered reporter strains in which GFP expression is regulated by the cco1, cco2, or ccoN4Q4 promoters. Biofilms of these strains were grown for 3 days, thin-sectioned, and imaged by fluorescence microscopy. Representative results are shown in the left panel of Figure 4. The right panel of Figure 4 contains plotted GFP signal intensity and O2 concentration measurements over depth for PA14 wild-type colonies. cco1 and ccoN4 expression patterns indicate that the Cco1 oxidase and the CcoN4 subunit are produced throughout the biofilm (Figure 4). cco2 expression, on the other hand, is relatively low in the top portion of the biofilm and shows a sharp induction starting at a depth of ~45 µm. This observation is consistent with previous studies showing that cco2 expression is regulated by Anr, a global transcription factor that controls gene expression in response to a shift from oxic to anoxic conditions (Comolli and Donohue, 2004; Kawakami et al., 2010; Ray and Williams, 1997).
Figure 4 with 1 supplement see all
cco genes are differentially expressed over biofilm depth.
Left: Representative images of thin sections prepared from WT biofilms grown for 3 days. Each biofilm is expressing a translational GFP reporter under the control of the cco1, cco2, or ccoN4Q4 promoter. Reporter fluorescence is shown in green and overlain on respective DIC images. Right: Fluorescence values corresponding to images on the left. Fluorescence values for a strain containing the gfp gene without a promoter (the empty MCS control) have been subtracted from each respective plot. O2 concentration over depth (open circles) from 3-day-old WT biofilms is also shown. Error bars represent the standard deviation of biological triplicates and are not shown in cases where they would be obscured by the point markers. y-axis in the right panel provides a scale bar for the left panel. Reporter fluorescence images and values are representative of 4 biological replicates.
Although previous studies have evaluated expression as a function of growth phase in shaken liquid cultures for cco1 and cco2, this property has not been examined for ccoN4Q4. We monitored the fluorescence of our engineered cco gene reporter strains during growth under this condition in a nutrient-rich medium. As expected based on the known constitutive expression of cco1 and Anr-dependence of cco2 induction, we saw cco1-associated fluorescence increase before that associated with cco2. Induction of ccoN4Q4 occurred after that of cco1 and cco2 (Figure 4—figure supplement 1), consistent with microarray data showing that this locus is strongly induced by O2 limitation (Alvarez-Ortega and Harwood, 2007). However, our observation that ccoN4Q4 is expressed in the aerobic zone, where cco2 is not expressed, in biofilms (Figure 4) suggests that an Anr-independent mechanism functions to induce this operon during multicellular growth.
Our results indicate that different Cco isoforms may function in specific biofilm subzones, but that CcoN4-containing isoforms could potentially form throughout the biofilm. These data, together with our observation that ∆N4 biofilms exhibit a fitness disadvantage from day 2 (Figure 3B), led us to more closely examine the development and chemical characteristics of the biofilm over depth.
Microelectrode-based redox profiling reveals differential phenazine reduction activity in wild-type and cco mutant biofilms
The results shown in Figure 2B implicate CcoN4-containing isoforms in the reduction of TTC, a small molecule that interacts with the respiratory chain (Rich et al., 2001). Similar activities have been demonstrated for phenazines, including the synthetic compound phenazine methosulfate (PMS) (Nachlas et al., 1960) and those produced naturally by P. aeruginosa (Armstrong and Stewart-Tull, 1971). Given that CcoN4 and phenazines function to influence morphogenesis at similar stages of biofilm growth (Figures 2A and 3, Figure 2—figure supplement 1, Figure 3—figure supplement 1A,B), we wondered whether the role of CcoN4 in biofilm development was linked to phenazine metabolism. We used a Unisense platinum microelectrode with a 20–30 µm tip to measure the extracellular redox potential in biofilms as a function of depth. This electrode measures the inclination of the sample to donate or accept electrons relative to a Ag/AgCl reference electrode. We found that wild-type colonies showed a decrease in redox potential over depth, indicating an increased ratio of reduced to oxidized phenazines, while the redox potential of ∆phz colonies remained unchanged (Figure 5A). To confirm that phenazines are the primary determinant of the measured redox potential in the wild type, we grew ∆phz colonies on medium containing PMS (which resembles the natural phenazines that regulate P. aeruginosa colony morphogenesis [Sakhtah et al., 2016]) and found that these colonies yielded redox profiles similar to those of the wild type (Figure 5—figure supplement 1A). Therefore, although the microelectrode we employed is capable of interacting with many redox-active substrates, we found that its signal was primarily determined by phenazines in our system. In addition, while wild-type colonies showed rapid decreases in O2 availability starting at the surface, the strongest decrease in redox potential was detected after ~50 µm (Figure 5A). These results suggest that the bacteria residing in the biofilm differentially utilize O2 and phenazines depending on their position and that O2 is the preferred electron acceptor.
Figure 5 with 1 supplement see all

Characterization of chemical gradients and matrix distribution in PA14 WT and mutant colony biofilms.
(A) Left: Change in O2 concentration (blue) and redox potential (orange) with depth for WT and ∆phz biofilms grown for two days. WT biofilms are ~150 µm thick while ∆phz biofilms are ~80 µm thick. For O2 profiles, error bars represent the standard deviation of biological triplicates. For redox profiles, data are representative of at least 5 biological replicates. Right: model depicting the distribution of O2 and reduced vs. oxidized phenazines in biofilms. (B) Top: Change in redox potential with depth for WT and various mutant biofilms grown for 2 days. Data are representative of at least 5 biological replicates. Bottom: Thickness of 3-day-old colony biofilms of the indicated strains. Bars represent the average of the plotted data points (each point representing a biological replicate, n ≥ 4), and error bars represent the standard deviation. p-Values were calculated using unpaired, two-tailed t tests comparing each mutant to WT (n.s., not significant; **p≤0.01; ****p≤0.0001). (C) Left: Representative thin sections of WT and cco mutant biofilms, stained with lectin and imaged by fluorescence microscopy. Biofilms were grown for 2 days before sampling. Right: Relative quantification of lectin stain signal intensity. Coloration of strain names in the left panel provides a key for the plotted data, and the y-axis in the right panel provides a scale bar for the left panel. Lectin-staining images and values are representative of 4 biological replicates.
We hypothesized that one or more of the CcoN subunits encoded by the PA14 genome is required for phenazine reduction and tested this by measuring the redox potential over depth for a series of cco mutants (Figure 5B, top). We saw very little reduction of phenazines in the ∆cco1cco2 colony, suggesting that cbb3-type oxidases are required for this activity. In contrast, the mutant lacking the catalytic subunits of Cco1 and Cco2, ∆N1∆N2, showed a redox profile similar to the wild type, indicating that isoforms containing one or both of the orphan CcoN subunits could support phenazine reduction activity. Indeed, although redox profiles obtained for the ∆N1∆N2 and ∆N4 mutants were similar to those obtained for the wild type, the redox profile of the ∆N1∆N2∆N4 mutant recapitulated that of ∆cco1cco2. These results indicate redundancy in the roles of some of the CcoN subunits. Consistent with this, ∆N1∆N4 showed an intermediate defect in phenazine reduction. We note that the triple mutant ∆cox∆cyo∆cio showed a wild-type-like redox profile, indicating that the cbb3-type terminal oxidases are sufficient for normal phenazine reduction (Figure 5—figure supplement 1B). Extraction and measurement of phenazines released from wild-type and cco mutant biofilms showed that variations in redox profiles could not be attributed to differences in phenazine production (Figure 5—figure supplement 1C).
Our group has previously shown that a ∆phz mutant compensates for its lack of phenazines by forming thinner colonies, thus limiting the development of the hypoxic subzone seen in the wild type (Dietrich et al., 2013). We therefore hypothesized that mutants unable to reduce phenazines would likewise result in thinner colonies. Indeed, we observed that the cco mutants that lacked phenazine reduction profiles in the top panel of Figure 5B produced biofilms that were significantly thinner than wild-type and comparable to that of the ∆phz mutant (Figure 5B, bottom).
Our group has also reported that reduction of nitrate, an alternate electron acceptor for P. aeruginosa (Williams et al., 2007), can serve as an additional redox-balancing strategy for cells in biofilms (Dietrich et al., 2013). Colony wrinkling is stimulated by a reduced cellular redox state; thus, provision of nitrate in the growth medium inhibits colony feature formation. We hypothesized that nitrate reduction could compensate for defects in O2 and phenazine reduction and inhibit colony wrinkling in the cco mutants that are the focus of this study. To test this, we grew strains on medium containing 10 or 40 mM potassium nitrate. We found that 10 mM nitrate was sufficient to inhibit wrinkling for up to 4 days of incubation in the wild type, ∆N4, and ∆N1∆N4, but that ∆phz and ∆N1∆N2∆N4 had initiated wrinkling at this point (Figure 5—figure supplement 1D). When we grew these strains on medium containing 40 mM nitrate, we saw increased inhibition of wrinkling such that the wild type, ∆phz, ∆N4, and ∆N1∆N4 remained completely smooth at 4 days of incubation. Although ∆N1∆N2∆N4 had shown some feature formation after 4 days on this medium, it was diminished relative to the same point on 10 mM nitrate. These results suggest that O2 reduction, phenazine reduction, and nitrate reduction can operate in synchrony to oxidize the redox states of cells in biofilms and that provision of nitrate can compensate for defects in O2 and phenazine reduction to enable maintenance of redox homeostasis.
Wild-type and cco mutant colony biofilms show increased matrix production at comparable depths
We have recently demonstrated that extracellular matrix production, a hallmark of biofilm formation, is regulated by redox state in PA14 colony biofilms. Increased matrix production correlates with the accumulation of reducing power (as indicated by higher cellular NADH/NAD+ ratios) due to electron acceptor limitation and is visible in the hypoxic region of ∆phz colonies (Dietrich et al., 2013; Okegbe et al., 2017). The morphologies of our cco mutants (Figure 2A) suggest that matrix production can also be induced by respiratory chain dysfunction, which may be linked to defects in phenazine utilization (Figure 5B). To further examine the relationships between Cco isoforms and redox imbalance in biofilms, we prepared thin sections from 2-day-old colonies and stained with fluorescein-labeled lectin, which binds preferentially to the Pel polysaccharide component of the matrix (Jennings et al., 2015). Consistent with their similar gross morphologies, the wild-type and ∆N1∆N2 biofilms showed similar patterns of staining, with a faint band of higher intensity at a depth of ~40 µm (Figure 5C). ∆N4 also showed a similar pattern, with a slightly higher intensity of staining in this band. ∆N1∆N2∆N4 and ∆cco1cco2 showed more staining throughout each sample, with wider bands of greater intensity at the ~40 µm point. These data suggest that deletion of the Cco complexes leads to a more reduced cellular redox state, which induces production of more matrix, and that CcoN4 contributes significantly to maintaining redox homeostasis when O2 is limiting.
CcoN4 contributes to P. aeruginosa virulence in a C. elegans slow killing model
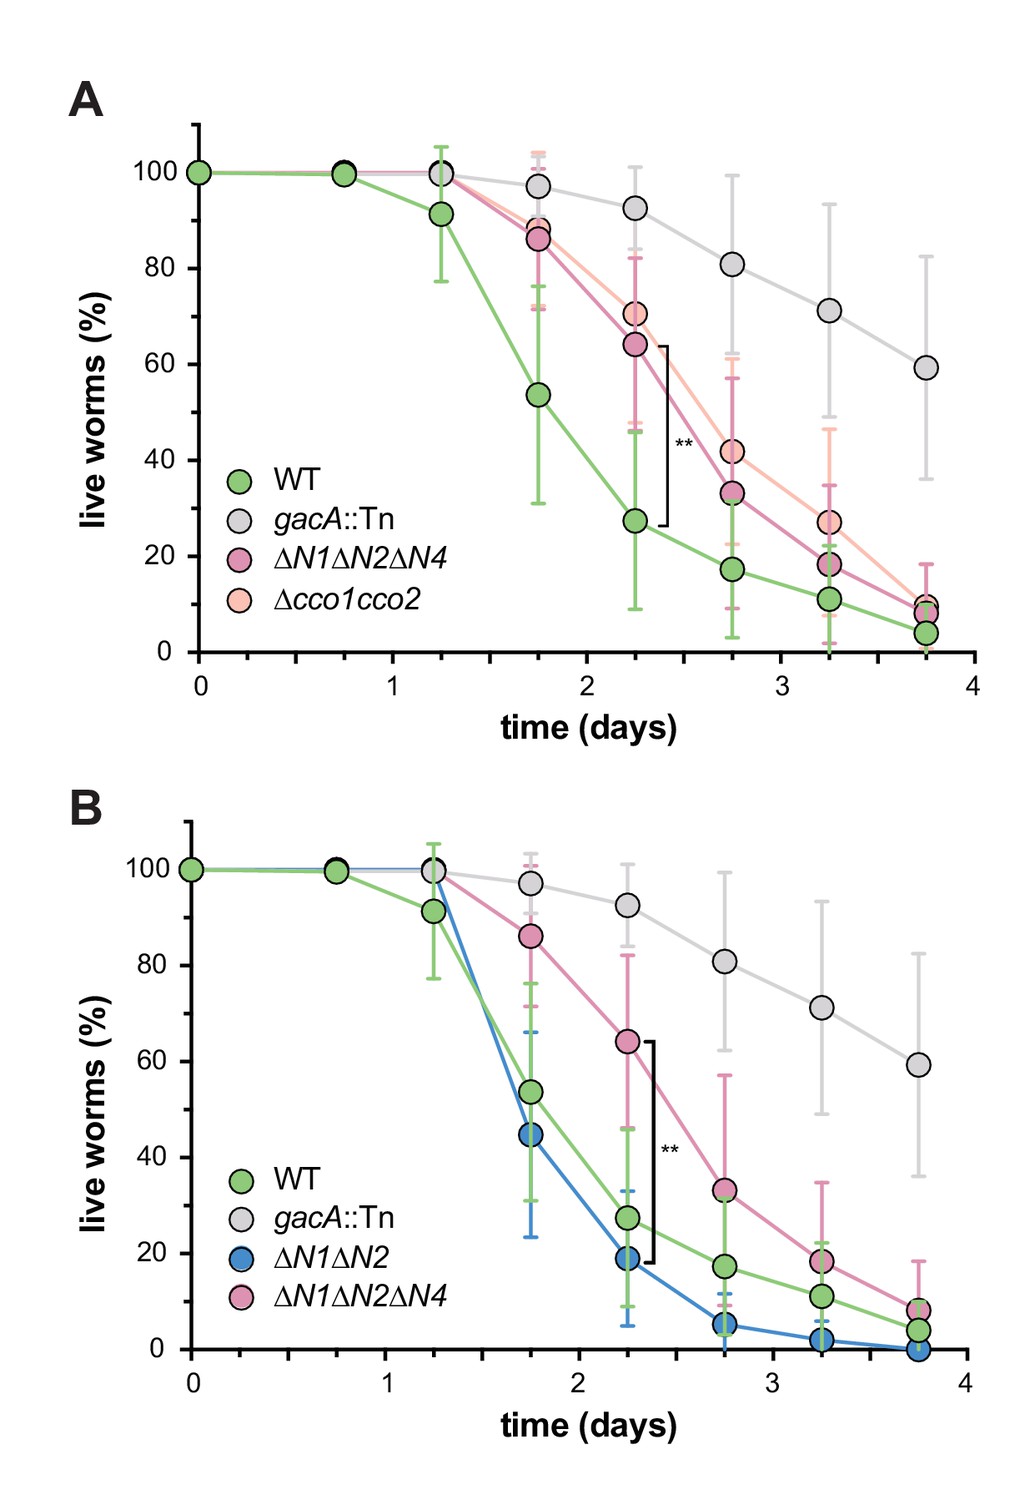
We have previously shown that a mutant defective in biofilm-specific phenazine production, which also shows altered colony morphology (Dietrich et al., 2008; 2013), exhibits decreased virulence (Recinos et al., 2012). We and others have suggested that one way in which phenazines could contribute to virulence is by acting as electron acceptors to balance the intracellular redox state in the hypoxic conditions that are encountered during infection (Price-Whelan et al., 2006; Newman, 2008; Dietrich et al., 2013). Because CcoN4 is required for wild-type biofilm architecture and respiration (Figures 2A, C and 5C), we hypothesized that it could also contribute to virulence. To test this, we conducted virulence assays using the nematode Caenorhabditis elegans as a host. It has been shown that P. aeruginosa is pathogenic to C. elegans and that the slow killing assay mimics an infection-like killing of C. elegans by the bacterium (Tan et al., 1999). While ∆N1∆N2 killed with wild-type-like kinetics, ∆N1∆N2∆N4 and ∆cco1cco2 showed comparably-impaired killing relative to wild-type PA14 (Figure 6).
Figure 6
CcoN4-containing isoform(s) make unique contributions to PA14 virulence.
Slow-killing kinetics of WT, gacA, and various cco mutant strains in the nematode Caenorhabditis elegans. Nearly 100% of the C. elegans population exposed to WT PA14 is killed after 4 days of exposure to the bacterium, while a mutant lacking GacA, a regulator that controls expression of virulence genes in P. aeruginosa, shows decreased killing, with ~50% of worms alive 4 days post-exposure. (A) ∆N1∆N2∆N4 and ∆cco1cco2 show comparably attenuated pathogenicity relative to WT. Error bars represent the standard deviation of at least 6 biological replicates. At 2.25 days post-exposure, significantly less C. elegans were killed by ∆N1∆N2∆N4 than by WT (unpaired two-tailed t test; p=0.0022). (B) ∆N1∆N2 displays only slightly reduced pathogenicity when compared to WT. At 2.25 days post-exposure, significantly more C. elegans were killed by ∆N1∆N2 than by ∆N1∆N2∆N4 (unpaired two-tailed t test; p=0.003). Error bars represent the standard deviation of at least 4 biological replicates, each with a starting sample size of 30–35 worms per replicate.
Discussion
Biofilm formation contributes to P. aeruginosa pathogenicity and persistence during different types of infections, including the chronic lung colonizations seen in individuals with cystic fibrosis (Tolker-Nielsen, 2014; Rybtke et al., 2015). The conditions found within biofilm microenvironments are distinct from those in well-mixed liquid cultures with respect to availability of electron donors and acceptors. We have previously described the roles of phenazines, electron-shuttling antibiotics produced by P. aeruginosa, in biofilm-specific metabolism. In this study, we focused on P. aeruginosa’s large complement of genes encoding cbb3-type cytochrome oxidase subunits and set out to test their contributions to metabolic electron flow in biofilms.
The P. aeruginosa genome contains four different homologs of ccoN, encoding the catalytic subunit of cbb3-type oxidase. Only two of these (ccoN1 and ccoN2) are co-transcribed with a ccoO homolog, encoding the other critical component of an active cbb3-type oxidase (Figure 1B). However, genetic studies have demonstrated that all four versions of CcoN can form functional complexes when expressed with either of the two CcoO homologs (Hirai et al., 2016). In well-mixed liquid cultures, mutants lacking the ‘orphan’ subunits did not show growth defects (Figure 2C) (Hirai et al., 2016). We were therefore surprised to find that the ∆N4 mutant showed a unique morphotype in a colony biofilm assay (Figure 2A, Figure 2—figure supplement 1A). We have applied this assay extensively in our studies of the mechanisms underlying cellular redox balancing and sensing and noted that the phenotype of ∆N4 was similar to that of mutants with defects in electron shuttling and redox signaling (Dietrich et al., 2013; Okegbe et al., 2017).
We characterized the effects of a ∆N4 mutation on biofilm physiology through a series of assays. In well-mixed liquid cultures, ∆cco1cco2 showed a growth phenotype similar to that of ∆N1∆N2. While Hirai et al. have shown that wild-type P. aeruginosa cultures grown planktonically do form Cco heterocomplexes containing CcoN4, our observations suggest that such complexes do not contribute significantly to growth under these conditions. Consistent with this, deleting ccoN4 in the ∆N1∆N2 background had no effect on planktonic growth (Figure 2C). However, in biofilm-based experiments, we found that deleting N4 alone was sufficient to cause an altered morphology phenotype (Figure 2A and Figure 2—figure supplement 1A), and that deleting N4 in either a ∆N1 or a ∆N1∆N2 background profoundly affected biofilm physiology. These experiments included quantification of respiratory activity in colonies, in which deletion of CcoN4 led to a significant decrease (Figure 2B); biofilm co-culturing, in which CcoN4 was required for competitive fitness (Figure 3A and B, Figure 3—figure supplement 1); redox profiling, which showed that CcoN4 can contribute to phenazine reduction (Figure 5B, top); colony thickness measurements, which showed that CcoN4 is required for the formation of the hypoxic and anoxic zones (Figure 5B, bottom); and matrix profiling, which showed that CcoN4 contributes to the repression of Pel polysaccharide production (Figure 5C). The overlap in zones of expression between cco1, cco2, and ccoN4Q4 seen in colony thin sections (Figure 4) implies that CcoN4 can form heterocomplexes with Cco1 and Cco2 subunits that span the depth of the colony and function to influence the physiology of P. aeruginosa biofilms in these ways.
The mutant phenotypes and gene expression profiles reported in this study suggest roles for CcoN4 in O2 and phenazine reduction specifically in the biofilm context, and allow us to draw conclusions about the roles of other CcoN subunits. The expression of ccoN4Q4 throughout the biofilm depth suggests that CcoN4-containing isoforms could contribute to cytochrome c oxidation in both oxic and hypoxic zones (Figure 4). This constitutes a deviation from the previously published observation that these genes are specifically induced in hypoxic liquid cultures when compared to well-aerated ones (Alvarez-Ortega and Harwood, 2007). Therefore, the ccoN4Q4 expression we observed in the relatively oxic, upper portion of the colony may be specific to biofilms.
∆N4 displayed a colony morphology indicative of redox stress and had a fitness disadvantage compared to the wild type (Figures 2A and 3A,B, Figure 5B, bottom, Figure 3—figure supplement 1). However, because it did not show a defect in phenazine reduction (Figure 5B, top), we attribute its colony morphology and impaired fitness phenotypes to its proposed role in O2 reduction (Hirai et al., 2016). Similarly, ∆N1∆N2 showed reduced fitness compared to the wild type (Figure 3A and B, Figure 3—figure supplement 1) while showing phenazine reduction comparable to that of the wild type (Figure 5B), implying that one or both of these subunits contribute to O2 reduction in biofilms. When CcoN4 was deleted in conjunction with CcoN1 and CcoN2, however, the resulting strain showed a severe phenazine reduction defect, a phenotype recapitulated by deleting both cco operons (Figure 5B). Thus, our observations suggest a role for the cbb3-type oxidases in phenazine reduction in addition to their established roles in O2 reduction, thereby expanding our understanding of their overall contributions P. aeruginosa’s physiology and viability.
The results described here can inform our model of how cells survive under distinct conditions in the microenvironments within biofilms. Previous work has shown that pyruvate fermentation can support survival of P. aeruginosa under anoxic conditions (Eschbach et al., 2004) and that phenazines facilitate this process (Glasser et al., 2014). Additional research suggests that phenazine reduction is catalyzed adventitiously by P. aeruginosa flavoproteins and dehydrogenases (Glasser et al., 2017). Our observation that cbb3-type cytochrome oxidases, particularly those containing the CcoN1 or CcoN4 subunits, were required for phenazine reduction in hypoxic biofilm subzones (Figure 5B) further implicates the electron transport chain in utilization of these compounds. It is also interesting in light of the historical roles of phenazines acting as mediators in biochemical studies of the cytochrome bc1 complex and cytochrome oxidases (King, 1963; Armstrong and Stewart-Tull, 1971; Davidson et al., 1992). Based on this earlier work, we can speculate that different CcoN subunits may indirectly influence phenazine reduction, which could occur at the cytochrome c binding site of the CcoO subunit or elsewhere in the electron transport chain, through effects these CcoN subunits have on the overall function or stability of respiratory complexes. Ultimately, various mechanisms of phenazine reduction and phenazine-related metabolisms may be relevant at different biofilm depths or depending on electron donor availability. Our results suggest that, in the colony biofilm system, enzyme complexes traditionally considered to be specific to O2 reduction may contribute to anaerobic survival.
Because biofilm formation is often associated with colonization of and persistence in hosts, we tested whether CcoN4 contributes to P. aeruginosa pathogenicity in C. elegans. Similar to our observations in biofilm assays, we found that the ∆cco1cco2 mutant displayed a more severe phenotype than the ∆N1∆N2 mutant, suggesting that an orphan subunit can substitute for those encoded by the cco1 and cco2 operons. We also found that deleting ccoN4 in ∆N1∆N2 led to a ∆cco1cco2-like phenotype, suggesting that CcoN4 is the subunit that can play this role (Figure 6). In host microenvironments where O2 is available, CcoN4-containing isoforms could contribute to its reduction. Additionally, in hypoxic zones, CcoN4-containing isoforms could facilitate the reduction of phenazines, enabling cellular redox balancing. Both these functions would contribute to persistence of the bacterium within the host. The contributions of the cbb3-type oxidases to P. aeruginosa pathogenicity raise the possibility that compounds interfering with Cco enzyme function could be effective therapies for these infections. Such drugs would be attractive candidates due to their specificity for bacterial respiratory chains and, as such, would not affect the host’s endogenous respiratory enzymes.
Our discovery that an orphan cbb3-type oxidase subunit contributes to growth in biofilms further expands the scope of P. aeruginosa’s remarkable respiratory flexibility. Beyond modularity at the level of the terminal enzyme complex (e.g. utilization of an aa3- vs. a cbb3-type oxidase), the activity of P. aeruginosa’s respiratory chain is further influenced by substitution of orphan cbb3-type catalytic subunits for native ones. Utilization of CcoN4-containing isoforms promotes phenazine reduction activity and may influence aerobic respiration in P. aeruginosa biofilms. For the exceptional species that contain orphan cbb3-type catalytic subunits, this fine level of control could be particularly advantageous during growth and survival in environments covering a wide range of electron acceptor availability (Cowley et al., 2015).
Materials and methods
Key resource table
| Reagent type (species) or resource | Designation | Source or reference | Identifiers | Additional information |
|---|---|---|---|---|
| strain, strain background (UCBPP-PA14 Pseudomonas aeruginosa) | wild type (WT) | PMID: 7604262 | ||
| strain, strain background (UCBPP-PA14 P. aeruginosa) | ∆phz | PMID: 16879411 | LD24 | |
| strain, strain background (UCBPP-PA14 P. aeruginosa) | ∆ccoN1; ∆N1 | this study | LD1784 | |
| strain, strain background (UCBPP-PA14 P. aeruginosa) | ∆ccoN2; ∆N2 | this study | LD1614 | |
| strain, strain background (UCBPP-PA14 P. aeruginosa) | ∆ccoN3; ∆N3 | this study | LD1620 | |
| strain, strain background (UCBPP-PA14 P. aeruginosa) | ∆ccoN4; ∆N4 | this study | LD2833 | |
| strain, strain background (UCBPP-PA14 P. aeruginosa) | ∆ccoN1∆ccoN2; ∆N1∆N2 | this study | LD1888 | |
| strain, strain background (UCBPP-PA14 P. aeruginosa) | ∆ccoN1∆ccoN4; ∆N1∆N4 | this study | LD1951 | |
| strain, strain background (UCBPP-PA14 P. aeruginosa) | ∆ccoN2∆ccoN4; ∆N2∆N4 | this study | LD1692 | |
| strain, strain background (UCBPP-PA14 P. aeruginosa) | ∆ccoN3∆ccoN4; ∆N3∆N4 | this study | LD1649 | |
| strain, strain background (UCBPP-PA14 P. aeruginosa) | ∆ccoN1∆ccoN2∆ccoN3; ∆N1∆N2∆N3 | this study | LD1977 | |
| strain, strain background (UCBPP-PA14 P. aeruginosa) | ∆ccoN1∆ccoN2∆ccoN4; ∆N1∆N2∆N4 | this study | LD1976 | |
| strain, strain background (UCBPP-PA14 P. aeruginosa) | ∆ccoN1∆ccoN2∆ccoN4 ∆ccoN3; ∆N1∆N2∆N4∆N3 | this study | LD2020 | |
| strain, strain background (UCBPP-PA14 P. aeruginosa) | ∆cco1cco2 | this study | LD1933 | |
| strain, strain background (UCBPP-PA14 P. aeruginosa) | ∆cox∆cyo∆cio | this study | LD2587 | |
| strain, strain background (UCBPP-PA14 P. aeruginosa) | ∆hcn | this study | LD2827 | |
| strain, strain background (UCBPP-PA14 P. aeruginosa) | ∆phz∆hcn | this study | LD2828 | |
| strain, strain background (UCBPP-PA14 P. aeruginosa) | ∆ccoN4∆hcn; ∆N4∆hcn | this study | LD2829 | |
| strain, strain background (UCBPP-PA14 P. aeruginosa) | ∆ccoN1∆ccoN2∆hcn; ∆N1∆N2∆hcn | this study | LD2830 | |
| strain, strain background (UCBPP-PA14 P. aeruginosa) | ∆ccoN1∆ccoN2∆ccoN4 ∆hcn; ∆N1∆N2∆N4∆hcn | this study | LD2831 | |
| strain, strain background (UCBPP-PA14 P. aeruginosa) | ∆cco1cco2∆hcn | this study | LD2832 | |
| strain, strain background (UCBPP-PA14 P. aeruginosa) | gacA::Tn | PMID: 16477005 | LD1560 | |
| strain, strain background (UCBPP-PA14 P. aeruginosa) | ∆ccoN4::ccoN4; ∆N4::N4 | this study | LD1867 | |
| strain, strain background (UCBPP-PA14 P. aeruginosa) | ∆ccoN1∆ccoN2∆ccoN4:: ccoN4; ∆N1∆N2∆N4::N4 | this study | LD2576 | |
| strain, strain background (UCBPP-PA14 P. aeruginosa) | MCS-gfp | this study | LD2820 | |
| strain, strain background (UCBPP-PA14 P. aeruginosa) | Pcco1-gfp; cco1Pr-gfp | this study | LD2784 | |
| strain, strain background (UCBPP-PA14 P. aeruginosa) | Pcco2-gfp; cco2Pr-gfp | this study | LD2786 | |
| strain, strain background (UCBPP-PA14 P. aeruginosa) | PccoN4-gfp; ccoN4Pr-gfp | this study | LD2788 | |
| strain, strain background (UCBPP-PA14 P. aeruginosa) | PA14-yfp | this study | LD2780 | |
| strain, strain background (UCBPP-PA14 P. aeruginosa) | ∆ccoN1∆ccoN2-yfp; ∆N1∆N2-yfp | this study | LD2013 | |
| strain, strain background (UCBPP-PA14 P. aeruginosa) | ∆ccoN4-yfp; ∆N4-yfp | this study | LD2834 | |
| strain, strain background (UCBPP-PA14 P. aeruginosa) | ∆ccoN1∆ccoN2∆cco N4-yfp; ∆N1∆N2∆N4-yfp | this study | LD2136 | |
| strain, strain background (UCBPP-PA14 P. aeruginosa) | ∆cco1cco2-yfp | this study | LD2012 | |
| strain, strain background (Escherichia coli) | UQ950 | other | From D. Lies, Caltech; LD44 | |
| strain, strain background (E. coli) | BW29427 | other | From W. Metcalf, University of Illinois; LD661 | |
| strain, strain background (E. coli) | β2155 | PMID: 8990308 | LD69 | |
| strain, strain background (E. coli) | S17-1 | doi:10.1038/nbt1183-784 | LD2901 | |
| strain, strain background (Saccharomyces cerevisiae) | InvSc1 | Invitrogen | LD676 | |
| recombinant DNA reagent | pMQ30 (plasmid) | PMID: 16820502 | For generation of deletion constructs listed above; further information can be found in the Materials and Methods section. | |
| recombinant DNA reagent | pAKN69 (plasmid) | PMID: 15186351 | For generation of strains constitutively expression eyfp; further information can be found in the Materials and Methods section. | |
| recombinant DNA reagent | pLD2722 (plasmid) | this study | For generation of gfp reporter constructs; further information can be found in the Materials and Methods section. | |
| recombinant DNA reagent | pFLP2 (plasmid) | PMID: 9661666 | For generation of gfp reporter constructs; further information can be found in the Materials and Methods section. | |
| software, algorithm | EggNOG Database | PMID: 26582926 | http://eggnogdb.embl.de/#/app/home | |
| software, algorithm | SensorTrace Profiling | Unisense | For data acquisition for redox and oxygen microprofiling; further information can be found in the Materials and Methods section. | |
| other | Agar | Teknova | For colony morphology assays; further information can be found in the Materials and Methods section. | |
| other | Lectin | Vector Laboratories | For visualization of matrix; further information can be found in the Materials and Methods section. |
Bacterial strains and growth conditions
Request a detailed protocolP. aeruginosa strain UCBPP-PA14 (Rahme et al., 1995) was routinely grown in lysogeny broth (LB; 1% tryptone, 1% NaCl, 0.5% yeast extract) (Bertani, 2004) at 37˚C with shaking at 250 rpm unless otherwise indicated. Overnight cultures were grown for 12–16 hr. For genetic manipulation, strains were typically grown on LB solidified with 1.5% agar. Strains used in this study are listed in Table 1. In general, liquid precultures served as inocula for experiments. Overnight precultures for biological replicates were started from separate clonal source colonies on streaked agar plates. For technical replicates, a single preculture served as the source inoculum for subcultures.
Table 1
Strains used in this study.
https://doi.org/10.7554/eLife.30205.016| Strain | Number | Description | Source |
|---|---|---|---|
| Pseudomonas aeruginosa strains | |||
| UCBPP-PA14 | Clinical isolate UCBPP-PA14. | Rahme et al. (1995) | |
| PA14 ∆phz | LD24 | PA14 with deletions in phzA1-G1 and phzA2-G2 operons. | Dietrich et al., 2006a |
| PA14 ∆ccoN1 | LD1784 | PA14 with deletion in PA14_44370. | this study |
| PA14 ∆ccoN2 | LD1614 | PA14 with deletion in PA14_44340. | this study |
| PA14 ∆ccoN3 | LD1620 | PA14 with deletion in PA14_40510. | this study |
| PA14 ∆ccoN4 | LD2833 | PA14 with deletion in PA14_10500. | this study |
| PA14 ∆ccoN1 ∆ccoN2 | LD1888 | PA14 with deletions in PA14_44370 and PA14_44340. Made by mating pLD1610 into LD1784. | this study |
| PA14 ∆ccoN1 ∆ccoN4 | LD1951 | PA14 with deletions in PA14_44370 and PA14_10500. Made by mating pLD1264 into LD1784. | this study |
| PA14 ∆ccoN2 ∆ccoN4 | LD1692 | PA14 with deletions in PA14_44340 and PA14_10500. Made by mating pLD1264 into LD1614. | this study |
| PA14 ∆ccoN3 ∆ccoN4 | LD1649 | PA14 with deletions in PA14_40510 and PA14_10500. Made by mating pLD1264 into LD1620. | this study |
| PA14 ∆ccoN1 ∆ccoN2 ∆ccoN3 | LD1977 | PA14 with deletions in PA14_443470, PA14_44340, and PA14_40510. Made by mating pLD1616 into LD1888. | this study |
| PA14 ∆ccoN1 ∆ccoN2 ∆ccoN4 | LD1976 | PA14 with deletions in PA14_443470, PA14_44340, and PA14_10500. Made by mating pLD1264 into LD1888. | this study |
| PA14 ∆ccoN1 ∆ccoN2 ∆ccoN4 ∆ccoN3 | LD2020 | PA14 with deletions in PA14_443470, PA14_44340, PA14_10500, and PA14_40510. Made by mating pLD1264 into LD1977. | this study |
| PA14 ∆cco1cco2 | LD1933 | PA14 with both cco operons (PA14_44340-PA14_44400) deleted simultaneously. | this study |
| PA14 ∆cox ∆cyo ∆cio | LD2587 | PA14 with deletions in PA14_01290–01320 (cox/aa3 operon), PA14_47150–47210 (cyo/bo3 operon), and PA14_13030–13040 (cio operon). Made by mating pLD1966, pLD1967, and pLD2044, in that order, to PA14. | this study |
| PA14 ∆hcn | LD2827 | PA14 with deletion in hcnABC operon (PA14_36310–36330). | this study |
| PA14 ∆phz ∆hcn | LD2828 | PA14 with deletions in phzA1-G1, phzA2-G2, and hcnABC operons. Made by mating pLD2791 into LD24. | this study |
| PA14 ∆ccoN4 ∆hcn | LD2829 | PA14 with deletions in PA14_10500 and hcnABC operon. Made by mating pLD2791 into LD2833. | this study |
| PA14 ∆ccoN1 ∆ccoN2 ∆hcn | LD2830 | PA14 with deletions in PA14_44370, PA14_44340, and hcnABC operon. Made by mating pLD2791 into LD1888. | this study |
| PA14 ∆ccoN1 ∆ccoN2 ∆ccoN4 ∆hcn | LD2831 | PA14 with deletions in PA14_44370, PA14_44340, PA14_10500 and hcnABC operon. Made by mating pLD2791 into LD1976. | this study |
| Pseudomonas aeruginosa strains | |||
| PA14 ∆cco1cco2 ∆hcn | LD2832 | PA14 with deletions in cco1, cco2, and hcnABC operons. Made by mating pLD2791 into LD1933. | this study |
| PA14 gacA::Tn | LD1560 | MAR2xT7 transposon insertion into PA14_30650. | Liberati et al. (2006) |
| PA14 ∆ccoN4::ccoN4 | LD1867 | PA14 ∆ccoN4 strain with wild-type ccoN4 complemented back into the site of deletion. Made by mating pLD1853 into LD2833. | this study |
| PA14 ∆ccoN1 ∆ccoN2 ∆ccoN4::ccoN4 | LD2576 | PA14 ∆ccoN1 ∆ccoN2 ∆ccoN4 strain with wild-type ccoN4 complemented back into the site of deletion. Made by mating pLD1853 into LD1976. | this study |
| PA14 MCS-gfp | LD2820 | PA14 without a promoter driving gfp expression. | this study |
| PA14 Pcco-1-gfp | LD2784 | PA14 with promoter of cco1 operon driving gfp expression. | this study |
| PA14 Pcco-2-gfp | LD2786 | PA14 with promoter of cco2 operon driving gfp expression. | this study |
| PA14 PccoN4-gfp | LD2788 | PA14 with promoter of ccoN4Q4 operon driving gfp expression. | this study |
| PA14-yfp | LD2780 | WT PA14 constitutively expressing eyfp. | this study |
| PA14 ∆ccoN1 ∆ccoN2-yfp | LD2013 | PA14 ∆ccoN1 ∆ccoN2 constitutively expressing eyfp. Made by mating pAKN69 into LD1888. | this study |
| PA14 ∆ccoN4-yfp | LD2834 | PA14 ∆ccoN4 constitutively expressing eyfp. Made by mating pAKN69 into LD2833. | this study |
| PA14 ∆ccoN1 ∆ccoN2 ∆ccoN4-yfp | LD2136 | PA14 ∆ccoN1 ∆ccoN2 ∆ccoN4 constitutively expressing eyfp. Made by mating pAKN69 into LD1976. | this study |
| PA14 ∆cco1cco2-yfp | LD2012 | PA14 ∆cco1cco2 constitutively expressing eyfp. Made by mating pAKN69 into LD1933. | this study |
| Escherichia coli strains | |||
| UQ950 | LD44 | E. coli DH5 λpir strain for cloning. F-∆(argF- lac) 169φ80 dlacZ58(∆M15) glnV44(AS) rfbD1 gyrA96(NaIR) recA1 endA1 spoT thi-1 hsdR17 deoR λpir+ | D. Lies, Caltech |
| BW29427 | LD661 | Donor strain for conjugation. thrB1004 pro thi rpsL hsdS lacZ ∆M15RP4-1360 ∆(araBAD)567 ∆dapA1314::[erm pir(wt)] | W. Metcalf, University of Illinois |
| β2155 | LD69 | Helper strain. thrB1004 pro thi strA hsdsS lacZ∆M15 (F’lacZ∆M15 lacIq traD36 proA + proB + ) ∆dapA::erm (Ermr)pir::RP4 [::kan (Kmr) from SM10] | Dehio and Meyer (1997) |
| S17-1 | LD2901 | StrR, TpR, F− RP4-2-Tc::Mu aphA::Tn7 recA λpir lysogen | Simon et al. (1983) |
| Saccharomyces cerevisiae strains | |||
| InvSc1 | LD676 | MATa/MATalpha leu2/leu2 trp1-289/trp1-289 ura3−52/ura3-52 his3-∆1/his3-∆1 | Invitrogen |
Construction of mutant P. aeruginosa strains
Request a detailed protocolFor making markerless deletion mutants in P. aeruginosa PA14 (Table 1) 1 kb of flanking sequence from each side of the target gene were amplified using the primers listed in Table 2 and inserted into pMQ30 through gap repair cloning in Saccharomyces cerevisiae InvSc1 (Shanks et al., 2006). Each plasmid listed in Table 3 was transformed into Escherichia coli strain UQ950, verified by restriction digests, and moved into PA14 using biparental conjugation. PA14 single recombinants were selected on LB agar plates containing 100 µg/ml gentamicin. Double recombinants (markerless deletions) were selected on LB without NaCl and modified to contain 10% sucrose. Genotypes of deletion mutants were confirmed by PCR. Combinatorial mutants were constructed by using single mutants as hosts for biparental conjugation, with the exception of ∆cco1cco2, which was constructed by deleting the cco1 and cco2 operons simultaneously as one fragment. ccoN4 complementation strains were made in the same manner, using primers LD438 and LD441 listed in Table 2 to amplify the coding sequence of ccoN4, which was verified by sequencing and complemented back into the site of the deletion.
Table 2
Primers used in this study.
https://doi.org/10.7554/eLife.30205.017| Primer number | Sequence | used to make plasmid number |
|---|---|---|
| LD717 | ccaggcaaattctgttttatcagaccgcttctgcgttctgatCAGGACAAGCAGTGGGAAC | pLD1852 |
| LD718 | aggtgttgtaggccatcagcTGGCGGACCACCTTATAGTT | |
| LD958 | aactataaggtggtccgccaCGGTGGTTTCTTCCTCACC | |
| LD959 | ggaattgtgagcggataacaatttcacacaggaaacagctGGTCCAGCCTTTTTCCTTGT | |
| LD725 | ccaggcaaattctgttttatcagaccgcttctgcgttctgatCCCCTCAGAGAAGTCAGTCG | pLD1610 |
| LD726 | aggtgttgtaggccatcaggGGCGGACCACCTTGTAGTTA | |
| LD727 | taactacaaggtggtccgccCCTGATGGCCTACAACACCT | |
| LD728 | ggaattgtgagcggataacaatttcacacaggaaacagctCAGCGGGTTGTCATACTCCT | |
| LD741 | ccaggcaaattctgttttatcagaccgcttctgcgttctgatTCGAGGGCTTCGAGAAGAT | pLD1616 |
| LD742 | aggtgttgtaggccatcagcCAGGGTCATCAGGGTGAACT | |
| LD743 | agttcaccctgatgaccctgGCTGATGGCCTACAACACCT | |
| LD744 | ggaattgtgagcggataacaatttcacacaggaaacagctCGGGTGATGTCGACGTATTC | |
| LD438 | ggaattgtgagcggataacaatttcacacaggaaacagctCCGTTGATTTCCTTCTGCAT | pLD1264 (LD438 - LD441) pLD1853 (LD438 and LD441) |
| LD439 | ctacaaggtggttcgccagtCGCTGACCTACTCCTTCGTC | |
| LD440 | gacgaaggagtaggtcagcgACTGGCGAACCACCTTGTAG | |
| LD441 | ccaggcaaattctgttttatcagaccgcttctgcgttctgatCATCGACCTGGAAGTGCTC | |
| LD725 | ccaggcaaattctgttttatcagaccgcttctgcgttctgatCCCCTCAGAGAAGTCAGTCG | pLD1929 |
| LD1063 | gttgcccaggtgttcctgtGGCGGACCACCTTGTAGTTA | |
| LD949 | ggaattgtgagcggataacaatttcacacaggaaacagctTGTAGTCGAGGGACTTCTTGC | |
| LD1064 | taactacaaggtggtccgccACAGGAACACCTGGGCAAC | |
| LD2168 | ccaggcaaattctgttttatcagaccgcttctgcgttctgatATGTAGGGATCGAGCGACAG | pLD2791 |
| LD2169 | acacgatatccagcccctctTGGACATCGCGCCGTTCCTC | |
| LD2170 | gaggaacggcgcgatgtccaAGAGGGGCTGGATATCGTGT | |
| LD2171 | ggaattgtgagcggataacaatttcacacaggaaacagctAAGAGGTCATAATCGGCGGT | |
| LD2120 | gattcgacatcactagtACGCCCAGCTCCAACAAA | pLD2777 |
| LD2121 | gattcgatgccctcgaGCTAGGGGTTCCACGGTTAAT | |
| LD2122 | gattcgactgcactagtCATCGACTTGCCGCCCAG | pLD2778 |
| LD2123 | g attcg atg ccctcgaGCTATGGGCTTCCATC CAC | |
| LD2124 | gattcgactgcactagtGGCTACTTCCTCTGGCTGG | pLD2779 |
| LD2125 | gattcgactgcctcgagCTGTACAGTCCCGAAAGAAATGAAC | |
| LD1118 | ccaggcaaattctgttttatcagaccgcttctgcgttctgatTCTTCAGGTTCTCGCGGTAG | pLD1966 |
| LD1119 | aagtgccagtaccaactggcGCAGATCCAGAAGATGGTCA | |
| LD1120 | tgaccatcttctggatctgcGCCAGTTGGTACTGGCACTT | |
| LD1121 | ggaattgtgagcggataacaatttcacacaggaaacagctATCGCGAGACTCATGGTTTT | |
| LD1134 | ccaggcaaattctgttttatcagaccgcttctgcgttctgatCGCTGCTTGTCGATCTGTT | pLD1967 |
| LD1135 | gcgacatgaccctgttcaacCTGACCGGCTACTGGACC | |
| LD1136 | ggtccagtagccggtcagGTTGAACAGGGTCATGTCGC | |
| LD1137 | ggaattgtgagcggataacaatttcacacaggaaacagctCCTCGGCGACCATGAATAC | |
| LD1126 | ccaggcaaattctgttttatcagaccgcttctgcgttctgatTTCAGGTTCTTCGGGTTCTC | pLD2044 |
| LD1187 | aacagcgcgccgaccagcatCTCTTCGTTCGTTTTCAGCC | |
| LD1188 | ggctgaaaacgaacgaagagATGCTGGTCGGCGCGCTGTT | |
| LD1189 | ggaattgtgagcggataacaatttcacacaggaaacagctGCGTTGATGAAGCGGATAAC |
Table 3
Plasmids used in this study.
https://doi.org/10.7554/eLife.30205.018| Plasmid | Description | Source |
|---|---|---|
| pMQ30 | 7.5 kb mobilizable vector; oriT, sacB, GmR. | Shanks et al. (2006) |
| pAKN69 | Contains mini-Tn7(Gm)PA1/04/03::eyfp fusion. | Lambertsen et al. (2004) |
| pLD2722 | GmR, TetR flanked by Flp recombinase target (FRT) sites to resolve out resistance casettes. | this study |
| pFLP2 | Site-specific excision vector with cI857-controlled FLP recombinase encoding sequence, sacB, ApR. | Hoang et al. (1998) |
| pLD1852 | ∆ccoN1 PCR fragment introduced into pMQ30 by gap repair cloning in yeast strain InvSc1. | this study |
| pLD1610 | ∆ccoN2 PCR fragment introduced into pMQ30 by gap repair cloning in yeast strain InvSc1. | this study |
| pLD1616 | ∆ccoN3 PCR fragment introduced into pMQ30 by gap repair cloning in yeast strain InvSc1. | this study |
| pLD1264 | ∆ccoN4 PCR fragment introduced into pMQ30 by gap repair cloning in yeast strain InvSc1. | this study |
| pLD1929 | ∆cco1 cco2 PCR fragment introduced into pMQ30 by gap repair cloning in yeast strain InvSc1. | this study |
| pLD2791 | ∆hcn PCR fragment introduced into pMQ30 by gap repair cloning in yeast strain InvSc1. | this study |
| pLD1853 | Full genomic sequence of ccoN4 PCR fragment introduced into pMQ30 by gap repair cloning in yeast strain InvSc1. Verified by sequencing. | this study |
| pLD1966 | ∆aa3 PCR fragment introduced into pMQ30 by gap repair cloning in yeast strain IncSc1. | this study |
| pLD1967 | ∆bo3 PCR fragment introduced into pMQ30 by gap repair cloning in yeast strain IncSc1. | this study |
| pLD2044 | ∆cio PCR fragment introduced into pMQ30 by gap repair cloning in yeast strain IncSc1. | this study |
| pLD2777 | PCR-amplified cco1 promoter ligated into pSEK103 using SpeI and XhoI. | this study |
| pLD2778 | PCR-amplified cco2 promoter ligated into pSEK103 using SpeI and XhoI. | this study |
| pLD2779 | PCR-amplified ccoN4 promoter ligated into pSEK103 using SpeI and XhoI. | this study |
Colony biofilm morphology assays
Request a detailed protocolOvernight precultures were diluted 1:100 in LB (∆N1∆N2, ∆N1∆N2∆N3, ∆N1∆N2∆N4, ∆N1∆N2∆N4∆N3, ∆N1∆N2∆N4::N4, ∆cco1cco2, ∆N1∆N2∆hcn, ∆N1∆N2∆N4∆hcn, ∆cco1cco2∆hcn, and ∆cox∆cyo∆cio were diluted 1:50) and grown to mid-exponential phase (OD at 500 nm ≈ 0.5). Ten microliters of subcultures were spotted onto 60 ml of colony morphology medium (1% tryptone, 1% agar [Teknova (Hollister, CA) A7777] containing 40 µg/ml Congo red dye [VWR (Radnor, PA) AAAB24310-14] and 20 µg/ml Coomassie blue dye [VWR EM-3300]) in a 10 cm x 10 cm x 1.5 cm square Petri dish (LDP [Wayne, NJ] D210-16). For preparation of biofilms grown on on phenazine methosulfate (PMS), colony morphology medium was supplemented with 200 µM PMS (Amresco [Solon, OH] 0361) after autoclaving. For nitrate experiments, colony morphology medium was supplemented with 0, 10, or 40 mM potassium nitrate. Plates were incubated for up to 5 days at 25˚C with >90% humidity (Percival [Perry, IA] CU-22L) and imaged daily using a VHX-1000 digital microscope (Keyence, Japan). Images shown are representative of at least 10 biological replicates. 3D images of biofilms were taken on day 5 of development using a Keyence VR-3100 wide-area 3D measurement system. ∆cox∆cyo∆cio, hcn deletion mutants, and strains grown for the nitrate experiment were imaged using a flatbed scanner (Epson [Japan] E11000XL-GA) and are representative of at least three biological replicates
TTC reduction assay
Request a detailed protocolOne microliter of overnight cultures (five biological replicates), grown as described above, was spotted onto a 1% tryptone, 1.5% agar plate containing 0.001% (w/v) TTC (2,3,5-triphenyl-tetrazolium chloride [Sigma-Aldrich (St. Louis, MO) T8877]) and incubated in the dark at 25˚C for 24 hr. Spots were imaged using a scanner (Epson E11000XL-GA) and TTC reduction, normalized to colony area, was quantified using Adobe Photoshop CS5 (San Jose, CA). Colorless TTC undergoes an irreversible color change to red when reduced. Pixels in the red color range were quantified and normalized to colony area using Photoshop CS5.
Liquid culture growth assays
Request a detailed protocol(i) Overnight precultures were diluted 1:100 (∆N1∆N2, ∆N1∆N2∆N4, and ∆cco1cco2 were diluted 1:50) in 1% tryptone in a clear- flat-bottom polystyrene 96-well plate (VWR 82050–716) and grown for two hours (OD500nm ≈ 0.2). These cultures were then diluted 100-fold in 1% tryptone in a new 96-well plate and incubated at 37°C with continuous shaking on the medium setting in a Synergy 4 plate reader (BioTek, Winooski, VT). Growth was assessed by taking OD readings at 500 nm every 30 min for at least 24 hr. (ii) hcn mutants: Overnight precultures were diluted 1:100 (∆N1∆N2∆hcn, ∆N1∆N2∆N4∆hcn, and ∆cco1cco2∆hcn were diluted 1:50) in MOPS minimal medium (50 mM 4-morpholinepropanesulfonic acid (pH 7.2), 43 mM NaCl, 93 mM NH4Cl, 2.2 mM KH2PO4, 1 mM MgSO4•7H2O, 1 µg/ml FeSO4•7H2O, 20 mM sodium succinate hexahydrate) and grown for 2.5 hr until OD at 500 nm ≈ 0.1. These cultures were then diluted 100-fold in MOPS minimal medium in a clear, flat-bottom polystyrene 96-well plate and incubated at 37°C with continuous shaking on the medium setting in a plate reader. Growth was assessed by taking OD readings at 500 nm every 30 min for at least 24 hr. (iii) Terminal oxidase reporters: Overnight precultures were grown in biological triplicate; each biological triplicate was grown in technical duplicate. Overnight precultures were diluted 1:100 in 1% tryptone and grown for 2.5 hr until OD at 500 nm ≈ 0.1. These cultures were then diluted 100-fold in 1% tryptone in a clear, flat-bottom, polystyrene black 96-well plate (VWR 82050–756) and incubated at 37°C with continuous shaking on the medium setting in a plate reader. Expression of GFP was assessed by taking fluorescence readings at excitation and emission wavelengths of 480 nm and 510 nm, respectively, every hour for 24 hr. Growth was assessed by taking OD readings at 500 nm every 30 min for 24 hr. Growth and RFU values for technical duplicates were averaged to obtain the respective values for each biological replicate. RFU values for a strain without a promoter inserted upstream of the gfp gene (MCS-gfp) were considered background and subtracted from the fluorescence values of each reporter.
Competition assays
Request a detailed protocolOvernight precultures of fluorescent (YFP-expressing) and non-fluorescent strains were diluted 1:100 in LB (∆N1∆N2, ∆N1∆N2∆N4 and ∆cco1cco2 were diluted 1:50) and grown to mid-exponential phase (OD at 500 nm ≈ 0.5). Exact OD at 500 nm values were read in a Spectronic 20D+ spectrophotometer (Thermo Fisher Scientific [Waltham, MA]) and cultures were adjusted to the same OD. Adjusted cultures were then mixed in a 1:1 ratio of fluorescent:non-fluorescent cells and 10 µl of this mixture were spotted onto colony morphology plates and grown for 3 days as described above. At specified time points, biofilms were collected, suspended in 1 ml of 1% tryptone, and homogenized on the ‘high’ setting in a bead mill homogenizer (Omni [Kennesaw, GA] Bead Ruptor 12); day 1 colonies were homogenized for 35 s while days 2 and 3 colonies were homogenized for 99 s. Homogenized cells were serially diluted and 10−6, 10−7, and 10−8 dilutions were plated onto 1% tryptone plates and grown overnight at 37°C. Fluorescent colony counts were determined by imaging plates with a Typhoon FLA7000 fluorescent scanner (GE Healthcare Life Sciences [United Kingdom]) and percentages of fluorescent vs. non-fluorescent colonies were determined.
Construction of terminal oxidase reporters
Request a detailed protocolTranslational reporter constructs for the Cco1, Cco2, and CcoN4Q4 operons were constructed using primers listed in Table 1. Respective primers were used to amplify promoter regions (500 bp upstream of the operon of interest), adding an SpeI digest site to the 5’ end of the promoter and an XhoI digest site to the 3’ end of the promoter. Purified PCR products were digested and ligated into the multiple cloning site (MCS) of the pLD2722 vector, upstream of the gfp sequence. Plasmids were transformed into E. coli strain UQ950, verified by sequencing, and moved into PA14 using biparental conjugation with E. coli strain S17-1. PA14 single recombinants were selected on M9 minimal medium agar plates (47.8 mM Na2HPO4•7H2O, 22 mM KH2PO4, 8.6 mM NaCl, 18.6 mM NH4Cl, 1 mM MgSO4, 0.1 mM CaCl2, 20 mM sodium citrate dihydrate, 1.5% agar) containing 100 µg/ml gentamicin. The plasmid backbone was resolved out of PA14 using Flp-FRT recombination by introduction of the pFLP2 plasmid (Hoang et al., 1998) and selected on M9 minimal medium agar plates containing 300 µg/ml carbenicillin and further on LB agar plates without NaCl and modified to contain 10% sucrose. The presence of gfp in the final clones was confirmed by PCR.
Thin sectioning analyses
Request a detailed protocolTwo layers of 1% tryptone with 1% agar were poured to depths of 4.5 mm (bottom) and 1.5 mm (top). Overnight precultures were diluted 1:100 (∆N1∆N2, ∆N1∆N4, ∆N1∆N2∆N4, ∆cco1cco2 were diluted 1:50) in LB and grown for 2 hr, until early-mid exponential phase. Five to 10 µl of subculture were then spotted onto the top agar layer and colonies were incubated in the dark at 25˚C with >90% humidity (Percival CU-22L) and grown for up to 3 days. At specified time points to be prepared for thin sectioning, colonies were covered by a 1.5-mm-thick 1% agar layer. Colonies sandwiched between two 1.5-mm agar layers were lifted from the bottom layer and soaked for 4 hr in 50 mM L-lysine in phosphate buffered saline (PBS) (pH 7.4) at 4˚C, then fixed in 4% paraformaldehyde, 50 mM L-lysine, PBS (pH 7.4) for 4 hr at 4˚C, then overnight at 37°C. Fixed colonies were washed twice in PBS and dehydrated through a series of ethanol washes (25%, 50%, 70%, 95%, 3 × 100% ethanol) for 60 min each. Colonies were cleared via three 60-min incubations in Histoclear-II (National Diagnostics [Atlanta, GA] HS-202) and infiltrated with wax via two separate washes of 100% Paraplast Xtra paraffin wax (Thermo Fisher Scientific 50-276-89) for 2 hr each at 55˚C, then colonies were allowed to polymerize overnight at 4˚C. Tissue processing was performed using an STP120 Tissue Processor (Thermo Fisher Scientific 813150). Trimmed blocks were sectioned in 10-µm-thick sections perpendicular to the plane of the colony using an automatic microtome (Thermo Fisher Scientific 905200ER), floated onto water at 45˚C, and collected onto slides. Slides were air-dried overnight, heat-fixed on a hotplate for 1 hr at 45˚C, and rehydrated in the reverse order of processing. Rehydrated colonies were immediately mounted in TRIS-Buffered DAPI:Fluorogel (Thermo Fisher Scientific 50-246-93) and overlaid with a coverslip. Differential interference contrast (DIC) and fluorescent confocal images were captured using an LSM700 confocal microscope (Zeiss, Germany). Each strain was prepared in this manner in at least biological triplicates.
Colony thickness measurements
Request a detailed protocolColonies were prepared for thin sectioning as described above, but growth medium was supplemented with 40 µg/ml Congo Red dye and 20 µg/ml Coomassie Blue dye. Colony height measurements were obtained from confocal DIC images using Fiji image processing software (Schindelin et al., 2012).
Lectin staining
Request a detailed protocolTwo-day-old colonies were prepared for thin sectioning as described above. Rehydrated colonies were post-stained in 100 µg/ml fluorescein-labeled Wisteria floribunda lectin (Vector Laboratories (Burlingame, CA) FL-1351) in PBS before being washed twice in PBS, mounted in TRIS-buffered DAPI and overlaid with a coverslip. Fluorescent confocal images were captured using an LSM700 confocal microscope (Zeiss).
Redox profiling of biofilms
Request a detailed protocolA 25-µm-tip redox microelectrode and external reference (Unisense [Denmark] RD-25 and REF-RM) were used to measure the extracellular redox state of day 2 (~48 hr) biofilms (grown as for the colony biofilm morphology assays). The redox microelectrode measures the tendency of a sample to take up or release electrons relative to the reference electrode, which is immersed in the same medium as the one on which the sample is grown. The redox microelectrode was calibrated according to manufacturer’s instructions using a two-point calibration to 1% quinhydrone in pH 4 buffer and 1% quinhydrone in pH 7 buffer. Redox measurements were taken every 5 µm throughout the depth of the biofilm using a micromanipulator (Unisense MM33) with a measurement time of 3 s and a wait time between measurements of 5 s. Profiles were recorded using a multimeter (Unisense) and the SensorTrace Profiling software (Unisense).
Oxygen profiling of biofilms
Request a detailed protocolA 25-µm-tip oxygen microsensor (Unisense OX-25) was used to measure oxygen concentrations within biofilms during the first 2 days of development, grown as described above. For oxygen profiling on 3-day-old colonies (Figure 4), biofilms were grown as for the thin sectioning analyses. To calibrate the oxygen microsensor, a two-point calibration was used. The oxygen microsensor was calibrated first to atmospheric oxygen using a calibration chamber (Unisense CAL300) containing water continuously bubbled with air. The microsensor was then calibrated to a ‘zero’ point using an anoxic solution of water thoroughly bubbled with N2; to ensure complete removal of all oxygen, N2 was bubbled into the calibration chamber for a minimum of 30 min before calibrating the microsensor to the zero calibration point. Oxygen measurements were then taken throughout the depth of the biofilm using a measurement time of 3 s and a wait time between measurements of 5 s. For 6-hr-old colonies, a step size of 1 µm was used to profile through the entire colony; for 12 hr and 24 hr colonies, 2 µm; for 48 hr colonies, 5 µm. A micromanipulator (Unisense MM33) was used to move the microsensor within the biofilm and profiles were recorded using a multimeter (Unisense) and the SensorTrace Profiling software (Unisense).
Phenazine quantification
Request a detailed protocolOvernight precultures were diluted 1:10 in LB and spotted onto a 25 mm filter disk (pore size: 0.2 µm; GE Healthcare 110606) placed into the center of one 35 × 10 mm round Petri dish (VWR 25373-041). Colonies were grown for 2 days in the dark at 25˚C with >90% humidity. After 2 days of growth, each colony (with filter disk) was lifted off its respective plate and weighed. Excreted phenazines were then extracted from the agar medium overnight in 5 ml of 100% methanol (in the dark, nutating at room temperature). Three hundred µl of this overnight phenazine/methanol extraction were then filtered through a 0.22 µm cellulose Spin-X column (Thermo Fisher Scientific 07-200-386) and 200 µl of the flow-through were loaded into an HPLC vial. Phenazines were quantified using high-performance liquid chromatography (Agilent [Santa Clara, CA] 1100 HPLC System) as described previously (Dietrich et al., 2006a; Sakhtah et al., 2016).
C. elegans pathogenicity (slow killing) assays
Request a detailed protocolSlow killing assays were performed as described previously (Tan et al., 1999; Powell and Ausubel, 2008). Briefly, 10 µl of overnight PA14 cultures (grown as described above) were spotted onto slow killing agar plates (0.3% NaCl, 0.35% Bacto-Peptone, 1 mM CaCl2, 1 mM MgSO4, 5 µg/ml cholesterol, 25 mM KPO4, 50 µg/ml FUDR, 1.7% agar) and plates were incubated for 24 hr at 37°C followed by 48 hr at room temperature (~23°C). Larval stage 4 (L4) nematodes were picked onto the PA14-seeded plates and live/dead worms were counted for up to four days. Each plate was considered a biological replicate and had a starting sample size of 30–35 worms.
Statistical analysis
Request a detailed protocolData analysis was performed using GraphPad Prism version 7 (GraphPad Software, La Jolla, CA). Values are expressed as mean ±SD. Statistical significance of the data presented was assessed with the two-tailed unpaired Student’s t-test. Values of p≤0.05 were considered significant (*p≤0.05; **p≤0.01; ***p≤0.001; ****p≤0.0001). Full statistical reporting for relevant figures can be found in Table 4.
Table 4
Statistical analysis.
https://doi.org/10.7554/eLife.30205.019| Figure 2B | Number of values (biological replicates) | mean | median | SD | SEM | Lower 95% confidence interval of mean | Upper 95% confidence interval of mean |
|---|---|---|---|---|---|---|---|
| WT | 5 | 73.22 | 72.94 | 3.387 | 1.515 | 69.02 | 77.43 |
| ∆N4 | 5 | 68.97 | 70.6 | 6.44 | 2.88 | 60.97 | 76.96 |
| ∆N1∆N2 | 5 | 52.18 | 50.46 | 5.142 | 2.3 | 45.79 | 58.56 |
| ∆N1∆N4 | 5 | 11.57 | 12.42 | 2.011 | 0.8991 | 9.074 | 14.07 |
| ∆N1∆N2∆N4 | 5 | 0.001958 | 0.001117 | 0.001696 | 0.0007586 | −0.0001481 | 0.004064 |
| ∆cco1cco2 | 5 | 0.001367 | 0.0008644 | 0.001237 | 0.0005532 | −0.0001686 | 0.002903 |
| t-test | p value | p value summary | |||||
| WT vs. ∆N4 | 0.2273 | ns | |||||
| WT vs. ∆N1∆N2 | <0.0001 | **** | |||||
| WT vs. ∆N1∆N4 | <0.0001 | **** | |||||
| WT vs. ∆N1∆N2∆N4 | <0.0001 | **** | |||||
| WT vs. ∆cco1cco2 | <0.0001 | **** | |||||
| Figure 3A | Number of values (biological replicates) | mean | median | SD | SEM | Lower 95% confidence interval of mean | Upper 95% confidence interval of mean |
| WT-YFP | 12 | 54.95 | 54.92 | 4.387 | 1.266 | 52.16 | 57.74 |
| ∆N4-YFP | 3 | 29.92 | 30.83 | 2.234 | 1.29 | 24.37 | 35.46 |
| ∆N1∆N2-YFP | 3 | 30.49 | 31.91 | 3.527 | 2.036 | 21.73 | 39.25 |
| ∆N1∆N2∆N4-YFP | 3 | 4.408 | 4.296 | 3.23 | 1.865 | −3.617 | 12.43 |
| ∆cco1cco2-YFP | 3 | 7.097 | 5.306 | 4.093 | 2.363 | −3.072 | 17.27 |
| t-test | p value | p value summary | |||||
| WT-YFP vs. ∆N4- YFP | <0.0001 | **** | |||||
| WT-YFP vs. ∆N1∆N2-YFP | <0.0001 | **** | |||||
| ∆N1∆N2-YFP vs. ∆N1∆N2∆N4-YFP | 0.0007 | *** | |||||
| ∆N1∆N2-YFP vs. ∆cco1cco2-YFP | 0.0017 | ** | |||||
| Figure 3—figure supplement 1A | Number of values (biological replicates) | mean | median | SD | SEM | Lower 95% confidence interval of mean | Upper 95% confidence interval of mean |
| WT) | 12 | 45.05 | 45.08 | 4.387 | 1.266 | 42.26 | 47.84 |
| ∆N4 | 3 | 28.22 | 31.31 | 7.442 | 4.297 | 9.731 | 46.71 |
| ∆N1∆N2 | 3 | 27.81 | 28.57 | 2.514 | 1.451 | 21.56 | 34.05 |
| ∆N1∆N2∆N4 | 3 | 7.002 | 6.973 | 0.7508 | 0.4335 | 5.137 | 8.867 |
| ∆cco1cco2 | 3 | 5.38 | 4.183 | 2.146 | 1.239 | 0.05034 | 10.71 |
| t-test | p value | p value summary | |||||
| WT vs. ∆N4 | 0.0002 | *** | |||||
| WT vs. ∆N1∆N2 | <0.0001 | **** | |||||
| ∆N1∆N2 vs. ∆N1∆N2∆N4 | 0.0002 | *** | |||||
| ∆N1∆N2 vs. ∆cco1cco2 | 0.0003 | *** | |||||
| Figure 5 | Number of values (biological replicates) | mean | median | SD | SEM | Lower 95% confidence interval of mean | Upper 95% confidence interval of mean |
| WT | 8 | 150.3 | 151.2 | 10.31 | 3.644 | 141.7 | 158.9 |
| ∆N1∆N2 | 4 | 139.3 | 137.6 | 12.33 | 6.166 | 119.6 | 158.9 |
| ∆N4 | 7 | 131.9 | 127.8 | 8.915 | 3.369 | 123.7 | 140.2 |
| ∆N1∆N4 | 4 | 99.96 | 99.34 | 2.726 | 1.363 | 95.62 | 104.3 |
| ∆cco1cco2 | 4 | 95.19 | 95.56 | 1.559 | 0.7793 | 92.71 | 97.67 |
| ∆N1∆N2∆N4 | 4 | 102.8 | 99.79 | 8.664 | 4.332 | 88.98 | 116.6 |
| ∆phz | 7 | 84.98 | 84.23 | 10.93 | 4.131 | 74.87 | 95.09 |
| t-test | p value | p value summary | |||||
| WT vs. ∆N1∆N2 | 0.1302 | ns | |||||
| WT vs. ∆N4 | 0.0028 | ** | |||||
| WT vs. ∆N1∆N4 | <0.0001 | **** | |||||
| WT vs. ∆cco1cco2 | <0.0001 | **** | |||||
| WT vs. ∆N1∆N2∆N4 | <0.0001 | **** | |||||
| WT vs. ∆phz | <0.0001 | **** | |||||
| Figure 6 | Number of values (biological replicates) | mean | median | SD | SEM | Lower 95% confidence interval of mean | Upper 95% confidence interval of mean |
| WT | 9 | 27.44 | 39 | 18.48 | 6.16 | 13.24 | 41.65 |
| gacA::Tn | 9 | 92.56 | 93 | 8.546 | 2.849 | 85.99 | 99.12 |
| ∆N1∆N2 | 4 | 19 | 21.5 | 14.07 | 7.036 | −3.39 | 41.39 |
| ∆N1∆N2∆N4 | 6 | 64.17 | 68 | 18 | 7.35 | 45.27 | 83.06 |
| ∆cco1cco2 | 9 | 70.56 | 76 | 22.69 | 7.565 | 53.11 | 88 |
| t-test | p value | p value summary | |||||
| WT vs. ∆N1∆N2∆N4 | 0.0022 | ** | |||||
| ∆N1∆N2 vs. ∆N1∆N2∆N4 | 0.0030 | ** | |||||
| WT vs. ∆N1∆N2 | 0.4362 | ns |
References
-
Phylogenetic affiliation of the pseudomonads based on 16S rRNA sequenceInternational Journal of Systematic and Evolutionary Microbiology 50 Pt 4:1563–1589.https://doi.org/10.1099/00207713-50-4-1563
-
Enzymatic characterization and in vivo function of five terminal oxidases in Pseudomonas aeruginosaJournal of Bacteriology 196:4206–4215.https://doi.org/10.1128/JB.02176-14
-
Lysogeny at mid-twentieth century: P1, P2, and other experimental systemsJournal of Bacteriology 186:595–600.https://doi.org/10.1128/JB.186.3.595-600.2004
-
SWISS-MODEL: modelling protein tertiary and quaternary structure using evolutionary informationNucleic Acids Research 42:W252–W258.https://doi.org/10.1093/nar/gku340
-
Oxygen limitation contributes to antibiotic tolerance of Pseudomonas aeruginosa in biofilmsAntimicrobial Agents and Chemotherapy 48:2659–2664.https://doi.org/10.1128/AAC.48.7.2659-2664.2004
-
The multiple evolutionary histories of dioxygen reductases: Implications for the origin and evolution of aerobic respirationMolecular Biology and Evolution 26:285–297.https://doi.org/10.1093/molbev/msn246
-
Differences in two Pseudomonas aeruginosa cbb3 cytochrome oxidasesMolecular Microbiology 51:1193–1203.https://doi.org/10.1046/j.1365-2958.2003.03904.x
-
Genomics of the ccoNOQP-encoded cbb3 oxidase complex in bacteriaArchives of Microbiology 181:89–96.https://doi.org/10.1007/s00203-003-0641-5
-
Achromobacter xylosoxidans in cystic fibrosis: prevalence and clinical relevanceJournal of Cystic Fibrosis 6:75–78.https://doi.org/10.1016/j.jcf.2006.05.011
-
Bacterial community morphogenesis is intimately linked to the intracellular redox stateJournal of Bacteriology 195:1371–1380.https://doi.org/10.1128/JB.02273-12
-
The co-evolution of life and EarthCurrent Biology 16:R395–R400.https://doi.org/10.1016/j.cub.2006.05.017
-
The cbb3 oxidases are an ancient innovation of the domain bacteriaMolecular Biology and Evolution 25:1158–1166.https://doi.org/10.1093/molbev/msn062
-
Exploring the applications of invertebrate host-pathogen models for in vivo biofilm infectionsFEMS Immunology & Medical Microbiology 65:205–214.https://doi.org/10.1111/j.1574-695X.2012.00975.x
-
Clinical impact of Achromobacter xylosoxidans colonization/infection in patients with cystic fibrosisBrazilian Journal of Medical and Biological Research 49:e5097.https://doi.org/10.1590/1414-431X20155097
-
Genes involved in matrix formation in Pseudomonas aeruginosa PA14 biofilmsMolecular Microbiology 51:675–690.https://doi.org/10.1046/j.1365-2958.2003.03877.x
-
An aerobic exercise: defining the roles of Pseudomonas aeruginosa terminal oxidasesJournal of Bacteriology 196:4203–4205.https://doi.org/10.1128/JB.02336-14
-
Differential expression of multiple terminal oxidases for aerobic respiration in Pseudomonas aeruginosaEnvironmental microbiology 12:1399–1412.https://doi.org/10.1111/j.1462-2920.2009.02109.x
-
Reconstitution of respiratory chain enzyme systems. Xii. Some observations on the reconstitution of the succinate oxidase system from heart muscleThe Journal of Biological Chemistry 238:4037–4051.
-
Palaeoproterozoic ice houses and the evolution of oxygen-mediating enzymes: the case for a late origin of photosystem IIPhilosophical Transactions of the Royal Society B: Biological Sciences 363:2755–2765.https://doi.org/10.1098/rstb.2008.0024
-
Mini-Tn7 transposons for site-specific tagging of bacteria with fluorescent proteinsEnvironmental Microbiology 6:726–732.https://doi.org/10.1111/j.1462-2920.2004.00605.x
-
Shallow breathing: bacterial life at low O(2)Nature Reviews Microbiology 11:205–212.https://doi.org/10.1038/nrmicro2970
-
A colorimetric method for the estimation of succinic dehydrogenase activityThe Journal of Biological Chemistry 235:499–503.
-
From iron oxides to infectionsGeobiology 6:196–200.https://doi.org/10.1111/j.1472-4669.2008.00155.x
-
Redox-driven regulation of microbial community morphogenesisCurrent Opinion in Microbiology 18:39–45.https://doi.org/10.1016/j.mib.2014.01.006
-
The bacterial cytochrome cbb3 oxidasesBiochimica et Biophysica Acta (BBA) - Bioenergetics 1655:388–399.https://doi.org/10.1016/j.bbabio.2003.09.017
-
Models of Caenorhabditis elegans infection by bacterial and fungal pathogensMethods in Molecular Biology 415:403–427.https://doi.org/10.1007/978-1-59745-570-1_24
-
Rethinking 'secondary' metabolism: physiological roles for phenazine antibioticsNature Chemical Biology 2:71–78.https://doi.org/10.1038/nchembio764
-
The effects of mutation of the anr gene on the aerobic respiratory chain of Pseudomonas aeruginosaFEMS Microbiology Letters 156:227–232.https://doi.org/10.1111/j.1574-6968.1997.tb12732.x
-
The sites of interaction of triphenyltetrazolium chloride with mitochondrial respiratory chainsFEMS Microbiology Letters 202:181–187.https://doi.org/10.1111/j.1574-6968.2001.tb10801.x
-
Pseudomonas aeruginosa Biofilm Infections: Community Structure, Antimicrobial Tolerance and Immune ResponseJournal of Molecular Biology 427:3628–3645.https://doi.org/10.1016/j.jmb.2015.08.016
-
Identification and antimicrobial susceptibility of Alcaligenes xylosoxidans isolated from patients with cystic fibrosisJournal of Clinical Microbiology 39:3942–3945.https://doi.org/10.1128/JCM.39.11.3942-3945.2001
-
Fiji: an open-source platform for biological-image analysisNature Methods 9:676–682.https://doi.org/10.1038/nmeth.2019
-
SoftwareThe PyMOL Molecular Graphics System, version 1.8The PyMOL Molecular Graphics System.
-
Saccharomyces cerevisiae-based molecular tool kit for manipulation of genes from gram-negative bacteriaApplied and Environmental Microbiology 72:5027–5036.https://doi.org/10.1128/AEM.00682-06
-
Impact of either elevated or decreased levels of cytochrome bd expression on Shigella flexneri virulenceJournal of Bacteriology 181:1229–1237.
-
Role of Campylobacter jejuni respiratory oxidases and reductases in host colonizationApplied and Environmental Microbiology 74:1367–1375.https://doi.org/10.1128/AEM.02261-07
-
Stratified growth in Pseudomonas aeruginosa biofilmsApplied and Environmental Microbiology 70:6188–6196.https://doi.org/10.1128/AEM.70.10.6188-6196.2004
-
Oxygen, cyanide and energy generation in the cystic fibrosis pathogen Pseudomonas aeruginosaAdvances in microbial physiology 52:1–71.https://doi.org/10.1016/S0065-2911(06)52001-6
-
Assembly and function of the cytochrome cbb3 oxidase subunits in Bradyrhizobium japonicumJournal of Biological Chemistry 271:9114–9119.https://doi.org/10.1074/jbc.271.15.9114
Article and author information
Author details
William Cole Cornell

Alexa Price-Whelan
Funding
National Institutes of Health (R01AI103369)
- Lars EP Dietrich
National Science Foundation (NSF CAREER)
- Lars EP Dietrich
National Institutes of Health (training grant 5T32GM008798)
- Jeanyoung Jo
The funders had no role in study design, data collection and interpretation, or the decision to submit the work for publication.
Acknowledgements
We thank Rachel Hainline for technical assistance with competition assays, Christopher Beierschmitt for technical assistance with worm pathogenicity assays, and Konstanze Schiessl for help with image analysis and feedback on the manuscript.
Version history
- Received: July 6, 2017
- Accepted: October 22, 2017
- Version of Record published: November 21, 2017 (version 1)
Copyright
© 2017, Jo et al.
This article is distributed under the terms of the Creative Commons Attribution License, which permits unrestricted use and redistribution provided that the original author and source are credited.
Metrics
-
- 4,824
- views
-
- 555
- downloads
-
- 75
- citations
Views, downloads and citations are aggregated across all versions of this paper published by eLife.
Download links
A two-part list of links to download the article, or parts of the article, in various formats.
Downloads (link to download the article as PDF)
Open citations (links to open the citations from this article in various online reference manager services)
Cite this article (links to download the citations from this article in formats compatible with various reference manager tools)
An orphan cbb3-type cytochrome oxidase subunit supports Pseudomonas aeruginosa biofilm growth and virulence
eLife 6:e30205.
https://doi.org/10.7554/eLife.30205
Further reading
-
- Microbiology and Infectious Disease
- Structural Biology and Molecular Biophysics
African trypanosomes replicate within infected mammals where they are exposed to the complement system. This system centres around complement C3, which is present in a soluble form in serum but becomes covalently deposited onto the surfaces of pathogens after proteolytic cleavage to C3b. Membrane-associated C3b triggers different complement-mediated effectors which promote pathogen clearance. To counter complement-mediated clearance, African trypanosomes have a cell surface receptor, ISG65, which binds to C3b and which decreases the rate of trypanosome clearance in an infection model. However, the mechanism by which ISG65 reduces C3b function has not been determined. We reveal through cryogenic electron microscopy that ISG65 has two distinct binding sites for C3b, only one of which is available in C3 and C3d. We show that ISG65 does not block the formation of C3b or the function of the C3 convertase which catalyses the surface deposition of C3b. However, we show that ISG65 forms a specific conjugate with C3b, perhaps acting as a decoy. ISG65 also occludes the binding sites for complement receptors 2 and 3, which may disrupt recruitment of immune cells, including B cells, phagocytes, and granulocytes. This suggests that ISG65 protects trypanosomes by combining multiple approaches to dampen the complement cascade.
-
- Microbiology and Infectious Disease
In the Firmicutes phylum, GpsB is a membrane associated protein that coordinates peptidoglycan synthesis with cell growth and division. Although GpsB has been studied in several bacteria, the structure, function, and interactome of Staphylococcus aureus GpsB is largely uncharacterized. To address this knowledge gap, we solved the crystal structure of the N-terminal domain of S. aureus GpsB, which adopts an atypical, asymmetric dimer, and demonstrates major conformational flexibility that can be mapped to a hinge region formed by a three-residue insertion exclusive to Staphylococci. When this three-residue insertion is excised, its thermal stability increases, and the mutant no longer produces a previously reported lethal phenotype when overexpressed in Bacillus subtilis. In S. aureus, we show that these hinge mutants are less functional and speculate that the conformational flexibility imparted by the hinge region may serve as a dynamic switch to finetune the function of the GpsB complex and/or to promote interaction with its various partners. Furthermore, we provide the first biochemical, biophysical, and crystallographic evidence that the N-terminal domain of GpsB binds not only PBP4, but also FtsZ, through a conserved recognition motif located on their C-termini, thus coupling peptidoglycan synthesis to cell division. Taken together, the unique structure of S. aureus GpsB and its direct interaction with FtsZ/PBP4 provide deeper insight into the central role of GpsB in S. aureus cell division.


