Directing visceral white adipocyte precursors to a thermogenic adipocyte fate improves insulin sensitivity in obese mice
- University of Texas Southwestern Medical Center, United States
Abstract
Visceral adiposity confers significant risk for developing metabolic disease in obesity whereas preferential expansion of subcutaneous white adipose tissue (WAT) appears protective. Unlike subcutaneous WAT, visceral WAT is resistant to adopting a protective thermogenic phenotype characterized by the accumulation of Ucp1+ beige/BRITE adipocytes (termed ‘browning’). In this study, we investigated the physiological consequences of browning murine visceral WAT by selective genetic ablation of Zfp423, a transcriptional suppressor of the adipocyte thermogenic program. Zfp423 deletion in fetal visceral adipose precursors (Zfp423loxP/loxP; Wt1-Cre), or adult visceral white adipose precursors (PdgfrbrtTA; TRE-Cre; Zfp423loxP/loxP), results in the accumulation of beige-like thermogenic adipocytes within multiple visceral adipose depots. Thermogenic visceral WAT improves cold tolerance and prevents and reverses insulin resistance in obesity. These data indicate that beneficial visceral WAT browning can be engineered by directing visceral white adipocyte precursors to a thermogenic adipocyte fate, and suggest a novel strategy to combat insulin resistance in obesity.
https://doi.org/10.7554/eLife.27669.001eLife digest
Mammals have different types of fat cells in their bodies. White fat cells store energy for later use, and brown and beige fat cells burn energy to help keep the body warm. Individuals who are obese typically have too many white fat cells in and around their belly. This belly fat, also called visceral fat, accumulates around the organs and is believed to contribute to metabolic diseases, such as diabetes and heart disease. Individuals who are obese also have relatively few brown and beige energy-burning fat cells.
Boosting the amount of brown and beige fat in individuals who are obese has been proposed as a potential way to reduce their risk of metabolic disease. One way to do this would be to encourage white visceral fat cells to become more like energy-burning beige or brown fat cells.
Recent research has shown that white fat cells contain higher amounts of a protein called Zfp423 than brown or beige fat cells. This protein turns off the genes that fat cells use to burn energy and so keeps white fat cells in an energy-storing state. Now, Hepler et al. show that genetically modifying mice to turn off the gene that produces Zfp423 specifically in the precursor cells that become white fat cells causes more energy-burning beige cells to appear in their visceral fat.
The genetically modified mice were better able to tolerate cold than normal mice. When placed on a high-fat diet, the modified mice were also less likely to become resistant to the effects of the hormone insulin – a process that can lead to the development of type 2 diabetes and may be linked to heart disease. This suggests that treatments that prevent Zfp423 from working in fat cells could help to treat or prevent diabetes and heart disease in people who are obese. Before such treatments can be developed, further work is needed to investigate how Zfp423 works in more detail, and to confirm that it has the same effects in human fat cells as it does in mice.
https://doi.org/10.7554/eLife.27669.002Introduction
Adipocytes are critical regulators of energy balance and nutrient homeostasis. White adipocytes serve as the principal site for energy storage in mammals. These cells are characterized by a large unilocular lipid droplet and have the capacity to store or release energy depending on metabolic demand. White adipocytes also produce and secrete numerous cytokines and hormones that impact several aspects of physiology (Rosen and Spiegelman, 2014). Eutherian mammals also contain a second major class of adipocytes that function to catabolize stored lipids and produce heat. These thermogenic adipocytes, consisting of brown and beige/BRITE adipocytes, are characterized by their multilocular lipid droplet appearance, high mitochondrial content, and expression of uncoupling protein 1 (Ucp1) (Cohen and Spiegelman, 2015; Harms and Seale, 2013). Brown/beige adipocytes have promising therapeutic potential as their activation in the setting of obesity has a profound impact on metabolic health.
White adipose depots are broadly categorized as either subcutaneous or visceral adipose tissue, reflecting their anatomical location. Adipose tissue distribution is a strong predictor of metabolic outcome in obese individuals (Karpe and Pinnick, 2015; Lee et al., 2013). Visceral adiposity strongly correlates with the development of insulin resistance, diabetes, and cardiovascular disease (Kissebah et al., 1982; Krotkiewski et al., 1983; Ohlson et al., 1985; Vague, 1956). Preferential expansion of subcutaneous depots is associated with sustained insulin sensitivity (Manolopoulos et al., 2010). Engineered rodent models highlight the protective role of subcutaneous adipose tissue. Transgenic animals overexpressing adiponectin or mitoNEET develop extreme subcutaneous obesity; however, these animals remain metabolically healthy (Kim et al., 2007; Kusminski et al., 2012).
In humans, the location of visceral adipose tissue itself likely mediates some of its detrimental effects on energy metabolism; lipids, metabolites, and cytokines can drain directly into the portal circulation and affect liver function (Rytka et al., 2011). Transplantation studies, cellular studies, and gene expression analyses, suggest that factors intrinsic to these depots may also determine their effect on nutrient homeostasis (Tran et al., 2008; Yamamoto et al., 2010). Anatomically distinct adipocytes are functionally unique, differing in their ability to undergo lipolysis, lipogenesis, and activate the thermogenic gene program (Lee et al., 2013; Macotela et al., 2012; Morgan-Bathke et al., 2015; Wu et al., 2012). Along these lines, lineage analyses reveal that anatomically distinct white adipocytes can originate from developmentally distinct precursor cells, and emerge at different times during development (Billon and Dani, 2012; Chau et al., 2014). As such, it is now widely believed that visceral and subcutaneous adipocytes represent distinct subtypes of fat cells.
In mice, visceral and subcutaneous white adipose depots differ remarkably in their ability to remodel under physiological conditions (Hepler and Gupta, 2017). Upon high-fat diet feeding, visceral adipose depots of mice expand by both adipocyte hypertrophy and through the formation of new adipocytes (‘adipogenesis’) (Wang et al., 2013). Inguinal subcutaneous WAT expands predominantly through adipocyte hypertrophy. The differential capacity for adipogenesis is likely explained by factors present in the local microenvironment (Jeffery et al., 2016). Another notable difference between the inguinal and visceral adipose depots in rodents is the capacity to adopt a thermogenic phenotype. Various stimuli, including β3-adrenergic receptor-agonism and cold exposure, drive the rapid accumulation of beige adipocytes in subcutaneous depots (Vitali et al., 2012; Wu et al., 2012). Genetic stimulation of subcutaneous beige adipogenesis renders mice resistant to high-fat diet induced obesity and/or diabetes (Seale et al., 2011; Shao et al., 2016), while inhibition of subcutaneous beiging leads to an earlier onset of insulin resistance during obesity (Cohen et al., 2014). Most visceral depots in mice, particularly the gonadal and mesenteric adipose tissues, are relatively resistant to browning in response to physiological stimuli. With few exceptions (Kiefer et al., 2012), most engineered mouse models of white adipose tissue browning exhibit beige cell accumulation preferentially in subcutaneous WAT depots (Seale et al., 2011; Stine et al., 2016). Visceral WAT depots may harbor mechanisms to suppress thermogenesis to ensure its function as a white, energy-storing, depot.
We previously established a critical role for the transcription factor, Zfp423, in the establishment and maintenance of the adipocyte lineage. Zfp423 is required for fetal differentiation of subcutaneous white adipocytes (Gupta et al., 2010; Shao et al., 2017). In adult mice, Zfp423 expression defines a subset of committed mural preadipocytes (Gupta et al., 2012; Vishvanath et al., 2016). Upon high-fat diet feeding, these mural cells undergo adipogenesis in visceral depots, contributing to adipocyte hyperplasia (Vishvanath et al., 2016). Zfp423 is also expressed in nearly all mature adipocytes; however, its expression is more abundant in white adipocytes than brown adipocytes (Shao et al., 2016). In the mature adipocyte, Zfp423 acts to maintain the energy-storing status of the white adipocyte through suppression of the thermogenic gene program (Shao et al., 2016). Zfp423 likely exerts this function by serving as a transcriptional co-repressor of the brown/beige lineage determining transcription factor, Ebf2. The loss of Zfp423 in mature white adipocytes triggers a robust conversion of white to beige adipocytes in subcutaneous WAT. Amongst the various adipose tissues, visceral WAT expresses the highest levels of Zfp423. Importantly, we observed that visceral adipocytes lacking Zfp423 were also capable of inducing their thermogenic gene program when animals were stimulated pharmacologically with a β3 adrenergic receptor agonist (Shao et al., 2016). This observation affords the possibility of examining whether the thermogenic capacity of visceral white adipose depots can be unlocked under physiological conditions, and whether thermogenic visceral WAT would be ultimately harmful or beneficial to systemic metabolic health.
Here, we describe two mouse models of visceral adipose tissue browning derived through selective ablation of Zfp423 in visceral adipose precursors. We reveal that fetal visceral white preadipocytes can be redirected to a beige-like adipocyte fate through the loss of Zfp423, leading to visceral depot mass reduction and fat redistribution towards subcutaneous depots. The browning of visceral depots improves cold tolerance and protects against the development of insulin resistance and hyperlipidemia in obesity. Moreover, we demonstrate that visceral mural preadipocytes in adult mice can also be directed to a thermogenic cell fate; this leads to beige-like, rather than white, adipocyte hyperplasia, in the expanding visceral WAT depots of diet-induced obese animals. Upon activation by β−3 adrenergic receptor agonism, these beige-like adipocytes can trigger an amelioration of insulin resistance in obese animals. Together, these data establish Zfp423 as a physiological suppressor of the thermogenic gene program in visceral WAT and provide proof of concept that the thermogenic capacity of visceral WAT can be induced under physiological conditions through removal of this molecular brake on the thermogenic gene program in adipose precursors. These data also highlight the potential of visceral WAT, much like subcutaneous WAT, to improve nutrient homeostasis in obesity when a thermogenic beige-like phenotype is induced.
Results
Selective ablation of Zfp423 in fetal visceral white adipocyte precursors leads to the formation of thermogenic visceral adipose depots
We hypothesized that the thermogenic capacity of visceral white adipose depots can be unlocked under physiological conditions through removal of Zfp423, and that engineered visceral thermogenic adipocytes can drive improvements in systemic metabolic health. To test this, we derived a mouse model in which Zfp423 is selectively inactivated in visceral, but not subcutaneous, WAT depots or classic brown adipose tissue depots (BAT). These animals were generated by breeding transgenic mice expressing Cre recombinase under the control of the Wilms Tumor one locus (Wt1-Cre) to animals carrying the floxed Zfp423 alleles (Zfp423loxP/loxP) (Figure 1A) (Zfp423loxP/loxP; Wt1-Cre animals, herein ‘Vis-KO’ mice). Wt1-Cre mice targets Wt1-expressing cells of the embryonic mesothelium, as well as descending cells, which include, adult mesothelial cells and intra-abdominal stromal cells within or surrounding visceral organs. Hastie and colleagues revealed that visceral white adipocytes, but not subcutaneous or classic brown adipocytes, descend from Wt1-expessing progenitors and are targeted by Wt1-Cre (Chau et al., 2014). Specifically, Wt1-Cre targets the majority of gonadal adipocyte precursors and variable numbers of precursors in other visceral depots, including the mesenteric and retroperitoneal depots. Analysis of mRNA expression from multiple fat depots in Vis-KO mice confirmed the deletion of Zfp423 was selective to visceral WAT depots (Figure 1B).
Figure 1 with 1 supplement see all
Deletion of Zfp423 in fetal visceral white adipocyte precursors leads to the formation of thermogenic adipocytes in visceral depots.
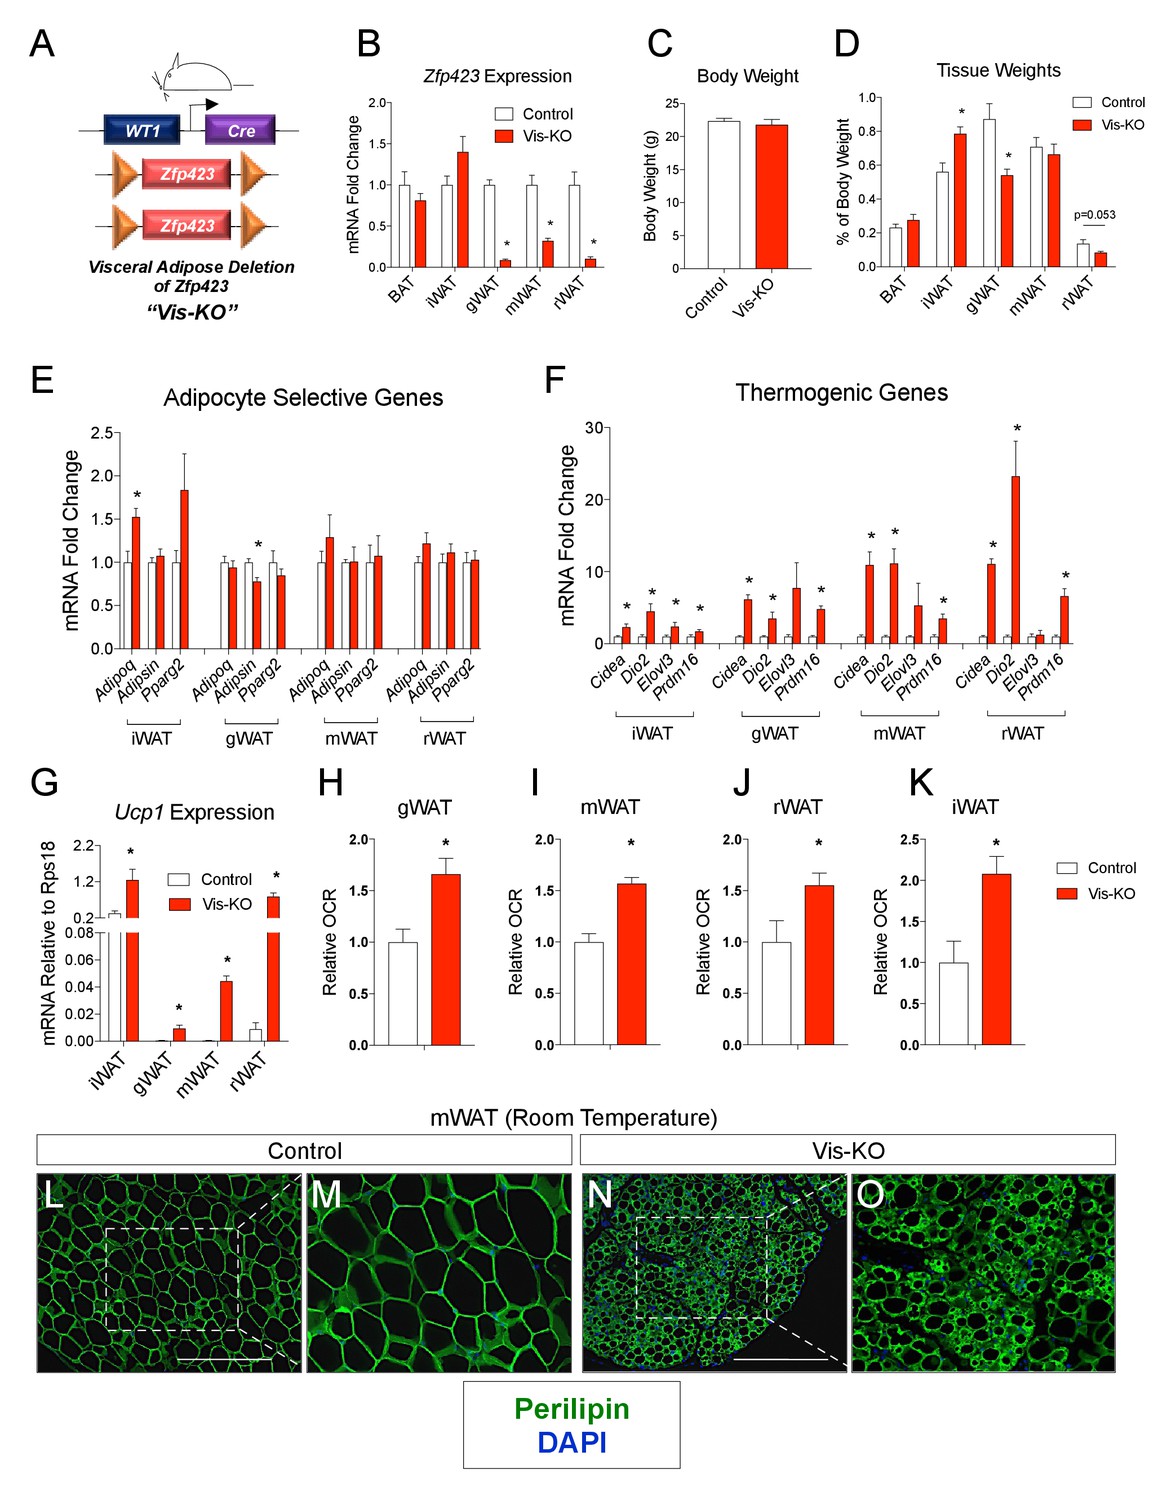
(A) A mouse model of visceral WAT selective ablation of Zfp423 (Visceral-Knockout or ‘Vis-KO’) was derived by breeding animals expressing the gene encoding Cre recombinase under the control of the Wilms Tumor 1 (WT1) promoter to animals carrying floxed Zfp423 alleles (Zfp423loxP/loxP). Littermates carrying only Zfp423loxp/loxP alleles were used as control animals. (B) Fold change in mRNA levels within brown (BAT), inguinal (iWAT), gonadal (gWAT), mesenteric (mWAT), or retroperitoneal (rWAT) adipose tissue of control (white bar) and Vis-KO (red bar) mice at 8 weeks of age. * denotes p<0.05 from unpaired Student’s t-test. n = 6 mice. (C) Body weight of control (white bar) and Vis-KO (red bar) mice at 8 weeks of age. n = 6 mice. (D) Fat pad weight (normalized to body weight) of control (white bar) and Vis-KO (red bar) mice at 8 weeks of age. * denotes p<0.05 from unpaired Student’s t-test. n = 6 mice. (E– F) Fold change in mRNA levels of mature adipocyte genes (E) and thermogenic genes (F) isolated from whole adipose tissue from control (white bar) and Vis-KO (red bar) mice at 8 weeks of age. * denotes p<0.05 from unpaired Student’s t-test. n = 6 mice. (G) mRNA levels (normalized to Rps18) of Ucp1 isolated from whole adipose tissue from control (white bar) and Vis-KO (red bar) mice at 8 weeks of age. * denotes p<0.05 from unpaired Student’s t-test. n = 6 mice. (H–K) Relative basal oxygen consumption rates (OCRs) within diced gWAT (H), mWAT (I), rWAT (J), and iWAT (K) from control (white bar) and Vis-KO (red bar) mice at 8 weeks of age. * denotes p<0.05 from unpaired Student’s t-test. n = 4 independent replicates pooled from two mice. (L–O) Representative immunofluorescence staining of Perilipin (green) and DAPI (blue) in mWAT sections obtained from control (L, M) and Vis-KO (N, O) mice at 8 weeks of age. Scale bar, 200 μM. Panels M and O represent digital enhancements of the boxed regions shown in L and N, respectively.
Vis-KO mice were born in the expected Mendelian ratio and appeared grossly indistinguishable from controls. We did not observe a difference in body weight between eight weeks-old Vis-KO mice and littermate controls; however, we did observe a noticeable difference in body fat distribution (Figure 1C). In comparison to control animals, Vis-KO mice had smaller gonadal WAT depots and larger subcutaneous inguinal WAT (Figure 1D). mRNA levels of adipocyte-selective genes in visceral adipose depots from the Vis-KO were comparable to levels found in control animals (Figure 1E); these data suggest that visceral adipocyte differentiation per se does not depend on Zfp423. However, in all visceral depots examined, there was a marked increase in the expression of key genes involved in adipocyte thermogenesis, including Ucp1 (Figure 1F–G). This was accompanied by an increase in basal O2 consumption rates in explanted WAT depots (Figure 1H–J). Furthermore, some visceral depots (mesenteric and retroperitoneal) lacking Zfp423 exhibit a multilocular appearance typical of thermogenic adipocytes (Figure 1L–O, Figure 1—figure supplement 1A–L). Taken together, these results indicate that inactivation of Zfp423 in fetal visceral white adipocyte precursors leads to the widespread accumulation of beige-like thermogenic adipocytes within visceral adipose depots. Interestingly, despite the fact that Zfp423 was not inactivated in the subcutaneous inguinal WAT of Vis-KO animals, the thermogenic capacity of this depot was also enhanced (Figure 1F,G,K).
Zfp423-deficient visceral adipose precursors differentiate into functional thermogenic adipocytes in vitro
We next asked whether the browning of WAT depots in the Vis-KO animals may occur in a cell-autonomous manner. We isolated the adipose stromal vascular fraction (SVF) from control and Vis-KO mice and performed in vitro adipocyte differentiation assays. SVF cultures obtained from the inguinal WAT of control and Vis-KO animals differentiated to a similar degree, and no significant differences in levels of Zfp423 or thermogenic genes were observed (Figure 2A–C). This is consistent with lack of Cre activity in this depot, and suggests that the increased inguinal WAT beiging in Vis-KO mice in vivo occurs secondary to inactivation of Zfp423 in the Wt1 lineage.
Figure 2

Zfp423-deficient visceral adipose precursors differentiate into functional thermogenic adipocytes in vitro.
(A) Oil Red O staining of adipocytes differentiated in vitro from inguinal and gonadal SVF of control and Vis-KO mice. (B) Fold change in mRNA levels of adipocyte-selective genes in inguinal adipocyte cultures differentiated as shown in A. * denotes p<0.05 from unpaired Student’s t-test. n = 4 replicates from two mice. (C) Fold change in mRNA levels of thermogenic genes in inguinal adipocyte cultures differentiated as shown in A and treated with vehicle or forskolin (10 µm) for 3 hr. n = 4 replicates from two mice. (D) Fold change in mRNA levels of adipocyte-selective genes in gonadal adipocyte cultures as shown in A. * denotes p<0.05 from unpaired Student’s t-test. n = 4 replicates from two mice. (E) Fold change in mRNA levels of thermogenic genes in gonadal adipocyte cultures differentiated as shown in A and treated with vehicle or forskolin (10 µm) for 3 hr. * denotes p<0.05 from unpaired Student’s t-test. n = 4 replicates from two mice. (F) Oxygen consumption rates (OCRs) within differentiated cultures of control (white bars) or Zfp423-deficient (red bars) gonadal adipocytes in the basal state, and in response to sequential additions of oligomycin (ATP synthase inhibitor), FCCP (chemical uncoupler), and rotenone/antimycin A (complex I and complex III inhibitor). * denotes p<0.05 from unpaired Student’s t-test. n = 4 replicates from two mice. (G) Percent uncoupled respiration of differentiated cultures of control (white bar) or Zfp423-deficient (red bar) gonadal adipocytes as determined by basal and uncoupled (oligomycin) respiration data from Figure 2F. * denotes p<0.05 from unpaired Student’s t-test. n = 4 replicates from two mice. (H) Fold change in mRNA levels of white-, beige-, and brown-selective genes in differentiated cultures of control (white bars) or Zfp423-deficient (red bars) gonadal adipocytes. * denotes p<0.05 from unpaired Student’s t-test. n = 4 replicates from two mice.
Cultures of gonadal WAT SVF from control and mutant animals also underwent adipogenesis to a similar degree under the differentiation conditions utilized (dexamethasone, IMBX, insulin, and rosiglitazone). This was evident by comparable lipid accumulation and mRNA levels of adipocyte-selective genes in differentiated cultures (Figure 2A,D). Importantly, Zfp423 mRNA was almost entirely absent from these cultures, reflecting the activity of the Wt1-Cre line in this depot. Cultures of gonadal white adipocytes lacking Zfp423 robustly activate their thermogenic gene program upon stimulation with forskolin (Figure 2E). These changes were accompanied by increased basal, uncoupled (oligomycin), and maximal (FCCP) respiration in differentiated gonadal adipocyte cultures from mutant animals (Figure 2F,G). These data indicate that Zfp423-deficient visceral adipose precursors can differentiate into functional thermogenic adipocytes in a cell-autonomous manner. The cellular phenotype of Zfp423-deficient visceral adipocytes is reminiscent of the characterized phenotype of subcutaneous beige adipocyte cultures (Wu et al., 2012); therefore, we examined whether Zfp423-deficient visceral adipocyte cultures are enriched in the expression of beige-selective transcripts. Zfp423-deficient visceral adipocytes expressed lower levels of white adipocyte-selective genes; however, we did not observe a clear pattern of gene expression changes that would indicate a conversion of Zfp423-deficient visceral adipocytes to either subcutaneous beige or classic brown fat cells (Figure 2H).
Thermogenic Zfp423-deficient visceral adipose tissue is largely distinct from subcutaneous beige adipose tissue
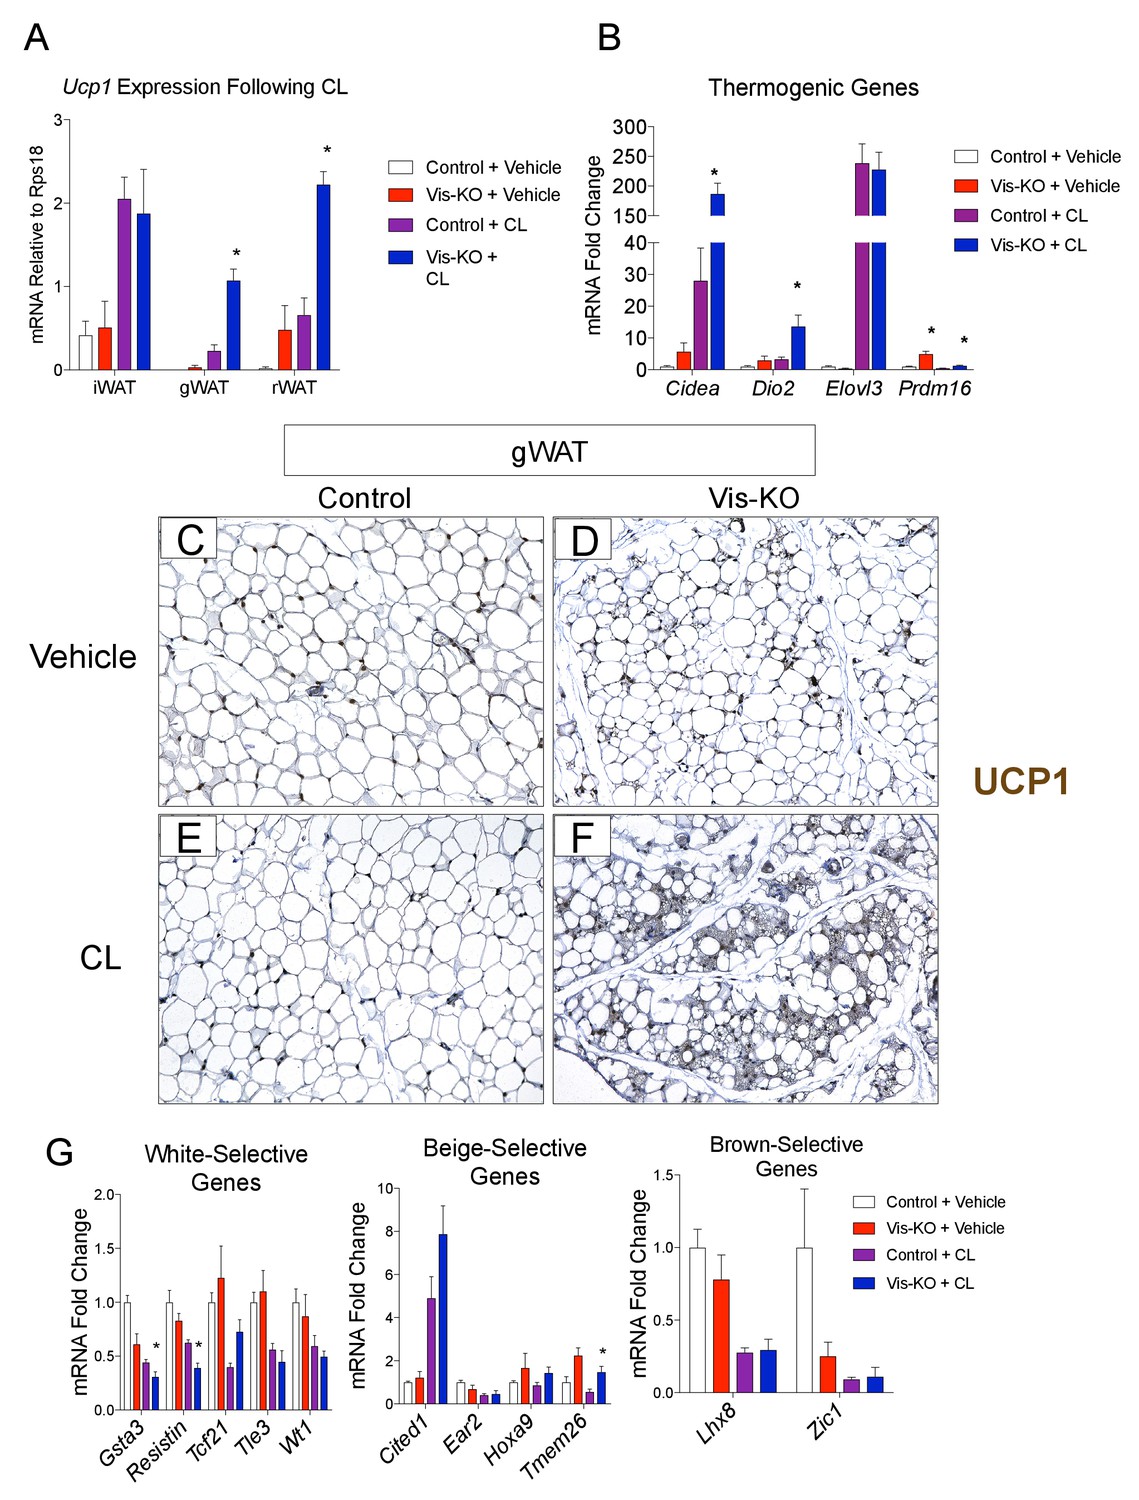
Prior studies of the beige adipocyte determination factor, Prdm16, revealed that genetic ablation of Prdm16 in adipose tissue leads to the loss of subcutaneous beige adipocytes, with inguinal WAT acquiring the molecular properties of visceral fat. Thus, we next asked whether the loss of Zfp423 reprograms visceral WAT into subcutaneous WAT. Alternatively, visceral WAT lacking Zfp423 may retain a global visceral phenotype but adopt a thermogenic phenotype reminiscent of classical brown or subcutaneous beige adipose tissues. In order to address this question we obtained and compared global gene expression profiles of adipose depots from control and Vis-KO animals through RNA sequencing (RNA-seq). For this experiment, we treated all animals with a β−3 adrenergic receptor agonist (CL316,243), or vehicle, for 3 days at thermoneutrality. This treatment allowed us to capture the global gene expression profile of thermogenic adipose depots in their fully active state. CL316,243 treatment led to a much greater increase in mRNA levels of Ucp1 and most other thermogenic genes examined in visceral WAT depots of Vis-KO mice than in control animals (Figure 3A,B). Levels of Ucp1 mRNA in the visceral depots lacking Zfp423 nearly reached levels of Ucp1 found in inguinal WAT following CL316,243 treatment (i.e. subcutaneous beige adipose tissue) (Figure 3A). This was accompanied by the widespread appearance of multilocular cells in gonadal WAT with readily detectable Ucp1 protein expression (Figure 3C–F). We again assayed the mRNA levels of genes commonly used as white, beige, and classic brown, adipocyte markers. Similar to results obtained from cultured Zfp423-deficient visceral adipocytes, the expression of some white adipocyte-selective genes examined were lower in Vis-KO gWAT; however, we once again did not observe a clear pattern of gene expression changes that would indicate a conversion of Zfp423-deficient gWAT to either subcutaneous beige or classic brown adipose tissue (Figure 3G).
Figure 3
Visceral adipose tissue deletion of Zfp423 leads to enhanced visceral browning upon β−3 adrenergic receptor agonism at thermoneutrality.
(A) Control and Vis-KO mice were housed at room temperature (22°C) until 6 weeks of age then transferred to thermoneutral housing conditions (30°C) for 2 weeks. After 2 weeks at thermoneutrality, mice were treated with PBS (vehicle) or CL316,243 (1 mg/kg, intraperitoneal) daily for 3 days. On the 4thday, tissues were harvested for analysis. mRNA levels (relative to Rps18) of Ucp1 in iWAT, gWAT, and rWAT obtained from control and Vis-KO mice treated with vehicle or CL316,243 (CL) for 3 days at thermoneutrality. * denotes p<0.05 from unpaired Student’s t-test. n = 4–5 mice. (B) Fold change in mRNA levels of thermogenic genes in gWAT obtained from control and Vis-KO mice treated with vehicle or CL316,243 (CL) for 3 days at thermoneutrality. * denotes p<0.05 from unpaired Student’s t-test. n = 4–5 mice. (C–F) Representative brightfield images of Ucp1 immunoreactivity (brown staining) in gWAT sections obtained from control or Vis-KO mice treated with vehicle (C,D) or CL316,243 (E,F). (G) Fold change in mRNA levels of white-, beige-, and brown-selective genes in gWAT obtained from control and Vis-KO mice treated with vehicle or CL316,243 (CL) for 3 days at thermoneutrality. * denotes p<0.05 from unpaired Student’s t-test. n = 4–5 mice.
Principal component analysis and unsupervised hierarchical clustering analysis of RNA-Seq data suggest that the global gene expression profile of Zfp423-deficient gWAT is distinct from subcutaneous beige adipose tissue and classic BAT. Instead, the Zfp423-deficient visceral WAT more closely resembles gWAT from control animals (Figure 4A–B). We next compared the list of transcripts that are differentially expressed between β3-agonist treated Zfp423-deficient gWAT and β3-agonist treated gWAT of control animals (i.e. genes whose expression reflect engineered thermogenic gWAT, Figure 4—source data 1) to the list of transcripts that are differentially regulated between β-agonist treated iWAT and vehicle-treated iWAT of control animals (i.e. genes whose expression reflects beige inguinal adipose tissue, Figure 4—source data 2). Zfp423-deficiency led to the differential expression of 1735 transcripts in gWAT (FDR < 0.05) (Figure 4C). Of these 1735 transcripts, 207 genes (12%) overlap with genes differentially regulated following β3-agonist treatment of iWAT (Figure 4—source data 3). Functional classification of these 207 genes by gene ontology analysis indicated that nearly all of these genes are related to mitochondrial function and biogenesis, a hallmark of thermogenic adipocytes (Figure 4D,E). These data suggest that Zfp423-deficient adipocytes present in Vis-KO animals are visceral adipocytes expressing at least a portion of the thermogenic gene program characteristic of subcutaneous beige adipocytes.
Figure 4

Thermogenic Zfp423-deficient visceral adipose tissue is largely distinct from subcutaneous beige adipose tissue.
(A) RNA-sequencing was performed on mRNA libraries derived from gonadal WAT (gWAT) of vehicle- and β3 agonist (CL)-treated control and Vis-KO mice, as well as from inguinal WAT and interscapular BAT of vehicle- and CL-treated control mice. Principle component (PC) analysis of sequencing data obtained from CL-treated animals. n = 3 sequenced libraries for each condition. (B) Unsupervised clustering dendogram of adipose depot samples. (C) Venn diagram depicting overlap in 1) transcripts that are differentially expressed between β3-agonist treated Zfp423-deficient gWAT and β3-agonist treated gWAT of control animals, and 2) transcripts that are differentially regulated between β-agonist treated iWAT and vehicle-treated iWAT of wild-type animals. See Figure 4—source data 1, Figure 4—source data 2, Figure 4—source data 3. (D) Gene ontology analysis (GOTERM_CC_FAT) of the 207 overlapping genes shown in D. (E) Heatmap of top 50 induced genes of the 207 highlighted in C.
-
Figure 4—source data 1
Genes whose expression is significantly altered in gonadal WAT of Vis-KO CL316,243 treated mice.
- https://doi.org/10.7554/eLife.27669.008
-
Figure 4—source data 2
Genes whose expression is significantly altered in Inguinal WAT of CL316,243 treated mice.
- https://doi.org/10.7554/eLife.27669.009
-
Figure 4—source data 3
List of 207 genes highlighted in Figure 4C.
- https://doi.org/10.7554/eLife.27669.010
Thermogenic visceral adipose tissue confers improved cold tolerance and protection from insulin resistance in obesity
Subcutaneous beige adipocytes exert beneficial effects on nutrient homeostasis and can increase energy expenditure. The Vis-KO model affords the opportunity to explore the systemic benefits of unlocking the thermogenic phenotype of visceral adipose depots. To this end, we tested the ability of Vis-KO mice to maintain body temperature in response to cold challenge. Following 1 week of cold exposure, visceral WAT depots of the Vis-KO mice activated their thermogenic gene program (Figure 5A,B) and accumulated Ucp1+ multilocular adipocytes (Figure 5C–J) to a much greater extent than control animals. We did not observe a significant difference in core body temperature during an acute cold tolerance test of control and Vis-KO animals (Figure 5K); however, after four weeks of cold acclimation, the Vis-KO mice maintain higher core body temperature (Figure 5L). Collectively, these data demonstrate that inactivation of Zfp423 is sufficient to unlock the thermogenic activity of visceral WAT depots under postnatal physiological conditions, and that browning of these depots can functionally enhance adaptive thermogenesis.
Figure 5

Zfp423-deficiency enables cold-induced visceral WAT browning.
(A) Control and Vis-KO mice were housed at room temperature (22°C) until 6 weeks of age then transferred to thermoneutral housing (30°C) for 2 weeks. After 2 weeks at thermoneutrality, animals were transferred to 6°C or left at thermoneutrality for seven full days. On the 8th day, tissues were harvested for analysis. mRNA levels (relative to Rps18) of Ucp1 in iWAT, gWAT, and rWAT from control and Vis-KO mice cold exposed (CE) or housed at thermoneutrality (TN) for 7 days. * denotes p<0.05 from unpaired Student’s t-test. n = 4–5 mice. (B) Fold change in mRNA levels of thermogenic genes in rWAT and gWAT from control and Vis-KO mice cold exposed (CE) or housed at thermoneutrality (TN) for 7 days. * denotes p<0.05 from unpaired Student’s t-test. n = 4–5 mice. (C–J) Brightfield images of Ucp1 immunostaining (brown) within rWAT (C–F) and gWAT (G–J) sections obtained from control or Vis-KO mice following cold exposure (CE) or housing at thermoneutrality (TN). (K) Body temperature at indicated time points following transfer of mice from thermoneutrality to cold (6°C). n = 4–5 mice. (L) Body temperature at indicated time points during a cold tolerance test after 4 weeks of acclimation to cold (6°C). * denotes p<0.05 from unpaired Student’s t-test. n = 4–5 mice.
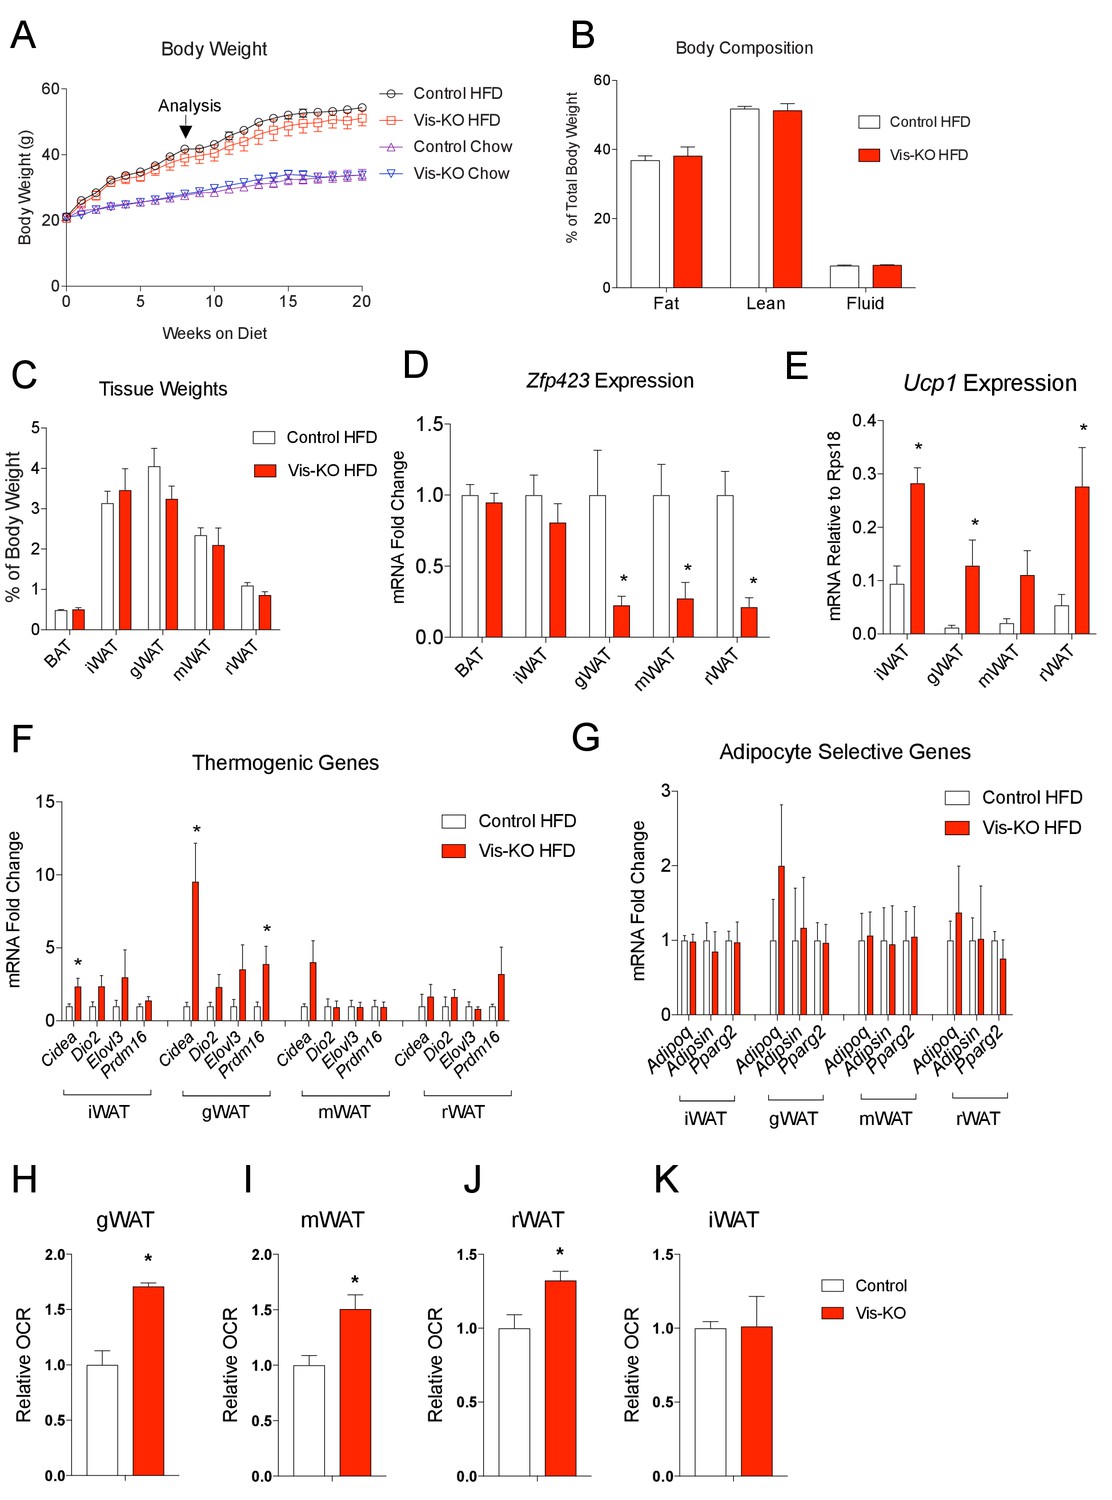
We also asked whether the thermogenic visceral WAT present in Vis-KO animals confers protection against diet-induced obesity and/or impaired nutrient homeostasis. We administered 8 weeks-old male mice chow or high-fat diet (HFD) (60% calories from fat) for 20 weeks. Over this period, we did not observe a significant difference in body weight between Vis-KO mice and controls (Figure 6A). At the time of analysis (8 weeks of HFD feeding), we did not observe a significant difference in adiposity (% body fat), lean mass, or fat distribution (Figure 6B,C). Gene expression analysis of dissected tissues revealed that the loss of Zfp423 expression remained restricted to visceral depots (Figure 6D). Levels of Ucp1 and other genes related to thermogenesis were significantly increased in visceral depots of obese Vis-KO mice (Figure 6E,F); however, mRNA levels of adipocyte-selective genes did not appear to be impacted by the loss of Zfp423 (Figure 6G). The later suggests that Zfp423-deficiency did not impact de novo visceral adipocyte differentiation that occurs over this period of HFD feeding. The increase in thermogenic gene expression appeared functionally significant; rates of basal and maximal oxygen consumption were significantly elevated in the visceral depots of obese Vis-KO mice when compared to controls (Figure 6H–J). We again observed a slight increase in the expression of thermogenic genes in the inguinal WAT of mutant animals; however, the metabolic activity of the inguinal WAT depot did not significantly differ from inguinal WAT of obese control mice (Figure 6K).
Figure 6
Obese mice lacking Zfp423 in visceral adipose tissue display enhanced visceral adipose tissue thermogenesis.
(A) Weekly measurements of body weights of 8 weeks-old control and Vis-KO mice fed a standard chow diet (Chow) or high fat diet (HFD) for 20 weeks. n = 6–7 mice per group. (B) Total fat mass, lean mass, and water mass (normalized to body weight) of control (white bars) and Vis-KO (red bars) mice after 8 weeks of HFD feeding. n = 6–7 mice. (C) Fat depot mass (normalized to body weight) of control (white bars) and Vis-KO (red bars) mice after 8 weeks of HFD feeding. n = 6–7 mice. (D) Relative mRNA levels of Zfp423 in BAT, iWAT, gWAT, mWAT, and rWAT isolated from control (white bars) and Vis-KO (red bars) mice after 8 weeks of HFD feeding. * denotes p<0.05 from unpaired Student’s t-test. n = 6–7 mice per group. (E) mRNA levels (normalized to Rps18) of Ucp1 within adipose depots of control (white bars) and Vis-KO (red bars) mice after 8 weeks of chow or HFD feeding. * denotes p<0.05 from unpaired Student’s t-test. n = 6–7 mice. (F–G) Relative mRNA levels of thermogenic genes (F) and adipocyte-selective genes (G) in iWAT, gWAT, mWAT, and rWAT isolated from control (white bars) and Vis-KO (red bars) mice after 8 weeks of HFD feeding. * denotes p<0.05 from unpaired Student’s t-test. n = 6–7 mice. (H–K) Relative basal oxygen consumption rates (OCRs) within gWAT (H), mWAT (I), rWAT (J), and iWAT (K) isolated from control (white bars) and Vis-KO (red bars) mice after 8 weeks of chow or HFD feeding. * denotes p<0.05 from unpaired Student’s t-test. n = 4 independent replicates pooled from two mice.
We also examined whether the observed increase in visceral WAT oxygen consumption impacts whole-body levels of energy expenditure. We assessed energy expenditure and food intake in control and knockout animals fed HFD for 8 weeks. At this point, body weights and body composition were comparable between the two groups of animals (Figure 7A,B); however, we observed a modest, but statistically significant, increase in O2 consumption, heat production, and CO2 production, in the Zfp423-deficient mice (Figure 7C–F). We observed a slight increase in food intake over the dark cycle; however, these differences did not reach statistical significance (Figure 7G). Moreover, overall locomotor activity measurements and respiratory exchange ratios were similar between control and knockout animals (Figure 7H,I). These new data indicate that visceral WAT deletion of Zfp423, and subsequent visceral browning, enhances energy expenditure, albeit not a strong enough degree to drive a robust difference in body weight.
Figure 7

Browning of visceral adipose tissues is associated with increased energy expenditure.
(A) Body weight of control (white bar) and Vis-KO (red bar) mice after 8 weeks of high fat diet feeding. n = 4–5 mice. (B) Total fat mass, lean mass, and water mass (normalized to body weight) of control (white bars) and Vis-KO (red bars) mice after 8 weeks of HFD feeding. n = 4–5 mice. (C) O2 consumption during two complete 12 hr light-dark cycles of control and Vis-KO mice following 8 weeks of high fat diet feeding. n = 4–5 mice. (D–G) Average O2 consumption (D), heat production (E), CO2 production (F), and food intake (G) during the 24 hr, day, and night cycle in control (white bars) and Vis-KO (red bars) mice following 8 weeks of high fat diet. Bars represent averages from over the course of the 5 day measurement. * denotes p<0.05 from unpaired Student’s t-test. n = 4–5 mice. (H) Average 24 hr X-beam, Y-beam, and Z-beam breaks of control (white bars) and Vis-KO (red bars) mice following 8 weeks of high fat diet. Bars represent averages from over the course of the 5 day measurement. n = 4–5 mice. (I) Average RER during the 24 hr, day, and night cycle in control (white bars) and Vis-KO (red bars) mice following 8 weeks of high fat diet. Bars represent averages from over the course of the 5 day measurement. n = 4–5 mice.
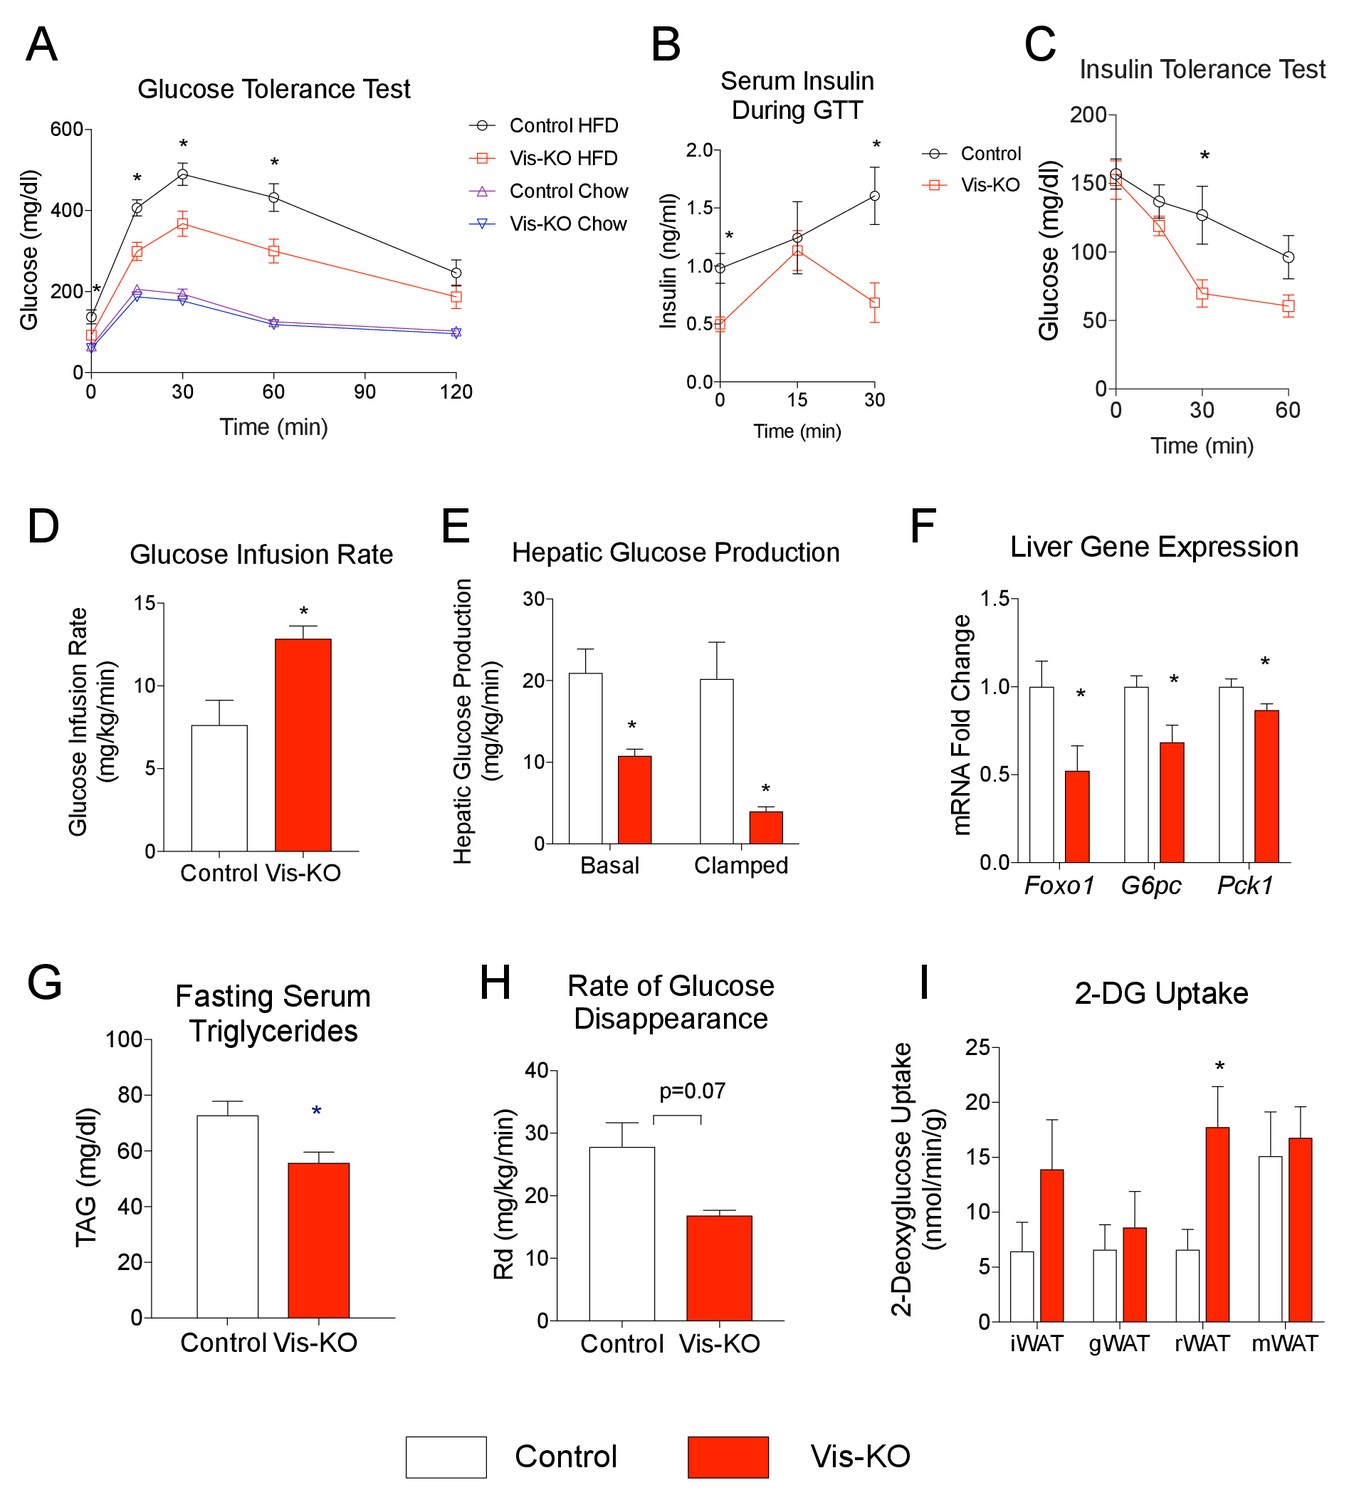
Further metabolic phenotyping of control and mutant animals revealed that the beige-like phenotype of visceral WAT in diet-induced obese Vis-KO mice was associated with striking improvements in nutrient homeostasis. Obese Vis-KO mice exhibited significantly better glucose tolerance test than obese control animals; excursions in blood glucose and serum insulin following glucose challenge were substantially lower in Vis-KO animals (Figure 8A,B). Insulin tolerance tests suggest greater systemic insulin sensitivity in the Vis-KO mice (Figure 8C). We further explored the impact of visceral WAT browning on systemic glucose metabolism by performing hypersulinemic-euglycemic clamp assays. The glucose infusion rate needed to maintain euglycemia (~138 mg/dl) was increased in Vis-KO mice (Figure 8D). This demonstrates an increase in whole-body insulin sensitivity, consistent with the aforementioned insulin tolerance tests. Importantly, endogenous glucose output was suppressed much more efficiently during the basal and clamped states in Vis-KO mice, likely reflecting improved insulin sensitivity at the level of the liver (Figure 8E). These data are supported by liver gene expression analysis from a separate cohort of animals. The mRNA levels of key gluconeogenic genes in the Vis-KO livers are significantly lower than corresponding levels in livers from control animals after 8 weeks of HFD feeding (Figure 8F). Furthermore, visceral adipose-selective browning phenotype is associated with lower serum triglyceride levels (Figure 8G). 14C-2-deoxyglucose tracing revealed that the rate of whole-body glucose disposal did not significantly differ between control and Vis-KO mice (Figure 8H); however, glucose uptake was enhanced in the visceral rWAT depot, correlating with where the largest degree of visceral beiging is observed in this model (Figure 8I). All together, these data demonstrate visceral deletion of Zfp423 leads to enhanced insulin sensitivity and reduced hepatic glucose output. Moreover, these data suggest that engineered thermogenic visceral adipose tissue, much like subcutaneous beige adipose tissue, can defend against the development of impaired glucose and lipid homeostasis in obesity.
Figure 8
Mice lacking visceral adipose Zfp423 are protected against insulin resistance in obesity.
(A) Intraperitoneal glucose tolerance tests of control and Vis-KO mice after 8 weeks of chow or HFD feeding. * denotes p<0.05 from unpaired Student’s t-test. n = 6–7 mice. (B) Serum insulin levels of control and Vis-KO mice after 8 weeks of HFD feeding during the glucose tolerance test shown in A. * denotes p<0.05 from unpaired Student’s t-test. n = 6–7 mice. (C) Insulin tolerance tests of control and Vis-KO mice after 8 weeks of HFD feeding. * denotes p<0.05 from unpaired Student’s t-test. n = 6–7 mice. (D–E) Glucose infusion rate (D) and basal and clamped hepatic glucose production (E) during hyperinsulinemic-euglycemic clamp experiments performed on conscious, unrestrained control (white bars) and Vis-KO (red bars) mice after 8 weeks of HFD feeding. * denotes p<0.05 from unpaired Student’s t-test. n = 5–6 mice. (F) Relative mRNA levels of gluconeogenic genes in the livers of control (white bars) and Vis-KO (red bars) mice after 8 weeks of HFD feeding. * denotes p<0.05 from unpaired Student’s t-test. n = 6–7 mice. (G) Serum triglyceride levels in control (white bars) and Vis-KO (red bars) mice after 8 weeks of HFD feeding. * denotes p<0.05 from unpaired Student’s t-test. n = 6–7 mice. (H) Glucose disappearance rate during hyperinsulinemic-euglycemic clamp experiments performed on conscious, unrestrained control (white bars) and Vis-KO (red bars) mice after 8 weeks of HFD feeding. n = 5–6 mice. (I) 2-deoxyglucose uptake quantification of iWAT, gWAT, rWAT, and mWAT during hyperinsulinemic-euglycemic clamp experiments performed on conscious, unrestrained control (white bars) and Vis-KO (red bars) mice after 8 weeks of HFD feeding. * denotes p<0.05 from unpaired Student’s t-test. n = 5–6 mice.
Inactivation of Zfp423 in adult mural cells leads to beige, rather than white, adipocyte hyperplasia in diet-induced obesity
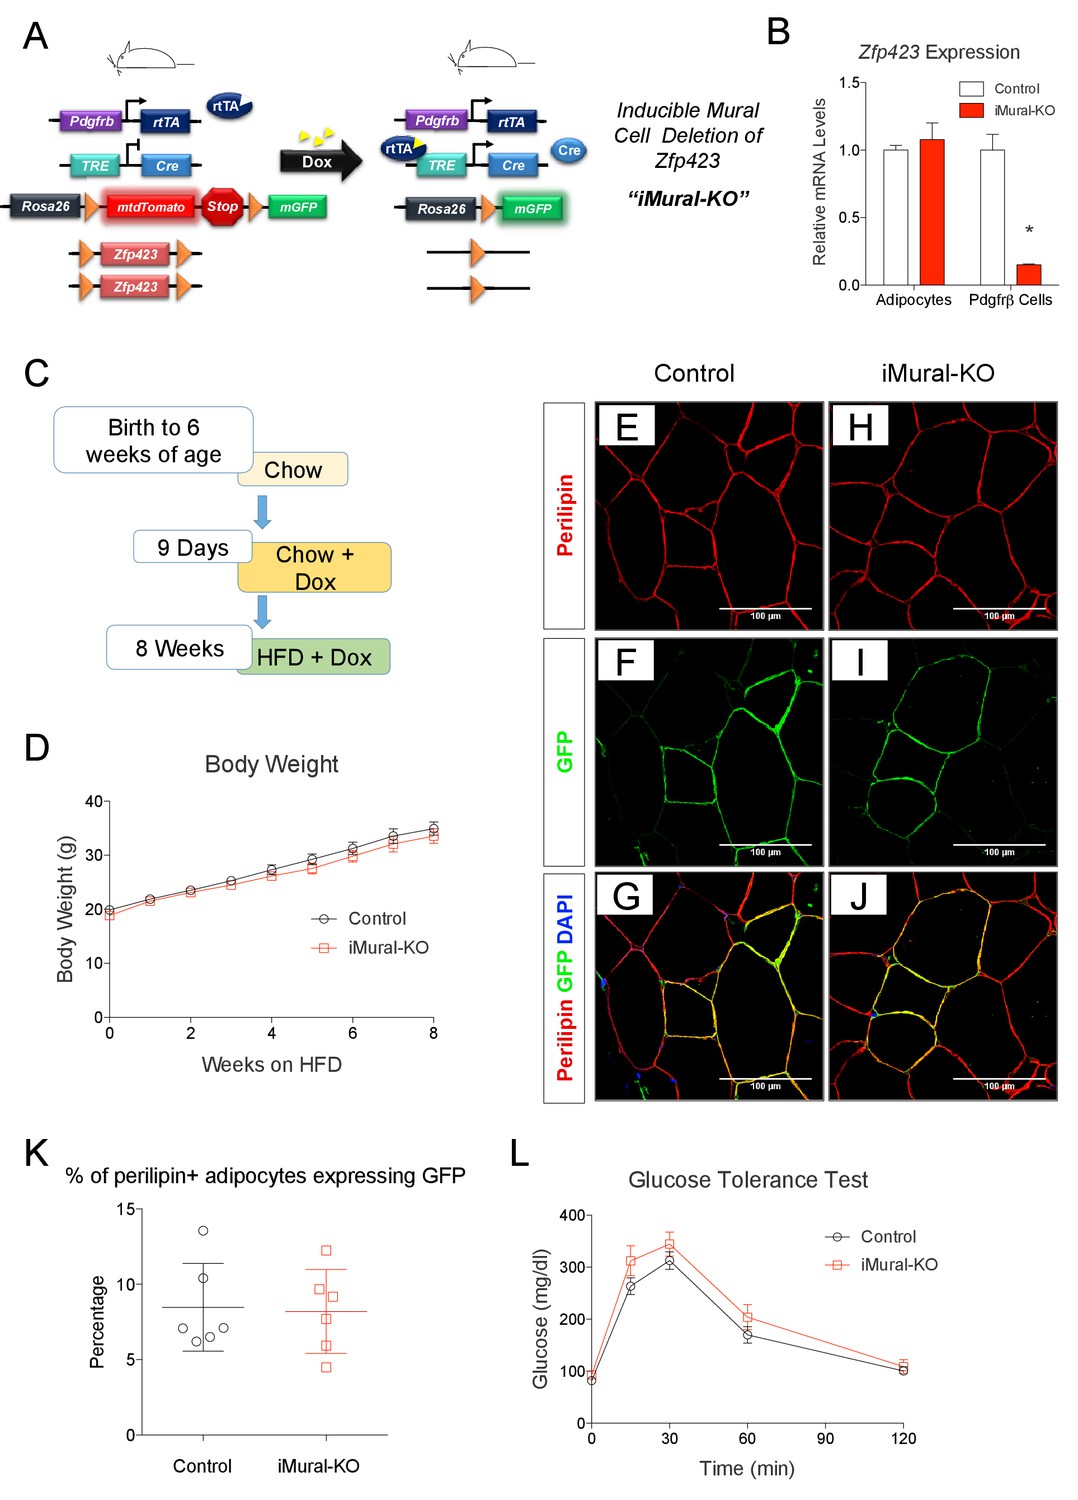
We previously demonstrated that adipocytes emerging in expanding visceral, but not subcutaneous, WAT depots of diet-induced obese mice arise through de novo adipocyte differentiation from mural progenitors expressing Pdgfrb (Hepler et al., 2017; Vishvanath et al., 2016). Whether these preadipocytes can be redirected to a thermogenic adipocyte fate, thereby driving beige-like adipocyte hyperplasia rather than white adipocyte hyperplasia, has been unclear. To address this, we generated a model that allows for doxycycline-inducible inactivation of Zfp423 in Pdgfrb-expressing mural cells (inducible mural cell Zfp423 knockout, or ‘iMural-KO’) (Figure 9A). The iMural-KO model was achieved by breeding PdgfrbrtTA transgenic mice to animals expressing Cre recombinase under the control of a tetracycline responsive element (TRE-Cre) and carrying floxed Zfp423 alleles (Zfp423loxP/loxP). We also bred the Cre-dependent Rosa26R loxP-mtdTomato-loxP-mGFP (mT/mG) fluorescent reporter allele into the model; this allowed for the fate-mapping of targeted mural cells. Treatment of adult animals with doxycycline leads to Cre dependent inactivation of mural cell Zfp423 (Figure 9B), and permanent fluorescent-tagging (mGFP) of Pdgfrβ+ cells. Importantly, mature adipocytes present at the time of doxycycline treatment are not targeted (Figure 9B). Only those adipocytes that descend from mural cells following HFD feeding are Zfp423-deficient and will express mGFP.
Figure 9
Adult mural cell deletion of Zfp423 does not impact visceral white adipogenesis associated with high fat diet feeding.
(A) Doxycycline (Dox) inducible deletion of Zfp423 in adult mural cells (inducible-Mural-Knockout or ‘iMural-KO’) is achieved by breeding PdgfrbrtTA transgenic mice to animals expressing Cre recombinase under the control of a tetracycline response element (TRE-Cre), the Rosa26R loxP-mtdTomato-loxP-mGFP (mT/mG) fluorescent reporter allele, and the floxed Zfp423 alleles (Zfp423loxP/loxP). Animals carrying only PdgfrbrtTA, TRE-Cre, and Rosa26RmT/mG alleles were used as controls. (B) Validation of the iMural-KO model. Relative mRNA levels of Zfp423 in purified adipocytes and purified Pdgfrβ+ cells from WAT obtained from control (white bars) and iMural-KO (red bars) mice at 8 weeks of age. * denotes p<0.05 from unpaired Student’s t-test. n = 4–5 mice. (C) Mice were maintained at room temperature and fed standard chow diet until 6 weeks of age. Animals were then switched to Dox-containing chow diet for 9 days in order to induce Zfp423 deletion and mGFP expression in mural cells. Animals were then maintained on a Dox-containing high-fat diet (HFD) for 8 weeks then sacrificed for analysis. (D) Weekly body weight measurements of control and iMural-KO mice during HFD feeding. n = 6–8 mice. (E–J) Confocal images of immunostained gWAT obtained from control (E–G) and iMural-KO (H–J) mice fed high fat diet for 8 weeks. (K) Quantification of mGFP-expressing adipocytes (mGFP+; perlipin+) observed in randomly chosen 10X magnification fields of gWAT sections obtained from control (black circles) and iMural-KO (red squares) mice following 8 weeks of HFD feeding. n = 6 mice. (L) Glucose tolerance tests of control and iMural-KO mice after 8 weeks of HFD feeding. n = 6–8 mice.
Following doxycycline treatment, we fed control and iMural-KO mice a HFD for 8 weeks (Figure 9C). After 8 weeks of HFD feeding, the body weights of mutant animals were indistinguishable from controls (Figure 9D). De novo white adipocyte differentiation occurred in gWAT of both control and mutant animals; newly derived adipocytes were indicated by the expression of mGFP (Figure 9E–J). However, we did not observe a statistically significant difference in the number of mGFP+ adipocytes between control and iMural-KO mice (Figure 9K). Overall, ~5–15% of gonadal adipocytes present in the gWAT of these obese animals descended from mural cells. Despite the fact that Zfp423 expression identifies mural adipose progenitors, these data suggest that adult mural progenitors do not require Zfp423 in vivo for their ability to undergo adipocyte differentiation in response to HFD feeding.
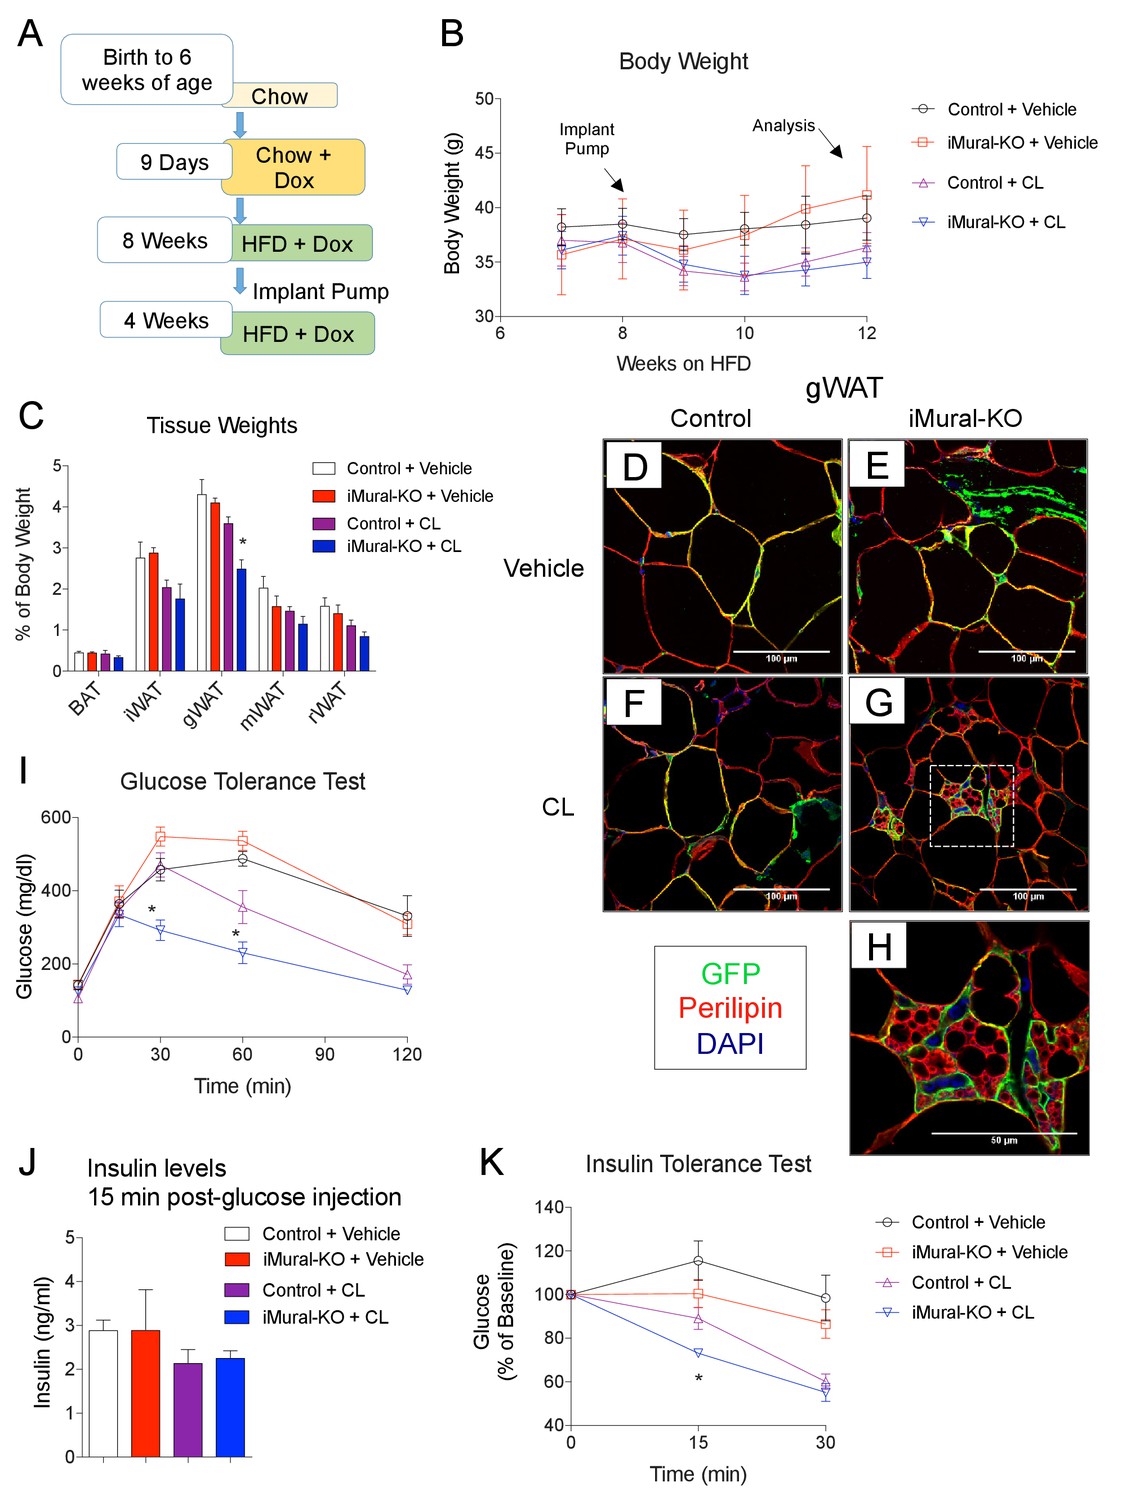
Zfp423-deficient adipocytes originating from mural progenitors in the obese iMural-KO model were readily identified by mGFP expression; however, these cells were not multilocular (Figure 9H,I,J). Moreover, the glucose tolerance of obese iMural-KO mice was similar to that of control animals (Figure 9L). Our previous study revealed that the thermogenic activity of Zfp423-deficient adipocytes was dependent on active β-adrenergic signaling (Shao et al., 2016); it is well appreciated that rodent obesity is associated with augmented β-adrenergic receptor signaling (Collins et al., 1999; Collins and Surwit, 2001). Therefore, we reasoned that the Zfp423-deficient adipocytes present in these in obese mice would require a stimulus to fully activate their thermogenic function in this setting. To test this, we utilized osmotic pumps to deliver the β3-adrenergic receptor agonist, CL316,243, daily at a dose of 1 mg/kg/day for four continuous weeks. The agonist was given to obese control and iMural-KO mice after 8 weeks of HFD feeding (Figure 10A). During the 4 weeks of the β3-agonist treatment, both control and iMural-KO animals exhibited a similarly mild decrease in body weight (Figure 10B). However, after four weeks of β3-agonist treatment, the gonadal adipose depot mass of iMural-KO mice was significantly smaller than the gWAT mass of treated control mice (Figure 10C). Immunohistochemistry for mGFP expression revealed that β3-agonist treatment did not induce the formation of any additional gonadal or inguinal adipocytes from the Pdgfrb lineage (Figure 10D–H, Figure 10—figure supplement 1A,B). We again did not observe a difference in the numbers of mGFP-labelled adipocytes between control and knockout animals (Figure 10—figure supplement 1A,B). Mural-cell derived adipocytes in the β3-agonist treated control animals remained unilocular; however, most mGFP+ adipocytes present in β3-agonist treated knockout mice were now multilocular (Figure 10D–H). On average, ~6% of gonadal adipocytes appeared multilocular in the iMural-KO animals; very few, if any, gonadal multilocular adipocytes were present in β3-agonist treated control mice (Figure 10—figure supplement 1C). Levels of Ucp1 mRNA were strongly elevated in visceral depots of the β3-agonist treated iMural-KO mice (Figure 10—figure supplement 1E). On the other hand, the percentage of inguinal adipocytes appearing multilocular appeared low (~3%) and comparable between control and knockout animals (Figure 10—figure supplement 1D). However, despite the low and comparable levels of mural cell adipogenesis, the iWAT from β3-agonist treated knockout animals had relatively higher levels of Ucp1 mRNA in comparison to controls (Figure 10—figure supplement 1E). The recruitment of this relatively low number of beige-like adipocytes appeared sufficient to drive an increase in basal respiration of adipose tissues (Figure 10—figure supplement 1F). This active thermogenic phenotype of the visceral WAT correlated with markedly improved glucose tolerance and insulin sensitivity observed in β3-agonist iMural-KO mice (Figure 10I–K). All together, these data indicate that visceral mural preadipocytes in adult mice can be directed to a dormant beige-like phenotype in the expanding visceral WAT depots of diet-induced obese animals. Upon activation by β3 adrenergic receptor agonism, these beige-like adipocytes appear to drive an improvement in insulin sensitivity in obese animals.
Figure 10 with 1 supplement see all
Inactivation of Zfp423 in adult mural cells leads to beige, rather than white, adipocyte hyperplasia in diet-induced obesity.
(A) Chow-fed 6 weeks-old animals were first administered Dox-containing chow for 9 days in order to inactive Zfp423 and induce permanent mGFP expression in Pdgfrb+ cells. Mice were then switched to a high-fat diet (HFD) containing Dox. After 8 weeks of Dox-HFD, the mice were treated daily with CL316,243 (1 mg/kg/24 hr) or vehicle (PBS) for 4 weeks. (B) Weekly body weight measurements of obese control and iMural-KO mice following vehicle or CL316,243 administration. n = 6–8 mice. (C) Fat depot weights (normalized to body weight) of control and iMural-KO mice after vehicle or CL316,243 administration. * denotes p<0.05 from unpaired Student’s t-test. n = 6–8 mice. (D–G) Representative confocal images of Perilipin (red), mGFP (green) and DAPI (blue) immunostaining of gWAT sections obtained from control and iMural-KO mice administered vehicle (D, E), or CL316,243 (F, G). (H) Digital enhancement of region outlined in (G). (I) Glucose tolerance tests of control and iMural-KO mice following vehicle or CL316,243 administration. * denotes p<0.05 from unpaired Student’s t-test. n = 6–8 mice. (J) Serum insulin levels measured during intraperitoneal glucose tolerance tests of control and iMural-KO mice following vehicle or CL316,243 administration. n = 6–8 mice. (K) Insulin tolerance tests of control and iMural-KO mice following vehicle or CL316,243 administration. * denotes p<0.05 from unpaired Student’s t-test. n = 6–8 mice.
Discussion
It is now certain that adult humans have appreciable amounts of thermogenic adipose tissue consisting of brown and beige adipocytes (Cypess et al., 2013; Shinoda et al., 2015; van Marken Lichtenbelt et al., 2009; Virtanen et al., 2009). Upon activation, thermogenic adipose tissue in lean adults can impact glucose and lipid homeostasis (Chondronikola et al., 2014, 2016; Cypess et al., 2015); however, it still remains unclear as to whether sufficient amounts of thermogenic adipose tissue are present in obese individuals to exert beneficial therapeutic effects, even when fully activated. As such, there is tremendous interest in identifying strategies to increase the mass of functional thermogenic adipose tissue in obese patients with metabolic syndrome. To this end, a number of studies have now identified pathways/factors that can drive the natural formation of subcutaneous beige adipocytes or classic brown adipocytes (Harms and Seale, 2013). The negative impacts of visceral expansion during obesity on metabolic health make visceral fat a prime target for therapeutic intervention; however, effective strategies to improve the health of visceral WAT health have yet to emerge. In particular, whether browning of visceral depots, much like the browning of subcutaneous adipose tissue, would exert beneficial metabolic effects has been unclear.
We recently reported that Zfp423 is a suppressor of the thermogenic gene program in adipocytes. Using this discovery as a tool, we reveal here that the thermogenic potential of visceral adipose depots in mice can be unlocked through removal of Zfp423. Importantly, these data provide proof of concept that white adipose precursors in adult animals can be redirected to a beige-like adipocyte fate and improve insulin sensitivity in obesity. Overall, we observed beneficial effects of visceral WAT browning on nutrient homeostasis and cold tolerance. Nevertheless, we cannot exclude the possibility that inducing the thermogenic capacity of these depots may have detrimental effects under other physiological conditions not examined. Elevated expression of Zfp423 in visceral white adipocytes provides one explanation as to how visceral WAT depots resist adopting a thermogenic phenotype; however, it remains unclear as to why visceral WAT depots would adopt these anti-thermogenic mechanisms.
Inactivation of Zfp423 in visceral WAT gives rise to thermogenic adipocytes that share properties of subcutaneous beige adipocytes and classic brown adipocytes. In particular, Zfp423 deletion in visceral WAT unlocks a functionally significant portion of the thermogenic gene program characteristic of activated (β3 adrenergic receptor activated) beige adipose tissue. Nevertheless, global gene expression profiling suggests that Zfp423-deficient visceral WAT largely retains a visceral WAT molecular signature, rather than adopting the global molecular program characteristic of subcutaneous WAT. Additional gene expression studies of isolated visceral and inguinal Ucp1+ adipocytes will be needed to fully characterize the similarities and differences between the anatomically distinct thermogenic fat cells. During preparation of this manuscript, Kirichok and colleagues reported the existence of two distinct types of thermogenic beige adipocytes present in visceral depots of mice stimulated with the β3-adrenergic receptor agonist for 10 days (Bertholet et al., 2017). In particular, Bertholet et al. revealed that most thermogenic adipocytes in visceral WAT are devoid of Ucp1 protein and instead employ futile creatine cycling for thermogenesis. Zfp423-deficient visceral adipocytes express Ucp1 protein; however, the precise contribution of Ucp1-mediated uncoupling vs. creatine cycling in these cells remains unclear.
Our data here highlight the ability of thermogenic adipocytes, even within the visceral compartment, to drive vast improvements in nutrient homeostasis in obese mice, without impacting body weight. Moreover, the mural cell knockout model of Zfp423 even suggests that a relatively low frequency of activated multilocular Zfp423-deficient visceral adipocytes (5–10% of adipocytes in β3-agonist treated obese iMural-KO mice) can lead to improved insulin sensitivity. This is surprising given the opinion that such small numbers of beige cells are not likely to confer significant benefit (Kalinovich et al., 2017). We, of course, cannot rule out the possibility that Zfp423 deficiency may impact the visceral adipose phenotype in a multitude of ways that influence energy metabolism. It is notable that in the Vis-KO model, the data largely point to the liver as a major site of improved insulin sensitivity. Previously reported work on Prdm16 and subcutaneous WAT beiging suggest a strong connection between subcutaneous beige cells and liver health (Cohen et al., 2014). For the field at large, it remains an open question as to how brown/beige adipocytes exert beneficial effects on systemic metabolism, independent of their impact on body weight. This unique model may serve as a tool to explore the mechanisms of how visceral WAT browning leads to improved glucose metabolism.
We consistently observed a modest, yet statistically significant, induction of the thermogenic gene program in the inguinal WAT depots of both genetic models. There is a limit to our ability to interpret these results from the iMural-KO mice. Inguinal adipocyte differentiation is not impacted in this model; however, Zfp423 is still inactivated in mural cells of this depot. It is not possible to exclude additional roles for Zfp423 in mural cells of iWAT or other tissues. Nevertheless, the dependency of the improved insulin sensitivity in obese iMural-KO mice on β3-adrenergic receptor activation does suggest that the increased numbers of thermogenic visceral adipocytes, at least in part, contribute to the phenotypes observed here. In the Vis-KO model, inactivation of Zfp423 is limited to visceral WAT depots. The subcutaneous WAT phenotype in this model is thus not cell autonomous and appears secondary to the visceral phenotype. It is possible that Zfp423-deficient visceral adipocytes produce circulating adipokines that influence systemic metabolism and thermogenesis. In fact, more and more ‘Batokines’ have recently emerged (Lynes et al., 2017; Svensson et al., 2016; Thomou et al., 2017; Villarroya et al., 2017). It is also possible that secondary browning of subcutaneous WAT may be triggered through central effects mediated by a visceral WAT to brain neural relay.
A multitude of studies now support the idea that visceral adipocytes are developmentally, molecularly, and functionally, distinct from subcutaneous adipocytes. Our prior work revealed a critical role for Zfp423 in 3T3-L1 adipogenesis and in the regulation of Pparg and the fetal formation of subcutaneous white adipocytes in vivo (Gupta et al., 2010; Shao et al., 2017). Our work here reveals that Zfp423 is dispensable for the differentiation of visceral adipocytes within those visceral depots examined. Thus, Zfp423 expression defines mural white preadipocytes within visceral depots of adult mice; however, other factors can compensate for its absence in the initial stages of adipocyte differentiation, but not in suppressing the thermogenic gene program. The lack of impact on adipocyte differentiation was unexpected; however, this result is perhaps not surprising in light of recent studies of another pro-adipogenic transcription factor, Cebpa. In vitro, Cebpa is amongst the most critical adipogenesis factors; however, in vivo, it appears essential for postnatal, but not fetal, terminal differentiation of fat cells (Wang et al., 2015). Thus, despite the expression of Cebpa throughout the adipose lineage, there appears to be temporal requirements for this particular factor. These data, along with other studies, highlight the emerging concept that distinct transcriptional regulatory mechanisms govern fetal vs. adult adipogenesis (Jeffery et al., 2015; Wang et al., 2015). Our data here further highlight the complexity in the regulation of adipogenesis in vivo by demonstrating the depot-specific requirements of pro-adipogenic transcription factors.
Zfp423 expression in the adipose lineage appears highly regulated. Levels of Zfp423 in white adipocytes are reduced following cold exposure and β-adrenergic receptor agonism, and increased in brown adipose depots undergoing a ‘whitening’ transformation with age or in obesity (Shao et al., 2016). The dynamic expression of Zfp423, along with the loss of function data from our genetic mouse models, reveals Zfp423 as a critical physiological suppressor of the adipocyte thermogenic gene program. Future studies into the regulation of Zfp423 expression in adipocytes and/or mural adipose precursors may lead to novel strategies to unlock the thermogenic potential of visceral adipose tissue and combat the chronic metabolic defects associated with visceral obesity.
Materials and methods
Animals
All animal experiments were performed according to procedures approved by the UTSW Animal Care and Use Committee. PdgfrbrtTA transgenic mice (C57BL/6-Tg(Pdgfrb-rtTA)58Gpta/J; JAX 028570; RRID:IMSR_JAX:028570) were previously described (Vishvanath et al., 2016). TRE-Cre (B6.Cg-Tg(tetO-cre)1Jaw/J; JAX 006234; RRID:IMSR_JAX:006234), Rosa26RmT/mG (B6.129(Cg)-Gt(ROSA)26Sortm4(ACTB-tdTomato,-EGFP)Luo/J; JAX 007676; RRID:IMSR_JAX:007676), and WT1-Cre (Wt1tm1(EGFP/cre)Wtp/J; JAX 010911; RRID:IMSR_JAX:010911) mice were obtained from Jackson Laboratories. Zfp423loxP/loxP mice were a gift from Dr. S. Warming (Genentech) (Warming et al., 2006). Mice were maintained on a 12-hr light/dark cycle in a temperature-controlled environment (room temperature, 22°C; thermoneutrality, 30°C; cold exposure, 6°C). Mice were given free access to food and water, and maintained on a standard chow diet, Dox-containing chow (600 mg/kg doxycycline, Bio-Serv, S4107), or a dox-containing HFD (600 mg/kg dox, 60% kcal% fat, BioServ, S5867). For acute β−3 adrenergic agonist administration, mice were transferred to 30°C chambers for two weeks then injected intraperitoneally with vehicle or CL316243 (1 mg/kg/day) for 3 days. For chronic β−3 adrenergic agonist administration, mice were anesthetized by 2% isoflurane, and Alzet osmotic minipumps filled with vehicle (PBS) or CL 316243 (1mg/kg/24 hr) were implanted subcutaneously in the dorsal region of the animals.
Histological analysis
Request a detailed protocolAdipose tissues were harvested from perfused (4% paraformaldehyde) adult mice. Paraffin processing and embedding was performed by the Molecular Pathology Core Facility at UTSW. Indirect immunofluorescence was performed as previously described (Vishvanath et al., 2016). Antibodies used for immunofluorescence include: anti-GFP 1:700 (Abcam ab13970, RRID:AB_300798), anti-perilipin 1:1500 (Fitzgerald 20R-PP004, RRID:AB_1288416), anti-chicken Alexa 488 1:200 (Invitrogen, RRID:AB_142924), anti-guinea pig Alexa 647 1:200 (Invitrogen, RRID:AB_141882), and anti-guinea pig Alexa 488 1:200 (Invitrogen, RRID:AB_142018). For Ucp1 immunohistochemistry, paraffin-embedded sections were incubated with anti-Ucp1 (Abcam ab10983; 1:500, RRID:AB_2241462), followed by secondary and tertiary signal amplification and detection using biotinylated anti-rabbit secondary (Vector BA-1100, RRID:AB_2336201), HRP-conjugated streptavidin (Dako), and DAB substrate (Thermo). For quantification of adipocyte hyperplasia, paraffin sections were stained with perilipin and GFP by indirect immunofluorescence. The number of GFP+ perilipin+ and GFP- perilipin+ adipocytes were counted on 8–10 randomly selected 10X images of stained WAT depots. A total of 3,000–5,000 perilipin+ adipocytes were counted from each mouse. Each data point represents the percentage of GFP+ perilipin+ adipocytes from one mouse.
Isolation of adipose tissue SVF and FACS
Request a detailed protocolSVF was isolated as previously described (Shao et al., 2016). Briefly, minced adipose tissue was placed in digestion buffer (100 mM HEPES pH 7.4, 120 mM NaCl, 50 mM KCl, 5 mM glucose, 1 m CaCl2, 1.5% BSA, and 1 mg/mL collagenase D (Roche 11088882001) and incubated in a 37°C shaking water bath for 2 hr. The mixture was then passed sequentially through a 100 µm cell strainer then a 40 µm cell strainer. Cells were blocked in 2% FBS/PBS containing anti-mouse CD16/CD32 Fc Block (clone 2.4G2; 1:200; RRID:AB_394657), then incubated with primary antibodies (anti-CD31 clone 390 1:200, RRID:AB_312903; anti-CD45 clone 30-F11 1:200, RRID:AB_312971; anti-CD140b clone APB5 3:200, RRID:AB_2268091). Cells were sorted using a FACSAriaTM flow cytometer (UTSW Flow Cytometry Core Facility).
Adipocyte differentiation assays
Request a detailed protocolAdipose tissue SVF was isolated as described above. Cells were plated onto collagen-coated dishes and incubated at 10% CO2. Gonadal SVF was maintained in growth media (60% pH7–7.4 low glucose DMEM, 40% pH 7.25 MCDB201 (Sigma M6770)), supplemented with 2% FBS (Fisher Scientific 03-600-511 Lot FB-002) 1% ITS premix (Insulin-Transferrin-Selenium) (BD Bioscience 354352), 0.1 mM L-ascorbic acid-2-2phosphate (Sigma A8960-5G), 10 ng/mL FGF basic (R&D systems 3139-FB-025/CF), Pen/Strep, and gentamicin. Inguinal SVF was maintained in DMEM/F12 (Invitrogen) supplemented with Glutamax, 10% FBS, Pen/Strep, and gentamicin. Upon reaching confluence, cultures were incubated with the adipogenesis induction cocktail (growth media supplemented with 5 mg/ml insulin, 1 μM dexamethasone, 0.5 mM isobutylmethyxanthine, and 1 μM rosiglitazone) for 48 hr. After 48 hr, the cells were maintained in growth media supplemented with 5 mg/ml insulin and 1 μM rosiglitazone until harvest.
Oil red O staining
Request a detailed protocolDifferentiated cells were fixed in 4% PFA for 15 min at room temperature then washed twice with water. Cells were incubated in Oil Red O working solution (2 g Oil red O in 60% isopropanol) for 10 min to stain accumulated lipids. Cells were then washed three times with water before bright field images were acquired.
Gene expression analysis
Request a detailed protocolRelative mRNA levels were determined by quantitative PCR using SYBR Green chemistry. Values were normalized to Rps18 levels using the ΔΔ-Ct method. Unpaired Student's t-test was used to evaluate statistical significance. All primer sequences are listed in Table 1. mRNA library preparation and RNA-sequencing was performed by the McDermott Center Sequencing Core at UT Southwestern. Total RNA used for library preparation was extracted from gonadal, inguinal, and brown adipose tissues of Control and Vis-KO mice after 3 days of treatment with CL-316,243 at thermoneutrality, as described above. Sequencing was performed on an Illumina HiSeq 2500 and reads were mapped to the mouse genome (mm10). Analysis was performed by the UT Southwestern McDermott Bioinformatics Core using Cufflinks/Cuffdiff software. Genes with an FDR < 0.05 were considered significantly differentially expressed between groups compared. Heatmaps were generated using the Pheatmap package in RStudio (v3.3). The cluster dendogram was generated using Hierarchical Cluster Analysis in RStudio (v3.3). Gene Ontology analysis was performed using the DAVID Functional Annotation tool (https://david.ncifcrf.gov/) on differentially expressed genes between groups compared. Functional annotation for gene ontology using the GOTERM_CC_FAT category was selected and biological processes were assessed for statistical significance. All raw sequencing data has been deposited to Gene Expression Omnibus (https://www.ncbi.nlm.nih.gov/geo/query/acc.cgi?acc=GSE98132).
Table 1
qPCR primer sequences utilized for gene expression analysis
| Gene | Forward 5'−3' | Reverse 5'−3' |
|---|---|---|
| Adipoq | AGATGGCACTCCTGGAGAGAA | TTCTCCAGGCTCTCCTTTCCT |
| Adipsin | CTACATGGCTTCCGTGCAAGT | AGTCGTCATCCGTCACTCCAT |
| Cidea | TCCTATGCTGCACAGATGACG | TGCTCTTCTGTATCGCCCAGT |
| Cited1 | AACCTTGGAGTGAAGGATCGC | GTAGGAGAGCCTATTGGAGATGT |
| Dio2 | CATTGATGAGGCTCACCCTTC | GGTTCCGGTGCTTCTTAACCT |
| Ear2 | CCACAAAGCAGACAGGGAAAC | GCATGAGGCAAGCATTAGGAC |
| Elovl3 | GTGTGCTTTGCCATCTACACG | CTCCCAGTTCAACAACCTTGC |
| Fabp4 | GATGAAATCACCGCAGACGAC | ATTCCACCACCAGCTTGTCAC |
| Foxo1 | GGCACTCCAAAACAGGACTTG | AAGAAATGGCAGAGGGAGGAG |
| G6pc | GGGCTGTTTGAGGAAAGTGTG | TATCCGACAGGAGGCTGGTAA |
| Gsta3 | AGATCGACGGGATGAAACTGG | CAGATCCGCCACTCCTTCT |
| Hoxa9 | CCCCGACTTCAGTCCTTGC | GATGCACGTAGGGGTGGTG |
| Lhx8 | GAGCTCGGACCAGCTTCA | TTGTTGTCCTGAGCGAACTG |
| Pck1 | TGTCTGTCCCATTGTCCACAG | AAGGTAAGGAAGGGCGGTGTA |
| Pgc1α | GCACCAGAAAACAGCTCCAAG | CGTCAAACACAGCTTGACAGC |
| Pparg2 | GCATGGTGCCTTCGCTGA | TGGCATCTCTGTGTCAACCATG |
| Prdm16 | ACACGCCAGTTCTCCAACCTGT | TGCTTGTTGAGGGAGGAGGTA |
| Resistin | AAGAACCTTTCATTTCCCCTCCT | GTCCAGCAATTTAAGCCAATGTT |
| Rps18 | CATGCAAACCCACGACAGTA | CCTCACGCAGCTTGTTGTCTA |
| Tcf21 | CCCTGAAAGTGGACTCCAACA | GCTGAGCGGGCTTTTCTTAGT |
| Tle3 | GAGACTGAACACAATCCTAGCC | GGAGTCCACGTACCCCGAT |
| Tmem26 | AGGGGCTTCCTTAGGGTTTTC | CCGTCTTGGATGAAGAAGCTG |
| Ucp1 | TCTCAGCCGGCTTAATGACTG | GGCTTGCATTCTGACCTTCAC |
| Wt1 | ATAGGCCAGGGCATGTGTATG | CTGGTGCCTTGCTCTCTGATT |
| Zfp423 | CAGGCCCACAAGAAGAACAAG | GTATCCTCGCAGTAGTCGCACA |
| Zic1 | CTGTTGTGGGAGACACGATG | CCTCTTCTCAGGGCTCACAG |
Metabolic phenotyping
Request a detailed protocolMetabolic cage studies were conducted using TSE Phenomaster cages (TSE Systems, Chesterfield, Missouri) at the USTW Metabolic Phenotyping Core. Mice were acclimated in the metabolic chambers for 5 days before the start of the experiments. Food intake, movement, and CO2 and O2 levels were measured every 60 min for each mouse over a period of 5 days. For glucose tolerance tests, mice were fasted overnight and then administered glucose by intraperitoneal injection (1 g/kg body weight, Sigma). For insulin tolerance tests, mice were fasted for 4 hr and then administered insulin by intraperitoneal injection (0.75 U/kg body weight human insulin, Eli Lilly). At the indicated time-points, tail blood was collected. Hyperinsulinemic euglycemic clamps were performed on conscious, unrestrained mice as previously described (Holland et al., 2011). Blood glucose was measured using Bayer Contour glucometers. Serum triglycerides were measured using Infinity Triglycerides Reagent (Thermo Fisher Scientific). Serum insulin was measured using Ultra Sensitive Mouse Insulin ELISA (Crystal Chem).
Cold exposure
Request a detailed protocolMice 8 weeks of age were transferred to a 30°C chamber (thermoneutrality) for two weeks. One week before cold exposure, IPTT-300 temperature transponders (Bio Medic Data Systems) were implanted subcutaneously in the dorsal region of the mice. Body temperature was assessed using a DAS-7006/7 s reader (Bio Medic Data Systems). The mice were then transferred to the cold chamber (6°C) or maintained at thermoneutrality. For the acute cold tolerance test, food was removed from the cages upon transfer to the cold chamber and body temperature was measured at the indicated time points. For the acclimated cold exposure test, food was removed from the cages after 4 weeks of acclimation to cold and body temperature was measured at the indicated time points.
Mitochondrial function and respiration
Request a detailed protocolAdipose tissue fragments or cultured adipocytes were assayed for oxygen consumption rate (OCR) using an XF24 Extracellular Flux Analyzer (Seahorse Bioscience, MA). Assays of mitochondrial function and respiration rates in whole adipose tissues or cells were performed as previously described (Shao et al., 2016). In brief, adipose tissue was cut into 5–10 mg pieces and locked into an XF24 islet-capture Microplate (Seahorse Bioscience). Adipose tissues or cultured adipocytes were equilibrated for 1 hr at 37°C in a CO2-free incubator in XF Assay Medium (Modified DMEM, 0 mM Glucose; Seahorse Bioscience) (pH 7.4), supplemented with 1 mM sodium pyruvate, 1 mM L- Glutamine and 7 mM glucose. Tissues or cells were subjected to a 10 min equilibration period and three assay cycles to measure the basal rate, comprising a 3 min mix, a 2 min wait and a 3 min measure period each. For cells, compounds were then added by automatic pneumatic injection followed by assay cycles after each, comprising of 3 min mix, 2 min wait and a 3 min measure period. OCR measurements were obtained following sequential additions of oligomyin (3 µM final concentration), FCCP (9 µM) and antimycinA/rotenone (3 µM/30 nM). OCR measurements were recorded at set interval time points. All compounds and materials above were obtained from Sigma-Aldrich.
Statistical analysis
Request a detailed protocolAll data were expressed as the mean ± SEM. We used GraphPad Prism 7.0 (GraphPad Software, Inc., La Jolla, CA, USA) to perform the statistical analyses. Each experiment was performed at least twice and representative data are shown. For comparisons between two independent groups, a Student’s t-test was used and p<0.05 was considered statistically significant. The sample size estimation was determined as described below. All the detailed sample sizes, statistical test methods, and p-values are listed in Table 2. Longitudinal metabolic cohorts were designed to detect a 25% improvement of glucose tolerance or a similar magnitude of insulin resistance with an assumed 15% standard deviation of the group means at a power of 80% and an alpha of 0.05. This predicted approximately six animals per test group. All animals in the cohort were subsequently used for downstream assays (gene expression, IHC, western blot) to eliminate selection bias. We estimated the approximate effect size based on independent preliminary studies. Studies designed to characterize an in vitro difference in metabolic flux were estimated to have a slightly larger effect size of 30% with assumed 15% standard deviation of group means. To detect this difference at a power of 80% and an alpha of 0.05, we predicted we would need four independent replicates per group. We estimated this effect size based on independent preliminary studies.
Table 2
Statistical information.
| Figure | N(sample size) | Statistical test method | Description | p-value | |
|---|---|---|---|---|---|
| 1B | Control n = 6 | Unpaired Student’s t test | gWAT | 4.56E-08 | |
| Vis-KO n = 6 | mWAT | 0.0019 | |||
| rWAT | 0.0002 | ||||
| 1D | Control n = 6 | Unpaired Student’s t test | iWAT | 0.0043 | |
| Vis-KO n = 6 | gWAT | 0.0051 | |||
| 1E | Control n = 6 | Unpaired Student’s t test | iWAT | Adipoq | 0.0111 |
| Vis-KO n = 6 | gWAT | Adipsin | 0.004 | ||
| 1F | Control n = 6 | Unpaired Student’s t test | iWAT | Cidea | 0.012678087 |
| Vis-KO n = 6 | Dio2 | 0.015258263 | |||
| Elovl3 | 0.035976522 | ||||
| Prdm16 | 0.043549713 | ||||
| gWAT | Cidea | 6.91848E-06 | |||
| Dio2 | 0.017046004 | ||||
| Prdm16 | 9.5932E-05 | ||||
| mWAT | Cidea | 0.008754783 | |||
| Dio2 | 0.013198702 | ||||
| Prdm16 | 0.018964447 | ||||
| rWAT | Cidea | 4.6109E-07 | |||
| Dio2 | 0.000934576 | ||||
| Prdm16 | 0.000260661 | ||||
| 1G | Control n = 6 | Unpaired Student’s t test | iWAT | 0.019621248 | |
| Vis-KO n = 6 | gWAT | 0.002534473 | |||
| mWAT | 0.000189507 | ||||
| rWAT | 7.14636E-06 | ||||
| 1H | Control n = 4 | Unpaired Student’s t test | gWAT | Basal | 0.02847 |
| Vis-KO n = 4 | |||||
| 1I | Control n = 4 | Unpaired Student’s t test | mWAT | Basal | 0.00457 |
| Vis-KO n = 4 | |||||
| 1J | Control n = 4 | Unpaired Student’s t test | rWAT | Basal | 0.04901 |
| Vis-KO n = 4 | |||||
| 1K | Control n = 4 | Unpaired Student’s t test | iWAT | Basal | 0.03254 |
| Vis-KO n = 4 | |||||
| 2B | Control n = 4 | Unpaired Student’s t test | Inguinal | Adipoq | 0.00251 |
| Vis-KO n = 4 | |||||
| 2D | Control n = 4 | Unpaired Student’s t test | Gonadal | Zfp423 | 2.1E-06 |
| Vis-KO n = 4 | |||||
| 2E | Control n = 4 | Unpaired Student’s t test | Gonadal | Cidea (red bar) | 3.1573E-06 |
| Vis-KO n = 4 | Cidea (blue bar) | 0.028888184 | |||
| Dio2 | 0.039314815 | ||||
| Ppargc1a | 0.00022784 | ||||
| Ucp1 (red bar) | 0.004431674 | ||||
| Ucp1 (blue bar) | 0.000356176 | ||||
| 2F | Control n = 4 | Unpaired Student’s t test | Gonadal | Basal | 6.73733E-05 |
| Vis-KO n = 4 | Oligo. | 0.000488801 | |||
| FCCP | 0.02909696 | ||||
| 2G | Control n = 4 | Unpaired Student’s t test | Gonadal | 0.03356 | |
| Vis-KO n = 4 | |||||
| 2H | Control n = 4 | Unpaired Student’s t test | Gonadal | Gsta3 | 0.019517318 |
| Vis-KO n = 4 | Tcf21 | 0.014978261 | |||
| Wt1 | 0.000632618 | ||||
| Ear2 | 0.009978141 | ||||
| Hoxa9 | 0.000427928 | ||||
| Tmem26 | 0.004299176 | ||||
| Zic1 | 0.034783957 | ||||
| 3A | Control n = 5 | Unpaired Student’s t test | gWAT | 0.000759641 | |
| Vis-KO n = 4 | rWAT | 0.001739073 | |||
| 3B | Control n = 5 | Cidea | 0.000155141 | ||
| Vis-KO n = 4 | Dio2 | 0.009600651 | |||
| Prdm16 (red bar) | 0.002457629 | ||||
| Prdm16 (blue bar) | 7.9394E-05 | ||||
| 3G | Control n = 5 | Unpaired Student’s t test | gWAT | Gsta3 | 0.044793954 |
| Vis-KO n = 4 | Resistin | 0.002421899 | |||
| Tmem26 | 0.011651978 | ||||
| 5A | Control n = 5 | Unpaired Student’s t test | gWAT | Ucp1 | 0.011438323 |
| Vis-KO n = 4 | rWAT | Ucp1 | 0.001188624 | ||
| 5B | Control n = 5 | Unpaired Student’s t test | rWAT | Cidea | 0.000780591 |
| Vis-KO n = 4 | Dio2 | 0.002682038 | |||
| Elovl3 | 0.01642267 | ||||
| Prdm16 (red bar) | 0.042213109 | ||||
| Prdm16 (blue bar) | 0.000810897 | ||||
| gWAT | Dio2 | 0.0221 | |||
| Prdm16 | 0.0127 | ||||
| 5L | Control n = 5 | Unpaired Student’s t test | t = 4 hr | 0.014972958 | |
| Vis-KO n = 4 | t = 5 hr | 0.035138826 | |||
| 6D | Control n = 7 | Unpaired Student’s t test | gWAT | Zfp423 | 0.002716658 |
| Vis-KO n = 6 | mWAT | Zfp423 | 0.042346922 | ||
| rWAT | Zfp423 | 0.018568608 | |||
| 6E | Control n = 7 | Unpaired Student’s t test | iWAT | Ucp1 | 0.002716658 |
| Vis-KO n = 6 | gWAT | Ucp1 | 0.042346922 | ||
| rWAT | Ucp1 | 0.018568608 | |||
| 6F | Control n = 7 | Unpaired Student’s t test | iWAT | Cidea | 0.044864901 |
| Vis-KO n = 6 | gWAT | Cidea | 0.011872021 | ||
| Prdm16 | 0.046343663 | ||||
| 6H | Control n = 4 | Unpaired Student’s t test | gWAT | 0.00648 | |
| Vis-KO n = 4 | |||||
| 6I | Control n = 4 | Unpaired Student’s t test | mWAT | 0.03908 | |
| Vis-KO n = 4 | |||||
| 6J | Control n = 4 | Unpaired Student’s t test | rWAT | 0.03982 | |
| Vis-KO n = 4 | |||||
| 7D | Control n = 4 | Unpaired Student’s t test | O2 Consumption | 24 hr | 0.020700477 |
| Vis-KO n = 5 | Dark | 0.006034333 | |||
| 7E | Control n = 4 | Unpaired Student’s t test | Heat Production | 24 hr | 0.022957861 |
| Vis-KO n = 5 | Dark | 0.007378241 | |||
| 7F | Control n = 4 | Unpaired Student’s t test | CO2 Production | 24 hr | 0.041576891 |
| Vis-KO n = 5 | Dark | 0.017964281 | |||
| 8A | Control n = 7 | Unpaired Student’s t test | t = 0 min | 0.043779825 | |
| Vis-KO n = 6 | t = 15 min | 0.004769743 | |||
| t = 30 min | 0.012903721 | ||||
| t = 60 min | 0.014915684 | ||||
| 8B | Control n = 7 | Unpaired Student’s t test | t = 0 min | 0.009873322 | |
| Vis-KO n = 6 | t = 30 min | 0.01583899 | |||
| 8C | Control n = 7 | Unpaired Student’s t test | t = 30 min | 0.0426 | |
| Vis-KO n = 6 | |||||
| 8D | Control n = 6 | Unpaired Student’s t test | Glucose Infusion Rate | 0.04689 | |
| Vis-KO n = 5 | |||||
| 8E | Control n = 6 | Unpaired Student’s t test | Hepatic Glucose Prod. | Basal | 0.039627397 |
| Vis-KO n = 5 | Clamped | 0.0346953 | |||
| 8F | Control n = 7 | Unpaired Student’s t test | Liver | Foxo1 | 0.046418578 |
| Vis-KO n = 6 | G6Pc | 0.024438785 | |||
| Pck1 | 0.047698079 | ||||
| 8G | Control n = 7 | Unpaired Student’s t test | TAG | 0.02449 | |
| Vis-KO n = 6 | |||||
| 8I | Control n = 4 | Unpaired Student’s t test | 2-DG Uptake | rWAT | 0.04023 |
| Vis-KO n = 5 | |||||
| 9B | Control n = 4 | Unpaired Student’s t test | Pdgfrβ cells | 1.1E-05 | |
| iMural-KO n = 5 | |||||
| 10C | Control n = 8 | Unpaired Student’s t test | gWAT | 0.00276 | |
| iMural-KO n = 6 | |||||
| 10I | Control n = 8 | Unpaired Student’s t test | t = 30 min | 0.003328841 | |
| iMural-KO n = 6 | t = 60 min | 0.048919491 | |||
| 10K | Control n = 8 | Unpaired Student’s t test | t = 15 min | 0.03752 | |
| iMural-KO n = 6 | |||||
| 10-S1C | Control n = 7 | Unpaired Student’s t test | gWAT | 7.8E-08 | |
| iMural-KO n = 7 | |||||
| 10-S1E | Control n = 8 | Unpaired Student’s t test | iWAT | Ucp1 | 0.015960549 |
| iMural-KO n = 6 | gWAT | Ucp1 | 0.005703268 | ||
| rWAT | Ucp1 | 0.011883251 | |||
| 10-S1F | Control n = 5 | Unpaired Student’s t test | iWAT | 0.00019253 | |
| Vis-KO n = 5 | gWAT | 0.042623514 | |||
| mWAT | 0.017424031 | ||||
| rWAT | 0.00228672 | ||||
Data availability
-
Adipose tissue from β-3 agonist-treated micePublicly available at the NCBI Gene Expression Omnibus (accession no: GSE98132).
References
-
Developmental origins of the adipocyte lineage: new insights from genetics and genomics studiesStem Cell Reviews and Reports 8:55–66.https://doi.org/10.1007/s12015-011-9242-x
-
Depressed expression of adipocyte beta-adrenergic receptors is a common feature of congenital and diet-induced obesity in rodentsInternational Journal of Obesity 23:669–677.https://doi.org/10.1038/sj.ijo.0800894
-
The beta-adrenergic receptors and the control of adipose tissue metabolism and thermogenesisRecent Progress in Hormone Research 56:309–328.https://doi.org/10.1210/rp.56.1.309
-
Brown and beige fat: development, function and therapeutic potentialNature Medicine 19:1252–1263.https://doi.org/10.1038/nm.3361
-
The expanding problem of adipose depot remodeling and postnatal adipocyte progenitor recruitmentMolecular and Cellular Endocrinology 445:95–108.https://doi.org/10.1016/j.mce.2016.10.011
-
Sorting out adipocyte precursors and their role in physiology and diseaseGenes & Development 31:127–140.https://doi.org/10.1101/gad.293704.116
-
Rapid depot-specific activation of adipocyte precursor cells at the onset of obesityNature Cell Biology 17:376–385.https://doi.org/10.1038/ncb3122
-
Biology of upper-body and lower-body adipose tissue--link to whole-body phenotypesNature Reviews Endocrinology 11:90–100.https://doi.org/10.1038/nrendo.2014.185
-
Obesity-associated improvements in metabolic profile through expansion of adipose tissueJournal of Clinical Investigation 117:2621–2637.https://doi.org/10.1172/JCI31021
-
Relation of body fat distribution to metabolic complications of obesityThe Journal of Clinical Endocrinology & Metabolism 54:254–260.https://doi.org/10.1210/jcem-54-2-254
-
Impact of obesity on metabolism in men and women. importance of regional adipose tissue distributionJournal of Clinical Investigation 72:1150–1162.https://doi.org/10.1172/JCI111040
-
Adipose tissue heterogeneity: implication of depot differences in adipose tissue for obesity complicationsMolecular Aspects of Medicine 34:1–11.https://doi.org/10.1016/j.mam.2012.10.001
-
Gluteofemoral body fat as a determinant of metabolic healthInternational Journal of Obesity 34:949–959.https://doi.org/10.1038/ijo.2009.286
-
Sex and depot differences in ex vivo adipose tissue fatty acid storage and glycerol-3-phosphate acyltransferase activityAmerican Journal of Physiology - Endocrinology and Metabolism 308:E830–E846.https://doi.org/10.1152/ajpendo.00424.2014
-
Prdm16 determines the thermogenic program of subcutaneous white adipose tissue in miceJournal of Clinical Investigation 121:96–105.https://doi.org/10.1172/JCI44271
-
Cold-activated brown adipose tissue in healthy menNew England Journal of Medicine 360:1500–1508.https://doi.org/10.1056/NEJMoa0808718
-
Brown adipose tissue as a secretory organNature Reviews Endocrinology 13:26–35.https://doi.org/10.1038/nrendo.2016.136
-
Functional brown adipose tissue in healthy adultsNew England Journal of Medicine 360:1518–1525.https://doi.org/10.1056/NEJMoa0808949
-
The adipose organ of obesity-prone C57BL/6J mice is composed of mixed white and brown adipocytesJournal of Lipid Research 53:619–629.https://doi.org/10.1194/jlr.M018846
-
Distinct regulatory mechanisms governing embryonic versus adult adipocyte maturationNature Cell Biology 17:1099–1111.https://doi.org/10.1038/ncb3217
-
Zfp423 is required for normal cerebellar developmentMolecular and Cellular Biology 26:6913–6922.https://doi.org/10.1128/MCB.02255-05
Article and author information
Author details
Funding
National Institutes of Health (R01 DK104789)
- Rana K Gupta
National Institutes of Health (R00-DK094973)
- William L Holland
American Heart Association (16POST26420136)
- Mengle Shao
Searle Scholars Program
- Rana K Gupta
Juvenile Diabetes Research Foundation (5-CDA-2014-185-A-N)
- William L Holland
National Institutes of Health (F30 DK100095)
- Jonathan Y Xia
National Institutes of Health (T32 GM008203)
- Chelsea Hepler
National Institutes of Health (F31DK113696)
- Chelsea Hepler
The funders had no role in study design, data collection and interpretation, or the decision to submit the work for publication.
Acknowledgements
The authors are grateful to members of the UTSW Touchstone Diabetes Center for useful discussions, and Drs. P Scherer, and C Kusminski for critical reading of the manuscript. The authors thank the UTSW Animal Resource Center, McDermott Sequencing Center, Metabolic Phenotyping Core, Pathology Core, Live Cell Imaging Core, and Flow Cytometry Core for excellent guidance and assistance with experiments performed here. This study was supported by the Searle Scholars Program (Chicago, IL) and NIDDK R01 DK104789 to RKG, NIDDK R00-DK094973 and JDRF Award 5-CDA-2014–185-A-N to WLH, F30 DK100095 to JYX, the American Heart Association postdoctoral fellowship, 16POST26420136, to MS, F31 DK113696-01 and NIH NIGMS T32 GM008203, to CH.
Ethics
Animal experimentation: This study was performed in strict accordance with the recommendations in the Guide for the Care and Use of Laboratory Animals of the National Institutes of Health. All of the animals were handled according to approved institutional animal care and use committee (IACUC) protocols (APN 2012-0072 and APN 2015-101207 ) of UTSW Medical Center.
Version history
- Received: April 11, 2017
- Accepted: July 18, 2017
- Accepted Manuscript published: July 19, 2017 (version 1)
- Version of Record published: August 10, 2017 (version 2)
Copyright
© 2017, Hepler et al.
This article is distributed under the terms of the Creative Commons Attribution License, which permits unrestricted use and redistribution provided that the original author and source are credited.
Metrics
-
- 3,264
- views
-
- 746
- downloads
-
- 36
- citations
Views, downloads and citations are aggregated across all versions of this paper published by eLife.
Download links
A two-part list of links to download the article, or parts of the article, in various formats.
Downloads (link to download the article as PDF)
Open citations (links to open the citations from this article in various online reference manager services)
Cite this article (links to download the citations from this article in formats compatible with various reference manager tools)
Directing visceral white adipocyte precursors to a thermogenic adipocyte fate improves insulin sensitivity in obese mice
eLife 6:e27669.
https://doi.org/10.7554/eLife.27669
Further reading
-
- Medicine
Irisin, released from exercised muscle, has been shown to have beneficial effects on numerous tissues but its effects on bone are unclear. We found significant sex and genotype differences in bone from wildtype (WT) mice compared to mice lacking Fndc5 (knockout [KO]), with and without calcium deficiency. Despite their bone being indistinguishable from WT females, KO female mice were partially protected from osteocytic osteolysis and osteoclastic bone resorption when allowed to lactate or when placed on a low-calcium diet. Male KO mice have more but weaker bone compared to WT males, and when challenged with a low-calcium diet lost more bone than WT males. To begin to understand responsible molecular mechanisms, osteocyte transcriptomics was performed. Osteocytes from WT females had greater expression of genes associated with osteocytic osteolysis and osteoclastic bone resorption compared to WT males which had greater expression of genes associated with steroid and fatty acid metabolism. Few differences were observed between female KO and WT osteocytes, but with a low-calcium diet, the KO females had lower expression of genes responsible for osteocytic osteolysis and osteoclastic resorption than the WT females. Male KO osteocytes had lower expression of genes associated with steroid and fatty acid metabolism, but higher expression of genes associated with bone resorption compared to male WT. In conclusion, irisin plays a critical role in the development of the male but not the female skeleton and protects male but not female bone from calcium deficiency. We propose irisin ensures the survival of offspring by targeting the osteocyte to provide calcium in lactating females, a novel function for this myokine.
-
- Medicine
- Microbiology and Infectious Disease
Background:
End-stage renal disease (ESRD) patients experience immune compromise characterized by complex alterations of both innate and adaptive immunity, and results in higher susceptibility to infection and lower response to vaccination. This immune compromise, coupled with greater risk of exposure to infectious disease at hemodialysis (HD) centers, underscores the need for examination of the immune response to the COVID-19 mRNA-based vaccines.
Methods:
The immune response to the COVID-19 BNT162b2 mRNA vaccine was assessed in 20 HD patients and cohort-matched controls. RNA sequencing of peripheral blood mononuclear cells was performed longitudinally before and after each vaccination dose for a total of six time points per subject. Anti-spike antibody levels were quantified prior to the first vaccination dose (V1D0) and 7 d after the second dose (V2D7) using anti-spike IgG titers and antibody neutralization assays. Anti-spike IgG titers were additionally quantified 6 mo after initial vaccination. Clinical history and lab values in HD patients were obtained to identify predictors of vaccination response.
Results:
Transcriptomic analyses demonstrated differing time courses of immune responses, with prolonged myeloid cell activity in HD at 1 wk after the first vaccination dose. HD also demonstrated decreased metabolic activity and decreased antigen presentation compared to controls after the second vaccination dose. Anti-spike IgG titers and neutralizing function were substantially elevated in both controls and HD at V2D7, with a small but significant reduction in titers in HD groups (p<0.05). Anti-spike IgG remained elevated above baseline at 6 mo in both subject groups. Anti-spike IgG titers at V2D7 were highly predictive of 6-month titer levels. Transcriptomic biomarkers after the second vaccination dose and clinical biomarkers including ferritin levels were found to be predictive of antibody development.
Conclusions:
Overall, we demonstrate differing time courses of immune responses to the BTN162b2 mRNA COVID-19 vaccination in maintenance HD subjects comparable to healthy controls and identify transcriptomic and clinical predictors of anti-spike IgG titers in HD. Analyzing vaccination as an in vivo perturbation, our results warrant further characterization of the immune dysregulation of ESRD.
Funding:
F30HD102093, F30HL151182, T32HL144909, R01HL138628. This research has been funded by the University of Illinois at Chicago Center for Clinical and Translational Science (CCTS) award UL1TR002003.


