


ABSTRACT
Background: To evaluate whether knowledge of a personalized Diabetes Risk Score (DRS) improved performance in a 12-week lifestyle change program for prediabetes. Methods: Randomized subjects at four clinics provided samples for a DRS at baseline, 12, and 24 weeks. The intervention group received scores at each point, whereas the control group only received this information at 12 and 24 weeks. Outcomes included attendance and changes in weight, abdominal circumference, blood pressure, fasting glucose, hemoglobin A1c, cholesterol, and risk score. Results: Baseline characteristics were similar in the groups (n = 192) and within risk-stratified subgroups. At 12 weeks, there were no differences in outcomes, with mean weight loss of 4.61 kg in the intervention group and 4.43 kg in the control group (p = 0.79). Both groups were given 12-week risk scores, with previously unseen baseline scores for the control group. The control group continued to lose additional weight (1.21 kg) by 24 weeks, whereas the intervention group regained previously lost weight (0.33 kg) (p = 0.04). Conclusions: The knowledge of a single baseline personalized DRS did not affect performance in a lifestyle modification program. However, the knowledge of an improvement in risk score, and the timing of this information, may impact further adherence.
INTRODUCTION
The Centers for Disease Control and Prevention estimates that 29 million Americans now have diabetes and 86 million have prediabetes. The prevalence of diabetes has more than doubled in the last 30 years, due in large part to the emerging epidemic of obesity.1 Despite physical activity and weight standards for active duty service members, the military health system is not immune from these national trends. The Tobacco, Obesity, and Alcohol study estimated that obesity/overweight-related illnesses and diabetes account for $1.1 billion and $300 million, respectively, in annual health care costs for military health system beneficiaries, which includes retirees and non-active duty family members.2 Although military fitness standards have a protective effect against the rise of diabetes in active duty members,3 there is a rise in the prevalence of diabetes in non-active duty beneficiaries over age 45,4 which is likely related to the elimination of fitness standards at retirement. Accordingly, there are an estimated 50,000 adults with diabetes and over 100,000 adults with prediabetes who are eligible for care in Air Force Medical Service clinics. The vast majority of these individuals are retirees and non-active duty dependents, a population that is representative of a cross-section of America.
Individuals with prediabetes have been the target of diabetes prevention programs, which have consistently shown that lifestyle modification can significantly reduce the risk of developing type 2 diabetes. The landmark Diabetes Prevention Program (DPP) study provided an intensive lifestyle intervention that included one-on-one coaching and recommendations for exercise, dietary choices, and behavior modification. Compared with a control group, patients with prediabetes who participated in the DPP decreased their progression to diabetes by 58% over 2.8 years.5 According to the American Diabetes Association Standards of Medical Care in Diabetes in 2015, lifestyle intervention remains the primary recommended approach for diabetes prevention.6
To deliver the DPP curriculum in a 12-week group format, members of the original DPP team from the University of Pittsburgh developed the Group Lifestyle Balance (GLB) Program.7,8 The military health system has implemented this program at several of its clinics. Completers of this program have lost an average 4 kg. However, as expected with any intensive lifestyle change program, attrition rates have ranged between 30 and 40% from start to finish. We found this to be true even in our system, which provides access to care free of charge. Therefore, it is important to investigate mechanisms to reduce attrition to enable more patients to benefit from the program.
Tethys Biosciences (Emeryville, California) developed a Diabetes Risk Score (PreDx DRS) that predicts 5-year risk of onset of diabetes in prediabetic patients. The test consists of a panel of seven biomarkers (adiponectin, C-reactive protein, ferritin, glucose, insulin, interleukin-2 receptor alpha, and hemoglobin A1c [HbA1c]) that are independently associated with diabetes risk. The levels of these biomarkers in a fasting blood sample, combined with age and gender, are placed into a proprietary algorithm to generate a single numerical score from <1 to 9.9.9 Results consist of three risk strata, defined by Tethys at the study onset, with low risk as DRS <4.5 (green), moderate risk ≥4.5 and <8.0 (yellow), and high risk ≥8.0 (red). The risk scores correlate with actual percentage values included in the personalized DRS report, which indicate the probability of conversion to type 2 diabetes within 5 years. The DRS has been validated using baseline serum samples from subjects in the Inter99 cohort, a population-based primary prevention study of cardiovascular disease.10 A full description and comprehensive case-based review of clinical applications for this particular tool was recently published.11 One potential use for this type of test is to provide risk information in a context that patients can use to encourage lifestyle changes that would ultimately decrease their risk of undesired clinical outcomes. For example, if an individual with prediabetes realizes, through the use of a personalized biomarker test, that he is at higher risk for developing diabetes, then he may be more likely to complete a lifestyle change program with improved clinical outcomes.
We hypothesized that knowledge of the DRS test results would improve adherence to the GLB Prevention Program. The purpose of this study was to assess whether the use of this test decreased attrition rates and resulted in greater reductions in weight, body mass index (BMI), and waist circumference, and ultimately whether the impact of this participation would translate to improved clinical outcomes.
METHODS
The study was conducted at four Air Force facilities: Diabetes Center of Excellence, Lackland AFB, Texas (lead site); Travis AFB, California; Wright-Patterson AFB, Ohio; and Nellis AFB, Nevada. Duration of the trial was from July 2010 through June 2013. Patients enrolled in the GLB Program were eligible for the study if they met all of the inclusion criteria and none of the exclusion criteria. Inclusion criteria included nonactive duty military health system beneficiaries between 30 and 75 years of age with a diagnosis of prediabetes (determined by fasting plasma glucose ≥100 and <126 mg/dL or HbA1c 5.7–6.4%) and BMI ≥25 kg/m2. Of note, oral glucose tolerance tests were not performed in the subjects, because our organization's guidelines recommend against the use of this test for diagnostic purposes.12 Additionally, we determined that incorporating this 2-hour test at three points in the study would have adversely impacted recruitment efforts. Exclusion criteria included active duty military status, diagnosis of diabetes mellitus, untreated hypothyroidism, previously diagnosed Cushing's syndrome, treatment with metformin or thiazolidinediones in the previous 12 months, current use of weight-loss medications or medications known to affect body weight, psychological or physical disabilities likely to interfere with participation in the study, major medical conditions that prevent participation in a lifestyle prevention program (e.g., severe cardiovascular or cerebrovascular disease, severe renal or liver dysfunction), diagnoses known to specifically raise one of the DRS biomarkers (e.g., hemochromatosis), concurrent participation in a different weight loss program, previous bariatric surgery, pregnant or nursing patients, and participation in any other research project.
After informed consent was obtained, protocol-specific fasting blood samples were obtained from eligible subjects and shipped to Tethys Biosciences for performance of the PreDx DRS test. Usual care labs, including fasting glucose, HbA1c, lipid profile, thyroid stimulation hormone, and human chorionic gonadotropin were obtained and processed locally, and results of these routine studies were immediately available for all participants. A designated unblinded staff member at each site was responsible for assigning each eligible subject to either the experimental group or the control group according to a predetermined computer-generated randomization scheme. Each of these members also maintained a standardized deidentified site database and regularly forwarded this information to the lead site for review. All investigators, GLB Program instructors, and employees of Tethys Biosciences were blinded to the group assignments. The experimental group was provided DRS test results at the onset of the GLB Program, as well as at the 12-week and 24-week points of the study. In contrast, the control group only received their DRS results after the 12-week GLB Program visit, when the baseline and 12-week results were reviewed, and subsequently at the 24-week point of the trial. Thus, the experimental group had knowledge of their baseline DRS results during the 12-week program, whereas the control group did not. Tethys Biosciences provided standardized counseling instructions to the unblinded staff members at each site. These members received all DRS results in report format directly from Tethys and counseled each subject individually at the appropriate times in the trial. The subjects were instructed not to share the content of their counseling visits or the results of their DRS reports, and there were no reported instances of this information being shared. All subjects, regardless of study group, received usual care risk information based on weight, BMI, waist circumference, fasting glucose, HbA1c, blood pressure (BP), and cholesterol as part of the GLB Program.
We performed statistical analysis of subject outcomes on changes in weight, BMI, waist circumference, BP, HbA1c, triglycerides, cholesterol, and DRS from the baseline visit to the 12-week visit, and from the 12-week to the 24-week visit. Mean and SE values for these changes were calculated. Mean values for the various groups were compared using the Student's t-test for two samples assuming unequal variances. All testing was two sided with a significant level of alpha = 0.05 and completed using the R statistical analysis software.
The Institutional Review Board at Wilford Hall Medical Center, Lackland AFB, Texas, approved the conduct of this study. The trial is registered in ClinicalTrials.gov as No. NCT01932866.
RESULTS
We recruited and enrolled 230 subjects into the trial at four Air Force clinics (Lackland—102, Travis—65, Wright-Patterson—35, Nellis—28). Figure 1 shows a basic schematic of the design and flow diagram of the trial. 206 subjects started the trial, but 192 met criteria to be included in the baseline analysis. Gender distribution was 63.5% female overall. The overall ethnic distribution of participants was 53.1% White (non-Hispanic), 18.8% Black, 16.1% Hispanic (white), and 12.0% Asian.
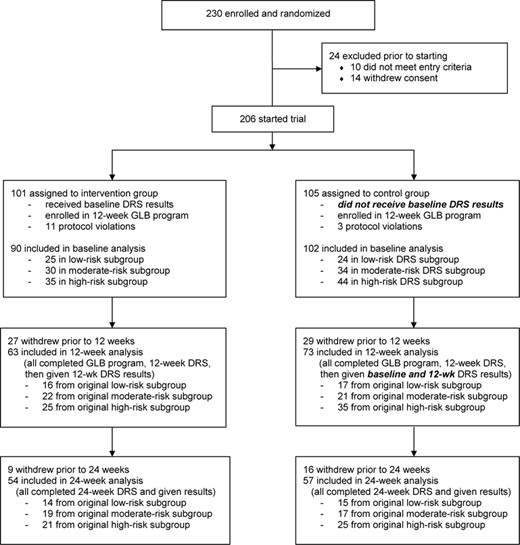
IDEA trial flow diagram.
There were no major significant baseline characteristic differences between randomized groups (Table I). Each of the DRS subgroups (low risk, moderate risk, and high risk) also had similar baseline characteristics between the randomized intervention and control groups (data not shown). The only statistically significant difference was found in the percentage of female participants in the moderate risk intervention subgroup (53.3%) when compared with the moderate risk control subgroup (82.4%), p = 0.03. Otherwise, both the low-risk and high-risk subgroups had similar percentages of female participants, contributing to the overall 63.5% percentage in the trial. It is, therefore, unlikely that this difference in the moderate risk subgroup was clinically significant in the overall scheme of the trial.
Baseline Data Comparison
| Intervention (n = 90) | Control (n = 102) | p-Value | |
|---|---|---|---|
| Age (Years) | 55.93 ± 0.88 | 56.34 ± 1.03 | 0.76 |
| Race/Ethnicity | |||
| White (Non-Hispanic) | 48 (53.3%) | 54 (52.9%) | 1.00 |
| White (Hispanic) | 13 (14.4%) | 18 (17.6%) | 0.69 |
| Black | 17 (18.9%) | 19 (18.6%) | 1.00 |
| Asian | 12 (13.3%) | 11 (10.8%) | 0.75 |
| Female Gender | 54 (60.0%) | 68 (66.7%) | 0.42 |
| Weight (kg) | 90.96 ± 2.17 | 91.72 ± 1.82 | 0.79 |
| BMI (kg/m2) | 32.65 ± 0.62 | 33.27 ± 0.56 | 0.45 |
| Abdominal Circumference (cm) | 105.69 ± 1.63 | 107.06 ± 1.42 | 0.52 |
| Systolic BP (mm Hg) | 129.98 ± 1.44 | 127.78 ± 1.40 | 0.27 |
| Diastolic BP (mm Hg) | 78.80 ± 0.85 | 77.84 ± 1.00 | 0.47 |
| HbA1c (%) | 5.96 ± 0.03 | 5.96 ± 0.03 | 0.94 |
| Fasting Glucose (mg/dL) | 102.59 ± 1.05 | 104.82 ± 1.06 | 0.14 |
| Cholesterol (mg/dL) | 184.36 ± 4.37 | 184.74 ± 3.53 | 0.95 |
| Low-density Lipoprotein (mg/dL) | 109.53 ± 3.59 | 107.10 ± 3.13 | 0.61 |
| High-density Lipoprotein (mg/dL) | 53.38 ± 2.00 | 54.08 ± 1.55 | 0.78 |
| Triglycerides (mg/dL) | 121.12 ± 7.43 | 119.78 ± 6.12 | 0.89 |
| DRS | 6.30 ± 0.28 | 6.73 ± 0.25 | 0.26 |
Mean values (±SE) are reported for each baseline characteristic. P values compare intervention vs. control groups and subgroups in each category.
Completers of the 12-week GLB Program (n = 136) experienced significant improvements in all clinical endpoints, including a mean weight loss of 4.48 ± 0.33 kg (mean 4.86% loss from original weight), BMI loss of 1.58 ± 0.12 kg/m2, and abdominal circumference loss of 6.68 ± 0.58 cm. The DRS improved over the 12 weeks by a mean drop of 0.51 ± 0.16 points. During the 12-week program, there were no significant differences in the attrition rates between the randomized groups (30% intervention vs. 28.4% control) or the subgroups with similar rates. We also compared the overall baseline characteristics of subjects of completers and noncompleters of the trial and found that there were no significant differences in baseline characteristics between these groups or subgroups (data not shown).
Clinical endpoints were compared between baseline and 12 weeks and again between 12 and 24 weeks (Table II). When comparing baseline to 12-week clinical endpoints, there were no significant differences between the overall intervention and control groups or subgroups. At the 12-week point in the trial, all subjects were given their DRS results, such that the control group received both their baseline and 12-week DRS results simultaneously before proceeding further in the trial. When comparing 12-week with 24-week clinical endpoints, a significant weight and BMI loss difference was noted between the intervention and control groups (p = 0.04, 0.03), in favor of the control group. It appears that the statistically significant differences in the high-risk subgroup (p = 0.01, 0.01), and lesser nonsignificant differences in the moderate risk subgroup (p = 0.22, 0.20), were the primary drivers of these findings (Fig. 2).
Differences in Clinical Endpoints at GLB Completion (12 Weeks) and Follow-up (12 vs. 24 Weeks), Comparing Endpoint Changes (±SE) in Overall Intervention and Control Groups and Also in Low, Moderate, and High Baseline DRS Subgroups for Each Endpoint
| Intervention Baseline vs. 12 Weeks Loss (N = 63) | Control Baseline vs. 12 Weeks Loss (N = 73) | p-Value | Intervention 12 Weeks vs. 24 Weeks Loss (N = 54) | Control 12 Weeks vs. 24 Weeks Loss (N = 57) | p-Value | |
|---|---|---|---|---|---|---|
| Weight (kg) | 4.61 ± 0.49 | 4.43 ± 0.47 | 0.79 | −0.33 ± 0.56 | 1.21 ± 0.50 | 0.04 |
| Low-risk Subgroup | 4.51 ± 0.75 | 3.36 ± 0.72 | 0.28 | 1.14 ± 0.75 | 0.87 ± 0.83 | 0.81 |
| Moderate-risk Subgroup | 3.62 ± 0.57 | 4.51 ± 0.72 | 0.34 | −0.88 ± 1.38 | 1.37 ± 1.16 | 0.22 |
| High-risk Subgroup | 5.51 ± 0.99 | 4.91 ± 0.81 | 0.65 | −0.89 ± 0.54 | 1.30 ± 0.66 | 0.01 |
| BMI (kg/m2) | 1.67 ± 0.17 | 1.52 ± 0.16 | 0.54 | −0.12 ± 0.20 | 0.46 ± 0.17 | 0.03 |
| Low-risk Subgroup | 1.57 ± 0.24 | 1.13 ± 0.24 | 0.20 | 0.45 ± 0.28 | 0.33 ± 0.30 | 0.77 |
| Moderate-risk Subgroup | 1.30 ± 0.19 | 1.63 ± 0.23 | 0.27 | −0.38 ± 0.51 | 0.43 ± 0.37 | 0.20 |
| High-risk Subgroup | 2.03 ± 0.36 | 1.64 ± 0.28 | 0.40 | −0.29 ± 0.21 | 0.57 ± 0.23 | 0.01 |
| Abdominal Circumference (cm) | 6.78 ± 0.91 | 6.81 ± 0.76 | 0.98 | 0.84 ± 0.61 | 1.63 ± 0.79 | 0.44 |
| Low-risk Subgroup | 6.40 ± 1.42 | 6.20 ± 1.02 | 0.91 | 1.93 ± 0.94 | 0.61 ± 0.89 | 0.32 |
| Moderate-risk Subgroup | 5.08 ± 1.73 | 5.94 ± 1.50 | 0.71 | 0.64 ± 1.19 | 3.02 ± 0.91 | 0.12 |
| High-risk Subgroup | 8.38 ± 1.45 | 8.38 ± 1.22 | 0.71 | 0.25 ± 1.02 | 1.17 ± 1.70 | 0.65 |
| Systolic BP (mm Hg) | 2.75 ± 2.02 | 4.45 ± 1.45 | 0.50 | 0.50 ± 2.62 | −1.30 ± 2.05 | 0.59 |
| Low-risk Subgroup | 3.40 ± 2.42 | 4.36 ± 2.92 | 0.80 | 4.50 ± 4.92 | 1.08 ± 3.51 | 0.58 |
| Moderate-risk Subgroup | 0.72 ± 4.56 | 3.39 ± 2.89 | 0.62 | −2.57 ± 2.62 | 0.57 ± 3.29 | 0.46 |
| High-risk Subgroup | 3.95 ± 3.10 | 5.13 ± 2.14 | 0.76 | 0.19 ± 5.40 | −4.53 ± 3.58 | 0.48 |
| Diastolic BP (mm Hg) | 1.31 ± 1.40 | 1.68 ± 1.14 | 0.84 | −1.98 ± 1.45 | 0.30 ± 1.40 | 0.26 |
| Low-risk Subgroup | 0.47 ± 2.46 | 2.57 ± 2.25 | 0.53 | 2.42 ± 3.21 | 2.67 ± 2.55 | 0.95 |
| Moderate-risk Subgroup | 2.72 ± 1.47 | 2.67 ± 2.18 | 0.98 | −2.93 ± 1.80 | −0.86 ± 2.66 | 0.52 |
| High-risk Subgroup | 0.73 ± 2.89 | 0.67 ± 1.68 | 0.99 | −4.06 ± 2.14 | −0.41 ± 2.20 | 0.24 |
| HbA1c (%) | 0.11 ± 0.03 | 0.10 ± 0.03 | 0.89 | 0.02 ± 0.03 | 0.03 ± 0.03 | 0.82 |
| Low-risk Subgroup | 0.10 ± 0.07 | 0.18 ± 0.04 | 0.36 | 0.04 ± 0.08 | −0.03 ± 0.04 | 0.47 |
| Moderate-risk Subgroup | 0.09 ± 0.05 | 0.10 ± 0.06 | 0.85 | 0.01 ± 0.04 | 0.03 ± 0.04 | 0.81 |
| High-risk Subgroup | 0.13 ± 0.05 | 0.06 ± 0.05 | 0.39 | 0.01 ± 0.05 | 0.06 ± 0.06 | 0.46 |
| Fasting Glucose (mg/dL) | 1.76 ± 1.40 | 3.97 ± 1.19 | 0.23 | 2.17 ± 1.27 | 0.47 ± 1.16 | 0.32 |
| Low-risk Subgroup | 0.69 ± 3.13 | 2.29 ± 2.66 | 0.70 | 3.42 ± 3.07 | 1.79 ± 1.30 | 0.63 |
| Moderate-risk Subgroup | −0.36 ± 2.50 | 3.35 ± 1.50 | 0.21 | 0.39 ± 1.99 | 1.25 ± 2.41 | 0.60 |
| High-risk Subgroup | 4.32 ± 1.90 | 5.14 ± 1.90 | 0.76 | 3.57 ± 1.80 | −1.45 ± 1.94 | 0.06 |
| Cholesterol (mg/dL) | 12.89 ± 4.81 | 13.26 ± 3.28 | 0.95 | −8.15 ± 3.56 | −8.79 ± 1.96 | 0.88 |
| Low-risk Subgroup | 18.31 ± 6.27 | 15.47 ± 7.37 | 0.77 | 0.07 ± 8.58 | −8.00 ± 4.34 | 0.42 |
| Moderate-risk Subgroup | 6.50 ± 8.45 | 11.30 ± 5.94 | 0.64 | −4.28 ± 5.10 | −10.07 ± 3.27 | 0.35 |
| High-risk Subgroup | 15.04 ± 8.79 | 13.31 ± 4.72 | 0.86 | −18.00 ± 5.15 | −10.23 ± 3.23 | 0.21 |
| Low-density Lipoprotein (mg/dL) | 12.09 ± 3.54 | 9.67 ± 2.74 | 0.59 | −2.46 ± 3.21 | −5.43 ± 2.00 | 0.43 |
| Low-risk Subgroup | 17.82 ± 5.92 | 10.89 ± 6.69 | 0.44 | 4.54 ± 6.13 | −3.32 ± 2.94 | 0.26 |
| Moderate-risk Subgroup | 7.41 ± 6.45 | 3.90 ± 4.34 | 0.65 | 0.42 ± 5.78 | −8.36 ± 2.64 | 0.18 |
| High-risk Subgroup | 15.30 ± 5.67 | 10.37 ± 3.98 | 0.48 | −8.67 ± 4.80 | −4.88 ± 3.91 | 0.54 |
| High-density Lipoprotein (mg/dL) | 2.22 ± 2.02 | 1.61 ± 0.92 | 0.78 | −4.26 ±1.16 | −1.62 ± 1.01 | 0.09 |
| Low-risk Subgroup | −1.12 ± 1.42 | 2.53 ± 1.93 | 0.14 | −2.85 ± 1.38 | 0.93 ± 2.44 | 0.19 |
| Moderate-risk Subgroup | 2.00 ± 2.09 | 0.75 ± 2.02 | 0.67 | −6.00 ± 2.63 | −2.47 ± 2.13 | 0.31 |
| High-risk Subgroup | 4.56 ± 4.68 | 1.66 ± 1.21 | 0.55 | −3.70 ± 1.63 | −2.77 ± 0.89 | 0.62 |
| Triglycerides (mg/dL) | 12.97 ± 7.53 | 7.74 ± 6.44 | 0.60 | −0.89 ± 5.67 | −6.69 ± 8.10 | 0.56 |
| Low-risk Subgroup | 9.19 ± 5.37 | 11.29 ± 13.00 | 0.88 | 11.46 ± 16.49 | −13.40 ± 7.07 | 0.18 |
| Moderate-risk Subgroup | 5.55 ± 18.54 | 16.00 ± 11.06 | 0.63 | 3.72 ± 8.41 | −2.07 ± 9.09 | 0.64 |
| High-risk Subgroup | 21.92 ± 9.34 | 1.29 ± 9.89 | 0.13 | −11.48 ± 6.76 | −5.27 ± 17.72 | 0.75 |
| DRS | 0.26 ± 0.20 | 0.68 ± 0.22 | 0.16 | 0.58 ± 0.24 | 0.32 ± 0.21 | 0.42 |
| Low-risk Subgroup | −0.33 ± 0.51 | −0.85 ± 0.50 | 0.47 | 0.58 ± 0.49 | 0.51 ± 0.37 | 0.91 |
| Moderate-risk Subgroup | 0.13 ± 0.31 | 1.08 ± 0.46 | 0.10 | 0.35 ± 0.49 | 0.12 ± 0.38 | 0.71 |
| High-risk Subgroup | 0.76 ± 0.23 | 1.19 ± 0.22 | 0.35 | 0.79 ± 0.32 | 0.35 ± 0.35 | 0.35 |
Positive values indicate a loss in the measured outcome, and negative values indicate a gain. P values compare intervention vs. control group subjects in the measured outcome changes at the time intervals. Significant values of p < 0.05 are in bold.
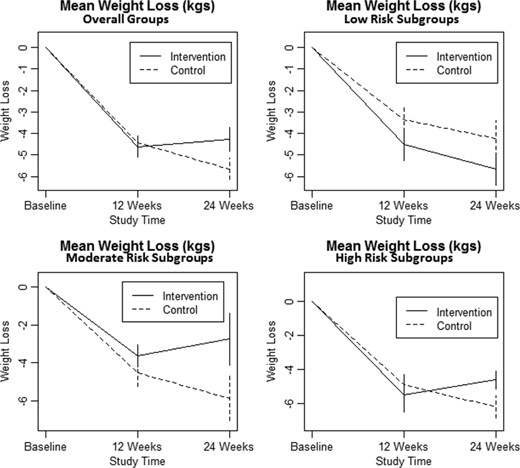
Changes in weight in kilograms (with SE) between groups and risk subgroups at Baseline, 12 Weeks, and 24 Weeks.
DISCUSSION
In this study, we sought to understand whether the additional knowledge of a DRS, beyond the knowledge of routine laboratory work, would influence the performance of prediabetic patients in the GLB diabetes prevention program. We confirmed the efficacy of the GLB Program as a whole in improving clinical markers in completers, as also shown in previously published studies.7,14 However, the results of our trial demonstrate that the issue of patient motivation toward lifestyle change is complex.
We found that the knowledge of the PreDx DRS did not have an impact on overall patient attendance and performance during the 12-week program. This finding is in agreement with a recently published study that assessed the impact of genetic risk testing on motivation for prediabetic patients and demonstrated similar negative results in the performance of a 12-week diabetes prevention program. In that trial, both high and low genetic risk groups (n = 44, 34) were compared with controls (n = 38), and there were no differences between these groups in attendance rates or clinical outcomes.15 It should be noted that genetic risks do not change over time in relation to behavioral lifestyle changes. In contrast, our trial provided another dimension for study, in that we demonstrated that the PreDx DRS does change (average 0.51 drop on the 10-point scale at 12 weeks) with improved lifestyle changes. The change in DRS was most pronounced in the high-risk subgroup (average 1.0 drop), which could have great potential to reinforce change. Thus, subjects in the latter half of our trial were in a position to observe and respond to these changes. Accordingly, there are several results in our trial that warrant further inquiry.
With regard to the clinical outcomes between the 12- week and 24-week points, we note that the overall control group continued to lose weight and BMI (1.21 ± 0.50 kg, 0.46 ± 0.17 kg/m2), whereas the intervention group gained in these categories (0.33 ± 0.56 kg, 0.12 ± 0.20 kg/m2) (p = 0.04, 0.03). Again, this overall result was driven primarily by the statistically significant high-risk subgroup (p = 0.01, 0.01) and to a lesser degree by the nonstatistically significant moderate risk subgroup (p = 0.22, 0.20), in which those in the respective control subgroups continued to lose weight and BMI, whereas those in the corresponding intervention subgroups gained previously lost weight and BMI (Table II). Although gender effect may be a potential confounder, as there was a higher percentage of females in the moderate risk control subgroup, gender effect would not explain the similar and more significant outcomes seen in the high-risk subgroup, which was closely matched by gender. Therefore, the impact of the DRS results in these subgroups seen at 12 weeks must be considered as a potential motivating cause. We did not anticipate this finding.
A key difference between the intervention and control groups should be considered, which involves the timing of DRS information to the subjects. The intervention group received its baseline and 12-week DRS information at the onset and conclusion of the program, 12 weeks apart. However, the control group received both DRS reports only at the conclusion of 12-week program. Therefore, the intervention group had 12 weeks to respond to the baseline information before seeing the next risk score and corresponding change, whereas the control group saw both scores simultaneously, which amplified the impact of previous lifestyle efforts on the score change. Our results support the notion that the novelty of a single “before and after” comparison snapshot reflecting past efforts may be a stronger motivator than individual results spread out over time.
A review of the medical literature regarding risk perception and motivation confirms the complexity of behavior change. For a variety of medical conditions, patients' perceptions that their actions can influence their risk of future health outcomes enhance positive behavior change. Self-efficacy, presentation of risk as quantifiable numeric values vs. categories, and personalization of risk all impact goal attainment for risk modification.16,–19 Although behavioral control, self-efficacy, and individual risk perception affect health behavior, the effects of these factors on GLB completion or performance were not evaluated in this study.
There were several limitations of our study. Because of an attrition rate typical for a lifestyle change program, our data comparisons only apply to those who completed to the corresponding points in the trial. Accordingly, we were unable to assess the impact of the DRS on noncompleters. We may have been able to have a lower attrition rate if we had assessed readiness to change in our subjects before entry into the trial and only included those who demonstrated high readiness. However, we felt that doing so could have eliminated subjects in whom the DRS would have been the primary motivating factor. If we had designed the trial up front to only enroll motivated subjects, then we would have introduced a bias that would not have assessed the impact of the DRS to motivate subjects. We felt the current design was appropriate and true to typical community practice.
The generalizability of our results is not straightforward. It is clear that the DRS, as a single test before the GLB Program, did not impact performance during the 12 weeks. However, there is a suggestion that the improvements seen with serial tests, and the timing of the delivery of this information, may have an impact on patient motivation. Of course, it is not clinically practical to perform a risk score test and withhold the results until a future point in time as we did with the control group in this trial. Again, we did not anticipate the control group's response in this trial, but the finding is significant. Clearly, more study, with more subjects over a longer time period, is needed to understand the best role for this type of test, particularly in moderate- and high-risk subgroups. Outside of patient motivation, clinicians may be able to use this type of test to better know which patients should be targeted for aggressive lifestyle interventions, particularly when the resources to conduct such interventions are limited. Accordingly, the use of serial risk score tests in those at highest risk may serve as a motivational tool for continued progress in delaying the onset of diabetes.
Finally, after the trial ended, it should be noted that Tethys ceased commercial operations for reasons unrelated to the trial, such that the DRS is no longer available. Although we studied patient response to this specific risk score and its changes throughout the trial, it is conceivable that our findings could apply to any similar risk score that is perceived by patients to convey accurate information. The actual risk score is unlikely to be as important as the patient's belief in the score's validity and subsequent response to the information. We propose that further study could be conducted on similar types of risk scores to further our understanding of their impact on patient motivation.
CONCLUSIONS
Our study showed that the knowledge of a single baseline personalized DRS did not affect participation, weight loss, BMI, waist circumference, or other clinical parameters for patients with prediabetes participating in a lifestyle modification program. However, the knowledge of an improvement in risk score as a result of lifestyle change may improve further adherence, particularly in those at high and perhaps moderate risk. Future trials are warranted to more closely investigate the impact of risk score change in these subgroups.
ACKNOWLEDGMENTS
The study was conducted by the following individuals:
Lackland AFB—Mark W. True, Lisa E. Strickland, Jack E. Lewi, Laura M. Sterling, Houbei Dai, Roy W. Haas, Victor L. Sylvia, Ellen C. Cobb, Manoj Mathew, Stuart Benson, Peggy Smith, and Dianna Holub.
Travis AFB—Michael R. Koteles, John McKenna, and Eduardo Sevilla.
Wright-Patterson AFB—Sarah Fackler Gillis, Irene Folaron, Susan C. Agee, Rita Burris.
Nellis AFB—Paul F. Crawford and Jill M. Clark.
Tethys Biosciences provided training to the designated site study coordinators about the PreDx DRS test and how to communicate DRS report results to subjects. Tethys conducted the DRS laboratory tests in its facility and provided the DRS reports to the study coordinators. Tethys provided the laboratory testing supplies, shipping materials, and shipping expenses related to these tests. Otherwise, the design and conduct of the trial, including data collection, analysis and interpretation, and the writing of this manuscript were performed independent of Tethys. No direct funds or benefits were received by the investigators or anyone involved in the conduct of this investigator-initiated trial. The Henry M. Jackson Foundation served as an intermediary between the U.S. Air Force and Tethys Biosciences in establishing the agreement for the conduct of this investigator-initiated trial.
REFERENCES
Footnotes
This article was presented in poster format as guided audio tour at the American Diabetes Association Scientific Sessions in San Francisco, CA, June 2014.
Author notes
The opinions expressed in this document are solely those of the authors and do not represent an endorsement by or the views of the U.S. Air Force, U.S. Army, the Department of Defense, or the U.S. Government.

