


(1) Overview
Introduction
The bayesint package for Python [] allows users to calculate credible intervals for ratios found in 2×2 contingency tables. These include relative risks and odds ratios, frequently used in cohort and case control studies. The calculations behind bayesint are based on the cumulative distribution of two independent, beta-distributed random variables Z = Y/X, where X∼B(α, β) and Y∼B(θ, φ). This work has previously been used to examine deaths during the second plague pandemic [see 1, for details].
Statistical background
Deaths due to plague during the second plague pandemic were examined using a 2×2 contingency table framework. We considered those with counts given in notation of Table 1.
Table 1
Example of 2×2 contingency table.
| INCIDENCE | |||
|---|---|---|---|
| CLASSIFICATION | + | – | TOTAL AT RISK |
| + | P | M – P | M |
| – | C | N – C | N |
| Total | C + P | N – C + M – P | N + M |
We outline the considerations we made for the relative risk briefly. The relative risk for a dichotomous variable is given by the proportion of the probability of an outcome of interest and the probability of the other outcome. The relative risk for Table 1 is

which is our variable of interest.
Interval calculations
We consider the ratio of two independent beta distributed random variables Z = Y/X, where X ∼ B(α, β) and Y∼B(θ, φ). Z has density []
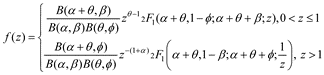
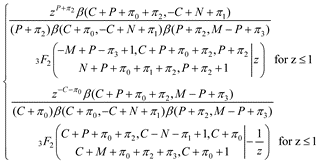
and cumulative distribution function [see the appendix of 1, for full derivation]
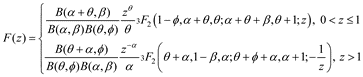
We add our data from Table 1 with priors for the observed values π1 and π2 for positive classification and π3 and π4 for negative classification by inserting α = C + π1, β = N – C + π2, θ = P + π3, and φ = M – P + π4 into Equation 3.
To obtain an equal-tailed, quantile interval (eqt_int_frac) we solve

To obtain a highest posterior density (hpd_int_frac), we minimise []

to obtain the lower and upper limit of the 100(1–δ)% interval, where δ denotes the desired significance level. These intervals fulfil

Contents
bayesint contains the functions listed in Table 2. Our use of the word frac in naming these functions is to emphasise that the functions depend on fractions, be they used for relative risks or for odds ratios. The functions from the subgroupings listed in Table 2 are all loaded as part of bayesint. We have packaged the code to assist users in achieving immediate utility of the interval calculations as the underlying code is rather complicated. The package is released such that users can see the code as well as contribute to future versions of the package. To start using bayesint, all of the functions listed in Table 2 can be loaded simultaneously by
>>> from bayesint import *
or
>>> importbayesint
or individually by
>>> from bayesint import FUNCTION
Table 2
Functions in bayesint.
| FUNCTION GROUPING | FUNCTION | DESCRIPTION |
|---|---|---|
| table_measures | rel_risk | Relative risk, a comparative measure for 2×2 contingency table |
| odds_rat | Odds ratio, a comparative measure for 2×2 contingency table seen in Equation 1 | |
| ratios | A wrapper function returning both the relative risk and odds ratio | |
| table_tests | chi_sq_stat | χ2 statistic for testing the hypothesis of no association between the two variables in a 2×2 contingency table |
| chi_sq_test | χ2 test for the statistic | |
| random_variables | densi_frac | Prior density of a ratio of two independent beta distributions |
| distri_frac | Posterior distribution of a ratio of two independent beta distributions | |
| intervals | eqt_int_frac | The equal-tailed credible interval of a ratio of two independent beta distributions |
| hpd_int_frac | The highest posterior density credible interval of a ratio of two independent beta distributions | |
| frac_int | A wrapper function returning the equal-tailed credible interval and the highest posterior density credible interval or both (chosen by the user) | |
Example: Cholera
Cholera is a disease caused by the bacterium Vibrio cholerae, first identified by Filippo Pacini in 1854 [], brought to world-wide attention in 1883 by Robert Koch [] and the subject of John Snow’s famous epidemiological study in 1855 []. Inoculation is a process where a smaller infection is induced in order that acquired immunity be educed. It carries a lower risk of mortality than that for those experiencing the full infection [].
Data
Waldemar Mordecai Haffkine studied the effects of inoculation against cholera in India in 1893–1896 []. Our data source for Haffkine’s cholera inoculation study [] is Greenwood and Yule, who collated data on cholera []. From their manuscript, we obtain the data listed in Table 3. For each table from Greenwood and Yule we have data on whether subjects are inoculated against cholera (I) or not (NI), attacked by cholera (A) or not (NA), and the total counts (T). The numbers in Table 3 refer to the collated tables [see 4 for further details]. These numbers are used in Table 4 to identify the 2×2 contingency table for which the odds ratio and intervals are calculated.
Table 3
Haffkine’s cholera data from Greenwood and Yule [] with numbers denoting the original tables they are from.
| 3 | 4 | 5 | 6 | |||||||||
|---|---|---|---|---|---|---|---|---|---|---|---|---|
| A | NA | T | A | NA | T | A | NA | T | A | NA | T | |
| I | 3 | 276 | 279 | 18 | 115 | 133 | 0 | 75 | 75 | 0 | 193 | 193 |
| NI | 66 | 473 | 539 | 120 | 520 | 640 | 19 | 778 | 797 | 6 | 723 | 729 |
| T | 69 | 749 | 818 | 138 | 635 | 773 | 19 | 853 | 872 | 6 | 916 | 922 |
| 7 | 8 | 9 | 10 | |||||||||
| A | NA | T | A | NA | T | A | NA | T | A | NA | T | |
| I | 8 | 200 | 208 | 5 | 105 | 110 | 4 | 192 | 196 | 27 | 5751 | 5778 |
| NI | 20 | 182 | 202 | 11 | 88 | 99 | 34 | 113 | 147 | 198 | 6351 | 6549 |
| T | 28 | 382 | 410 | 16 | 193 | 209 | 38 | 305 | 343 | 225 | 12102 | 12327 |
Table 4
Relative risks and credible intervals for data from Table 3.
| HAFFKINE | RR | INTERVAL | ||
|---|---|---|---|---|
| EQUAL-TAILED | HIGHEST POSTERIOR DENSITY | |||
| 3 | 0.0878 | [0.0513, 0.3352] | [0.0374, 0.3025] | (HPD starting values: [0.1, 0.4]) |
| 4 | 0.7218 | [0.5393, 1.0333] | [0.5218, 1.4436] | |
| 7 | 0.3885 | [0.2205, 0.7060] | [0.1881, 0.7753] | |
| 8 | 0.4091 | [0.2179, 0.7972] | [0.1476, 0.9875] | (HPD starting values: [0.2, 0.5]) |
| 9 | 0.0882 | [0.0353, 0.3319] | [0.0284, 0.3061] | |
| 10 | 0.1546 | [0.0180, 0.3946] | [0.0421, 0.4364] | |
Use of package
We illustrate how to use bayesint using the numbers from the top left Table 3, that is the 2×2 table with P = 3, C = 66, M = 279, and N = 539. To calculate the odds ratio of such a 2×2 contingency table, we use the rel_risk function and receive the RR value in Table 4. We assume the package has been loaded as listed at the end of the Contents section. An example of how to use the function rel_risk to calculate a relative risk can be seen below
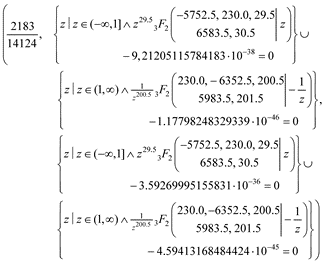
>>> rel_risk(p_val = 27, c_val = 198, m_val = 5778, n_val = 6549)
2183/14124
In order to obtain the intervals (4, 5) for the RR above with prior beliefs π1 = π2 = π3 = π4 = 2.5 we run
>>> eqt_int_frac(p_val = 27, c_val = 198, m_val = 5778, n_val = 6549, pri_val = (2.5, 2.5, 2.5, 2.5), frac_type = “risk”, signif = 0.05, ans = “estim”)
(2183/14124, 0.0180001733621202, 0.39464791108754)
and
>>> hpd_int_frac(p_val = 27, c_val = 198, m_val = 5778, n_val = 6549, pri_val = (2.5, 2.5, 2.5, 2.5), frac_type = “risk”, signif = 0.05, minimisation_start = None)
(2183/14124, 0.0421057055996, 0.436364556526)
for this example we could have also run frac_ints as this assumes an argument of “estim” for the ans parameter in eqt_int_frac and no provided starting values for the minimisation_start in hpd_int_frac.
>>> frac_ints(p_val = 27, c_val = 198, m_val = 5778, n_val = 6549, pri_val = (2.5, 2.5, 2.5, 2.5), frac_type = “risk”, signif = 0.05)
((2183/14124, 0.0180001733621202, 0.39464791108754), (2183/14124, 0.0421057055996, 0.436364556526))
If the user does not want those defaults, we recommend that they run the two interval functions separately. As we use SymPy, we have the option to get the exact equal-tailed interval. This is retrieved by
>>> eqt_int_frac(p_val = 27, c_val = 198, m_val = 5778, n_val = 6549, pri_val = (2.5, 2.5, 2.5, 2.5), frac_type = “risk”, signif = 0.05, ans = “exact”)
We can engage pretty printing using the init_printing function from SymPy, which allows us to obtain the result in symbolic mathematic notation, i.e.
which is the expression we evaluated to obtain numerical values when the “estim” option was used. We can also print the density and distribution functions, 2 and 3), e.g.
>>> distri_frac(p_val = 27, c_val = 198, m_val = 5778, n_val = 6549, pri_val = (2.5, 2.5, 2.5, 2.5), frac_type = “risk”)
SymPy also allows for outputs in LaTeX format. By default bayesint does not pretty print.
Intervals for odds ratios
We use the eqt_int_frac and hpd_int_frac commands from the previous section to calculate the 95% credible intervals for the data from Table 3. In the cases where RR=0 due to zero counts, we are not able to calculate credible intervals due to the assumption that P > π3 which arises from (3). This means we cannot calculate intervals for Haffkine Tables 5 and 6 in Table 3. We use the priors πi = 2.5, i = 1,…,4.
As with all numerical optimisation problems, different starting values can lead to disparate solutions, and as there may not be a closed-form expression of the solution to the highest posterior density minimisation, users are encouraged to investigate their own starting parameters.
Comparisons
We compare our bayesint Python solution with the two following calculation options for calculating the uncertainty of a ratio of beta distributions. Matsen IV et al. [] uses the same Pham-Gia [] density that we consider, but does not explicitly calculate the distribution on the basis of this density and Sverdlov et al. [] consider Nurminen and Mutanen [] which is subsumed in Bekker-Nielsen Dunbar et al. []. As such, we expect them to contain at least an implementation of the equal-tailed credible interval, as it is the easier of the two to program. At the time of writing, we are unaware of other options besides those listed in Table 5.
Table 5
Available options for calculating uncertainty of ratios using credible intervals.
| NAME | LANGUAGE | AUTHOR(S) |
|---|---|---|
| betarat version 1.0.0 | Python | Matsen IV et al. [] |
| bayesian2beta | R | supplement to Sverdlov et al. [] |
The strength of our approach compared with these implementations is that we have considered use of priors for the proportions p1 and p2 that need not be the same. Sverdlov et al. [] mention the use of informative priors in their conclusion but do not seem to have used them in their paper. Furthermore their code allows the user to provide different priors for the equal-tailed interval, whereby the symmetry assumption behind the equal-tailed interval might be violated. The implementation from Matsen IV et al. [] considers the situation where both Beta distributions have the same priors, i.e. α = θ and β = φ. They also note issues with hypergeometrics in R, which we also found, which was our motivation for using Python. Finally, our implementation is the only one of the three that can provide the symbolic functions, as showcased in the Use of package section. We are not aware of other software which allows for calculation of both the HPD and the equal-tailed interval.
Discussion
Our implementation has been demostrated with examples from epidemiology but can be used in any science where 2×2 contingency table-like data arise. For example, within the field of ecology, the response ratio is an index used in meta-analysis of ecological experiments. It is implied in Hedges et al. [] and Lajeunesse [] that only confidence intervals are considered for these, thus our method will allow the calculation of credible intervals for this measure. Another metric mentioned in Lajeunesse [] is the odds ratio, which is similar to the relative risk in certain situations. Hedges et al. [] and Lajeunesse [] consider the distribution of this ratio to which our method is applicable. Another biological ratio we could consider examining is mutation frequencies. Significance tests in this area rely on ratios of mutation rates []. Indeed, Matsen IV et al. []’s work seems to have arisen from work on hypermutations. We have named bayesint with the intention that it will be expanded to contain other intervals with Bayesian origins.
Conclusion
We have created a Python package bayesint which calculates two types of credible interval for the ratio of beta distributions. We used the package to calculate the credible intervals of the relative risk of subjects innoculated or not being attacked by cholera and highlighted the strengths of our package compared with other available options. We believe our implementation to be a useful tool for analysis of 2×2 contingency tables.
Implementation and architecture
The bayesint package is freely available at GitHub (https://github.com/PublicHealthEngland/bayesint) and through the PyPI index of Python packages (pypi.org/project/bayesint). This manuscript concerns bayesint version 1.0.3, the package’s documentation will be updated if future versions have different requirements.
Quality control
bayesint is extensively tested in Python 2.7.14 and also functions in Python 3.5.5 and Python 3.6.6.
(2) Availability
Operating system
Any operating system where Python 2.7.14 or better or 3.5.5 or better with the dependencies enumerated below are installed. In practice this includes all three major operating systems (Linux/Unix, Windows 7 or better and Mac OS/OS X 10.6 or newer) together with a number of smaller platforms.
Programming language
Python 2.7.14, 3.5.5 and 3.6.6.
Additional system requirements
This software has no particularly unusual system requirements and should operate on any typical desktop machine produced in the last five years. The calculations are CPU bound so the greater the single thread performance of the machine the more swiftly the computations will complete.
Dependencies
bayesint uses the following Python packages which are installed when bayesint is installed:
- SymPy ≥ 1.1.1 [] A library for symbolic mathematics used to calculate the densities and distributions used in our credible intervals.
- SciPy ≥ 0.19.1 []. A library used for scientific computing used to obtain a χ2 distribution for testing and to minimise the functions considered in the credible intervals.
- NumPy ≥ 1.13.3 []. A library with high-level mathematical functions used for vectorising our SymPy function prior to minimisation.
- mpmath ≥ 0.19 []. A library for arbitrary floating point arithmetic used in the minimisation. It is loaded through SymPy.
Software location
Archive
- Name: PyPI
- Persistent identifier: pypi.org/project/bayesint
- Licence: Open Government Licence 3.0
- Publisher: Public Health England
- Version published: 1.0.3
- Date published: 11/04/2019
Code repository
- Name: GitHub
- Persistent identifier: github.com/PublicHealthEngland/bayesint
- Licence: Open Government Licence 3.0
- Date published: 11/04/2019
Language
English
(3) Reuse potential
We broadly outline the reuse potential of this software in the discussion section of this work but as a recapitulation this package permits the calculation of credible intervals wherever 2×2 type contingency table data appear in science. With the additional benefit that prior knowledge may be incorporated into this estimate in a truly Bayesian manner. Issues and feedback about the software can be provided by users through the GitHub issue logging system.