the Creative Commons Attribution 4.0 License.
the Creative Commons Attribution 4.0 License.
 | 08 Sep 2023
High-resolution global map of closed-canopy coconut palm
Serge Wich
Zoltan Szantoi
Matthew J. Struebig
Rona Dennis
Zoe Hatton
Thina Ariffin
Nabillah Unus
David L. A. Gaveau
Erik Meijaard
Demand for coconut is expected to rise, but the global distribution of coconut palm has been studied little, which hinders the discussion of its impacts. Here, we produced the first 20 m global coconut palm layer using a U-Net model that was trained on annual Sentinel-1 and Sentinel-2 composites for the year 2020. The overall accuracy was 99.04 ± 0.21 %, which was significantly higher than the no-information rate. The producer's accuracy for coconut palm was 71.51 ± 23.11 % when only closed-canopy coconut palm was considered in the validation, but this decreased to 11.30 ± 2.33 % when sparse and dense open-canopy coconut palm was also taken into account. This indicates that sparse and dense open-canopy coconut palm remains difficult to map with accuracy. We report a global coconut palm area of 12.66 ± 3.96 × 10⁶ ha for dense open- and closed-canopy coconut palm, but the estimate is 3 times larger (38.93 ± 7.89 × 10⁶ ha) when sparse coconut palm is included in the area estimation. The large area of sparse coconut palm is important as it indicates that production increases can likely be achieved on the existing lands allocated to coconut. The Philippines, Indonesia, and India account for most of the global coconut palm area, representing approximately 82 % of the total mapped area. Our study provides the high-resolution, quantitative, and precise data necessary for assessing the relationships between coconut production and the synergies and trade-offs between various sustainable development goal indicators. The global coconut palm layer is available at https://doi.org/10.5281/zenodo.8128183 (Descals, 2023).
- Article
(17876 KB) - Full-text XML
- BibTeX
- EndNote


Coconut (Cocos nucifera L.) is a palm species native to tropical islands in the western Pacific, but it also grows in other tropical areas (Gunn et al., 2011). Climate is an important determinant of coconut palm growth and yield (Peiris and Thattil, 1998). Climate factors such as temperature and relative humidity have been used in descriptive models for predicting coconut yield up to 4 years in advance (Kumar et al., 2009a). Weather data explained past trends in coconut production (Kumar et al., 2009b) and potential changes in the coconut palm distribution area expected due to climate change in India (Hebbar et al., 2022). Coconut palms produce about 1.7 % of the global volume of vegetable oils, as well as copra, coconut water, and coconut milk. Coconut palm is generally overlooked in discussions about crop impacts, and not many see this palm as a threat to biodiversity. However, a recent study identified coconut palms as a potential threat to tropical species, many of which are highly threatened and restricted to tropical islands where coconut palm is extensively grown (Meijaard et al., 2020). In some of these islands, coconut palm is considered to be an invasive species that drives near-complete ecosystem state change when it becomes dominant (Young et al., 2017).
Despite the potential impacts, the coconut palm distribution is poorly documented except for national-level statistics on estimated harvest areas (FAO, 2022), local-level crop-mapping studies (e.g. Palaniswami et al., 2006), and global coarse-resolution modelling (Yu et al., 2020). This may be because coconut palm is mostly grown in smallholdings under 4 ha (Omont, 2022) and is often intercropped, making its mapping difficult. A high-resolution global map of the coconut palm distribution can be used in geospatial analysis to assess environmental impacts and, thus, to inform policy (e.g. estimate the extent of coconut plantations in areas of high biodiversity and assess the subsequent impact on biodiversity indices). Research is therefore needed to map the extent of coconut palm on a global scale, especially using high-spatial-resolution satellite data.
Sub-metre satellite data and aerial images have been used for detecting individual coconut palms (Zheng et al., 2023; Freudenberg et al., 2019; Zheng et al., 2021), delineating coconut palm canopies (De Souza and Falcão, 2020; Vermote et al., 2020), and detecting coconut palm in the context of land cover classification (Burnett et al., 2019). These studies used various methodologies, including threshold-based classification, random forest using feature extraction, and more advanced techniques such as object detection and semantic segmentation using deep learning. Similar efforts have been made to map coconut palm using decametric-scale satellites such as Sentinel-1, Sentinel-2, or Landsat-7 (Lang et al., 2021; Jenifer and Natarajan, 2021; Palaniswami et al., 2006). Another study detected individual coconut palms using airborne laser scanning (Mohan et al., 2019). Despite previous efforts to map coconut palm, these studies have focused on the local and regional scales, and a global coconut palm map has not been produced yet at a high spatial resolution. Moreover, it is still unclear how well satellite remote sensing can differentiate between coconut palm and other palm species, particularly oil palm (Gibril et al., 2017). The confusion between coconut palm and oil palm explains the potential commission errors in previous oil palm datasets (Descals et al., 2021; Danylo et al., 2021; Gaveau et al., 2022).
This study aims to produce the first global coconut palm map at a high spatial resolution (20 m) and to estimate the global coconut palm area using satellite remote sensing. To achieve this aim, we first identified potential areas where climate was favourable for coconut palm growth. We then used a semantic segmentation model to classify Sentinel-1 and Sentinel-2 annual composites for 2020. Finally, we employed a sampling-based approach to validate the results.
2.1 Overview
To map coconut palms globally, we first conducted a bioclimatic analysis to determine regions in the world where coconut can potentially grow. The bioclimatic analysis used climate variables and terrain slope to produce a map of the potential coconut palm distribution. The regions identified in the bioclimatic analysis served as the focus of our mapping efforts. The mapping of coconut palm consisted of a supervised classification of Sentinel-1 and Sentinel-2 data. Specifically, we selected bands VV and VH from Sentinel-1 and band 11 from Sentinel-2 after evaluating their backscatter and spectral separability for different tree plantations. The selected bands (VV, VH, and band 11) were aggregated into annual composites, which were then used as input in the classification model. The classification model was a U-Net that predicted two classes: class “coconut” and class “other”. The model was deployed within the regions identified in the potential coconut palm distribution. To validate the resulting classification layer, we used a sampling-based approach with 10 200 reference points. Lastly, due to data limitations in certain areas, such as the Pacific, we conducted a sampling-based estimation of coconut palm area in small tropical islands using sub-metre-resolution satellite images.
2.2 Bioclimatic analysis for mapping the potential distribution of coconut palm
We used a bioclimatic analysis to determine the potential coconut-producing regions and, subsequently, to constrain the spatial extent of the classification of satellite data. To achieve this, we first conducted a literature search to identify regions known for coconut palm cultivation. Additionally, we used the SPAM2010 (Spatial Production Allocation Model) dataset (Yu et al., 2020), which depicts the global occurrence of coconut production across a 5 arcmin grid (Fig. A1 in the Appendix). Once the coconut-producing regions were identified, we visualized sub-metre-resolution satellite data shown in Google Earth and collected points in locations where coconut palms were present (Fig. 1a). Three interpreters visualized the sub-metre resolution and collected at least five points in each SPAM grid cell. Coconut palm can be distinguished from other palm species in sub-metre satellite images (Fig. 2). If available, the interpreters visualized images from Google Street View to verify the presence of coconut palms.
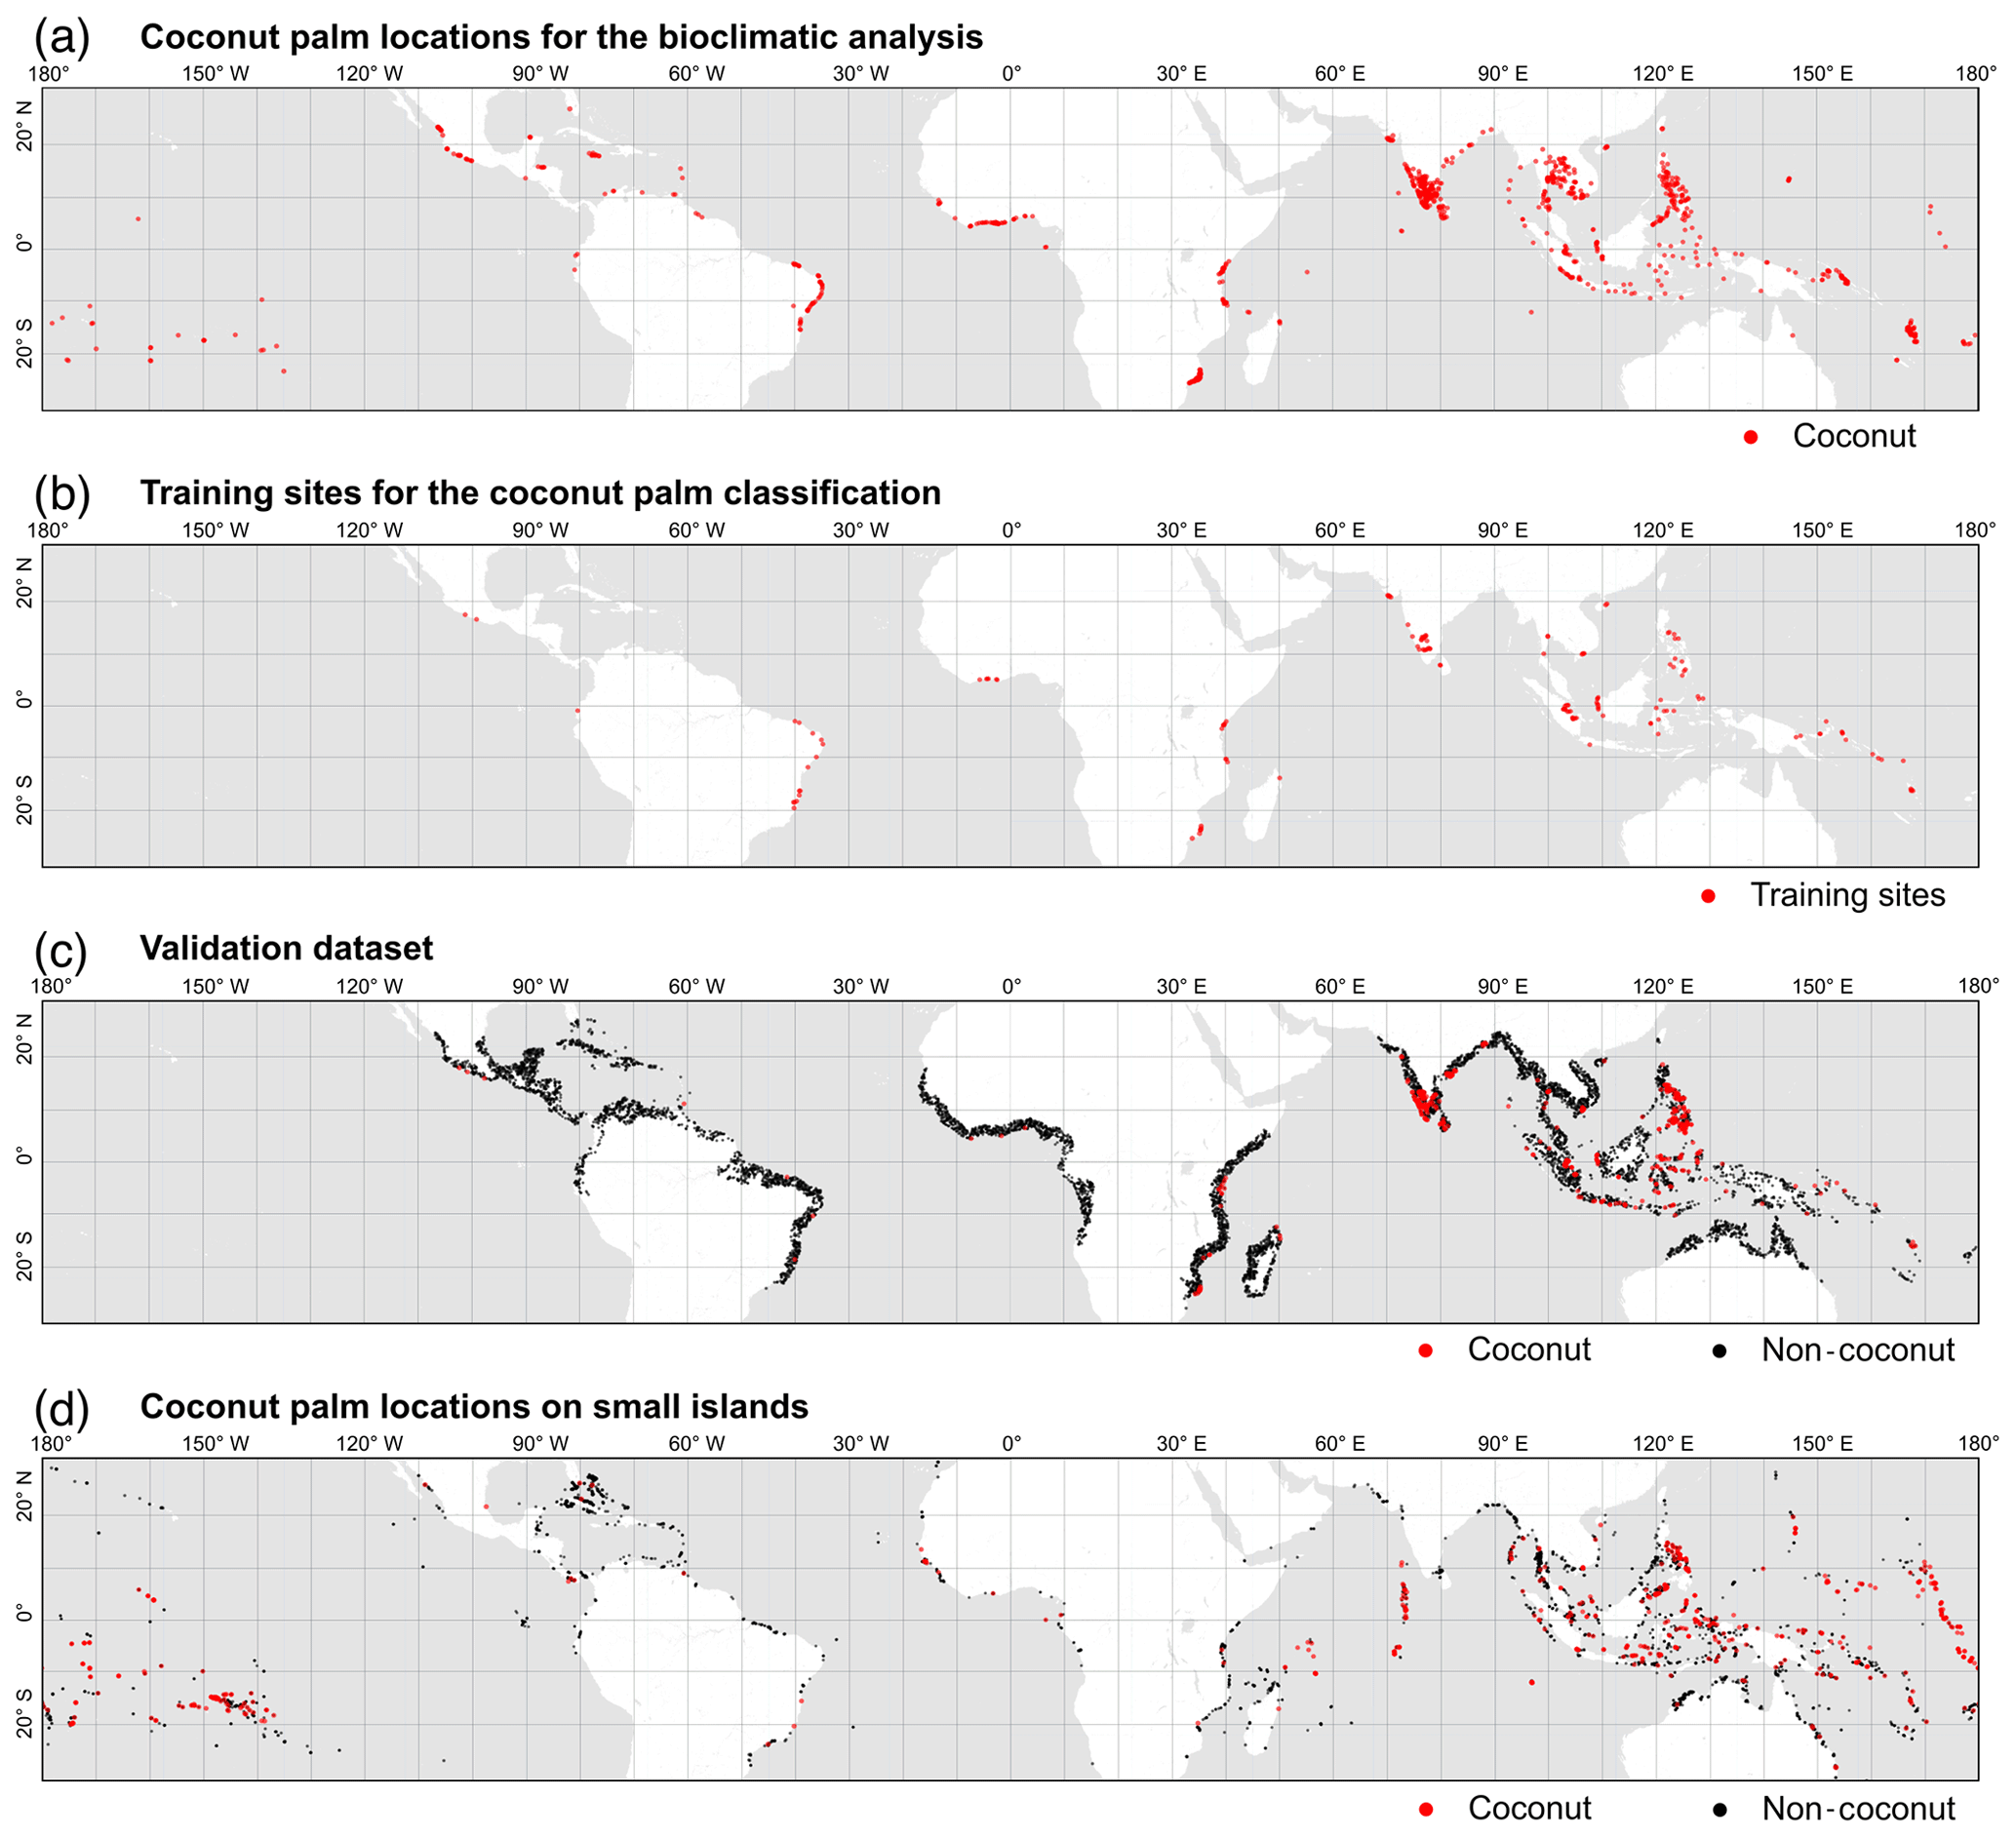
Figure 1Four point datasets used in the methodology. (a) A total of 1139 points depicting coconut palm locations found by visual inspection of sub-metre satellite images. These points were used in a bioclimatic analysis to determine the potential distribution area of coconut palm. (b) Location of the 146 training sites. In these locations, Sentinel-1 and Sentinel-2 annual composites were labelled in a 10×10 km grid for training a semantic segmentation model. (c) Validation dataset generated from a stratified random sampling. The dataset consists of 10 186 points and was used to evaluate the accuracy of the global coconut palm layer and to estimate the global coconut palm area. (d) A total of 5000 points randomly sampled in small tropical islands (areas from 1 to 200 ha). The points were used to estimate the coconut palm area in small islands, where Sentinel-1 and Sentinel-2 might not be available.
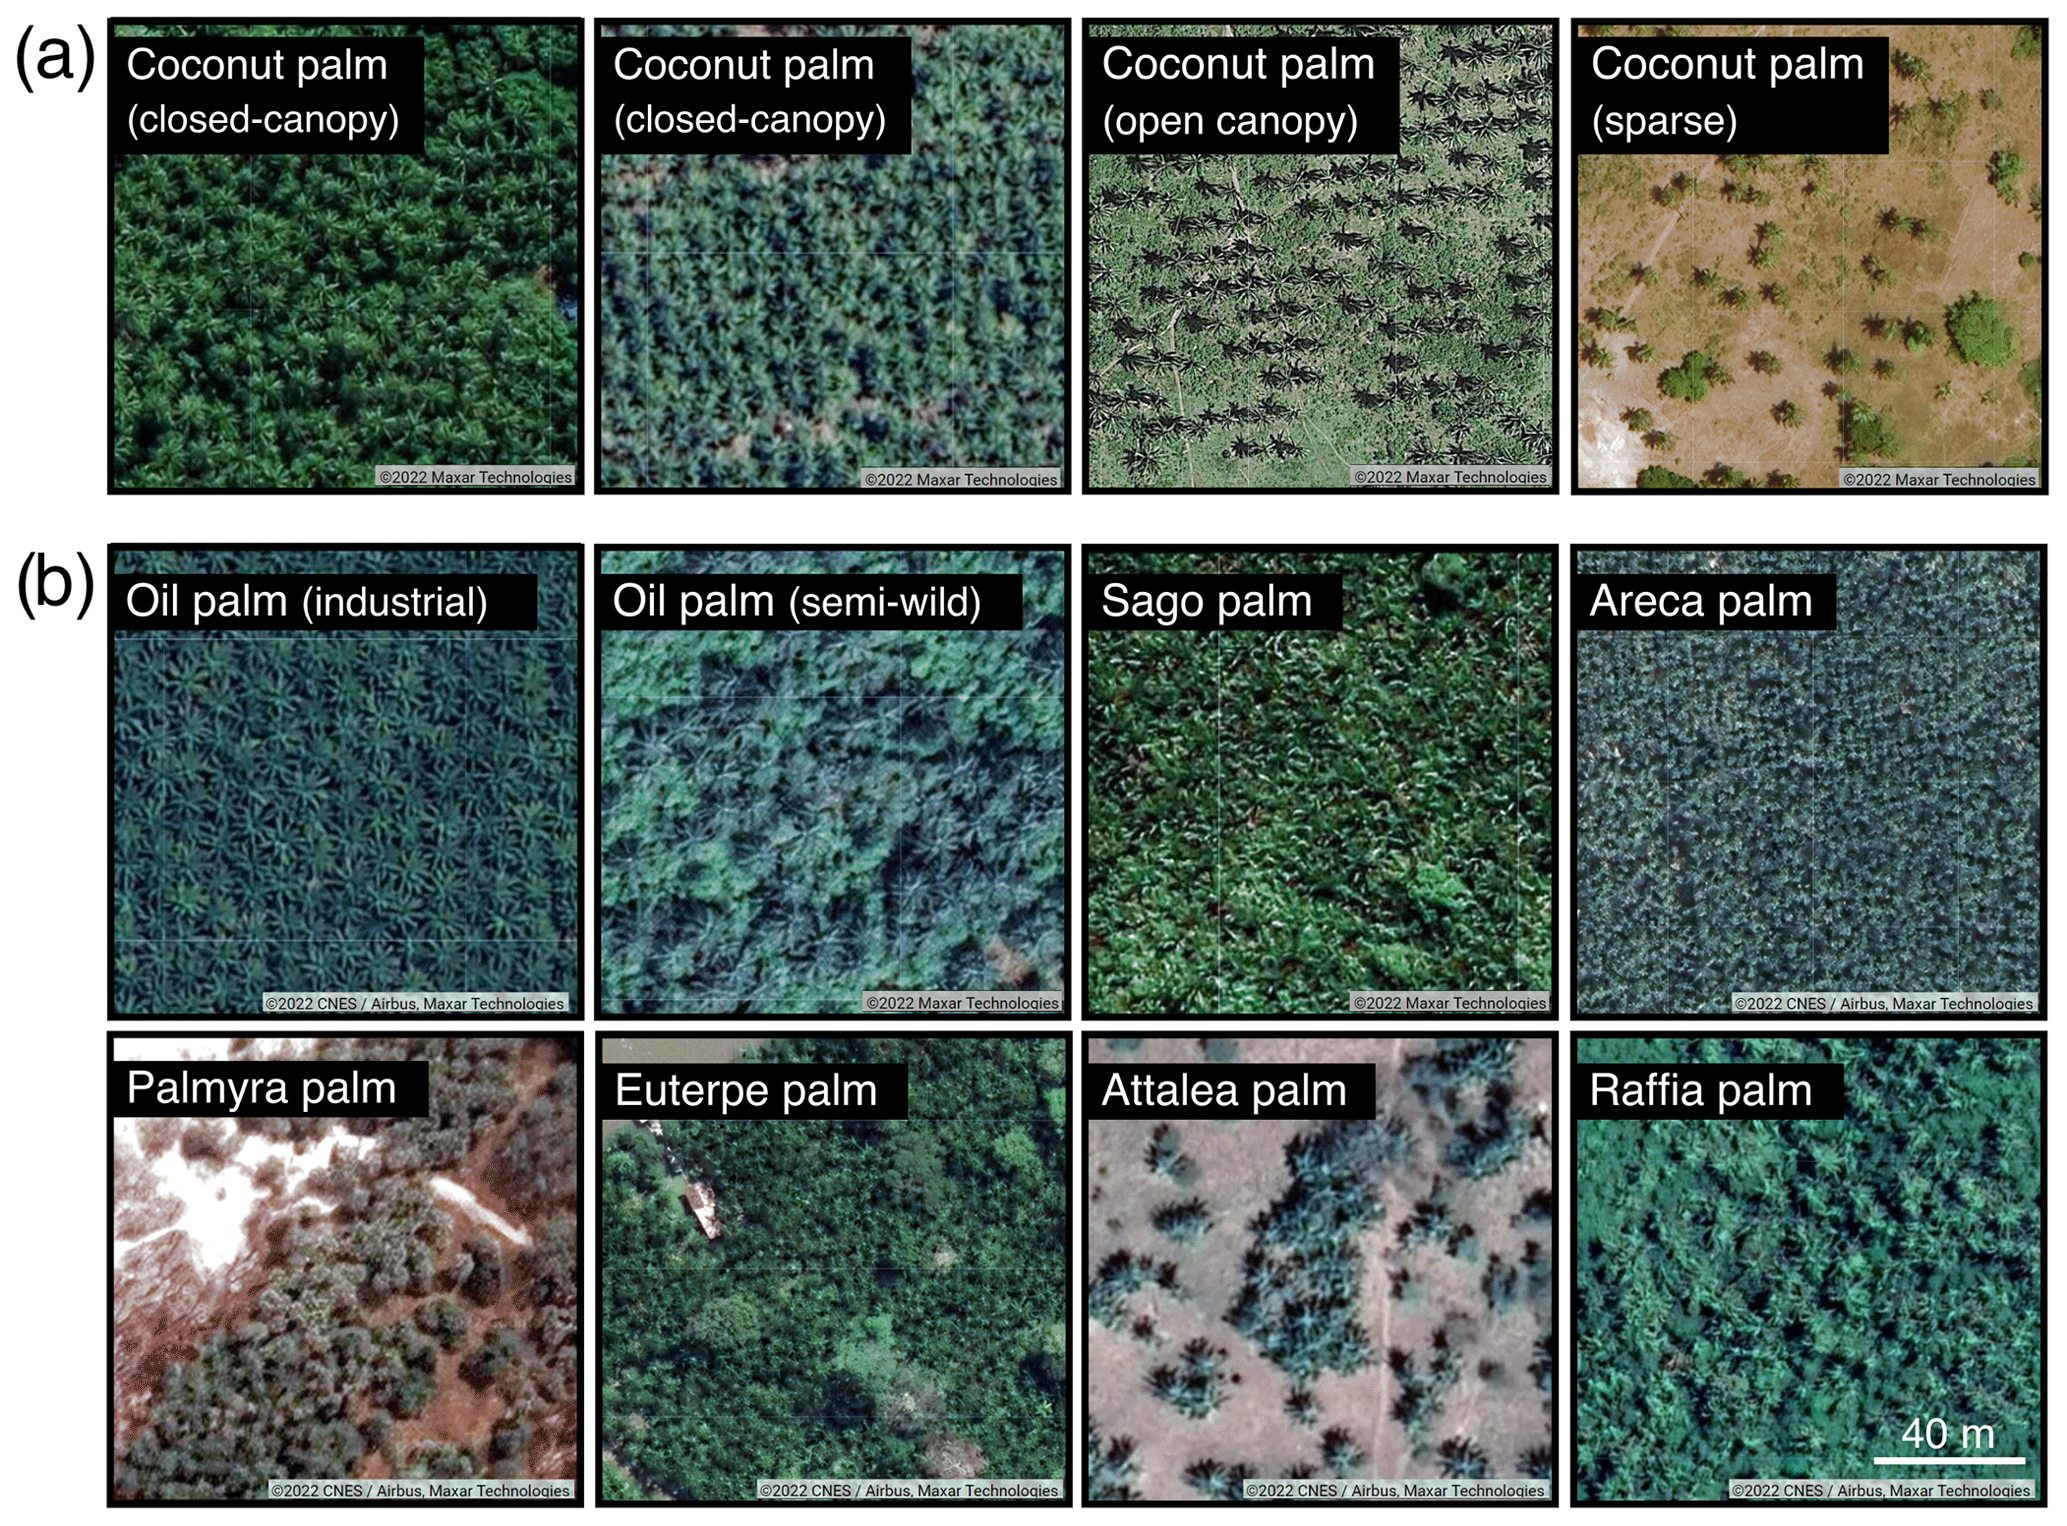
Figure 2Sub-metre-resolution images depicting (a) coconut palm and (b) other palm species found in the tropics. The images show (from left to right and from top to bottom) a closed-canopy coconut palm stand in Papua New Guinea (6.124043∘ S, 134.13848∘ E) and Indonesia (1.077958∘ N, 108.966256∘ E), a dense open-canopy coconut palm in the Philippines (13.792082∘ N, 123.016486∘ E), a sparse coconut palm in Kenya (4.367173∘ S, 39.493028∘ E), an industrial oil palm in Indonesia (1.123642∘ N, 100.498538∘ E), a semi-wild oil palm in Nigeria (6.641218∘ N, 5.388639∘ E), a sago palm forest in Papua New Guinea (6.122091∘ S, 134.139178∘ E), an areca palm in India (13.980709∘ N, 75.632272∘ E), a palmyra palm in Gabon (6.078832∘ S, 12.330894∘ E), a euterpe palm in Brazil (1.492261∘ S, 48.3734988∘ W), an attalea palm in Mexico (16.10187∘ N, 97.396666∘ W), and a raffia palm in Brazil (4.295997∘ S, 42.943344∘ W). The satellite images are the sub-metre-resolution images that are displayed as the base layer in Google Earth © Google.
Once all coconut-producing regions were sampled, we extracted the values from a terrain slope layer and from the WorldClim V1 Bioclim (Hijmans et al., 2005) at the collected points. The terrain slope was derived from the Shuttle Radar Topography Mission (SRTM) digital elevation dataset (Jarvis et al., 2008). WorldClim V1 Bioclim consists of 19 bioclimatic variables derived from monthly temperature and precipitation. Given that the variables of WorldClim were obtained from the same time series, we used the variance inflation factor (VIF) to address collinearity issues. The VIF determines if sets of variables are strongly correlated with each other. A VIF value higher than 5 indicates a high multicollinearity. We removed variables that presented a VIF higher than 5, which resulted in a subset of eight WorldClim variables and terrain slopes (Table A1). We used only the subset of nine variables in the estimation of the potential coconut palm distribution. The values in the nine variables outlined the range of bioclimatic values for coconut palm, and we used this range (minimum and maximum) to generate the potential coconut palm distribution map; a pixel in the WorldClim dataset was considered to be suitable for coconut palm growth if the nine selected variables fell within the bioclimatic range.
2.3 Sentinel-1 and Sentinel-2 compositing
Sentinel-1 and Sentinel-2 annual composites for the year 2020 were the input data for the classification model. Sentinel-1 consists of two synthetic aperture radar (SAR) satellites with a 6 d revisit time (Torres et al., 2012). We used the polarization bands VV and VH, and the median was computed for all available observations in the ascending and descending scenes separately. The annual composite of Sentinel-1 was the mean of the two orbit composites for 2020. Sentinel-2 consists of two optical satellites that provide images at a revisit time of 5 d. We used the Sentinel-2 level-2A product, which provides terrain-corrected top-of-canopy reflectance. Non-valid observations were masked using the scene classification layer, which is produced by the Atmospheric and Topographic Correction (ATCOR) algorithm for the level-2A product (Drusch et al., 2012). The Sentinel-2 annual composites were generated using the median of all available valid observations for 2020. The compositing for Sentinel-1 and Sentinel-2 was identical to that of the global oil palm layer described in Descals et al. (2021), with the exception that the global oil palm layer was created with images from the second half of 2019 rather than the whole of 2020. The coconut species is an evergreen plant, and its canopy does not show substantial seasonal changes that can be captured in Sentinel-1 and Sentinel-2. The annual compositing used in this study may not be effective for mapping crops and vegetation that present a distinctive land surface phenology, which can provide key information for successfully mapping their extent (Son et al., 2013).
2.4 Feature selection
The coconut palm classification follows a methodology similar to that used for the global oil palm layer (Descals et al., 2021). The classification comprised a semantic segmentation model that used three input layers. Two of these layers were the VV and VH polarization bands from Sentinel-1 owing to the capabilities of SAR data for mapping palm plantations (Descals et al., 2019). The optical band 4 from Sentinel-2 (red band; wavelength centred at 665 nm) was the third input layer in the global oil palm layer. Band 4 was chosen because it is the 10 m resolution band that provides the clearest depiction of harvesting trails in industrial plantations. In the red spectrum, harvesting trails have a high reflectance that contrasts with the low reflectance of the surrounding oil palm.
In contrast to industrial oil palm plantations, coconut palm plantations do not present a harvesting road network that can be identified in 10 m satellite data. Extensive coconut palm plantations, such as those found in Tabou (Côte d'Ivoire) and in small islands such as Talina (Solomon Islands) or Mapun (Philippines), might present harvesting roads, but these are not clearly visible in Sentinel-1 and Sentinel-2. In addition, there were coconut palm plantations incorrectly classified as oil palm in the global oil palm layer (Descals et al., 2021), indicating that a spectral band other than band 4 could better distinguish oil palm from coconut palm. We also found in our preliminary analysis that sago forests (Metroxylon sagu Rottb.) and mango plantations (Mangifera spp. L.) could also be confused with coconut palm in the VV–VH–band 4 composites. Thus, we inspected the spectral separability between coconut palm, oil palm, sago palm, and mango plantations for all 10 and 20 m Sentinel-2 bands. To test the spectral separability, we collected 40 points for each tree species. We normalized the Sentinel-1 and Sentinel-2 bands using the z normalization and evaluated the separability using the one-dimensional Bhattacharyya distance (Theodoridis and Koutroumbas, 2006). The Bhattacharyya distance evaluates the overlap between two independent distributions; the higher the Bhattacharyya distance, the lower the overlap between the spectral values of coconut palm and another tree species.
The separability analysis revealed low separability between coconut palm and oil palm plantations in the VV and VH bands (Fig. A2), which indicates that Sentinel-1 may not be able to distinguish between oil palm and coconut palm. Among the spectral bands, Sentinel-2 band 11 (short-wave infrared spectrum; wavelength centred at 1614 nm) exhibited the greatest spectral separability between coconut palm and oil palm in terms of Bhattacharyya distance. Since oil palm plantations potentially overlap with coconut palm to a greater degree than mango and sago palm, we selected band 11 as the optical band for the classification of coconut palm. Since band 11 has a spatial resolution of 20 m, we aggregated the Sentinel-1 composites to 20 m using bilinear interpolation. As a result, the final coconut palm layer has a spatial resolution of 20 m.
2.5 Semantic segmentation
The Sentinel-1 and Sentinel-2 composites were classified using a semantic segmentation model, specifically a U-Net model with MobileNet-v2 as the backbone (Falk et al., 2019). Semantic segmentation is a type of deep learning model that consists of a pixel-wise classification of an image using a convolutional neural network. Semantic segmentation is well suited to mapping plantations, such as coconut palm, since it can automatically capture the spatial and contextual information in the image, and as a result, less effort is required compared to feature engineering in standard machine learning (Ma et al., 2019). Such contextual information includes the shape of the plantation or texture patterns within the plantation.
Semantic segmentation models require image data with a fixed size for both training and prediction. We set the size of the input images to 512 × 512 pixels, which is approximately 10 × 10 km in a 20 m resolution image. The collection of training data consisted of digitizing polygons in regions that were identified in the bioclimatic analysis. The polygons were drawn in 146 training images (Fig. 1b) using a sub-metre resolution to discriminate coconut palm plantations from other land covers. The sub-metre-resolution images were the images displayed as the base layer in Google Earth. The U-Net was used for binary classification of coconut palm (digitized polygons) and the rest of the land covers (image background; see Fig. A3) and, thus, the resulting layer was a binary raster, in which each pixel presented values of 0 (coconut palms are not present) and 1 (coconut palms are present). In addition, we generated a probability layer using the second-last layers of the convolutional neural network. Rather than probability layers, the second-last layers represent a confidence score (ranging from 0 to 100) for each class prediction. The probability layer we provide corresponds to the second-last layer of the class of coconut. The U-net model was trained and deployed using the PyTorch framework in the Microsoft Planetary Computer Hub.
2.6 Validation
We evaluated the accuracy of the global coconut palm layer using the good practices for estimating area and assessing accuracy as described by Olofsson et al. (2014). To assess the validity of the classification layer, we needed extensive, randomly distributed, well-characterized reference points across the coconut-producing region. We used a stratified random sampling over the areas delimited by the potential coconut palm distribution. A total of 10 200 reference points were sampled: 557 points in pixels classified as the class of coconut and 9643 points in pixels classified as the class of other. In stratified random sampling, the pixels that present the same class have an equal probability of being sampled. Here, we sought a cost-effective alternative by visually reviewing the sub-metre-resolution images from Google Earth because coconut palms can be identified using such data. The interpreters assigned a truth label based on the following five interpretations:
- 0.
Land cover could not be determined because sub-metre-resolution data were not available.
- 1.
Other land cover indicates that coconut palms are not present within the 20 m pixel.
- 2.
Sparse coconut palm indicates a low density of coconut palms, whereby there are between one and four coconut palms within the 20 m pixel.
- 3.
Dense open-canopy coconut palm indicates that there are more than four coconut palms within the 20 m pixel, but the coconut palms do not reach the full canopy closure.
- 4.
Closed-canopy coconut palm indicates that there are more than four coconut palms within the 20 m pixel and that coconut palms fully cover the ground.
The validation points were first labelled by a team of three interpreters, and then we used a second level of verification (Szantoi et al., 2021). The second level of verification consisted of an independent interpreter that verified the points that the team labelled as coconut. There were 1814 points in which the land cover could not be determined, and, thus, the total number of reference points was 10 186 in the accuracy assessment (Fig. 1c). The number of points was 7581 for other land cover, 164 for sparse coconut, 120 for dense open-canopy coconut, and 202 for closed-canopy coconut. In the accuracy assessment, the points labelled other land cover were recoded as 0 (class of other). For the class of coconut, we considered three definitions (Fig. 2a). The first definition assigned the class of coconut when at least one coconut palm was found within a 20 m pixel. Points labelled as sparse coconut, dense open-canopy coconut, and closed-canopy coconut were recoded as 1. This initial definition aimed to provide an estimate of all coconut-producing regions. The second definition considered as the class of coconut the points labelled as dense open-canopy coconut and closed-canopy coconut. This second definition aimed to evaluate the capability of Sentinel-1 and Sentinel-2 for mapping dense coconut stands that do not reach full canopy closure. The third definition only considered points labelled as closed-canopy coconut in the class of coconut.
The accuracy metrics included the producer's accuracy (PA), the user's accuracy (UA), and the overall accuracy (OA). The producer's accuracy represents the proportion of pixels of a given class that were not omitted in the classification, while the user's accuracy shows the proportion of pixels that were not committed for a given class. The OA represents the proportion of pixels that were correctly classified. We also tested whether the OA was significantly higher than the no-information rate. The no-information rate is the overall accuracy obtained by classifying all pixels with the largest land cover class – in our case, the class of other. An overall accuracy significantly higher than the no-information rate indicates that the classification model did better than classifying indiscriminately all pixels with the class of other. We reported the post-stratified metrics for PA, UA, and OA using the practices in Olofsson et al. (2014) and Szantoi et al. (2021). These practices also explain the area estimation for each class in the land cover map. While the mapped area reveals the area that was classified as a particular class, the area estimates account for omission and commission errors and provide an area with a confidence interval. All metrics of accuracy and area estimates were reported with a confidence interval of 95 %.
2.7 Area estimates for small tropical islands
The global coconut palm layer relies on the availability of Sentinel-1 and Sentinel-2 data. These two satellites provide images for the larger land masses across the globe, but the data are missing in parts of the Pacific and other small tropical islands. On small islands with no Sentinel-1 or Sentinel-2 data, coconut palm mapping was not possible using our classification model. To overcome this issue, we used a sampling-based method to estimate the coconut palm area on small tropical islands owing to the availability of sub-metre-resolution satellite images for most of these islands. The sampling-based approach comprised randomly sampling 5000 points within the small tropical island extents (Fig. 1d). Small tropical islands included islands with an area between 1 and 200 ha in the tropics (latitudes within 30∘ S and 30∘ N) in a reference dataset (Sayre et al., 2019). The points were visually interpreted and categorized into the following five classes:
- 0.
Land cover could not be determined because sub-metre-resolution data were not available.
- 1.
Non-vegetated land cover indicates that vegetation coverage is < 50 % and that coconut palms are not present within a 20 m bounding box.
- 2.
Other vegetation indicates that vegetation coverage is > 50 % and that coconut palms are not present within a 20 m bounding box.
- 4.
Sparse coconut palm indicates a low density of coconut palm, specifically between one and four coconut palms within a 20 m bounding box.
- 5.
Dense open-canopy and closed-canopy coconut palm indicate more than four coconut palms within a 20 m bounding box.
The area occupied by coconut palm on the small islands was inferred using the proportion of coconut points (); Areacoconut= Area, where Areacoconut is the area covered by coconut palm, and Areaislands is the total area of small islands per country or globally. The 95 % confidence interval for Areacoconut was estimated using the confidence interval for a population proportion; CI , where CI is the confidence interval, p is the proportion of points categorized as coconut (), and n is the total number of sampled points. The area estimates for small islands did not consider the difference between dense open-canopy and closed-canopy coconut palm. The distinction was made solely to assess the performance of the classification model for mapping dense open-canopy coconut palm.
We collected 1139 points in places where coconut palms were visually identified using sub-metre-resolution images (Fig. 1a). The points were located in the tropics between 25.24∘ S and 26.40∘ N, generally in low-elevation areas close to the coast. The coconut palms at the highest elevation were found at 988 m in the Indian state of Karnataka. Nevertheless, the average altitude was 101 m, and the average distance to the ocean was 750 m. Some coconut palms were found hundreds of kilometres inland; for example, a coconut palm was found in Bolivia at 808 km from the Pacific Ocean (Fig. A4a). These coconut palms presented yellow-coloured leaves, indicating substandard growing conditions, and were never observed as a plantation. The bioclimatic analysis confirmed that coconut palm grows predominantly in regions with a warm and humid oceanic climate, characterized by low daily and seasonal temperature variations due to the proximity of oceans. In the 1139 points used for the bioclimatic analysis, the mean annual temperature ranged from 22.4 ∘C (minimum) to 28.8 ∘C (maximum) (Table A1). The lowest monthly mean temperature recorded during the coldest month was 11.5 ∘C. The southern and northern limits of the potential coconut palm distribution were predominantly semi-arid regions (Fig. A5). We found that coconut palm is cultivated in a variety of rainfall regimes. Coconut palm plantations were found in arid and semi-arid regions (annual rainfall < 250 mm), such as Dhofar Governorate in Oman (17.0054∘ N, 54.1069∘ E), Sindh Province in Pakistan (24.7204∘ N, 67.5855∘ E), and Tumbes Province in Peru (4.0481∘ S, 80.9472∘ W). However, coconut palm is grown with irrigation in these regions and represents a negligible area compared to the extensive plantations in the state of Kerala in India, the Philippines, and Indonesia, where rainfall is abundant (annual rainfall > 2000 mm).
The global coconut palm layer has an overall accuracy of 99.04 ± 0.21 % (intervals represent 95 % confidence) based on the post-stratified accuracy assessment of the 10 186 validation points and considering the first definition of coconut palm, which included sparse coconut palm and dense open- and closed-canopy coconut palm. The overall accuracy was greater than the no-information rate (94.13 ± 0.51 %), indicating that the classification improved upon one in which all pixels were classified as the class of other. The producer's and user's accuracy were 11.30 ± 2.33 % and 79.21 ± 3.46 % for the class of coconut, respectively, and 99.97 ± 0.01 % and 99.07 ± 0.21 % for the class of other (Table 1). Without considering points in sparse coconut palm, the producer's accuracy increased to 32.32 ± 10.17 %. If only closed-canopy coconut palms were considered, the producer's accuracy was 71.51 ± 23.11 % for the class of coconut. This large difference in the producers' accuracy for the different definitions of the class of coconut indicates that sparse and dense open-canopy coconut palms were largely omitted in the classification.
Table 1Accuracy assessment of the global coconut palm layer for the year 2020. The accuracy metrics were estimated with 10 186 points randomly distributed in the regions where coconut palm can potentially grow. The accuracy metrics are reported with a 95 % confidence interval.
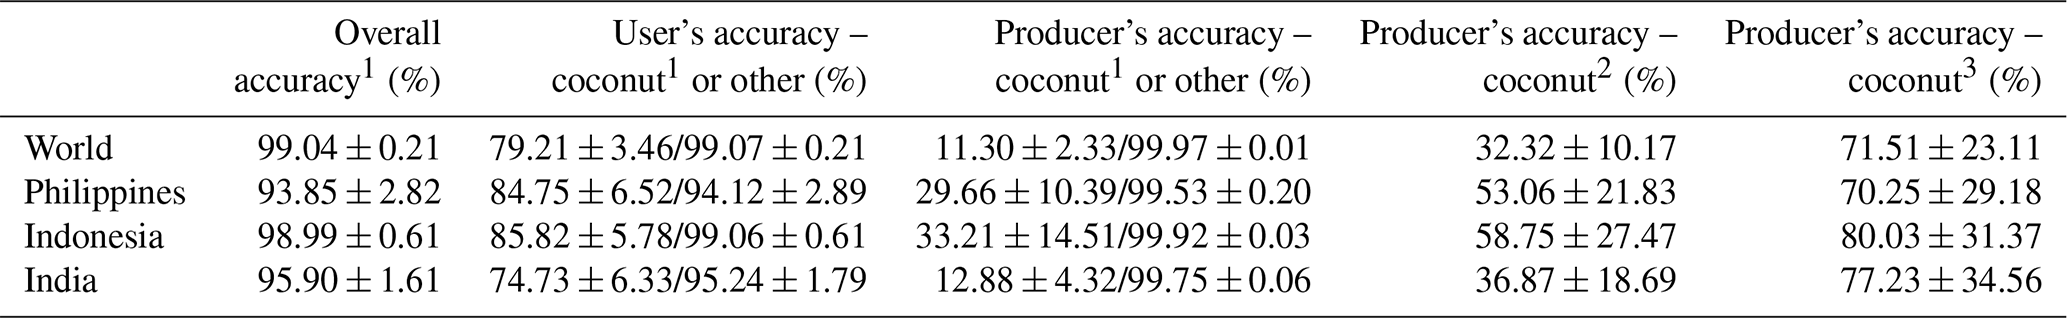
1 Sparse and dense open- and closed-canopy coconut palm. 2 Dense open- and closed-canopy coconut palm. 3 Closed-canopy coconut palm.
According to a visual examination of sub-metre satellite images, we identified several palm tree species that were incorrectly classified as the class of coconut (Fig. 2b), explaining the low user's accuracy for the class coconut (79.2 %). We found false positives in sago palm and nypa palm (Nypa fruticans Wurmb.) in southeast Asia and the Pacific, in raffia palm (Raphia spp. P.Beauv.) in South America and Africa, in areca palm (Areca catechu L.) in India, in euterpe palm (Euterpe edulis Mart.) in South America, in attalea palm (Attalea spp. Kunth) in central America, and in palmyra palm (Borassus spp. L.) in Africa. Even though band 11 was included in the classification model, oil palm plantations, especially those of smallholders, were residually detected as coconut palm. Most of these false positives were eliminated in the final layer by manually editing the output of the classification (Figs. 3 and A6). The vast bulk of these palms was found apart from coconut palm plantations and could be identified in the high-resolution satellite data. For instance, in New Guinea, coconut palm typically covers the first kilometres from the sea, while sago palm covers areas farther inland (Fig. A7). We also found false positives for the class of coconut in mango, a non-palm plantation. Mango plantations were located on the Pacific coast of Mexico and in the state of Gujarat, India. Removing false positives in mango plantations was problematic due to the co-occurrence of coconut palm and mango plantations in the landscape. In addition, we found plantations that contained both mango and coconut palm (Fig. A4b). Other intercropping settings were found with maize (Zea mays L.), rice (Oryza spp. L.), and banana (Musa spp. L.) (Fig. A4c, d, and e). In contrast, we did not find intercropping in closed-canopy coconut palm, which was generally devoid of understories aside from grasslands and small shrublands (Fig. A4f and g).
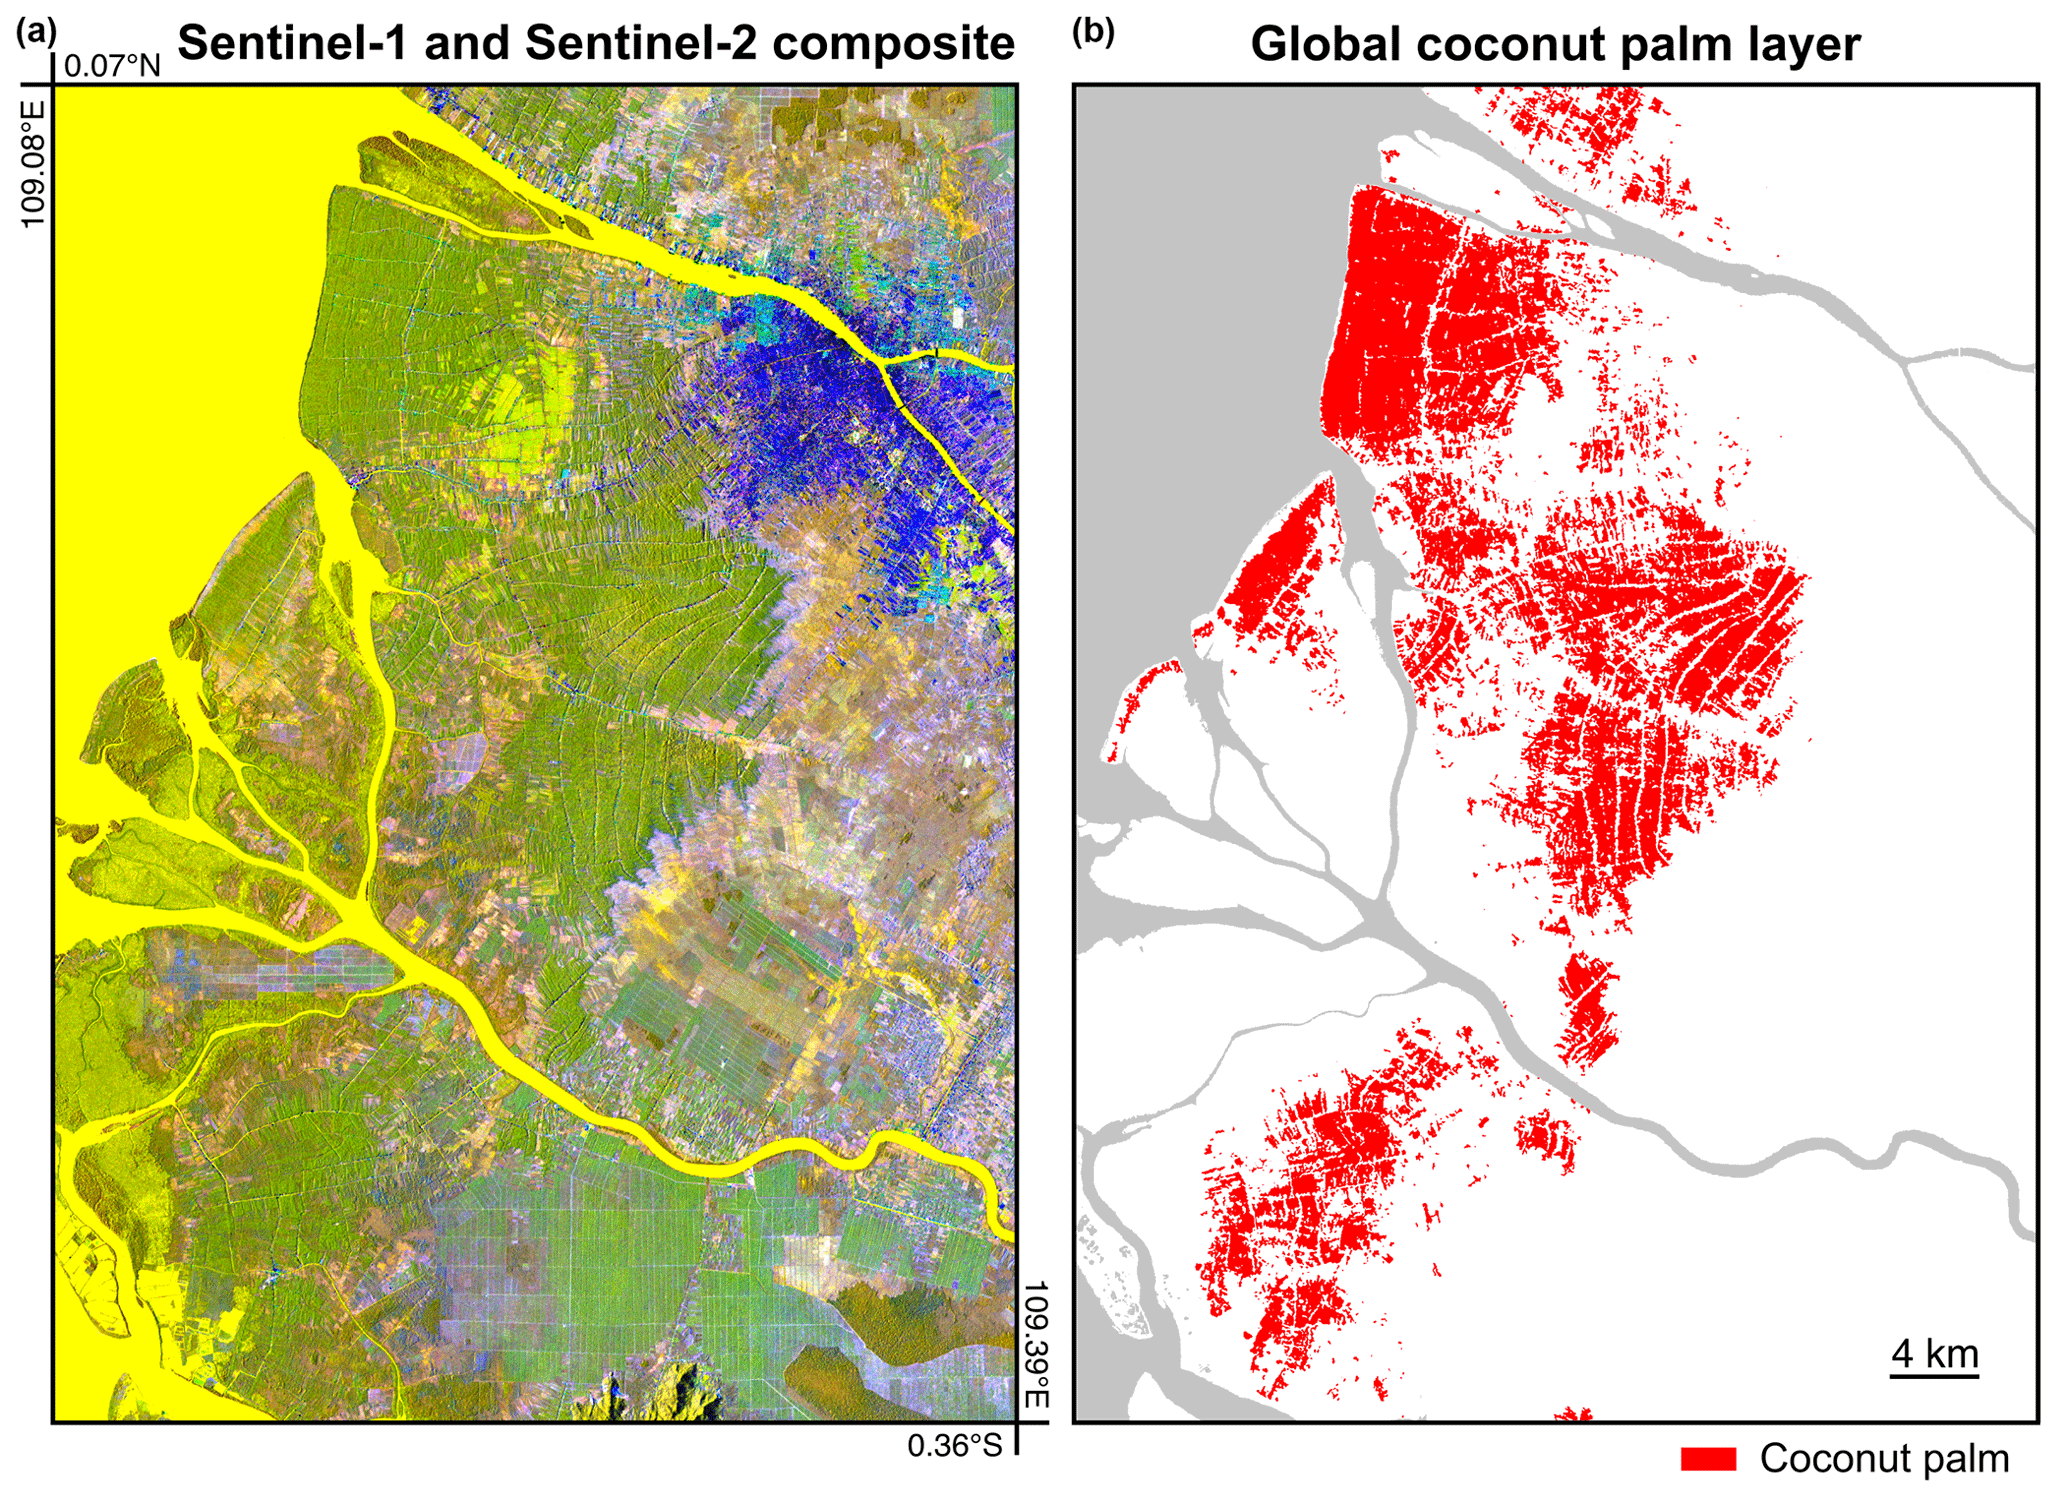
Figure 3Classification of a Sentinel-1 and Sentinel-2 annual composite into a land cover map of coconut palm in West Kalimantan (Indonesia). The Sentinel-1 and Sentinel-2 composite (a) includes the polarization bands VV and VH and the spectral band 11 (short-wave infrared). In this composite, coconut palm and oil palm appear in different shades of green. Oil palm is present in the lower-right part of the image with a brighter green colour than coconut palm. In this composite, water appears in yellow. The classification image (b) shows the coconut palm plantations in red.
Most of the validation points for the class of coconut fell within the three main coconut-producing regions: the Philippines (115 points), Indonesia (130 points), and India (162 points). Owing to this dense sampling, we could generate separate accuracy assessments for these three countries (Table 1). The next country was Sri Lanka, with only 14 points labelled as the class of coconut, which is insufficient for evaluating the accuracy. The accuracy assessment revealed similar omission rates for closed-canopy coconut palm at the country level compared to the global assessment. The producer's accuracy for the class of coconut was lowest in the Philippines (70.25 ± 29.18 %) compared to Indonesia (80.03 ± 31.37 %) and India (77.23 ± 34.56 %), although the large confidence interval indicates that the difference is not significant.
The total area mapped as coconut palm was 5.55 × 10⁶ ha (Table 2). Coconut palm was mainly found in India and southeast Asia (Fig. 4), regions where we also found most of the largest clusters of coconut palm plantations (Figs. 5 and A8, which depict the coconut palm probability layer). The area estimates revealed that coconut palm covers 38.93 ± 7.89 × 10⁶ ha, including sparse and dense open- and closed-canopy coconut palm. If only dense open- and closed-canopy coconut palms were considered in the accuracy assessment, the global coconut palm area was 12.66 ± 3.96 × 10⁶ ha, which is similar to the 11.61 × 10⁶ ha reported globally by FAO. The coconut palm mapped area was 1.54 × 10⁶ ha in the Philippines, 1.73 × 10⁶ ha in Indonesia, and 1.29 × 10⁶ ha in India, which together represent 82 % of the global coconut palm mapped area (Fig. A9). Other hotspots of coconut production were found along the Pacific coast of Mexico, Brazil, Ghana, Côte d'Ivoire, Tanzania, Mozambique, Sri Lanka, Vietnam, Thailand, and Papua New Guinea. In some of these countries, the mapped coconut palm area corresponded well with FAO statistics, for instance, in Papua New Guinea, Vietnam, and Thailand. In contrast, Tanzania is the fourth largest coconut-producing country with 0.60×10⁶ ha according to FAO, but only 0.03 × 10⁶ ha was mapped. In eastern Africa, coconut palm is sparsely planted (Fig. A4h), which could account for our likely underestimation. The coconut palm area estimate for Tanzania (0.52 ± 0.48 × 10⁶ ha) was consistent with FAO, although the estimate has a large confidence interval due to low sampling in this country.
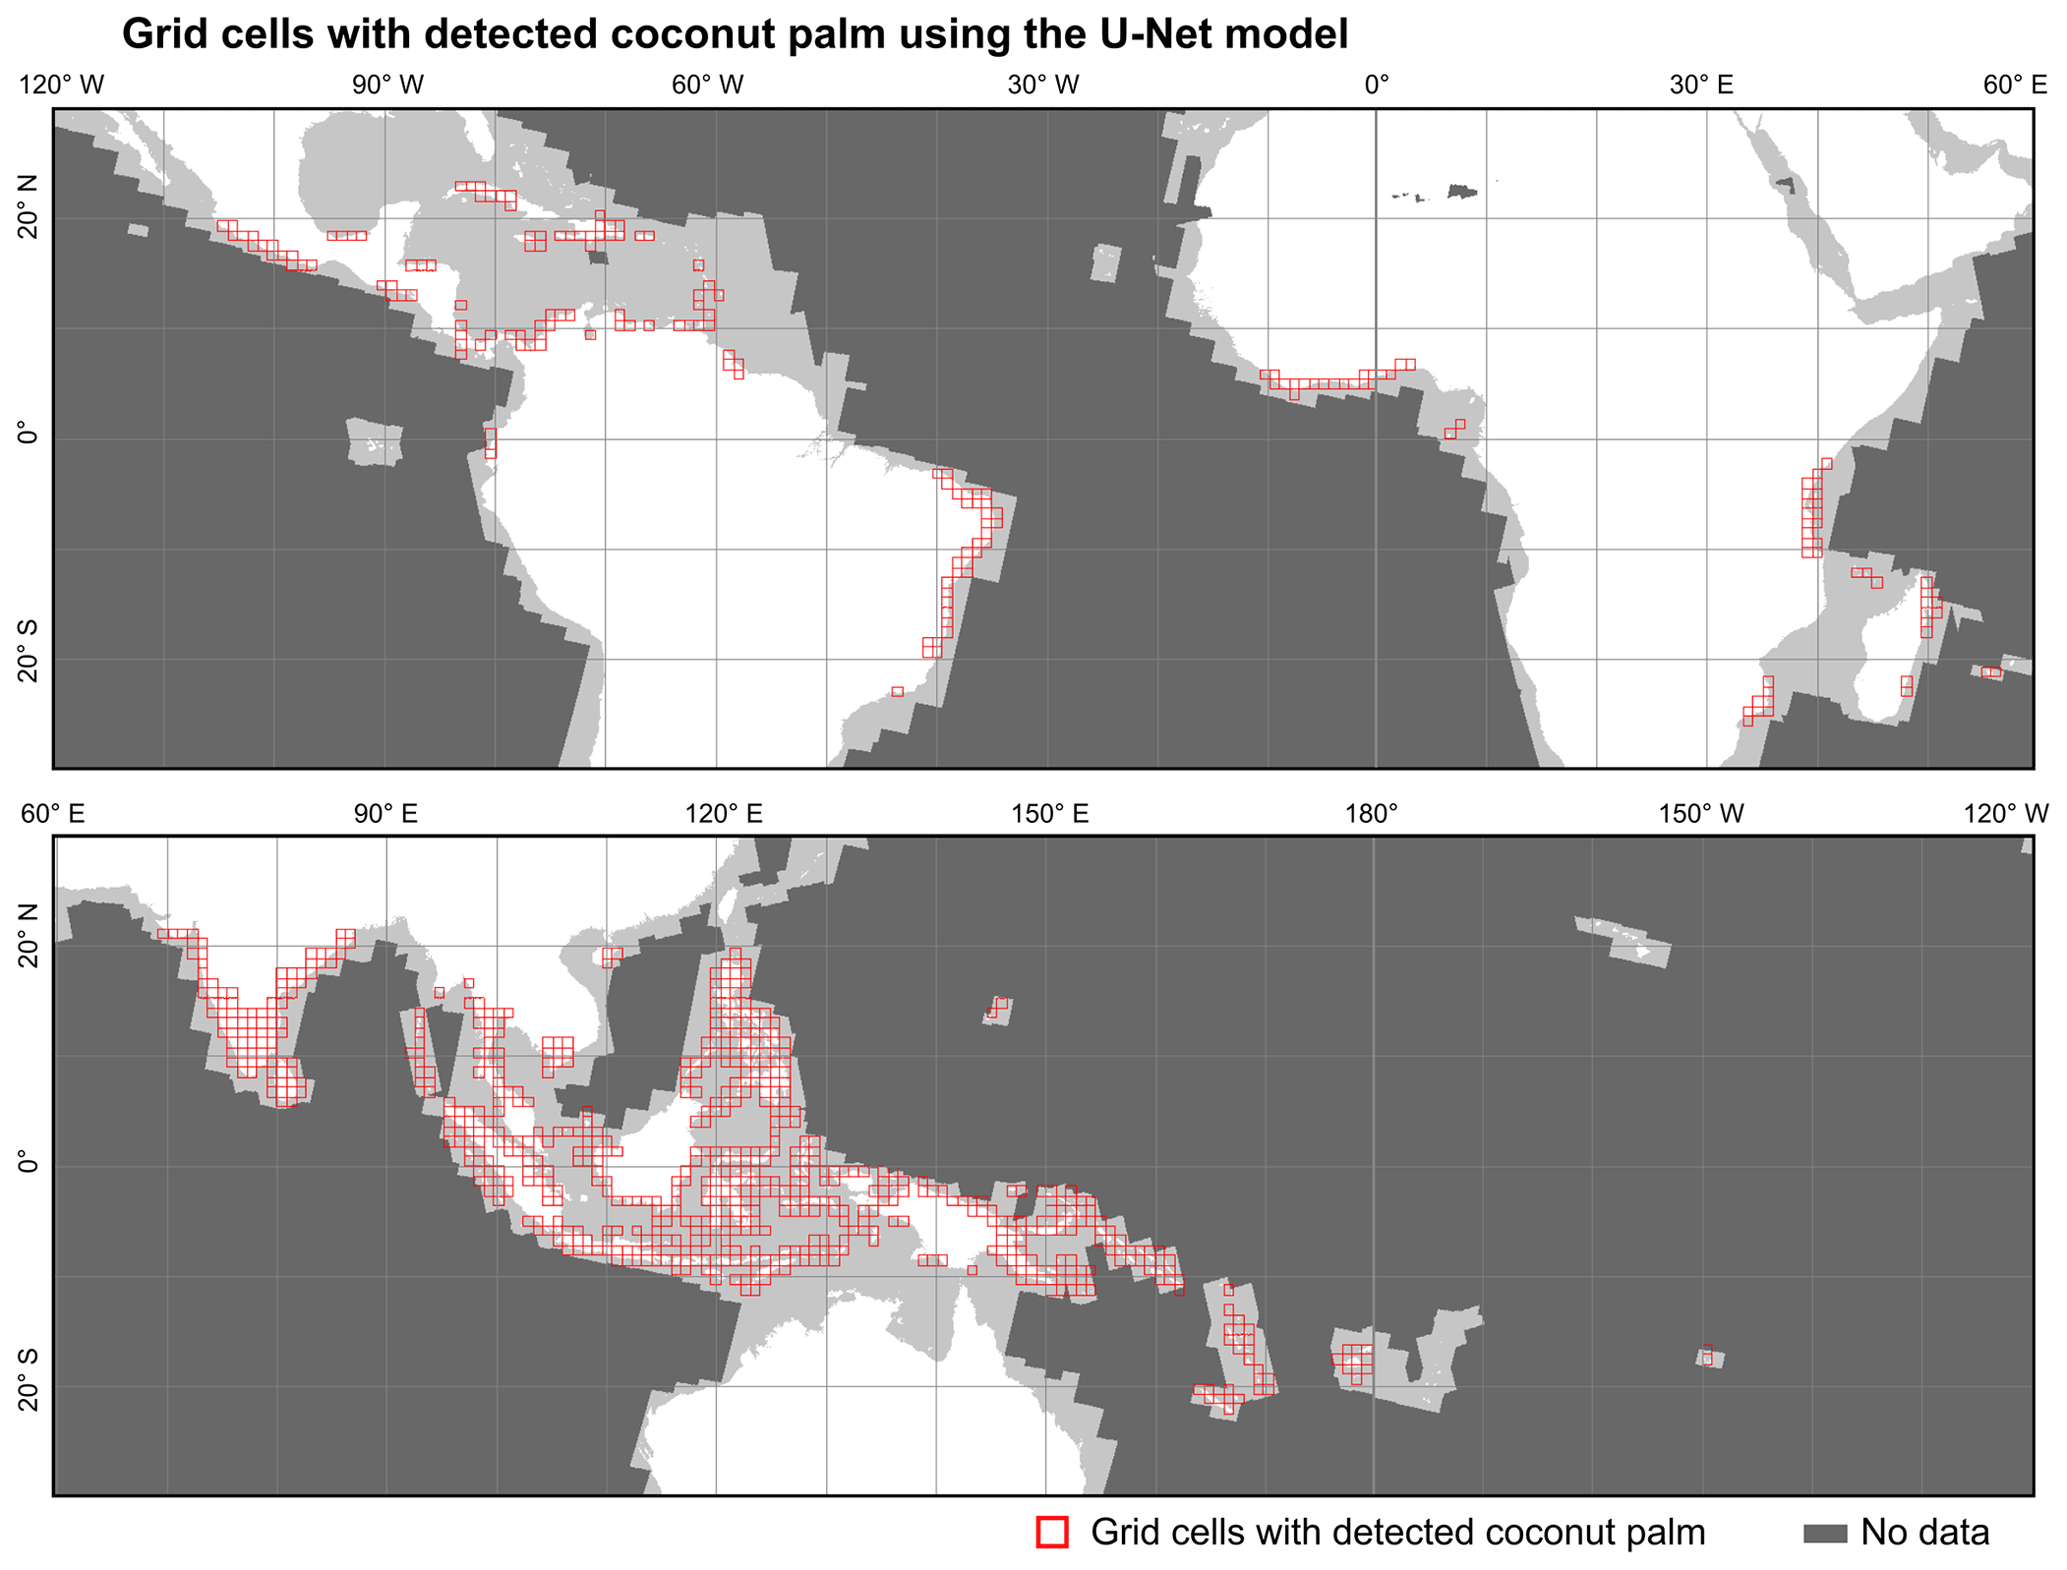
Figure 4Global occurrence map of coconut palm. Grid cells in red depict areas where coconut palm was detected using a U-Net model and annual Sentinel-1 and Sentinel-2 composites for 2020. The cell size is 100 × 100 km. Dark grey represents areas where Sentinel-1 or Sentinel-2 were not available.
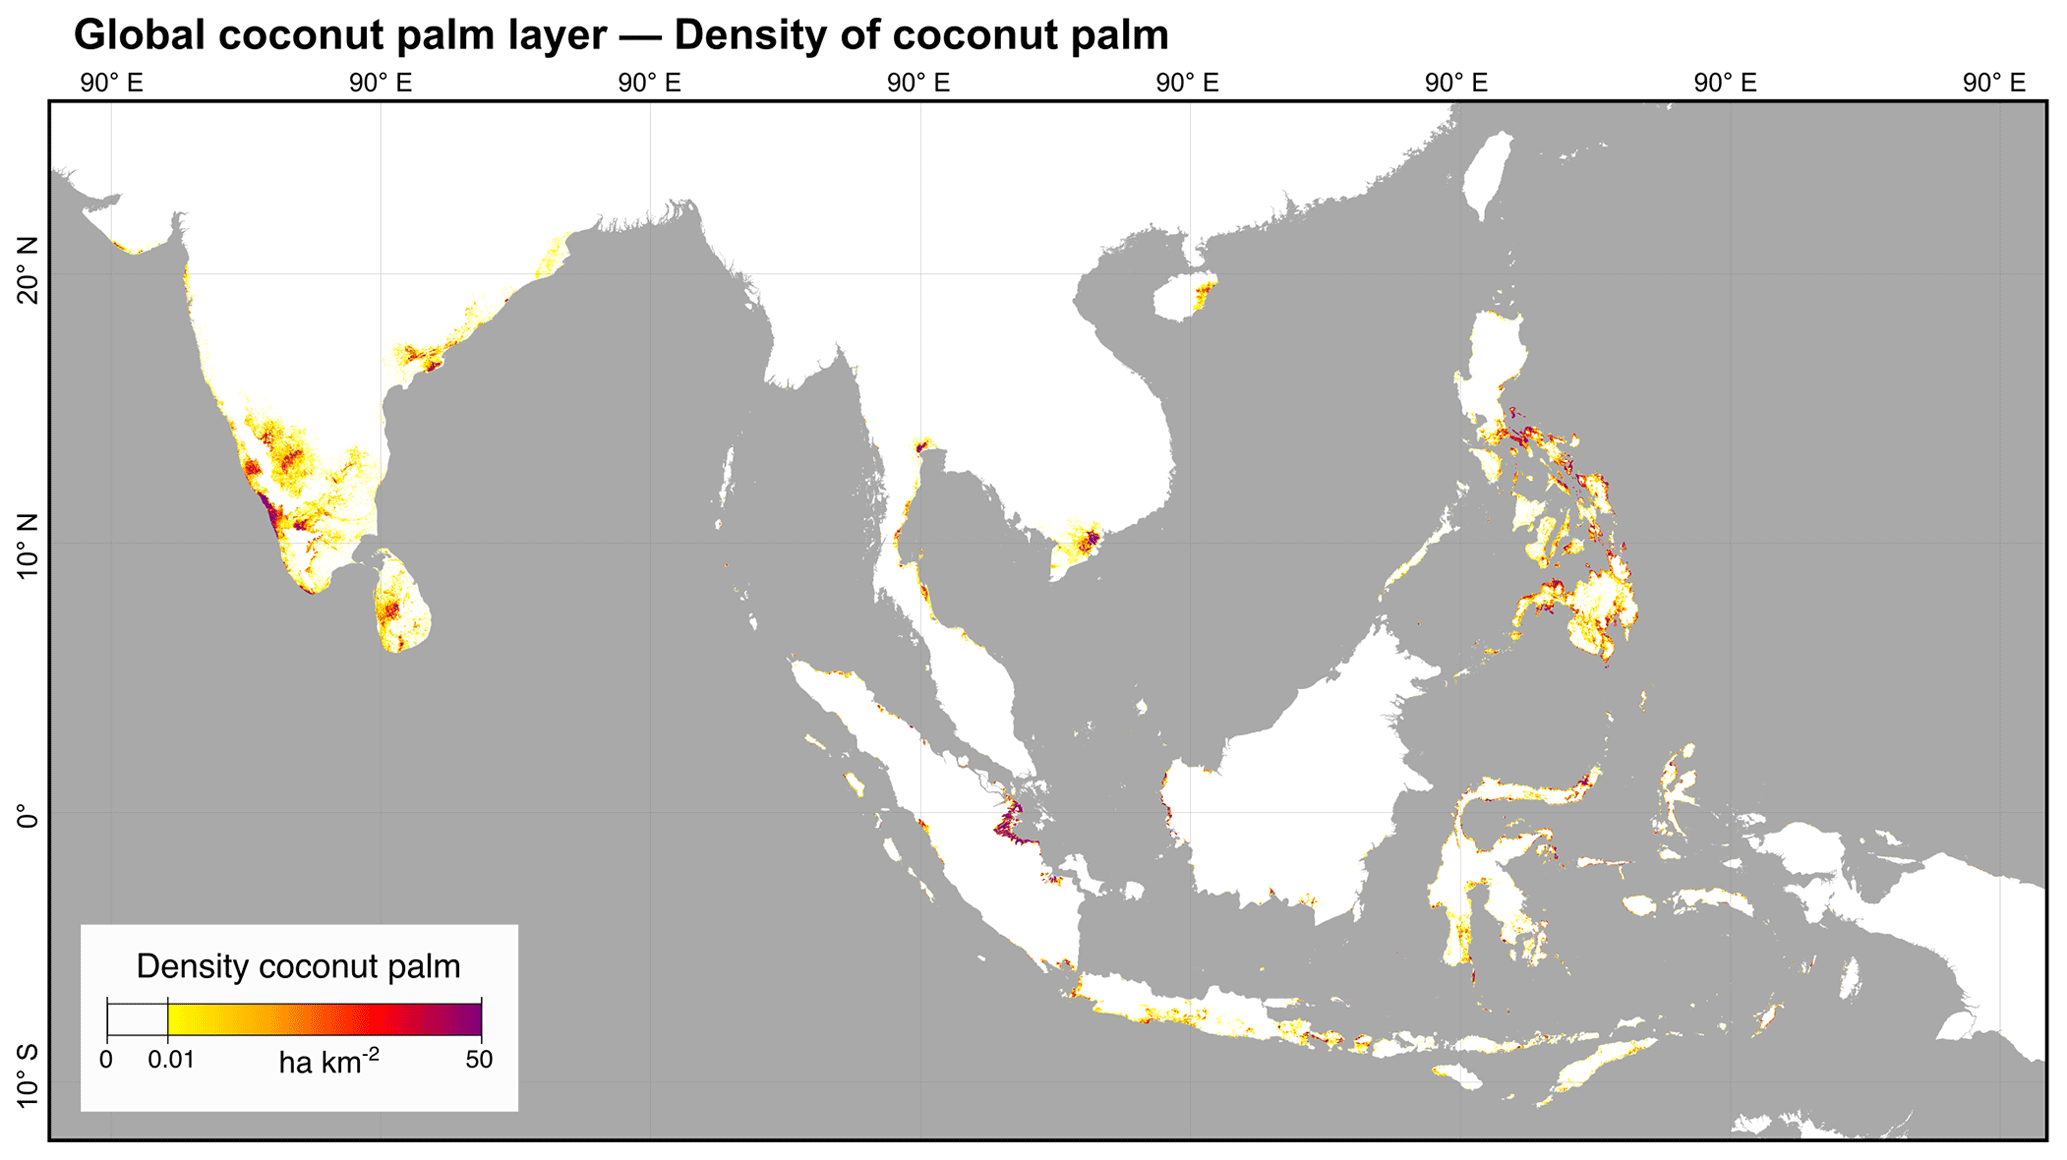
Figure 5Density of coconut palm in India and southeast Asia at 1 km resolution. The map was generated using the 20 m global coconut palm layer. The density map highlights the primary regions of coconut production.
Table 2Coconut palm area mapped for 2020, harvested area obtained from FAO statistics for 2020, and area estimates for three definitions of coconut palm: (1) sparse and dense open- and closed-canopy coconut palm, (2) dense open- and closed-canopy coconut palm, and (3) only closed-canopy coconut palm. The area estimates are reported with a 95 % confidence interval.
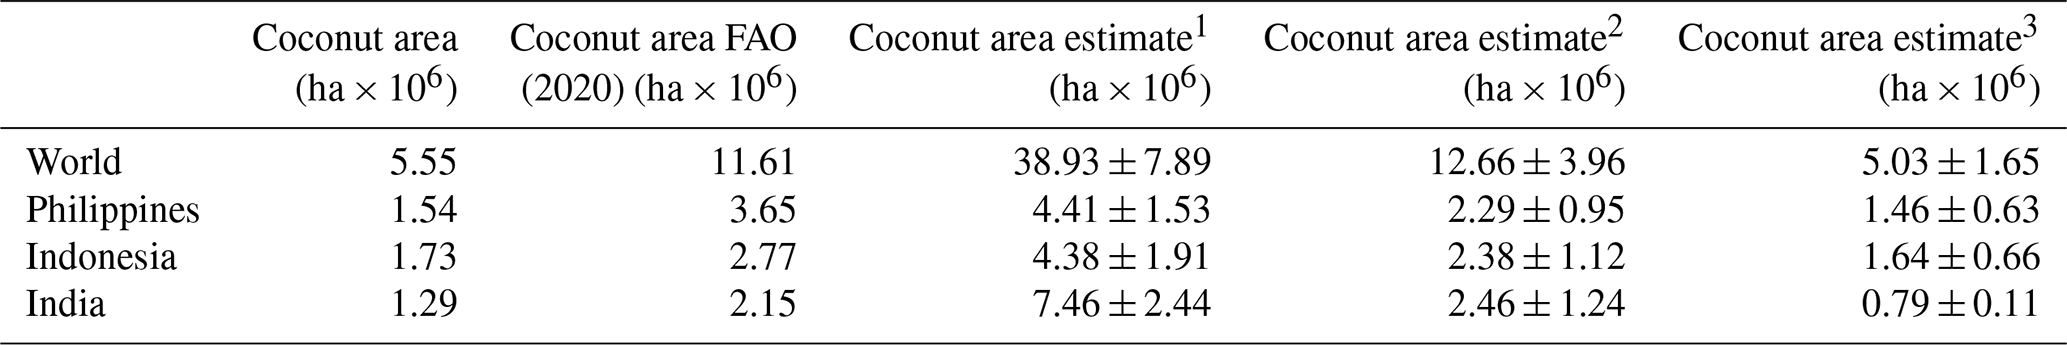
1 Sparse and dense open-, and closed-canopy coconut palm. 2 Dense open- and closed-canopy coconut palm. 3 Closed-canopy coconut palm.
We found that several countries in the Pacific Ocean had a large coconut palm area in comparison to their overall land area. Papua New Guinea had the largest coconut palm area mapped (0.17 × 10⁶ ha) followed by Vanuatu (0.6 × 10⁶ ha) and the Solomon Islands (0.5 × 10⁶ ha). Figure 4 shows the availability of Sentinel-1 and Sentinel-2 data, which are lacking in many islands in the Pacific Ocean. According to sampling-based estimates on small tropical islands (land area < 200 ha), Indonesia and the Philippines were the countries with the largest coconut palm area (Fig. A10a), accounting for 33 798 ± 530 and 21 231 ± 630 ha of dense coconut palm and 34 944 ± 556 and 16 681 ± 444 ha of sparse coconut palm, respectively. The ratio of coconut palm to total area revealed that small islands in the Pacific had the highest coconut palm area relative to land area (Fig. A10b). Tuvalu had the highest percentage, with 81 % of the land in small islands covered with coconut palm. Other small islands in the Pacific countries presented a low proportion of coconut palm relative to total area but a high proportion relative to vegetated land. In French Polynesia, the overall proportion of coconut palm was only 22 %, but it comprised 50 % of all vegetated areas in the small islands.
We produced the first global coconut palm layer with a 20 m resolution and estimated the global area of coconut palm using remotely sensed data for the year 2020. We also generated a probability layer that provides a score indicating the confidence level of the model output. This probability layer could serve as a proxy for coconut palm density. The global coconut palm layer demonstrates the capabilities of Sentinel-1 and Sentinel-2 to map coconut palm. We observed that the spectral separability in band 11 was imperfect as residual false positives were still occurring in oil palm, sago palm, and other palm species, explaining the low user's accuracy for the class of coconut (79.2 %). Our model omitted most of the coconut palm that did not reach full canopy closure, and coconut palm remained broadly undetected when trees were sparsely distributed throughout the land. This issue was also found in industrial plantations with a wide planting mark. A similar problem was found in the global mapping of oil palm, which reported higher omission errors in semi-wild oil palm in western Africa (Descals et al., 2021). Despite this, the producer's accuracy for closed-canopy coconut palm (71.51 ± 23.11 %) was similar to that obtained in the global oil palm layer, which were 75.78 ± 3.55 % for smallholders and 86.92 ± 5.12 % for industrial oil palm. This indicates that Sentinel-1 and Sentinel-2 can map closed-canopy palm species with a similar accuracy.
Sub-metre-resolution images could be used in future research to accurately map sparse coconut palm in small tropical islands where Sentinel-1 and Sentinel-2 data are unavailable. Object detection using deep learning applied to very-high-resolution images (< 1 m), such as those obtained by DigitalGlobe or Planet, offers great potential for the detection of individual coconut palms (De Souza and Falcão, 2020; Vermote et al., 2020; Freudenberg et al., 2019). This approach could be used to detect coconut palm plantations with incomplete canopy closure and coconut palms that are scattered across the land. In our study, the decametric resolution of Sentinel-1 and Sentinel-2 images made the use of object detection techniques unfeasible. Object detection using deep learning and sub-metre images could complement our closed-canopy coconut palm layer and could also be useful for mapping different palm trees, including coconut palm, oil palm, and sago palm. Because of the high costs of such imagery, sub-metre-resolution mapping would only be feasible in specific areas where these high-resolution data are crucial for informing planning and decision making about land use and agricultural development.
The potential coconut palm distribution confirmed previous insights about coconut-growing requirements, with an area covering most tropical coastal regions but not those with high aridity or low temperatures. Our potential distribution coincides with the coastal areas on a similar map for coconut palm (Coppens D'Eeckenbrugge et al., 2018). Soil types were not considered in the bioclimatic analysis for the estimation of the potential coconut palm distribution. Coconut palm prefers sandy soils, but different types of soil can support the growth of coconut palm as long as they are well drained (Chan and Elevitch, 2006), which explains why coconut palm grows in the first few kilometres of coastline in Papua, while sago palm dominates the landscape in inland swampy areas. The drainage requirements for coconut cultivation also explain the unsuitability of Vertisols, also known as black soils, which contain a high content of expansive clay minerals with inherent poor drainage. Despite not including a soil map in the bioclimatic analysis, the resulting layer from the coconut palm classification presented a negligible overlap with Vertisol areas, for instance the Deccan Traps in India. Additionally, we found that coconut palm generally grows in low-elevation coastal regions, but we also found coconut palm in mountainous regions in Tanzania, India, and, especially, the Philippines, corroborating previous observations in the country (Pabuayon et al., 2009). We did not include areas more than 200 km from the coast because we found very few coconut palms beyond that 200 km threshold in our visual assessment of high-resolution images.
Our findings show that the area designated for growing sparse open- and closed-canopy coconut palm (38.93 ± 7.89 × 10⁶ ha) is significantly larger than the area recognized by the FAO (11.6 × 10⁶ ha). The FAO underreports planted area because it is based on production data and yield, and it does not account for areas sparsely covered in coconut palm. This finding indicates that much more land has been allocated to coconut palm growing than previously reported, even though coconut production may not be very important on much of that land. We do not know enough about the nature of sparsely planted coconut areas to judge how productive these lands are. In areas where coconut palm is intercropped with other crops, overall land productivity depends on more than coconut production. Sparse coconut palm areas may also relate to old plantations with limited maintenance and low productivity, which is a known problem in the coconut industry (Peiris et al., 2001). Overall, the coconut industry is known to have a gap between potential and actual yields, which relates to the prevalence of pests and diseases, inferior varieties, outdated agronomical practices, and the high proportion of senile palms (Alouw and Wulandari, 2020). Therefore, the large area of sparse and dense open-canopy coconut palm indicates that production increases can likely be achieved on the existing lands allocated to coconut production.
The potential increases in coconut production have environmental consequences because demand for coconut products is rapidly growing, putting pressure on the industry to expand land holdings. Global coconut revenues are predicted to increase from USD 5.7 billion in 2022 to USD 7.4 billion in 2027 (MarketsandMarkets, 2023), and the more production increases that can be met on existing land, the less impact this will have on food security and biodiversity in areas that would otherwise be displaced by new coconut palm plantations. Furthermore, our map will help in predicting the likely impact of climate change on coconut productivity, as recently determined for India (Hebbar et al., 2022). While we acknowledge that the impacts of these production predictions remain unclear, having the first high-resolution map of global coconut palm provides a solid basis for monitoring how this crop develops. This map also allows for the quantification of the effects of coconut palm expansion on natural ecosystems such as tropical lowland forests, mangroves, and beach forests, which helps to inform global biodiversity and environmental policy. Such policies could focus on increasing productivity on existing coconut lands so that no new expansion is required, potentially focusing on sparse and open-canopy coconut palm regions where yield increases might be less challenging. On the other hand, meeting coconut production increases on existing dense coconut land could also allow for phasing out unproductive sparse coconut lands and restoring them to natural ecosystems with potential biodiversity and other environmental benefits (Carr et al., 2021).
While we were unable to map coconut palm in small islands in the Pacific (because of the absence of Sentinel-1 and Sentinel-2 data), our area estimates confirm that coconut palm is a dominant species in many of these island nations, with several countries having more than half of their land area of small islands covered in coconut palm. This indicates the importance of this crop for many smallholder producers in the Pacific, who often grow this cash crop together with other crops, with coconut palm being the permanent crop and other crops being grown when their prices are high (Feintrenie et al., 2010). Like elsewhere, these smallholder producers struggle with low coconut productivity, but this may be compensated for by good yields from other crops. Where coconut palm is grown as a monoculture, reorganization of the coconut industry has been proposed, potentially along similar lines as palm oil production, based on the nucleus estate or nucleus–plasma concept. High coconut palm coverage on small islands in the Pacific and Indian oceans and to a lesser extent in the Caribbean may be a significant threat to biodiversity and other ecosystem services (Meijaard et al., 2020), especially because coconut palm can be invasive on tropical islands (Young et al., 2017). More work needs to be done to map coconut palm areas on these islands, ideally using sub-metre-resolution data where Sentinel-1 and Sentinel-2 data are currently unavailable. Once such maps become available, they can provide better insight into the extent to which coconut palm has displaced natural ecosystems; relative coconut productivity (in areas with detailed harvest information); and the potential for coconut palm expansion, conversion to other forms of agriculture, or restoration of natural ecosystems. Detailed and accurate spatial information is a key component in any land use optimization planning for coconut palm and for other crops.
The dataset presented in this study is freely available for downloading at https://doi.org/10.5281/zenodo.8128183 (Descals, 2023). The file “GlobalCoconutLayer_2020_v1-2.zip” contains 878 raster tiles of 100×100 km in geotiff format. The raster files are the result of a convolutional neural network that classified Sentinel-1 and Sentinel-2 annual composites into a coconut palm layer for the year 2020. The images have a spatial resolution of 20 m and contain two classes:
- 0.
other land covers that are not coconut palm
- 1.
coconut palm.
The file “GlobalCoconutLayer_2020_densityMap_1km_v1-2.zip” contains the 20 m coconut palm layer aggregated to 1 km. The value of each pixel represents the coconut palm area (in square metres) within the 1 km pixel.
The file “Validation_points_GlobalCoconutLayer_2020_v1-2.shp” includes the 10 200 points that were used to validate the product. Each point includes the attribute “Class”, which is the class assigned by visual interpretation of sub-mete-resolution images, and the attribute “predClass”, which reflects the predicted class by the convolutional neural network. The “predClass” values are the same as the raster files:
- 0.
other land covers that are not coconut palm
- 1.
coconut palm.
The attribute “Class” contains the following values:
- 0.
Land cover could not be determined because sub-metre-resolution data were not available.
- 1.
Other land covers that are not coconut palm are indicated.
- 2.
Sparse coconut palm indicates a low density of coconut palms (between one and four coconut palms within the 20 m pixel).
- 3.
Dense open-canopy coconut palm indicates more than four coconut palms within the 20 m pixel, but coconut palms do not reach the full canopy closure.
- 4.
Closed-canopy coconut palm indicates more than four coconut palms within the 20 m pixel, and coconut palms fully cover the ground.
- 5.
Palm species were found that are not coconut palm.
The global coconut palm layer, the probability layer for the class of coconut, and the coconut palm density map can be visualized online at https://adriadescals.users.earthengine.app/view/global-coconut-layer (Descals, 2022).
The Sentinel-1 SAR ground-range-detected (GRD) and Sentinel-2 level-2A used in this study are available at the Copernicus Open Access Hub: https://scihub.copernicus.eu/ (European Space Agency, 2022). We used all Sentinel-1 and Sentinel-2 images that overlapped the potential distribution of coconut palm for the year 2020.
The WorldClim bioclimatic variables (WorldClim V1 Bioclim) (Hijmans et al., 2005) can be accessed at https://www.worldclim.org/data/v1.4/worldclim14.html (last access: 6 July 2022).
Very-high-resolution images (spatial resolution < 1 m) from DigitalGlobe can be visualized in the Google Earth Engine code editor or Google Maps.
The 5 arcmin global coconut palm area modelled with SPAM (Yu et al., 2020) is available at https://doi.org/10.7910/DVN/PRFF8V (International Food Policy Research Institute, 2019).
The country-wide harvested area of coconut palm was extracted from the FAOSTAT database at http://www.fao.org/faostat/en/ (last access: 10 March 2022) under the item “Coconuts in shell – Crops and livestock products (Production)” (FAO, 2022).
The original code of the U-Net model can be found at https://github.com/qubvel/segmentation_models.pytorch (Iakubovskii, 2019).
We mapped the global distribution of coconut palm using a deep learning model that classified satellite data (SAR Sentinel-1 and optical Sentinel-2) into a 20 m land cover map depicting the extent of closed-canopy coconut palm. The model achieved a high accuracy for closed-canopy coconut palm, and the resulting coconut palm layer accurately depicts the regions with the highest density of coconut palm. The presented dataset can be integrated into the recently published Essential Agricultural Variables' “Perennial Cropland Mask”, as well as the Food and Agricultural Organization's land cover classification system (LCCS) under “Cultivated and Managed Terrestrial Areas” – “Tree Crops” (Di Gregorio, 2005).
Our global coconut palm layer study provides the accurate high-resolution data required to evaluate the relationships between vegetable oil production and the synergies and trade-offs between different sustainable development goal indicators. Moreover, the global coconut palm layer can be used in geospatial analysis to assess the spatial overlap between coconut palm extent and areas of highly threatened species, species endemism, and species richness. In this regard, the coconut palm map presented in this study can be valuable for studying the environmental impacts associated with coconut cultivation in biodiversity hotspots.
Table A1Range of climate values extracted from 1139 coconut palm locations across the world. These ranges represent the minimum and the maximum values of the 19 WorldClim bioclimatic variables, elevation, slope, and maximum distance to the sea. The variable names bio05 and bio06 represent the maximum temperature of the warmest month and the minimum temperature of the coldest month. Variable names in bold present a low collinearity and were used in the bioclimatic analysis for estimating the potential coconut palm distribution.
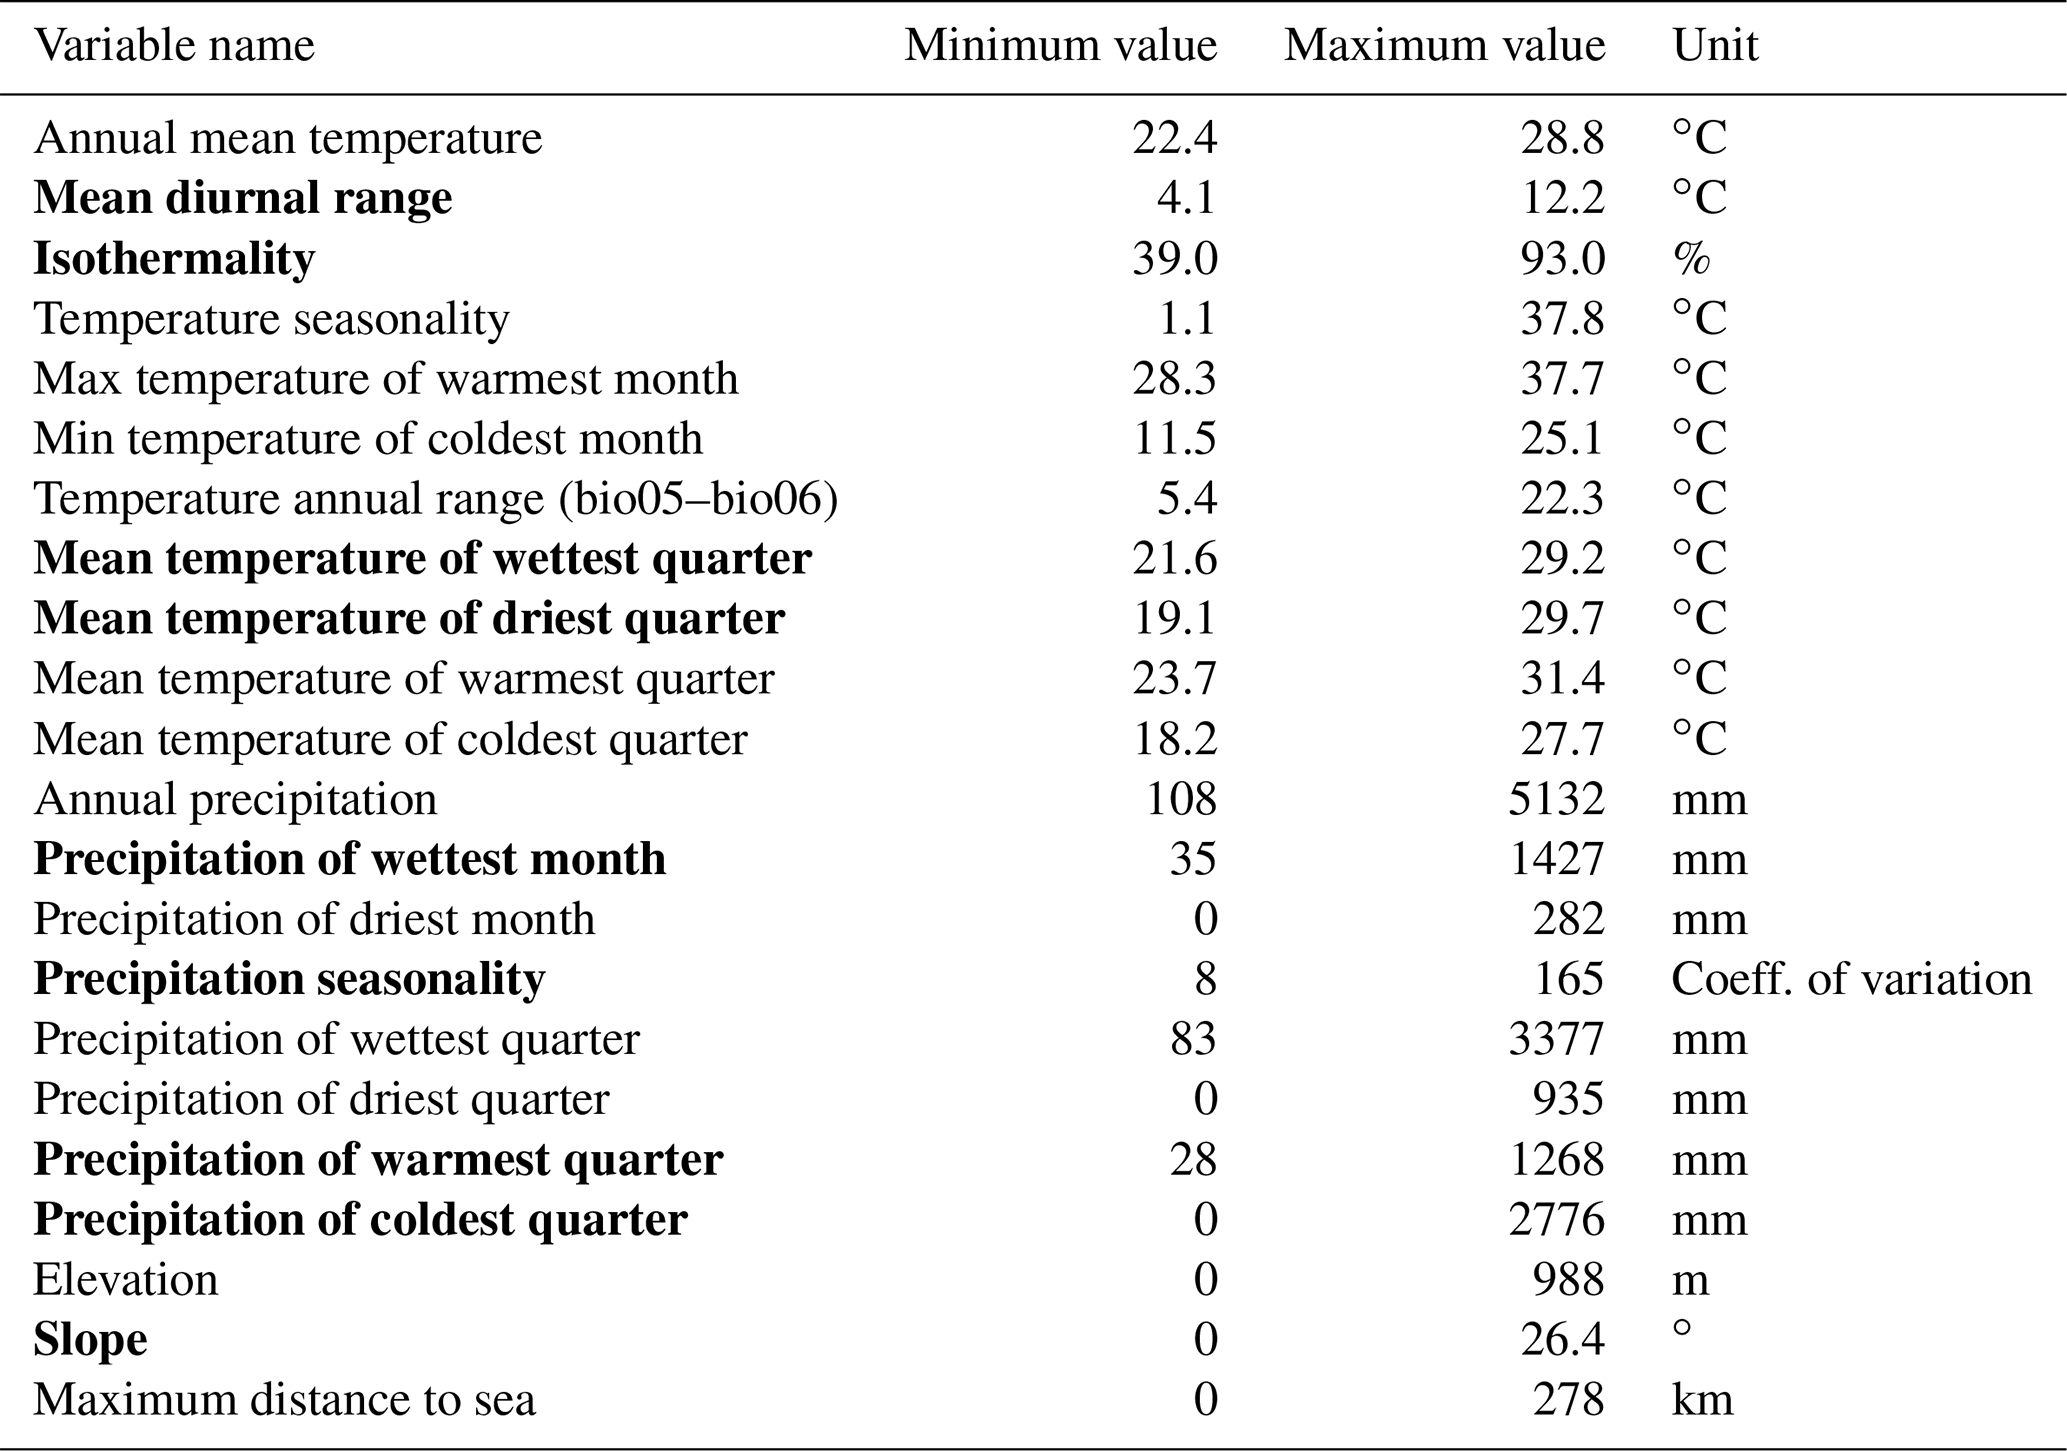
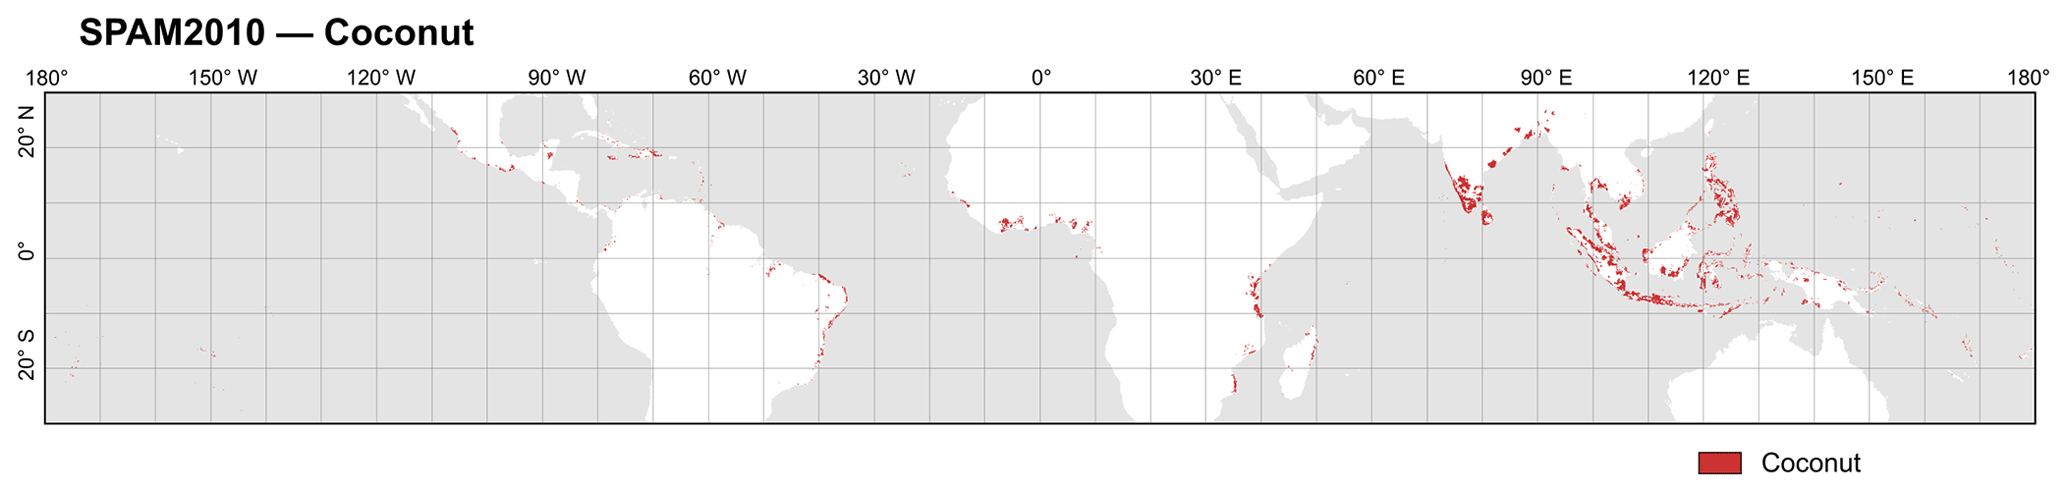
Figure A1Coconut palm map extracted from the Spatial Production Allocation Model for 2010 (SPAM2010). The layer represents areas where the extent of coconut palm plantations exceeded 50 ha within each 5 arcmin grid of the SMAP dataset.
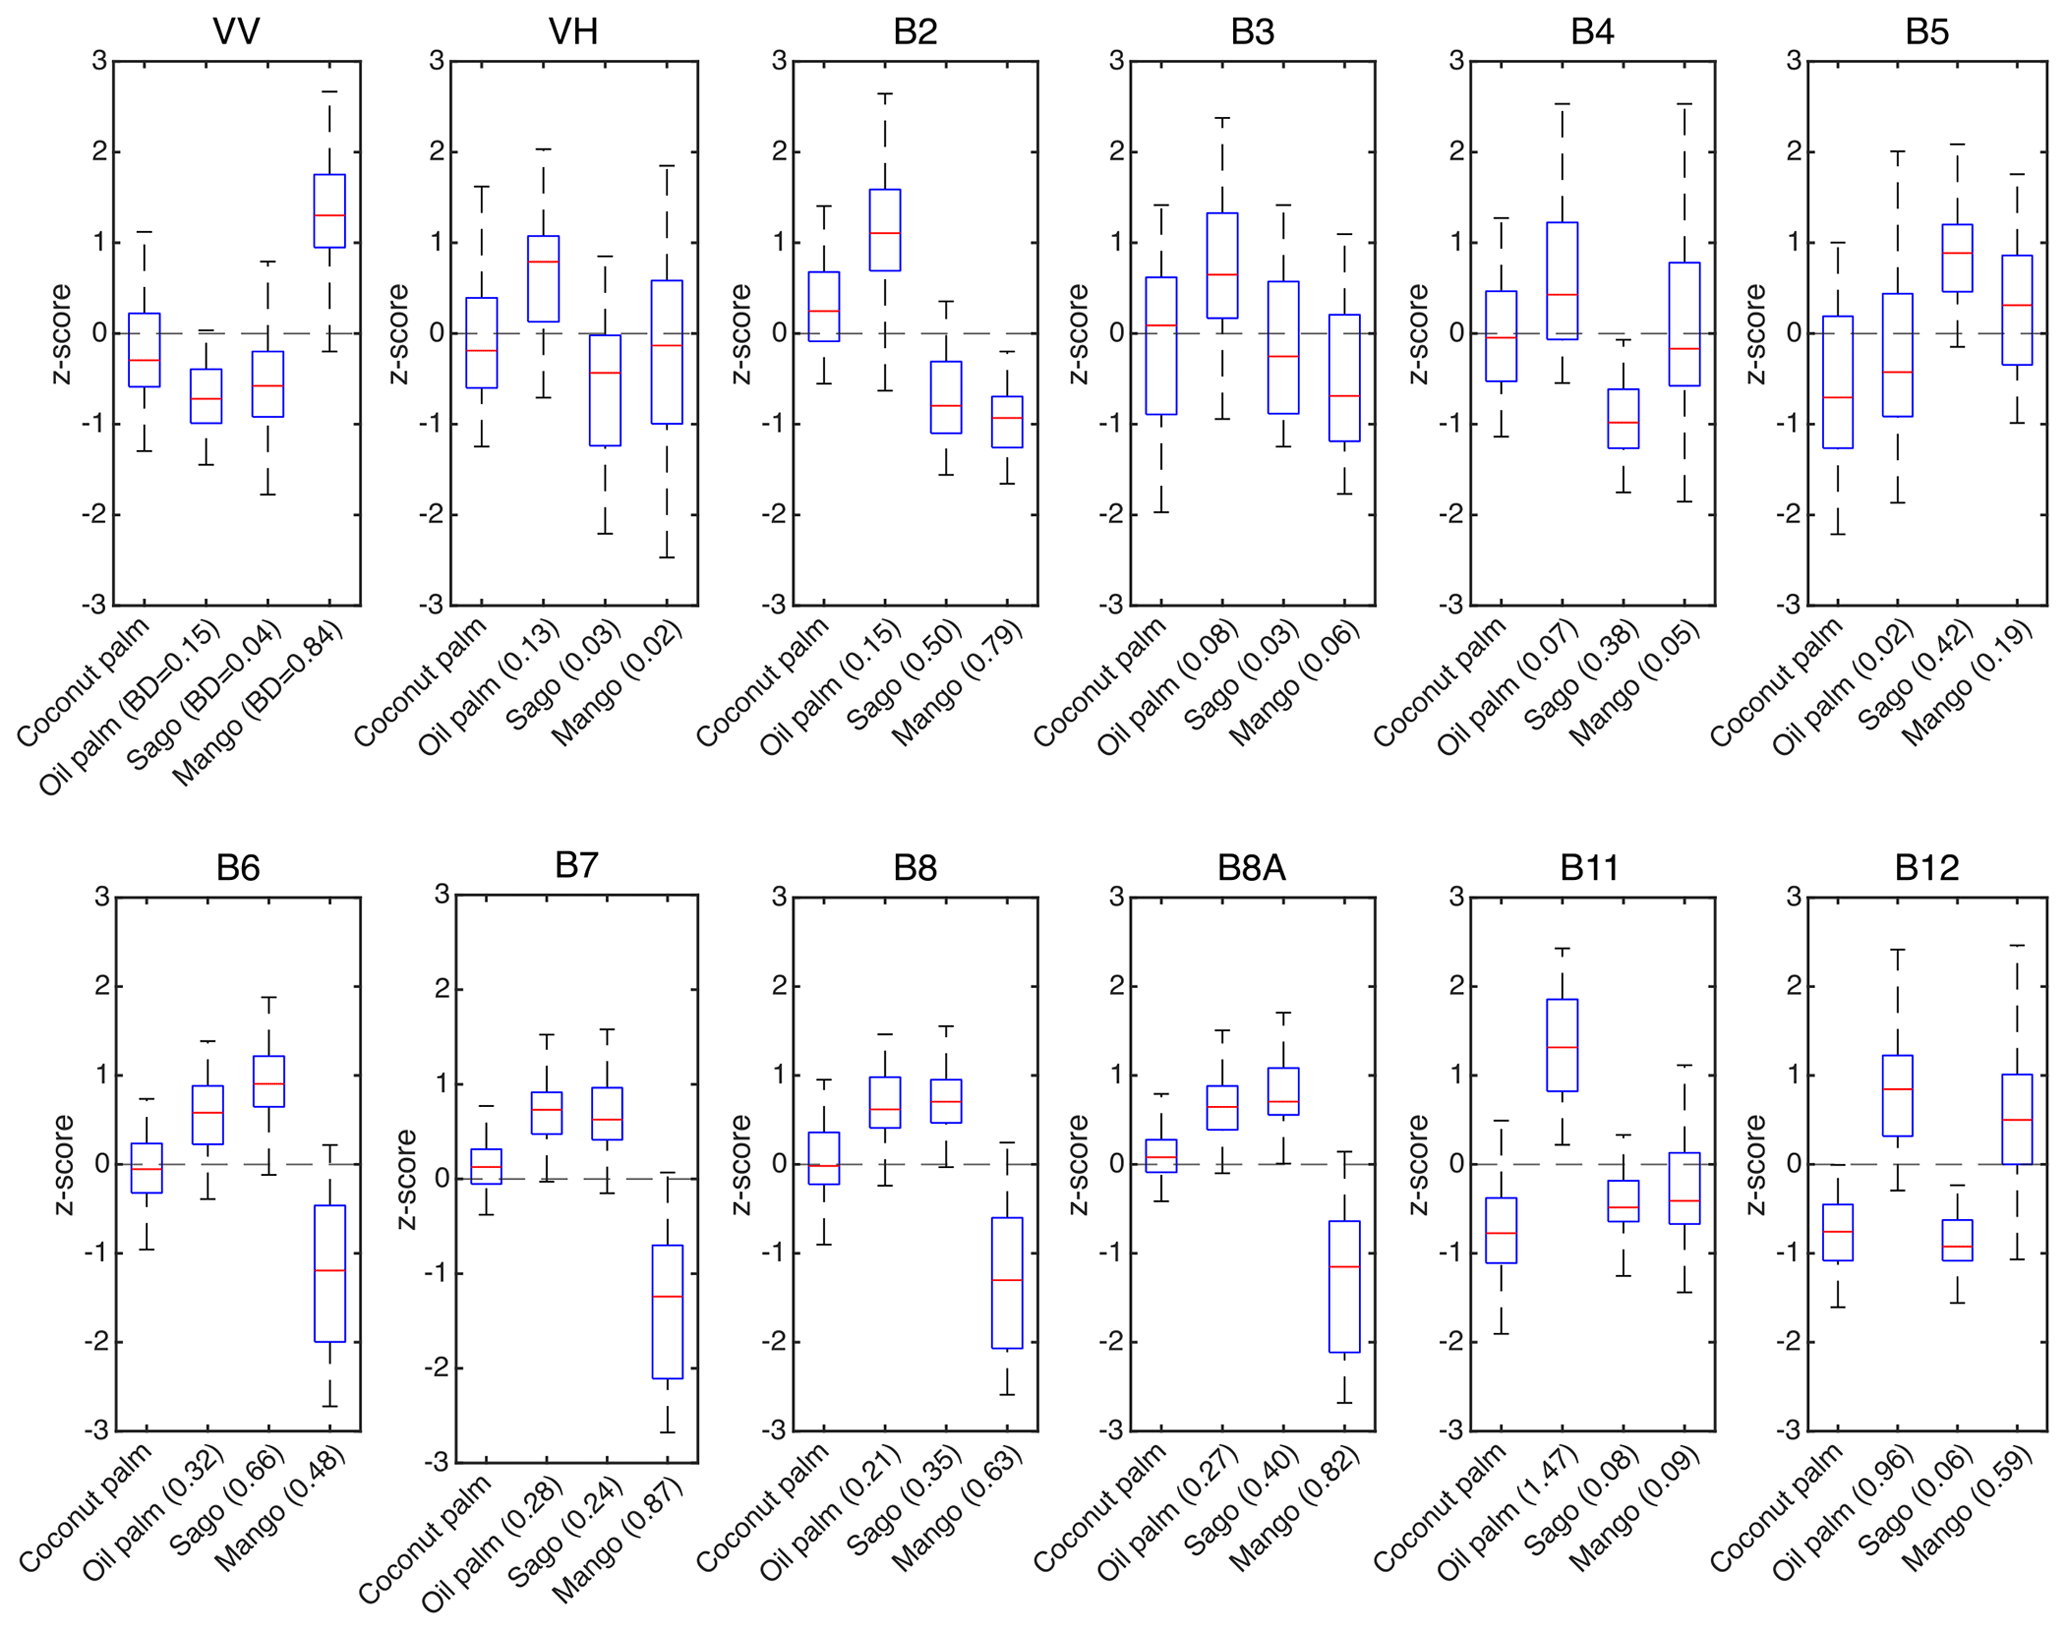
Figure A2Spectral and backscatter separability between coconut palm, oil palm, sago palm, and mango plantations. The overlap between distributions was estimated for the VV and VH bands in Sentinel-1 and for the 10 and 20 m bands in Sentinel-2. The separability was measured in terms of Bhattacharyya distance (BD) between distributions of coconut palm and other species. The Bhattacharyya distance is displayed in parentheses in the x axis. The higher the Bhattacharyya distance, the lower the overlap between the two distributions.
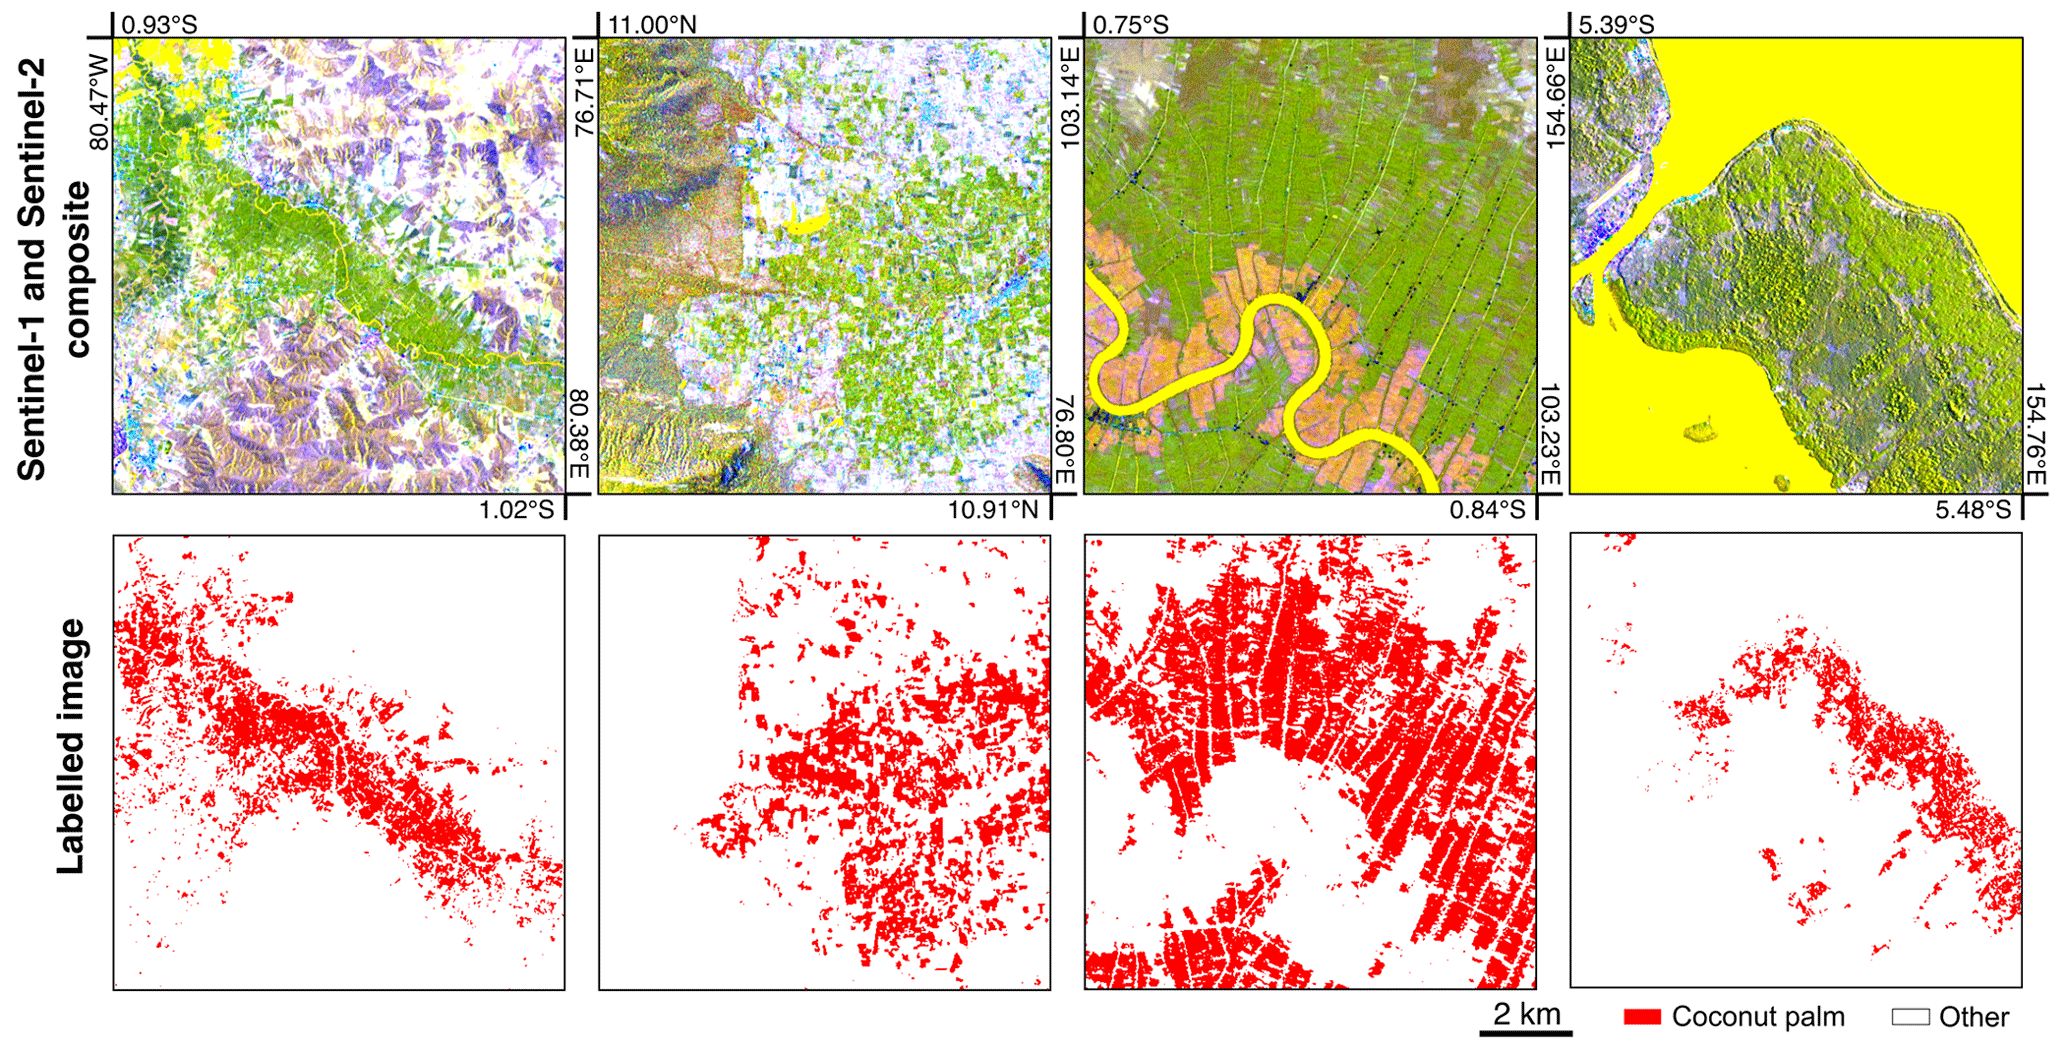
Figure A3Example of the 10 × 10 km2 images used for training the U-Net model. The training pairs included a Sentinel-1 and Sentinel-2 composite (upper panels) and the corresponding labelled image (bottom panels). The Sentinel-1 and Sentinel-2 composite includes the polarization bands VV and VH and the spectral band 11 (short-wave infrared). The labelled image includes two classes: 0 (coconut palm is not present) and 1 (coconut palm is present). The panels show four different coconut-producing regions: (from left to right) Manabí Province (Ecuador), Tamil Nadu State (India), Jambi Province (Indonesia), West Kalimantan Province (Indonesia), and Bougainville (Papua New Guinea).
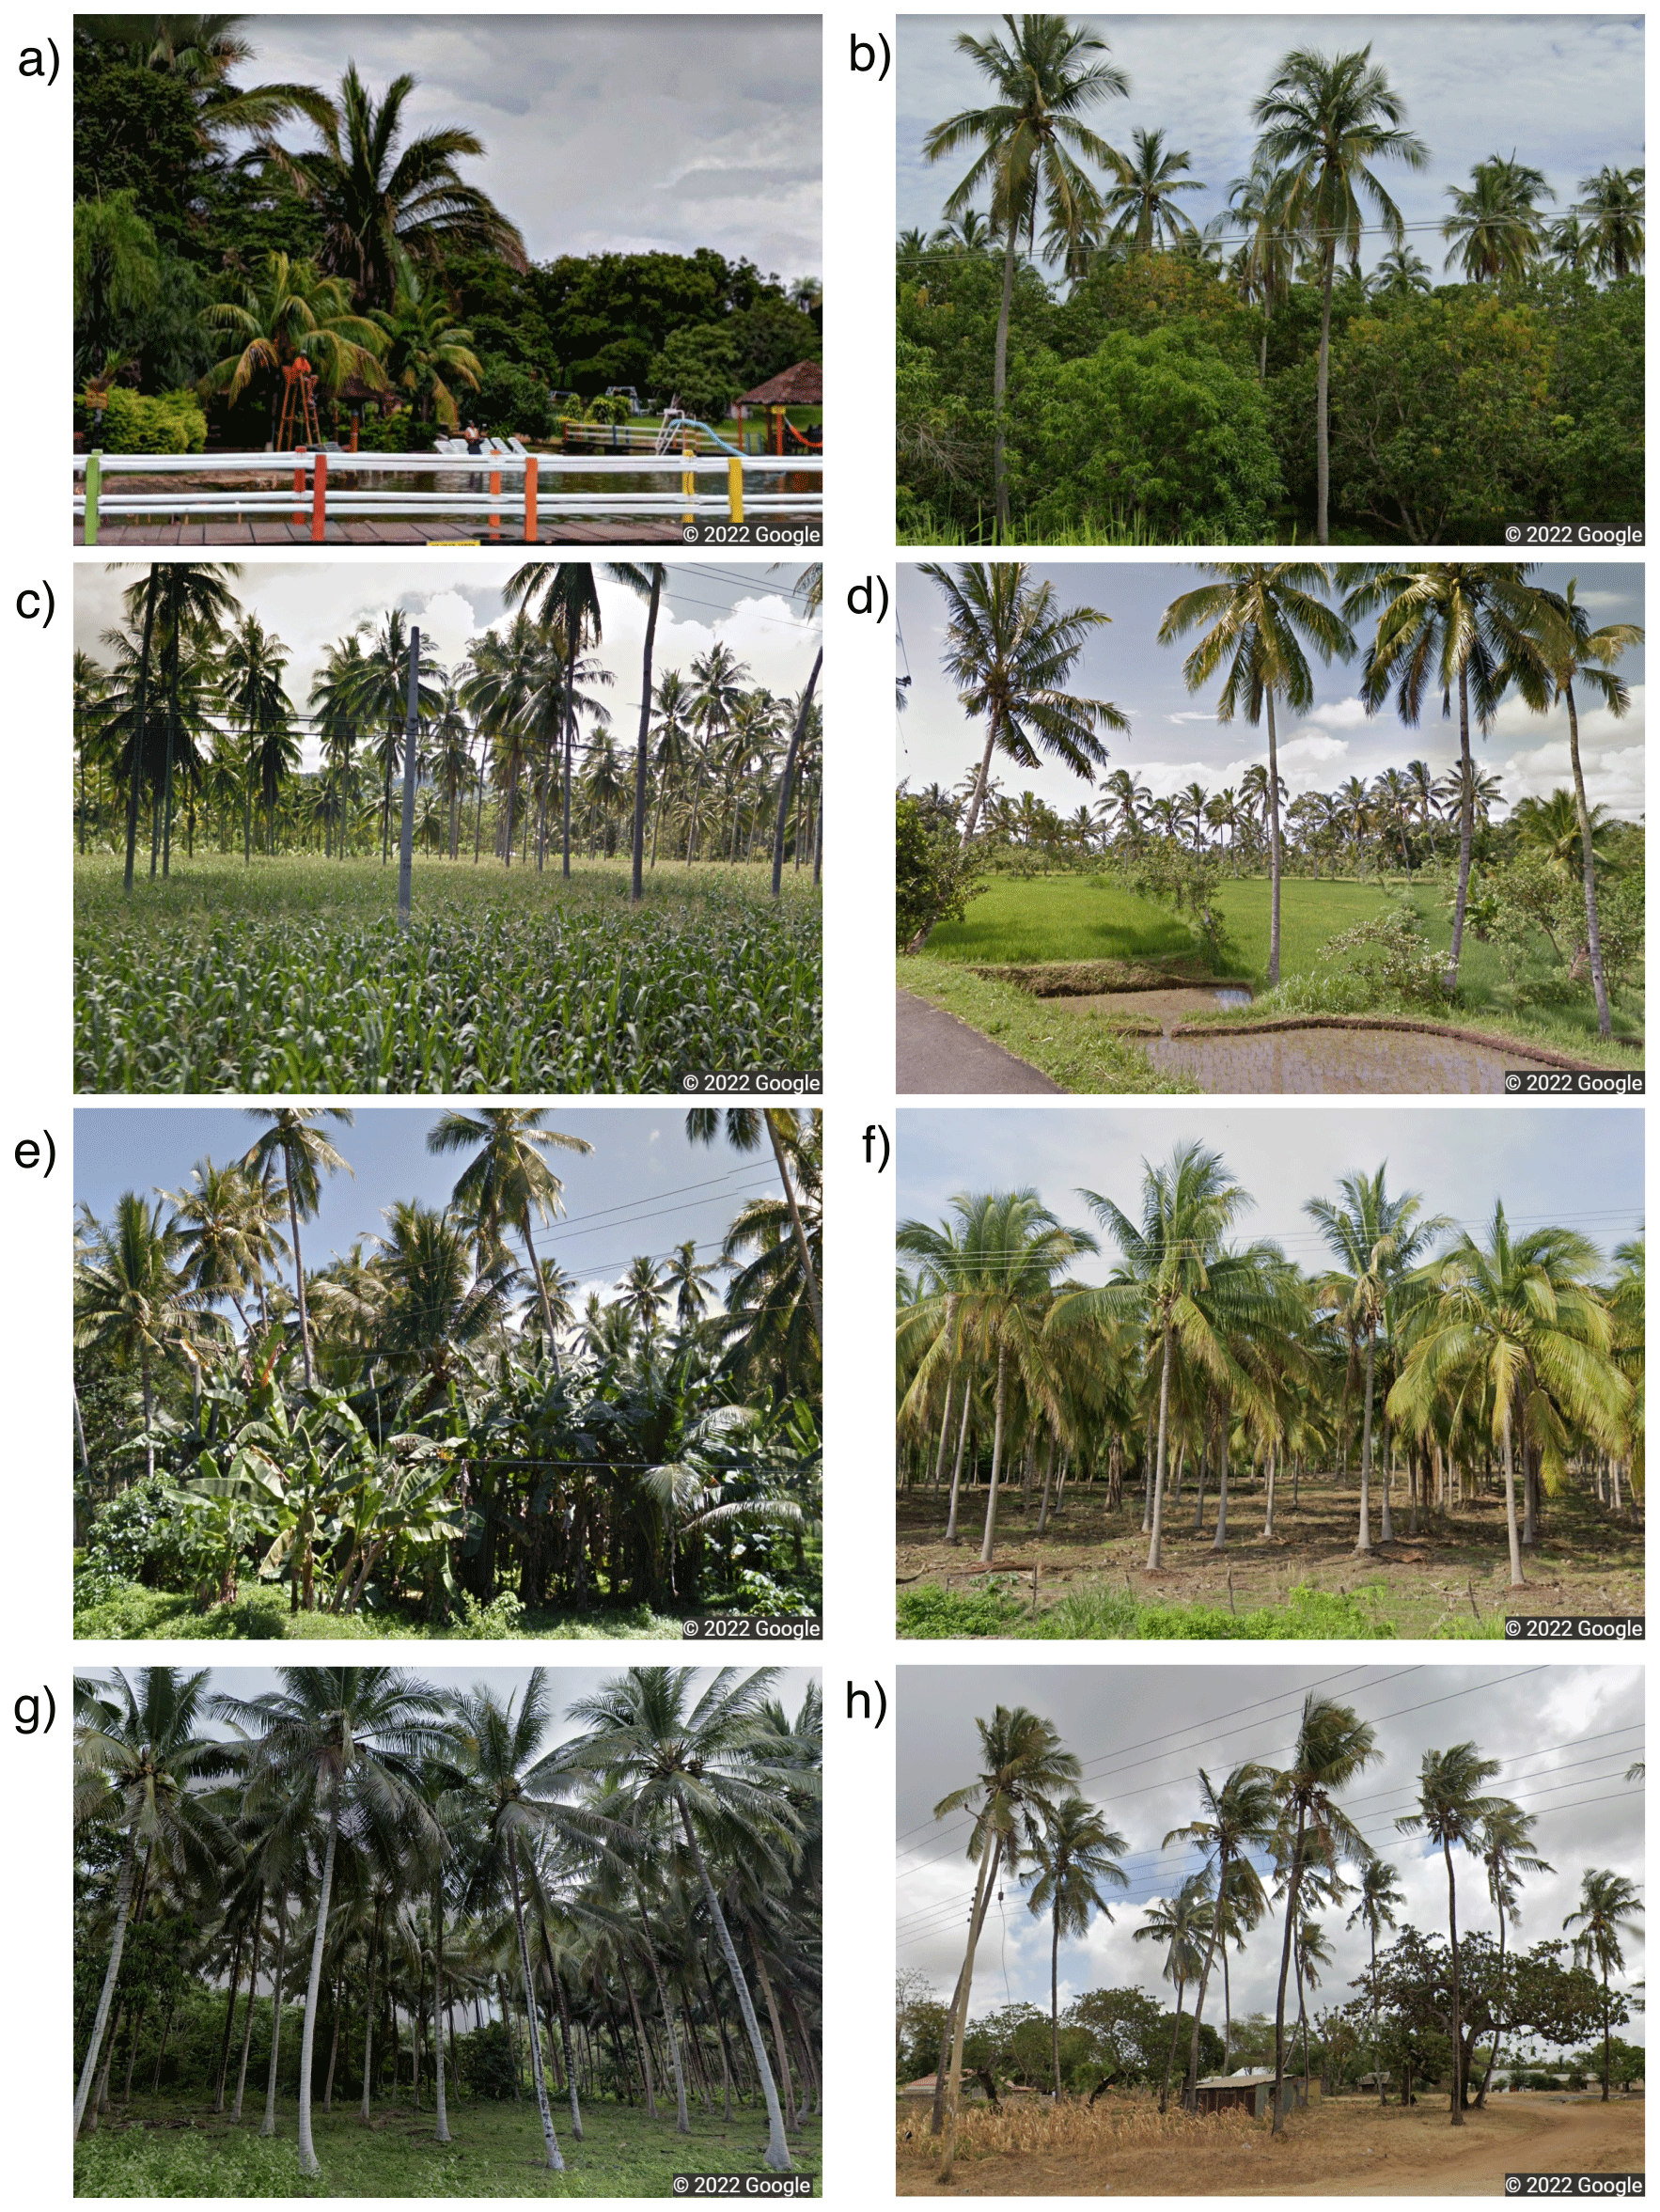
Figure A4Images taken from Google Street View © Google. The images show (a) coconut palms in Bolivia at 808 km from the coast (15.9220∘ S, 63.1761∘ W), (b) an intercropping of coconut palm and mango in Mexico (17.2119∘ N, 100.7382∘ W), (c) coconut palm and maize in the Philippines (5.9776∘ N, 124.6742∘ E), (d) coconut palm and rice in Indonesia (8.5596∘ S, 116.3908∘ E), (e) coconut palm and banana in Indonesia (1.0807∘ S, 103.7871∘ E), (f) a dense coconut palm plantation in Mexico (18.1230∘ N, 102.8654∘ W), (g) a dense coastal coconut palm in Indonesia (1.2783∘ S, 123.5367∘ E), and (h) a sparse coconut palm in Kenya (3.7843∘ S, 39.8228∘ E).
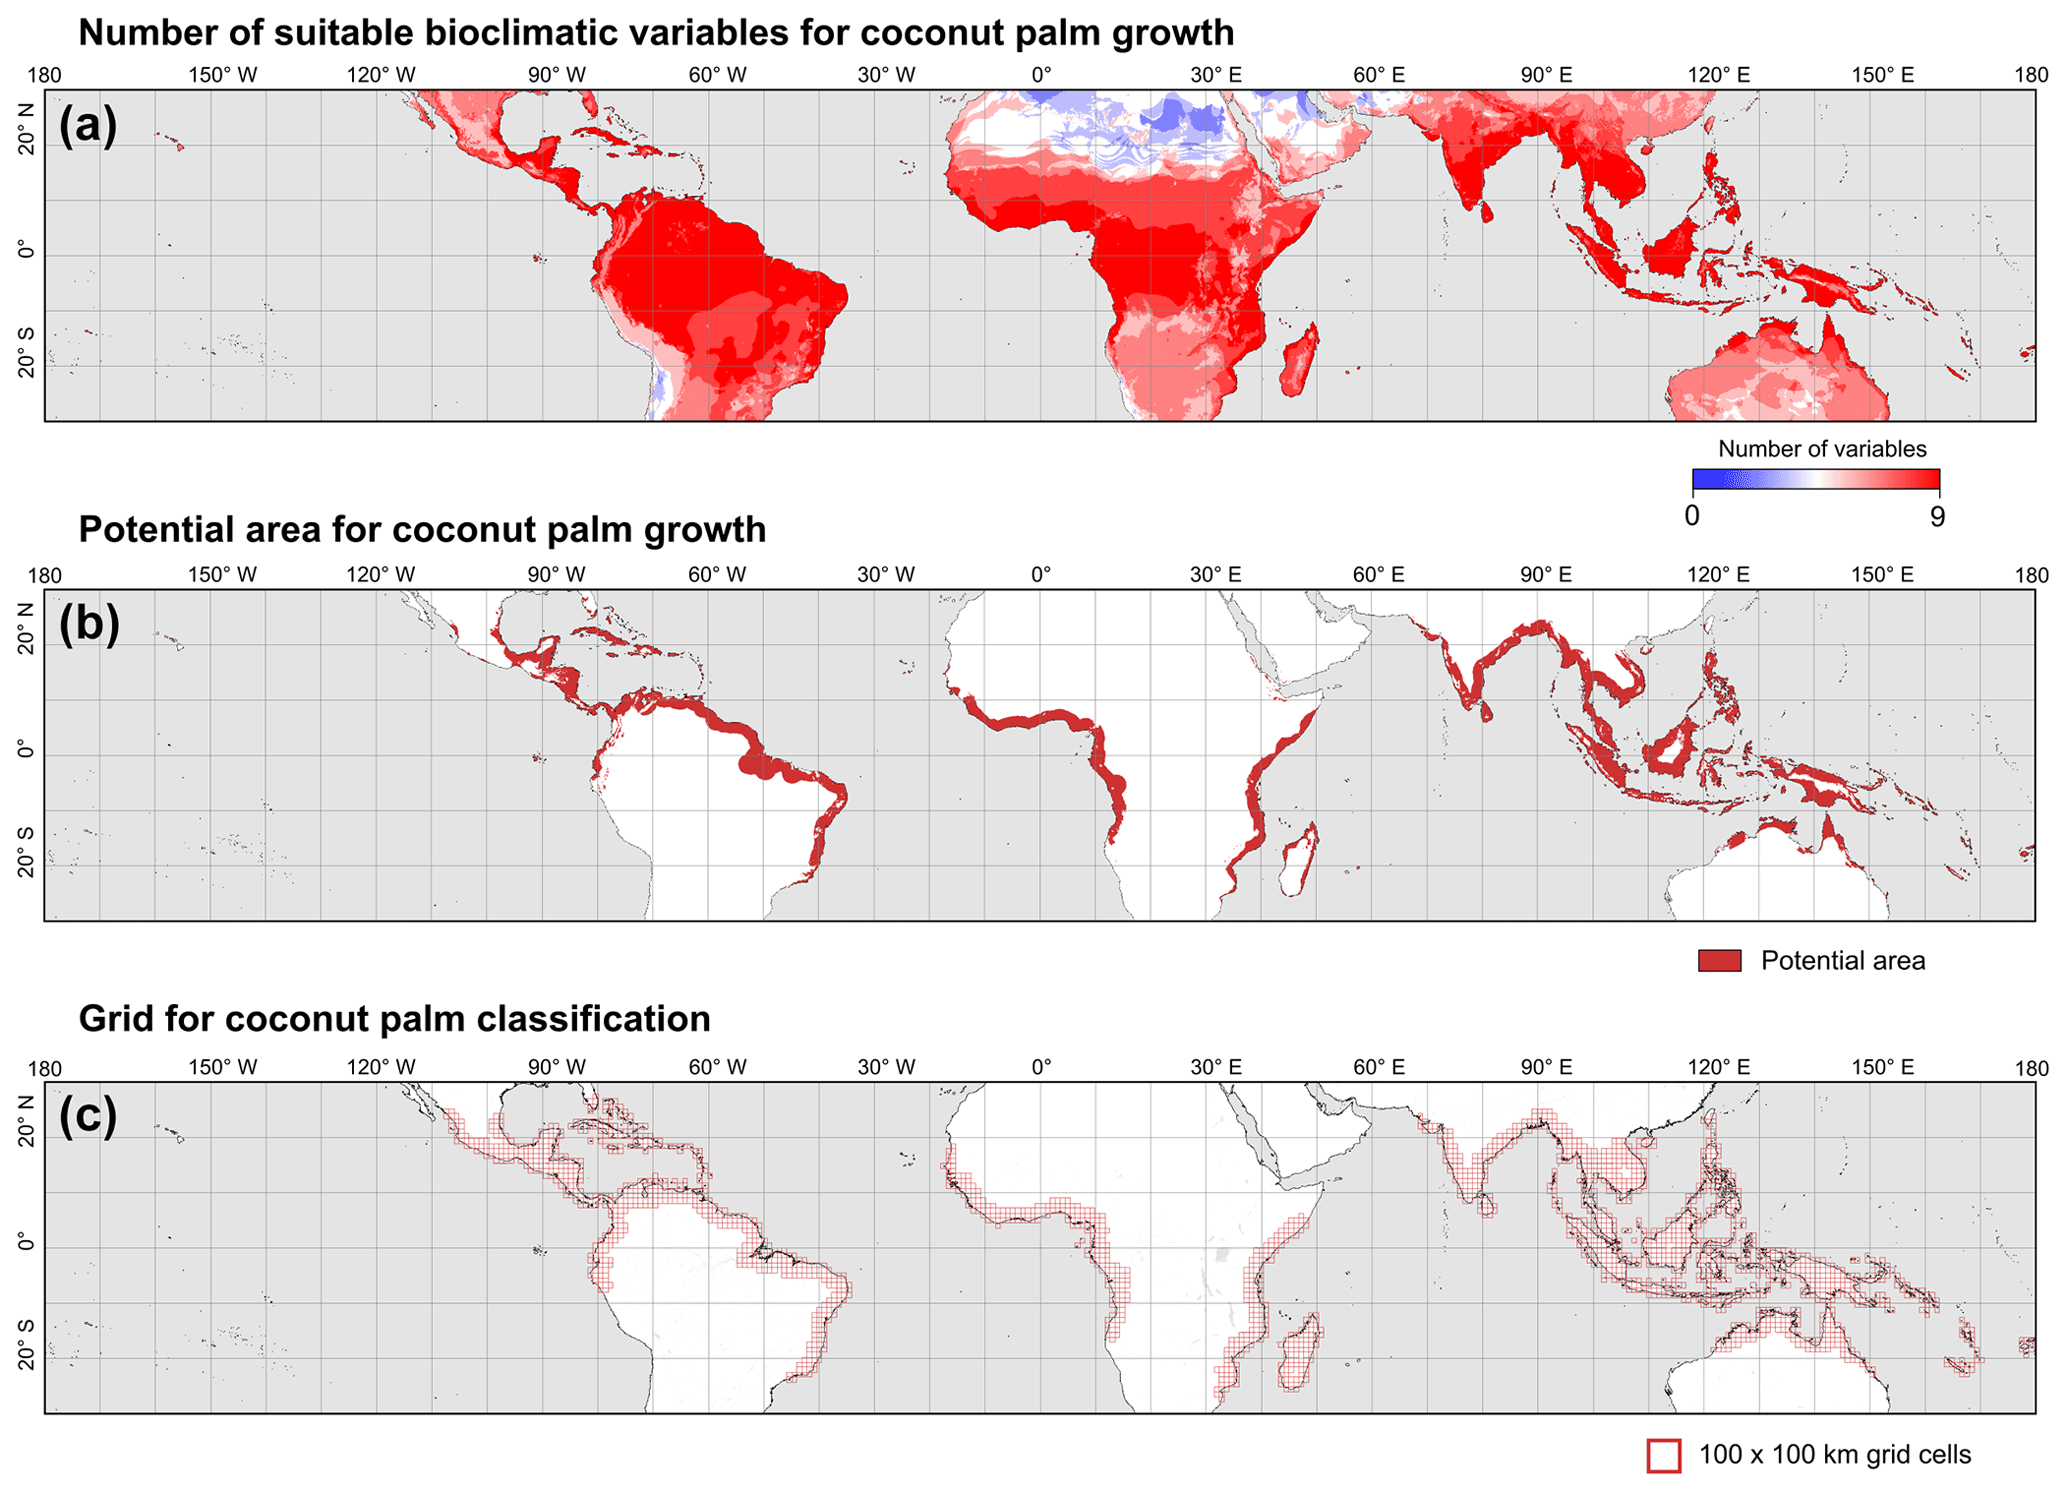
Figure A5Maps generated from the bioclimatic analysis. (a) Number of variables that fall within the range of values suitable for coconut palm growth. The bioclimatic variables represent a subset of eight WorldClim variables and terrain slope that present a low collinearity. The range of values was extracted from 1139 coconut palm locations. (b) Potential distribution suitable for coconut palm growth. The map represents the pixels with the nine variables within the range observed in the 1139 coconut palm locations. Regions inland that are more than 200 km from the coast were masked. (c) The 100 × 100 km grid used to classify the Sentinel-1 and Sentinel-2 composites into a land cover map of coconut palm.
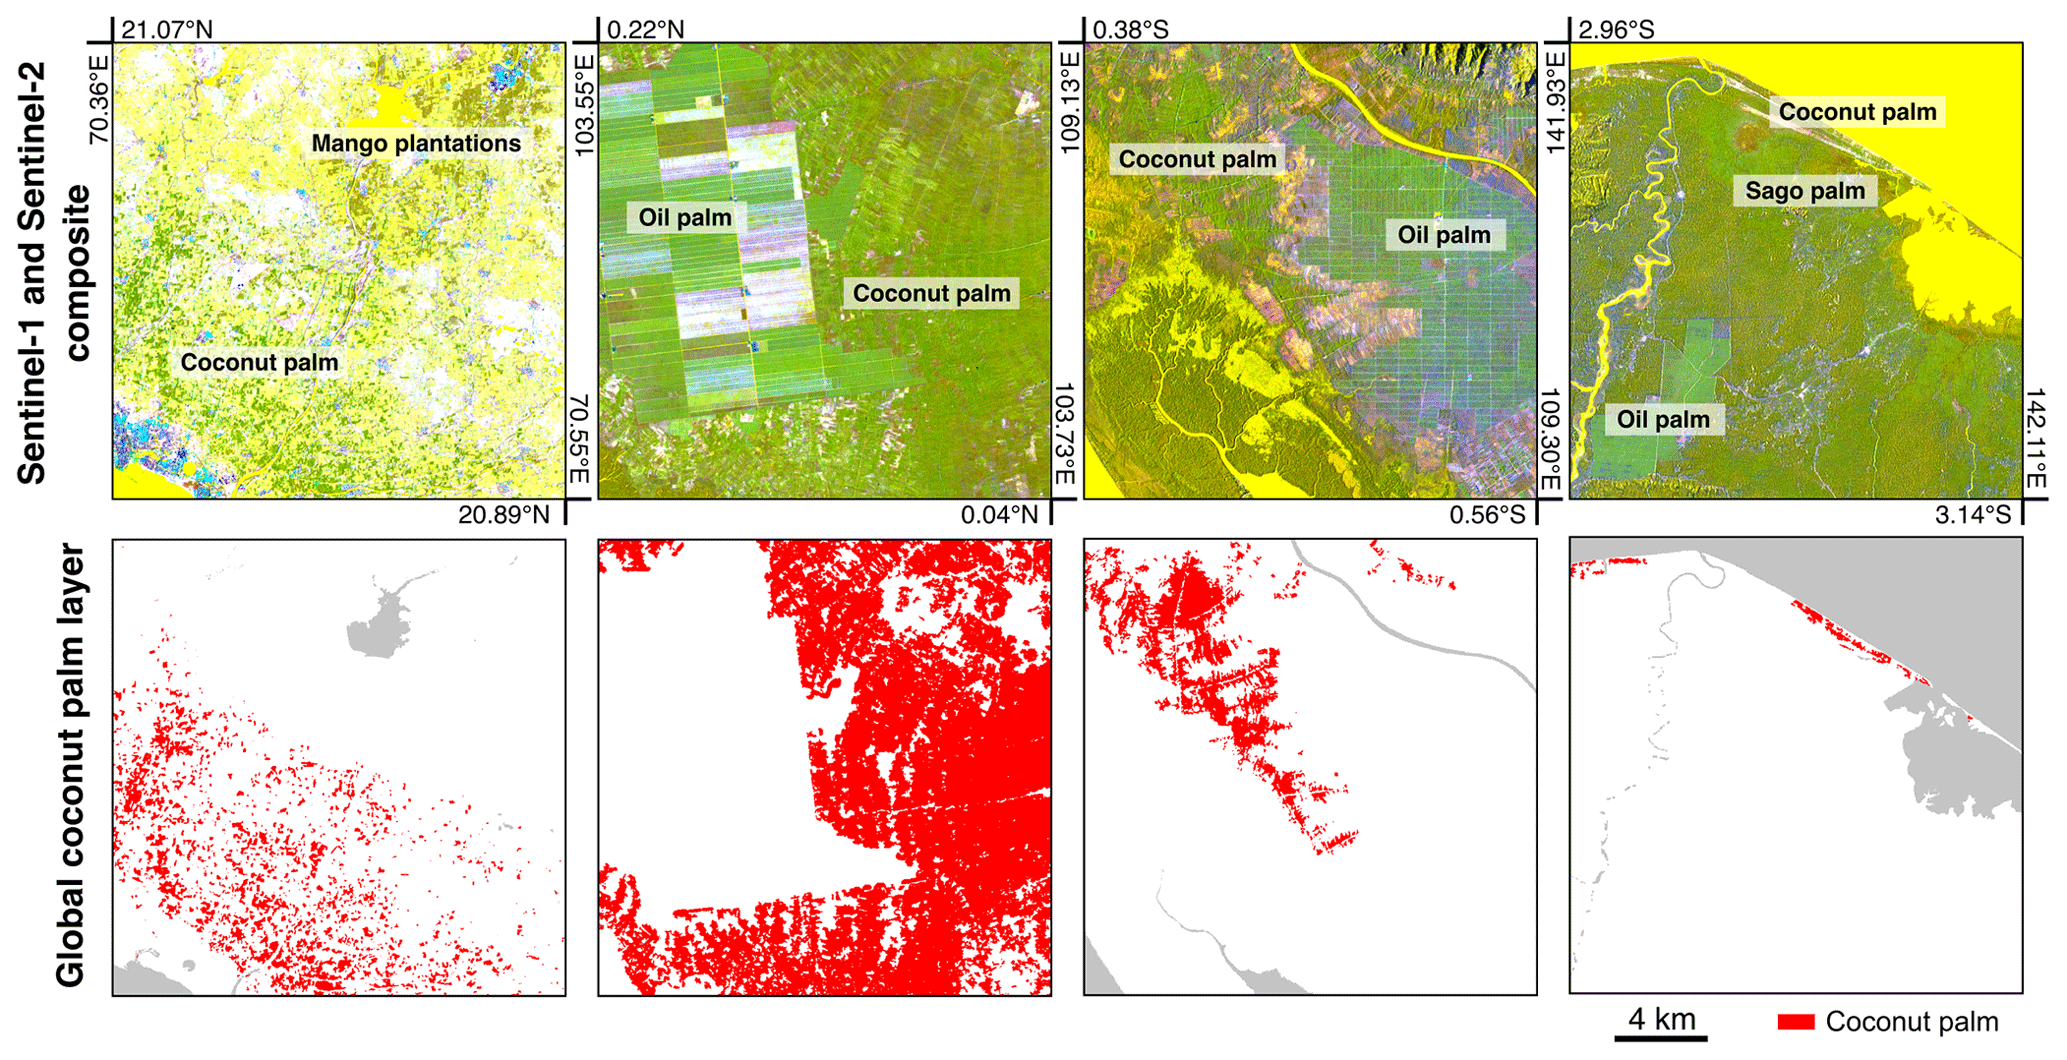
Figure A6Classification of Sentinel-1 and Sentinel-2 annual composites into a land cover map of coconut palm. The Sentinel-1 and Sentinel-2 composite (upper panels) includes the polarization bands VV and VH and the spectral band 11 (short-wave infrared). The regions in the panels are, from left to right, state of Gujarat (India), Riau Province (Indonesia), West Kalimantan Province (Indonesia), and Sandaun Province (Papua New Guinea). These regions present crops that exhibit similarities to coconut palm in the Sentinel composites. The classification image (bottom panels) shows the global coconut palm layer.
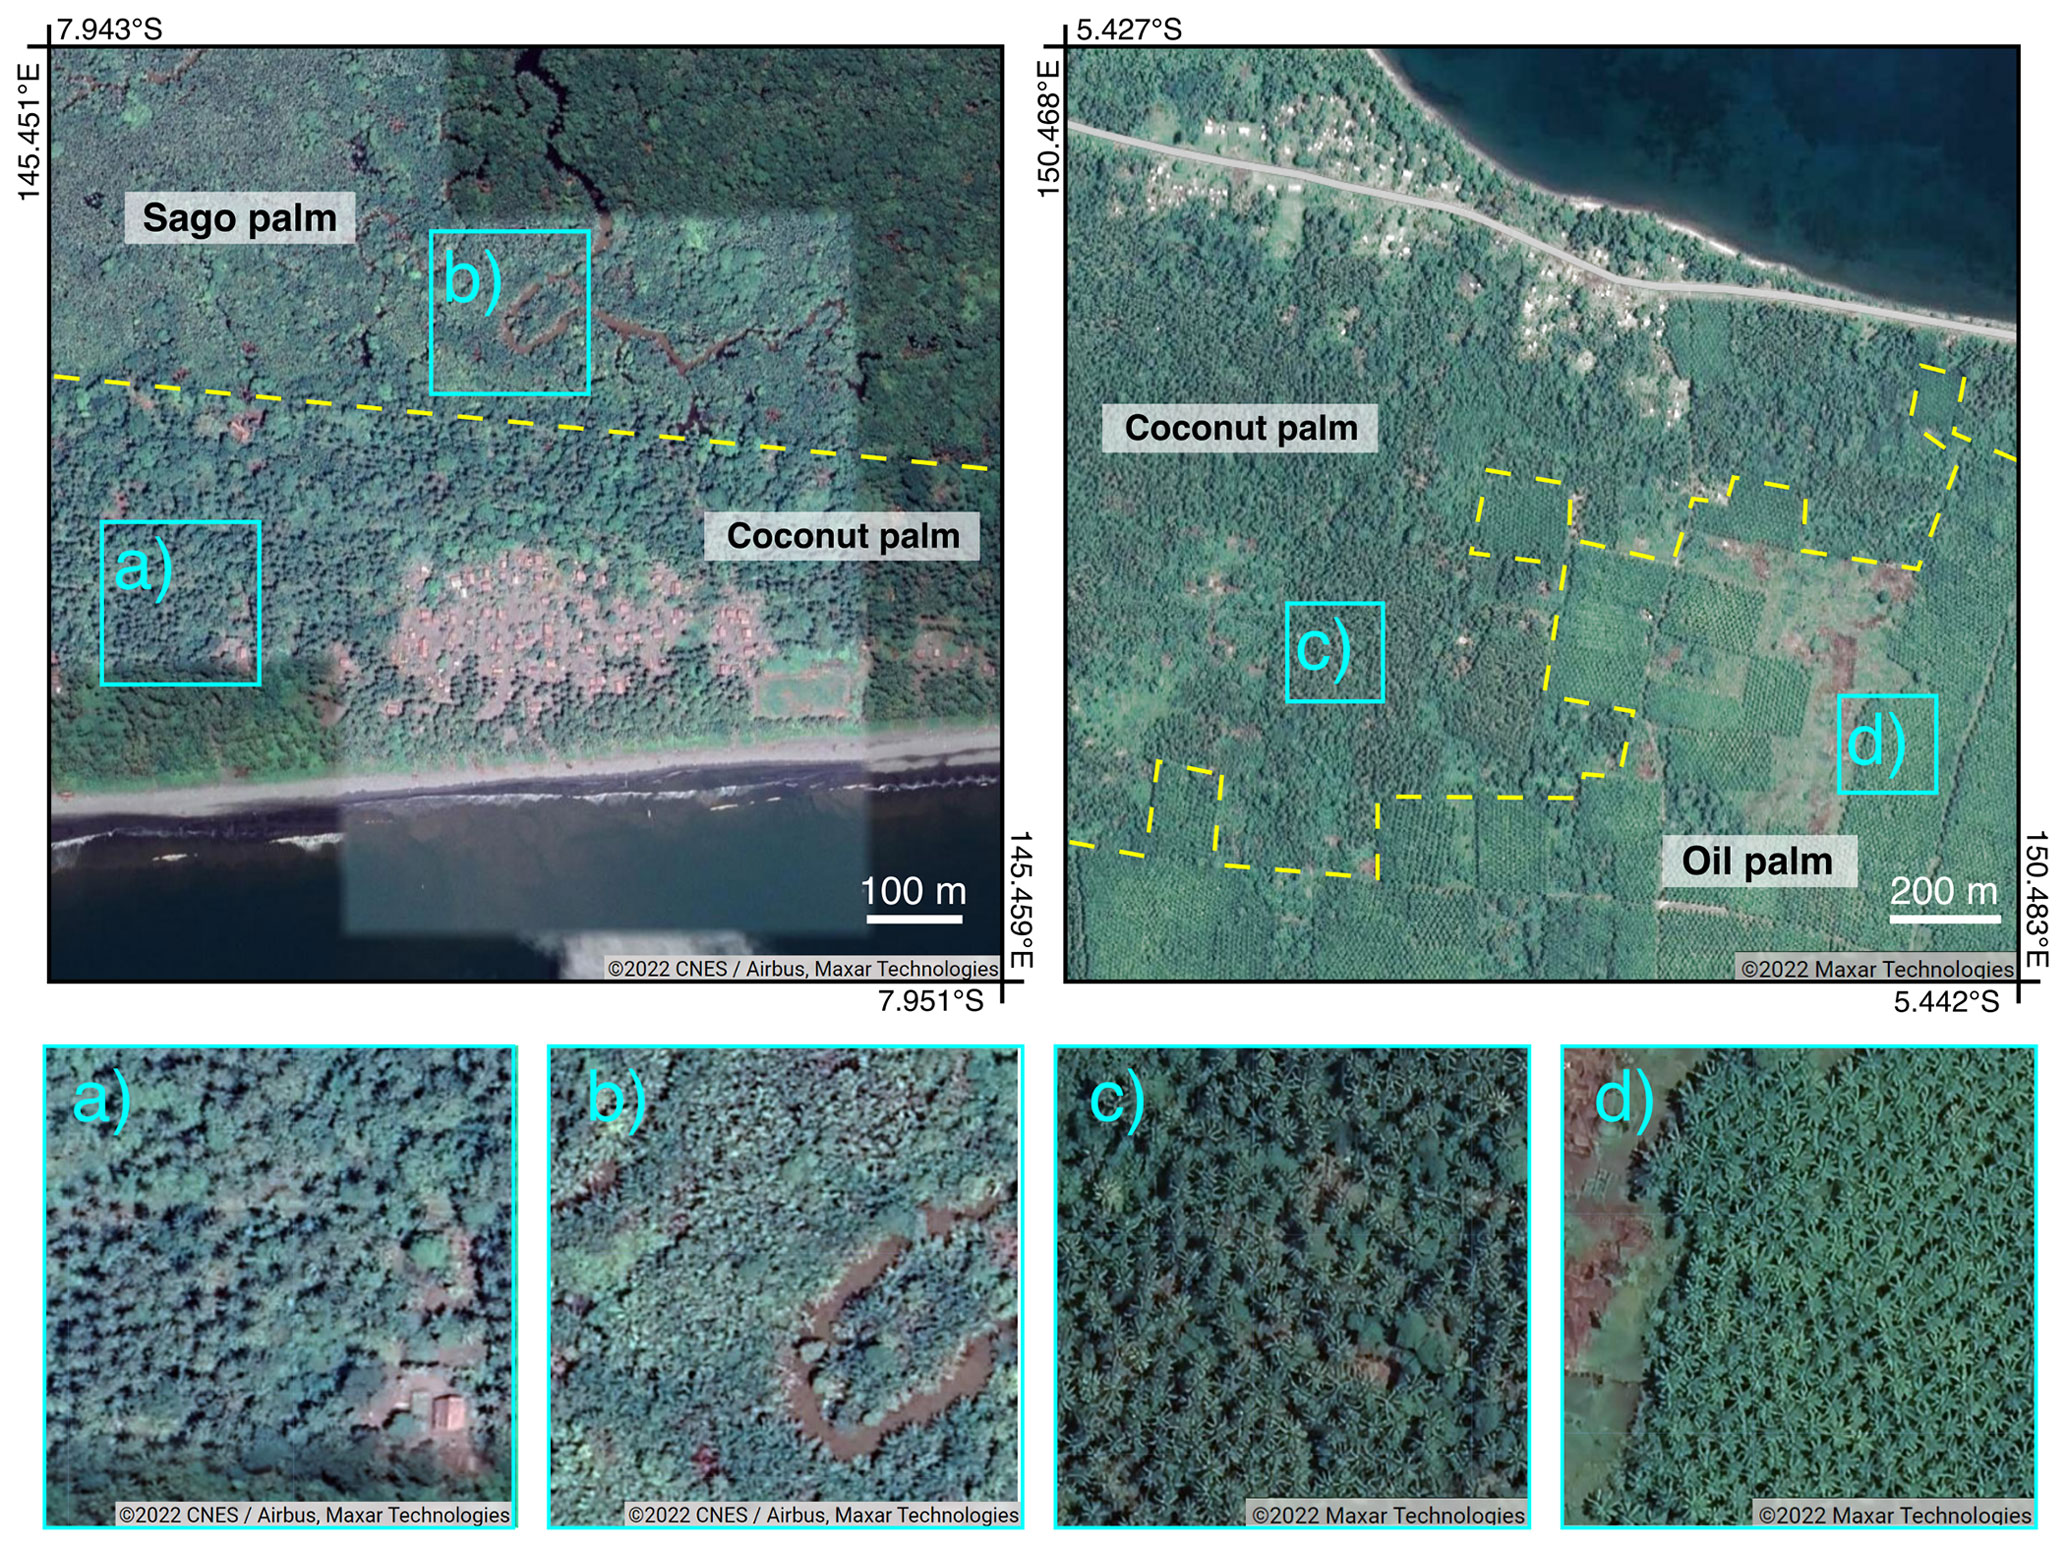
Figure A7Sub-metre-resolution images in the Gulf (upper-left) and West New Britain (upper-right) Provinces, Papua New Guinea. The images show that coconut palm and other palms (sago and oil palm) grow in separate areas. The bottom panels feature detailed images of coconut palm, sago palm, and oil palm. The satellite images are the sub-metre-resolution images that are displayed as the base layer in Google Earth © Google.
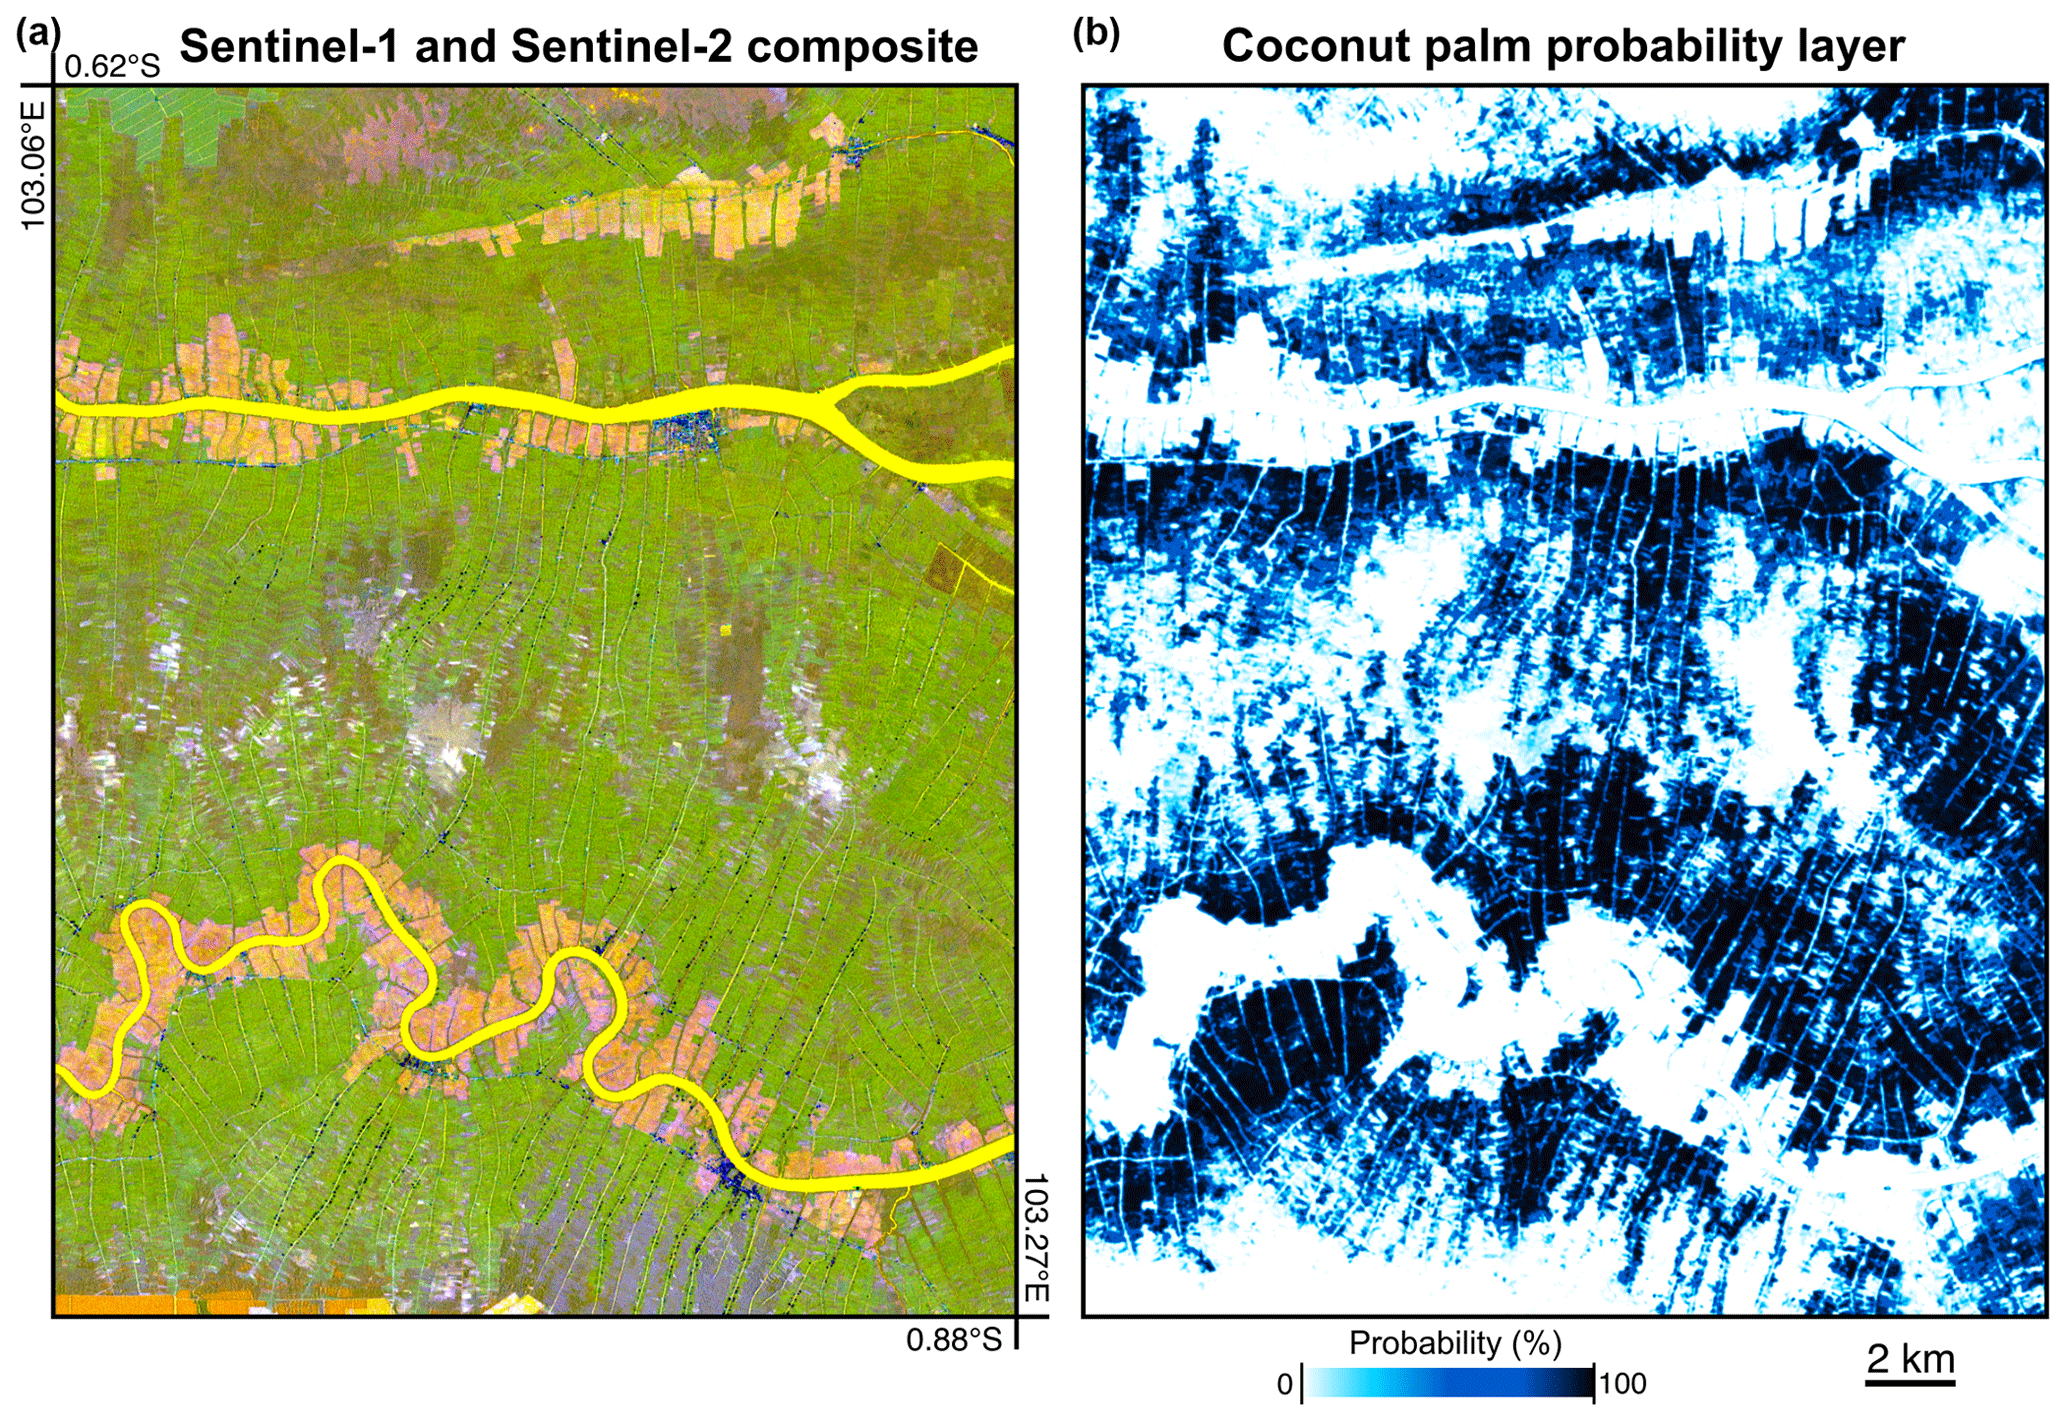
Figure A8Sentinel-1 and Sentinel-2 annual composite (left panel) and probability layer for the class of coconut (right panel) produced with the U-Net model in Riau Province (Indonesia). The Sentinel-1 and Sentinel-2 composite includes the polarization bands VV and VH and the spectral band 11 (short-wave infrared). The probability layer represents a score that indicates the confidence level of the classification model in predicting the presence of coconut palm.
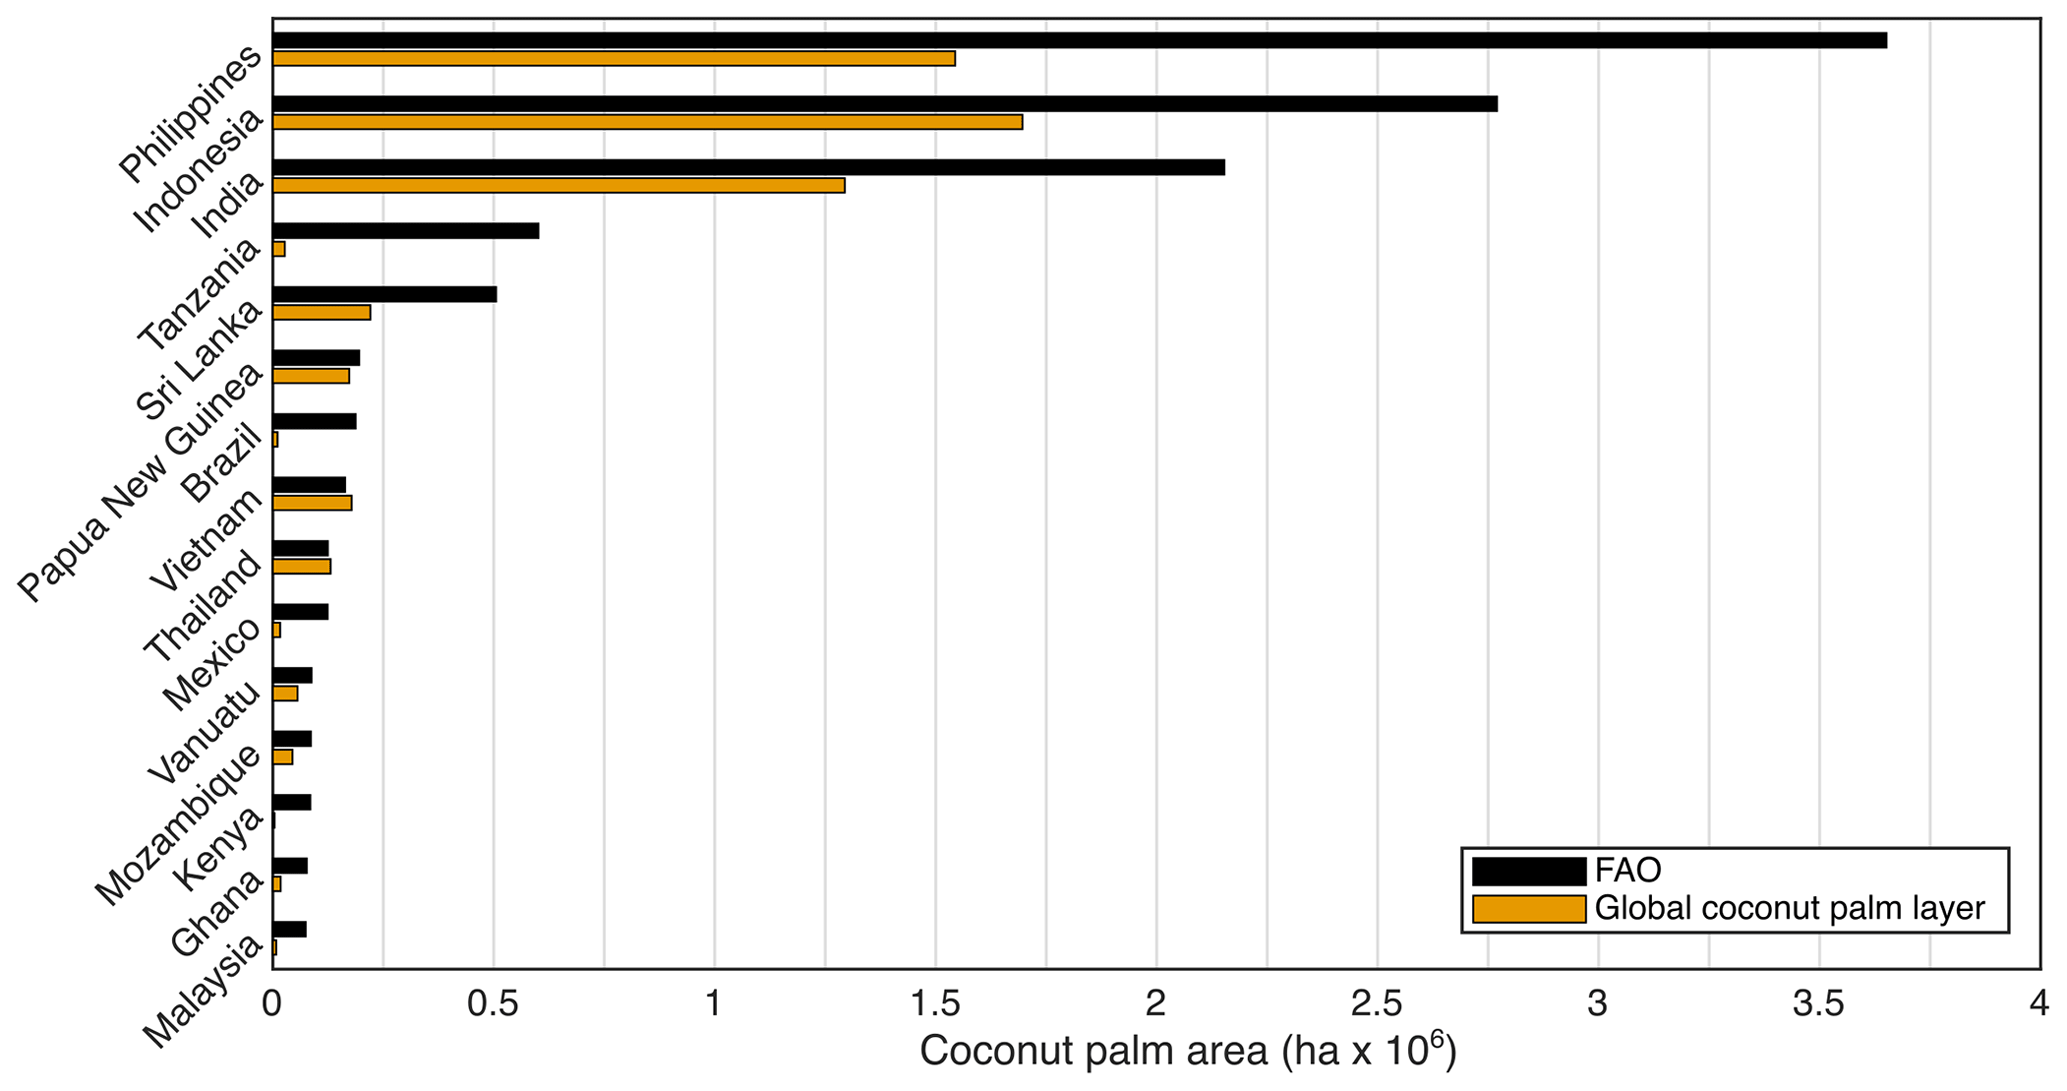
Figure A9Coconut palm area mapped using Sentinel-1 and Sentinel-2 and coconut harvested area from FAO for the top 15 coconut-producing countries in 2020.
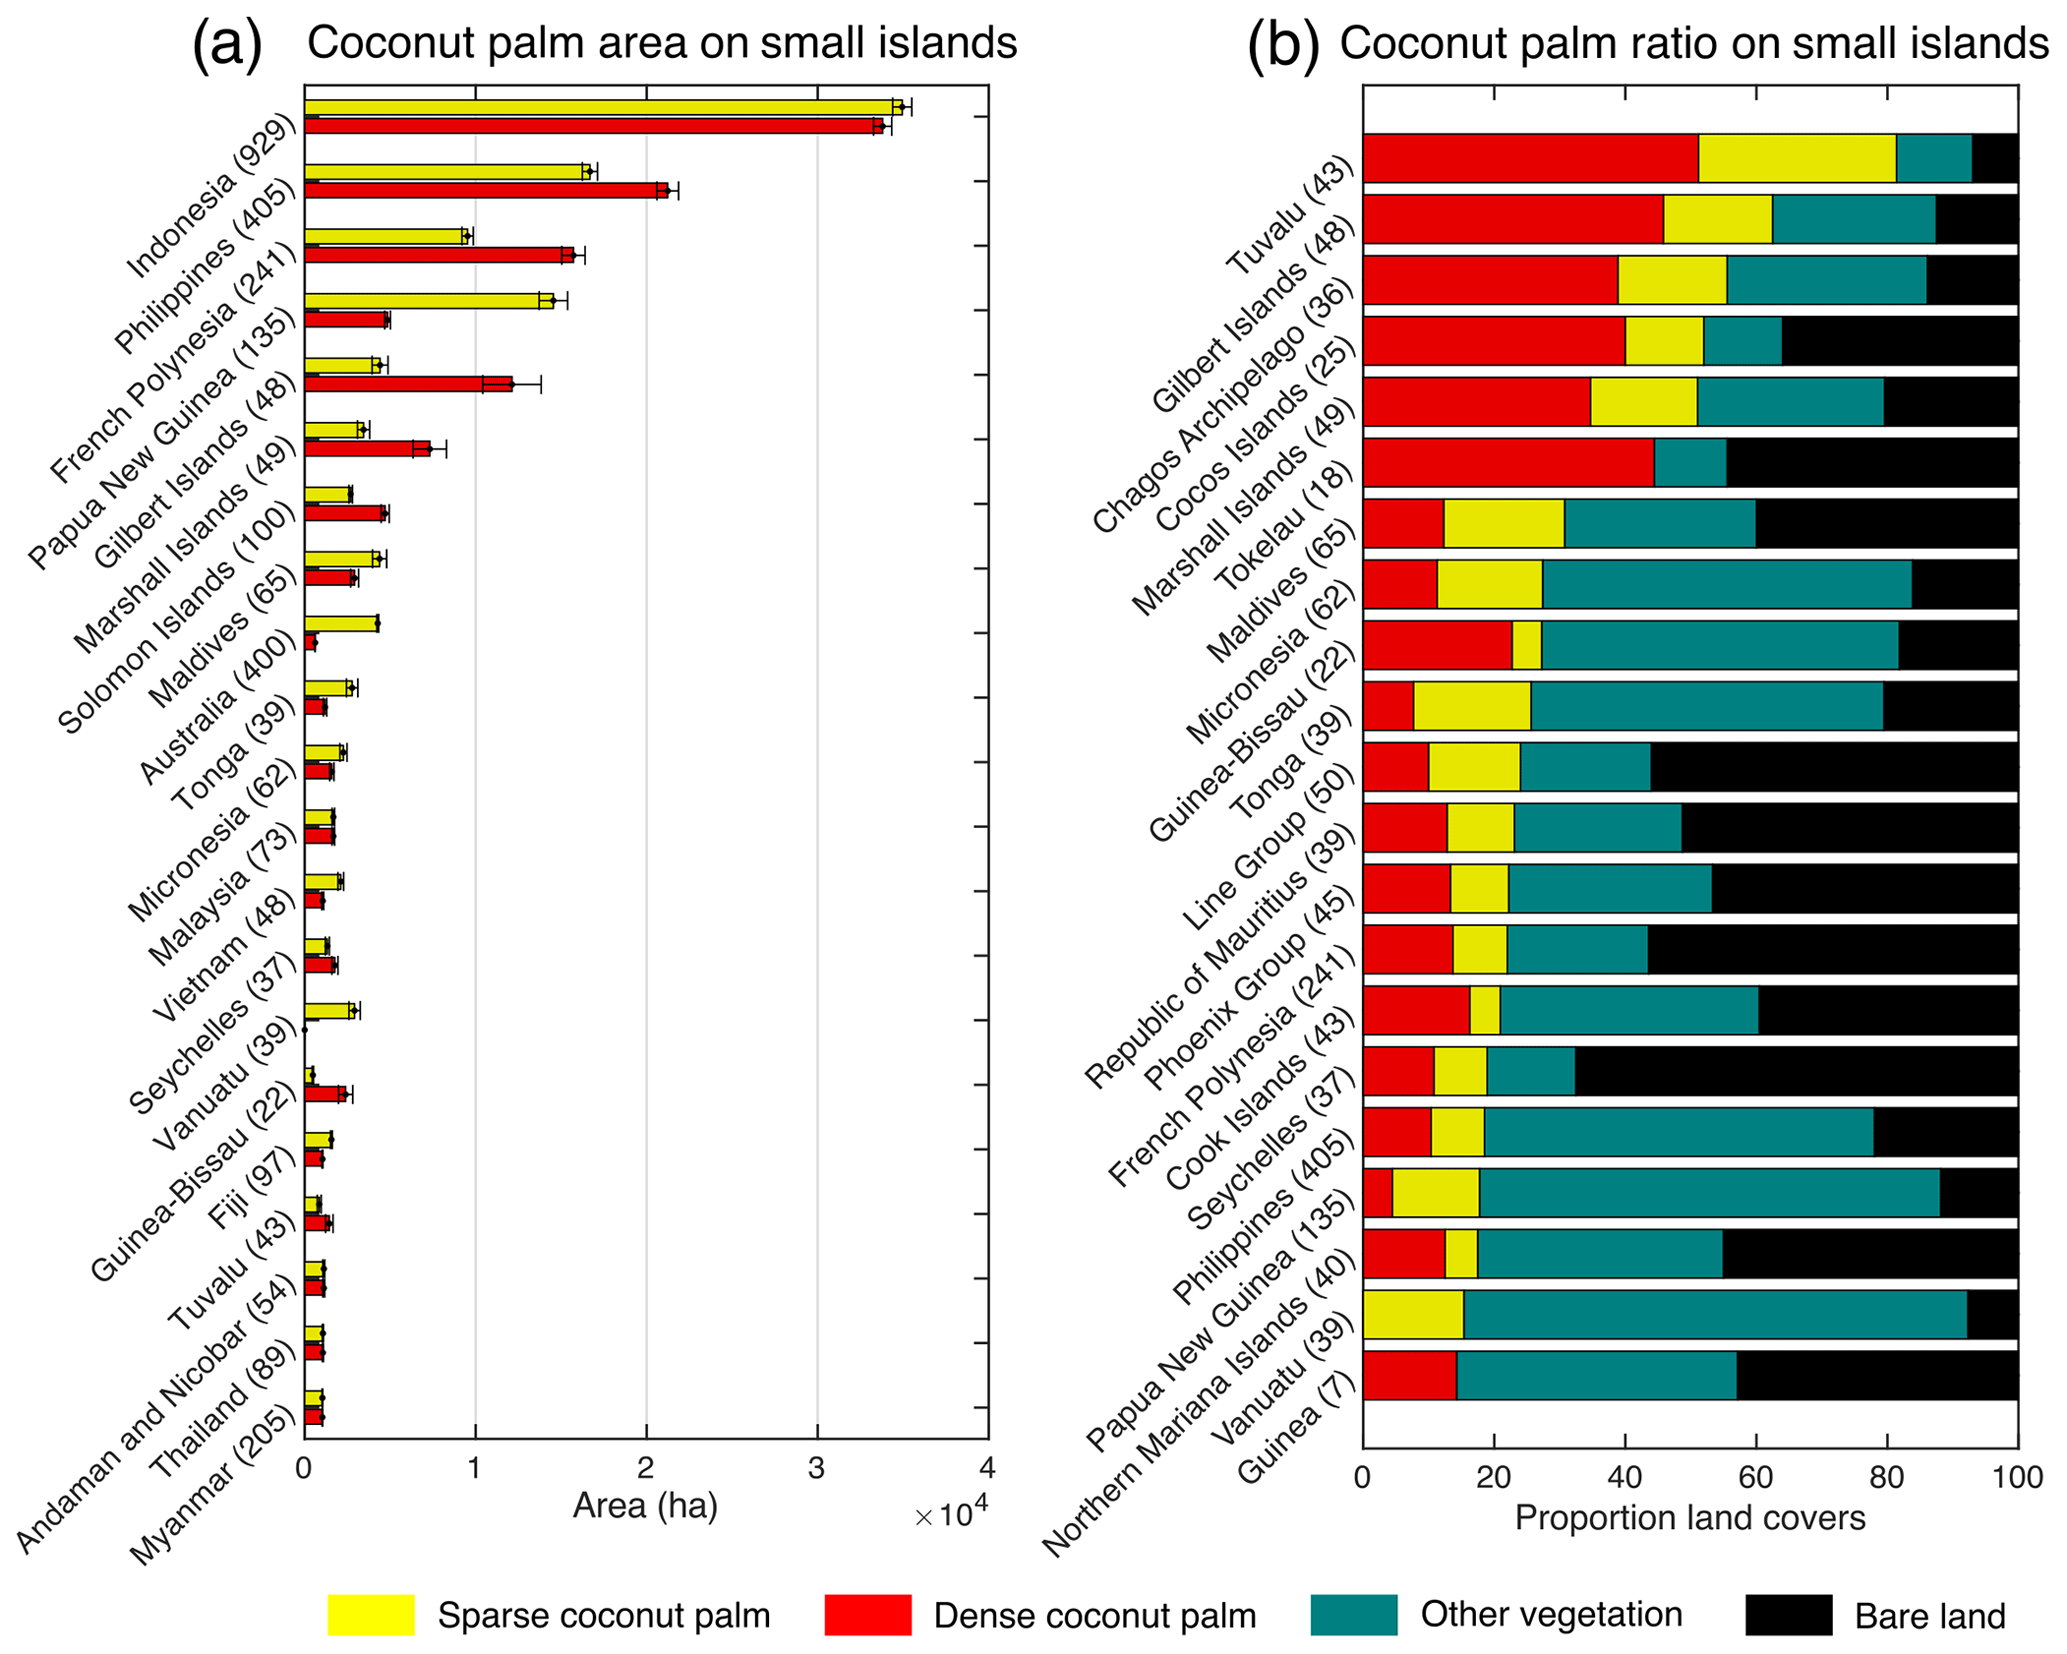
Figure A10(a) Coconut palm area estimates in small tropical islands and (b) percentage of the coconut palm area compared to the total island surface per country. The areas were estimated using a sampling-based approach; 5000 points were randomly sampled in small tropical islands (areas from 1 to 200 ha and between latitudes of 30∘ S and 30∘ N), and the land cover was identified using sub-metre-resolution images. The number between parentheses reflects the number of sampled points in each country. Error bars represent the 95 % confidence interval.
The conceptualization for this work originated from SW, ZS, MS, and EM. AD designed the study. AD, RD, TA, and NU collected the training data, and RD, ZH, TA, and NU collected the reference points. AD implemented the data-processing workflow and generated the figures and tables. AD, SW, ZS, and EM wrote the draft, and AD, SW, ZS, MS, RD, ZH, TA, NU, DLAG, and EM were involved in the revision of the paper.
The contact author has declared that none of the authors has any competing interests.
Publisher's note: Copernicus Publications remains neutral with regard to jurisdictional claims in published maps and institutional affiliations.
We acknowledge funding from the Microsoft AI for Earth programme.
This paper was edited by Nophea Sasaki and reviewed by Malay Pramanik and one anonymous referee.
Alouw, J. and Wulandari, S.: Present status and outlook of coconut development in Indonesia, in: IOP Conf. Ser. Earth and Environ. Sci., 418, 012035, https://doi.org/10.1088/1755-1315/418/1/012035, 2020.
Burnett, M. W., White, T. D., McCauley, D. J., De Leo, G. A., and Micheli, F.: Quantifying coconut palm extent on Pacific islands using spectral and textural analysis of very high resolution imagery, Int. J. Remote Sens., 40, 7329–7355, 2019.
Carr, P., Trevail, A., Bárrios, S., Clubbe, C., Freeman, R., Koldewey, H. J., Votier, S. C., Wilkinson, T., and Nicoll, M. A.: Potential benefits to breeding seabirds of converting abandoned coconut plantations to native habitats after invasive predator eradication, Restor. Ecol., 29, e13386, https://doi.org/10.1111/rec.13386, 2021.
Chan, E. and Elevitch, C. R.: Cocos nucifera (coconut), Species profiles for Pacific Island agroforestry, 2, 1–27, 2006.
Coppens D'Eeckenbrugge, G., Duong, N. T. K., and Ullivari, A.: Geographic Information Systems, chap. 2, Where we are today, Biodiversity International, ISBN 978-92-9043-984-4, 2018.
Danylo, O., Pirker, J., Lemoine, G., Ceccherini, G., See, L., McCallum, I., Kraxner, F., Achard, F., and Fritz, S.: A map of the extent and year of detection of oil palm plantations in Indonesia, Malaysia and Thailand, Sci. Data, 8, 1–8, 2021.
Descals, A.: Global coconut layer Earth Engine App, https://adriadescals.users.earthengine.app/view/global-coconut-layer, last access: 6 July 2022.
Descals, A.: High-resolution global map of closed-canopy coconut v1-2, Zenodo [data set], https://doi.org/10.5281/zenodo.8128183, 2023.
Descals, A., Szantoi, Z., Meijaard, E., Sutikno, H., Rindanata, G., and Wich, S.: Oil palm (Elaeis guineensis) mapping with details: Smallholder versus industrial plantations and their extent in Riau, Sumatra, Remote Sens., 11, 2590, https://doi.org/10.3390/rs11212590, 2019.
Descals, A., Wich, S., Meijaard, E., Gaveau, D. L. A., Peedell, S., and Szantoi, Z.: High-resolution global map of smallholder and industrial closed-canopy oil palm plantations, Earth Syst. Sci. Data, 13, 1211–1231, https://doi.org/10.5194/essd-13-1211-2021, 2021.
De Souza, I. E. and Falcão, A. X.: Learning cnn filters from user-drawn image markers for coconut-tree image classification, IEEE Geosci. Remote Sens. Lett., 19, 2500105, https://doi.org/10.1109/LGRS.2020.3020098, 2020.
Di Gregorio, A.: Land cover classification system: classification concepts and user manual: LCCS, Food & Agriculture Org, ISBN 92-5-105327-8, 2005.
Drusch, M., Del Bello, U., Carlier, S., Colin, O., Fernandez, V., Gascon, F., Hoersch, B., Isola, C., Laberinti, P., Martimort, P., and others: Sentinel-2: ESA's optical high-resolution mission for GMES operational services, Remote Sens. Environ., 120, 25–36, 2012.
European Space Agency: Copernicus Open Access Hub, https://scihub.copernicus.eu/, last access: 6 July 2022.
Falk, T., Mai, D., Bensch, R., Çiçek, Ö., Abdulkadir, A., Marrakchi, Y., Böhm, A., Deubner, J., Jäckel, Z., Seiwald, K., and others: U-Net: deep learning for cell counting, detection, and morphometry, Nature Meth., 16, 67–70, 2019.
FAO: FAOSTAT statistical database, http://www.fao.org/faostat/en/, last access: 16 December 2022.
Feintrenie, L., Ollivier, J., and Enjalric, F.: How to take advantage of a new crop? The experience of Melanesian smallholders, Agroforest. Syst., 79, 145–155, 2010.
Freudenberg, M., Nölke, N., Agostini, A., Urban, K., Wörgötter, F., and Kleinn, C.: Large scale palm tree detection in high resolution satellite images using U-Net, Remote Sens., 11, 312, https://doi.org/10.3390/rs11030312, 2019.
Gaveau, D. L., Locatelli, B., Salim, M. A., Manurung, T., Descals, A., Angelsen, A., Meijaard, E., and Sheil, D.: Slowing deforestation in Indonesia follows declining oil palm expansion and lower oil prices, PloS one, 17, e0266178, https://doi.org/10.1371/journal.pone.0266178, 2022.
Gibril, M. B. A., Bakar, S. A., Yao, K., Idrees, M. O., and Pradhan, B.: Fusion of RADARSAT-2 and multispectral optical remote sensing data for LULC extraction in a tropical agricultural area, Geocarto Int., 32, 735–748, 2017.
Gunn, B. F., Baudouin, L., and Olsen, K. M.: Independent origins of cultivated coconut (Cocos nucifera L.) in the old world tropics, Plos one, 6, e21143, https://doi.org/10.1371/journal.pone.0021143, 2011.
Hebbar, K. B., Abhin, P. S., Sanjo Jose, V., Neethu, P., Santhosh, A., Shil, S., and Prasad, P. V.: Predicting the Potential Suitable Climate for Coconut (Cocos nucifera L.) Cultivation in India under Climate Change Scenarios Using the MaxEnt Model, Plants, 11, 731, https://doi.org/10.3390/plants11060731, 2022.
Hijmans, R. J., Cameron, S. E., Parra, J. L., Jones, P. G., and Jarvis, A.: Very high resolution interpolated climate surfaces for global land areas, Int. J. Climatol., 25, 1965–1978, 2005.
Iakubovskii, P.: Segmentation Models Pytorch, GitHub [code], https://github.com/qubvel/segmentation_models.pytorch, last access: 1 September 2023.
International Food Policy Research Institute: Global Spatially-Disaggregated Crop Production Statistics Data for 2010 Version 2.0, Harvard Dataverse [data set], https://doi.org/10.7910/DVN/PRFF8V, 2019.
Jarvis, A., Reuter, H. I., Nelson, A., and Guevara, E.: Hole-filled SRTM for the globe Version 4, available from the CGIAR-CSI SRTM 90m Database, 15, 5, http://srtm.csi.cgiar.org (last access: 10 March 2022), 2008.
Jenifer, A. E. and Natarajan, S.: CocoNet: a hybrid machine learning framework for coconut farm identification and its cyclonic damage assessment on bitemporal SAR images, J. Appl. Remote S., 15, 042408, https://doi.org/10.1117/1.JRS.15.042408, 2021.
Kumar, S. N., Rajagopal, V., Cherian, V., Thomas, T., Sreenivasulu, B., Nagvekar, D., Hanumanthappa, M., Bhaskaran, R., Kumar, K. V., Narayanan, M., and others: Weather data based descriptive models for prediction of coconut yield in different agro-climatic zones of India, Indian J. Hortic., 66, 88–94, 2009a.
Kumar, S. N., Rajeev, M., Nagvekar, D., Venkitaswamy, R., Rao, D. R., Boraiah, B., Gawankar, M., Dhanapal, R., Patil, D., BAI, K. K., and others: Trends in weather and yield changes in past in coconut growing areas in India, J. Agrometeorol., 11, 15–18, 2009b.
Lang, N., Schindler, K., and Wegner, J. D.: High carbon stock mapping at large scale with optical satellite imagery and spaceborne LIDAR, arXiv [preprint], https://doi.org/10.48550/arXiv.2107.07431, 2021.
Ma, L., Liu, Y., Zhang, X., Ye, Y., Yin, G., and Johnson, B. A.: Deep learning in remote sensing applications: A meta-analysis and review, ISPRS J. Photogramm., 152, 166–177, 2019.
MarketsandMarkets: Coconut Oil Market by Product Type, https://www.marketsandmarkets.com/Market-Reports/coconut-oil-market-78320975.html, last access: 1 September 2023.
Meijaard, E., Abrams, J. F., Juffe-Bignoli, D., Voigt, M., and Sheil, D.: Coconut oil, conservation and the conscientious consumer, Curr. Biol., 30, R757–R758, 2020.
Mohan, M., de Mendonça, B. A. F., Silva, C. A., Klauberg, C., de Saboya Ribeiro, A. S., de Araújo, E. J. G., Monte, M. A., and Cardil, A.: Optimizing individual tree detection accuracy and measuring forest uniformity in coconut (Cocos nucifera L.) plantations using airborne laser scanning, Ecol. Modell., 409, 108736, https://doi.org/10.1016/j.ecolmodel.2019.108736, 2019.
Olofsson, P., Foody, G. M., Herold, M., Stehman, S. V., Woodcock, C. E., and Wulder, M. A.: Good practices for estimating area and assessing accuracy of land change, Remote Sensing of Environment, 148, 42–57, 2014.
Omont, H.: Coconut Information Sheet, http://www.fao.org/docs/eims/upload/216252/Infosheet_Coconut.pdf, last access: 10 March 2022.
Pabuayon, I. M., Medina, S. M., Medina, C. M., and Manohar, E. C.: The Philippines’ regulatory policy on coconut cutting: An assessment incorporating environmental consideration, Journal of the International Society for Southeast Asian Agricultural Sciences, 15, 93–106, 2009.
Palaniswami, C., Upadhyay, A., and Maheswarappa, H.: Spectral mixture analysis for subpixel classification of coconut, Curr. Sci. India, 91, 1706–1711, 2006.
Peiris, T. and Thattil, R.: The study of climate effects on the nut yield of coconut using parsimonious models, Exp. Agr., 34, 189–206, 1998.
Peiris, T., Fernando, M., and de S. Waidayanatha, U.: Factors influencing the productivity of coconut estates, CORD, 17, 34–34, 2001.
Sayre, R., Noble, S., Hamann, S., Smith, R., Wright, D., Breyer, S., Butler, K., Van Graafeiland, K., Frye, C., Karagulle, D., Hopkins, D.,Stephens, D., Kelly, K., Basher, Z., Burton, D., Cress, J., Atkins, K., Van Sistine, D.P., Friesen, B., Allee, R., Allen, T., Aniello, P., Asaa, I., Costello, M.J., Goodin, K., Harris, P., Kavanaugh, M., Lillis, H., Manca, E., Muller-Karger, F., Nyberg, B., Parsons, R., Saarinen, J., Steiner, J., and Reed, A.: A new 30 meter resolution global shoreline vector and associated global islands database for the development of standardized ecological coastal units, J. Oper. Oceanogr., 12, S47–S56, 2019.
Son, N.-T., Chen, C.-F., Chen, C.-R., Duc, H.-N., and Chang, L.-Y.: A phenology-based classification of time-series MODIS data for rice crop monitoring in Mekong Delta, Vietnam, Remote Sens., 6, 135–156, 2013.
Szantoi, Z., Jaffrain, G., Gallaun, H., Bielski, C., Ruf, K., Lupi, 65 A., Miletich, P., Giroux, A.-C., Carlan, I., Croi, W., Augu, H., Kowalewski, C., and Brink, A.: Quality assurance and assessment framework for land cover maps validation in the Copernicus Hot Spot Monitoring activity, Eur. J. Remote Sens., 54, 538–557, 2021.
Theodoridis, S. and Koutroumbas, K.: Pattern recognition, Elsevier, ISBN 0-12-369531-7, 2006.
Torres, R., Snoeij, P., Geudtner, D., Bibby, D., Davidson, M., Attema, E., Potin, P., Rommen, B., Floury, N., Brown, M., Navas-Traver, I., Deghaye, P., Duesmann, B., Rosich, B., Miranda, N., Bruno, C., L'Abbate, M., Croci, R., Pietropaolo, A., Huchler, M., and Rostan, F.: GMES Sentinel-1 mission, Remote Sens. Environ., 120, 9–24, 2012.
Vermote, E. F., Skakun, S., Becker-Reshef, I., and Saito, K.: Remote sensing of coconut trees in tonga using very high spatial resolution worldview-3 data, Remote Sens., 12, 3113, https://doi.org/10.3390/rs12193113, 2020.
Young, H., Miller-ter Kuile, A., McCauley, D., and Dirzo, R.: Cascading community and ecosystem consequences of introduced coconut palms (Cocos nucifera) in tropical islands, Can. J. Zoo., 95, 139–148, 2017.
Yu, Q., You, L., Wood-Sichra, U., Ru, Y., Joglekar, A. K. B., Fritz, S., Xiong, W., Lu, M., Wu, W., and Yang, P.: A cultivated planet in 2010 – Part 2: The global gridded agricultural-production maps, Earth Syst. Sci. Data, 12, 3545–3572, https://doi.org/10.5194/essd-12-3545-2020, 2020.
Zheng, J., Wu, W., Yu, L., and Fu, H.: Coconut trees detection on the tenarunga using high-resolution satellite images and deep learning, in: 2021 IEEE International Geoscience and Remote Sensing Symposium IGARSS, 6512–6515, https://doi.org/10.1109/IGARSS47720.2021.9555008, 2021.
Zheng, J., Yuan, S., Wu, W., Li, W., Yu, L., Fu, H., and Coomes, D.: Surveying coconut trees using high-resolution satellite imagery in remote atolls of the Pacific Ocean, Remote Sens. Environ., 287, 113485, https://doi.org/10.1016/j.rse.2023.113485, 2023.