the Creative Commons Attribution 4.0 License.
the Creative Commons Attribution 4.0 License.
 | 17 Aug 2020
An integration of gauge, satellite, and reanalysis precipitation datasets for the largest river basin of the Tibetan Plateau
Yuanwei Wang
Xiuping Li
Jing Zhou
Zhidan Hu
As the largest river basin of the Tibetan Plateau, the upper Brahmaputra River basin (also called “Yarlung Zangbo” in Chinese) has profound impacts on the water security of local and downstream inhabitants. Precipitation in the basin is mainly controlled by the Indian summer monsoon and westerly and is the key to understanding the water resources available in the basin; however, due to sparse observational data constrained by a harsh environment and complex topography, there remains a lack of reliable information on basin-wide precipitation (there are only nine national meteorological stations with continuous observations). To improve the accuracy of basin-wide precipitation data, we integrate various gauge, satellite, and reanalysis precipitation datasets, including GLDAS, ITP-Forcing, MERRA2, TRMM, and CMA datasets, to develop a new precipitation product for the 1981–2016 period over the upper Brahmaputra River basin, at 3 h and 5 km resolution. The new product has been rigorously validated at different temporal scales (e.g., extreme events, daily to monthly variability, and long-term trends) and spatial scales (point and basin scale) with gauge precipitation observations, showing much improved accuracies compared to previous products. An improved hydrological simulation has been achieved (low relative bias: −5.94 %; highest Nash–Sutcliffe coefficient of efficiency (NSE): 0.643) with the new precipitation inputs, showing reliability and potential for multidisciplinary studies. This new precipitation product is openly accessible at https://doi.org/10.5281/zenodo.3711155 (Wang et al., 2020) and additionally at the National Tibetan Plateau Data Center (https://data.tpdc.ac.cn, last access: 10 July 2020, login required).


Precipitation plays a very important role in the research of hydrology, meteorology, ecology, and even social economics as it is a critical input factor for various models (e.g., hydrological and land surface models; Qi et al., 2016; L. Wang et al., 2017; Fang et al., 2019; Miri et al., 2019; S. Wang et al., 2019). Specifically, precipitation is a key part of the water balance and energy cycle and will directly impact runoff generation and soil moisture movement (Su et al., 2008). As a result, water resource management tasks such as flood forecasting and drought monitoring, ecological environment restoration (e.g., vegetation growth and protection), and many other scientific and social applications are closely linked with precipitation patterns (Funk et al., 2015).
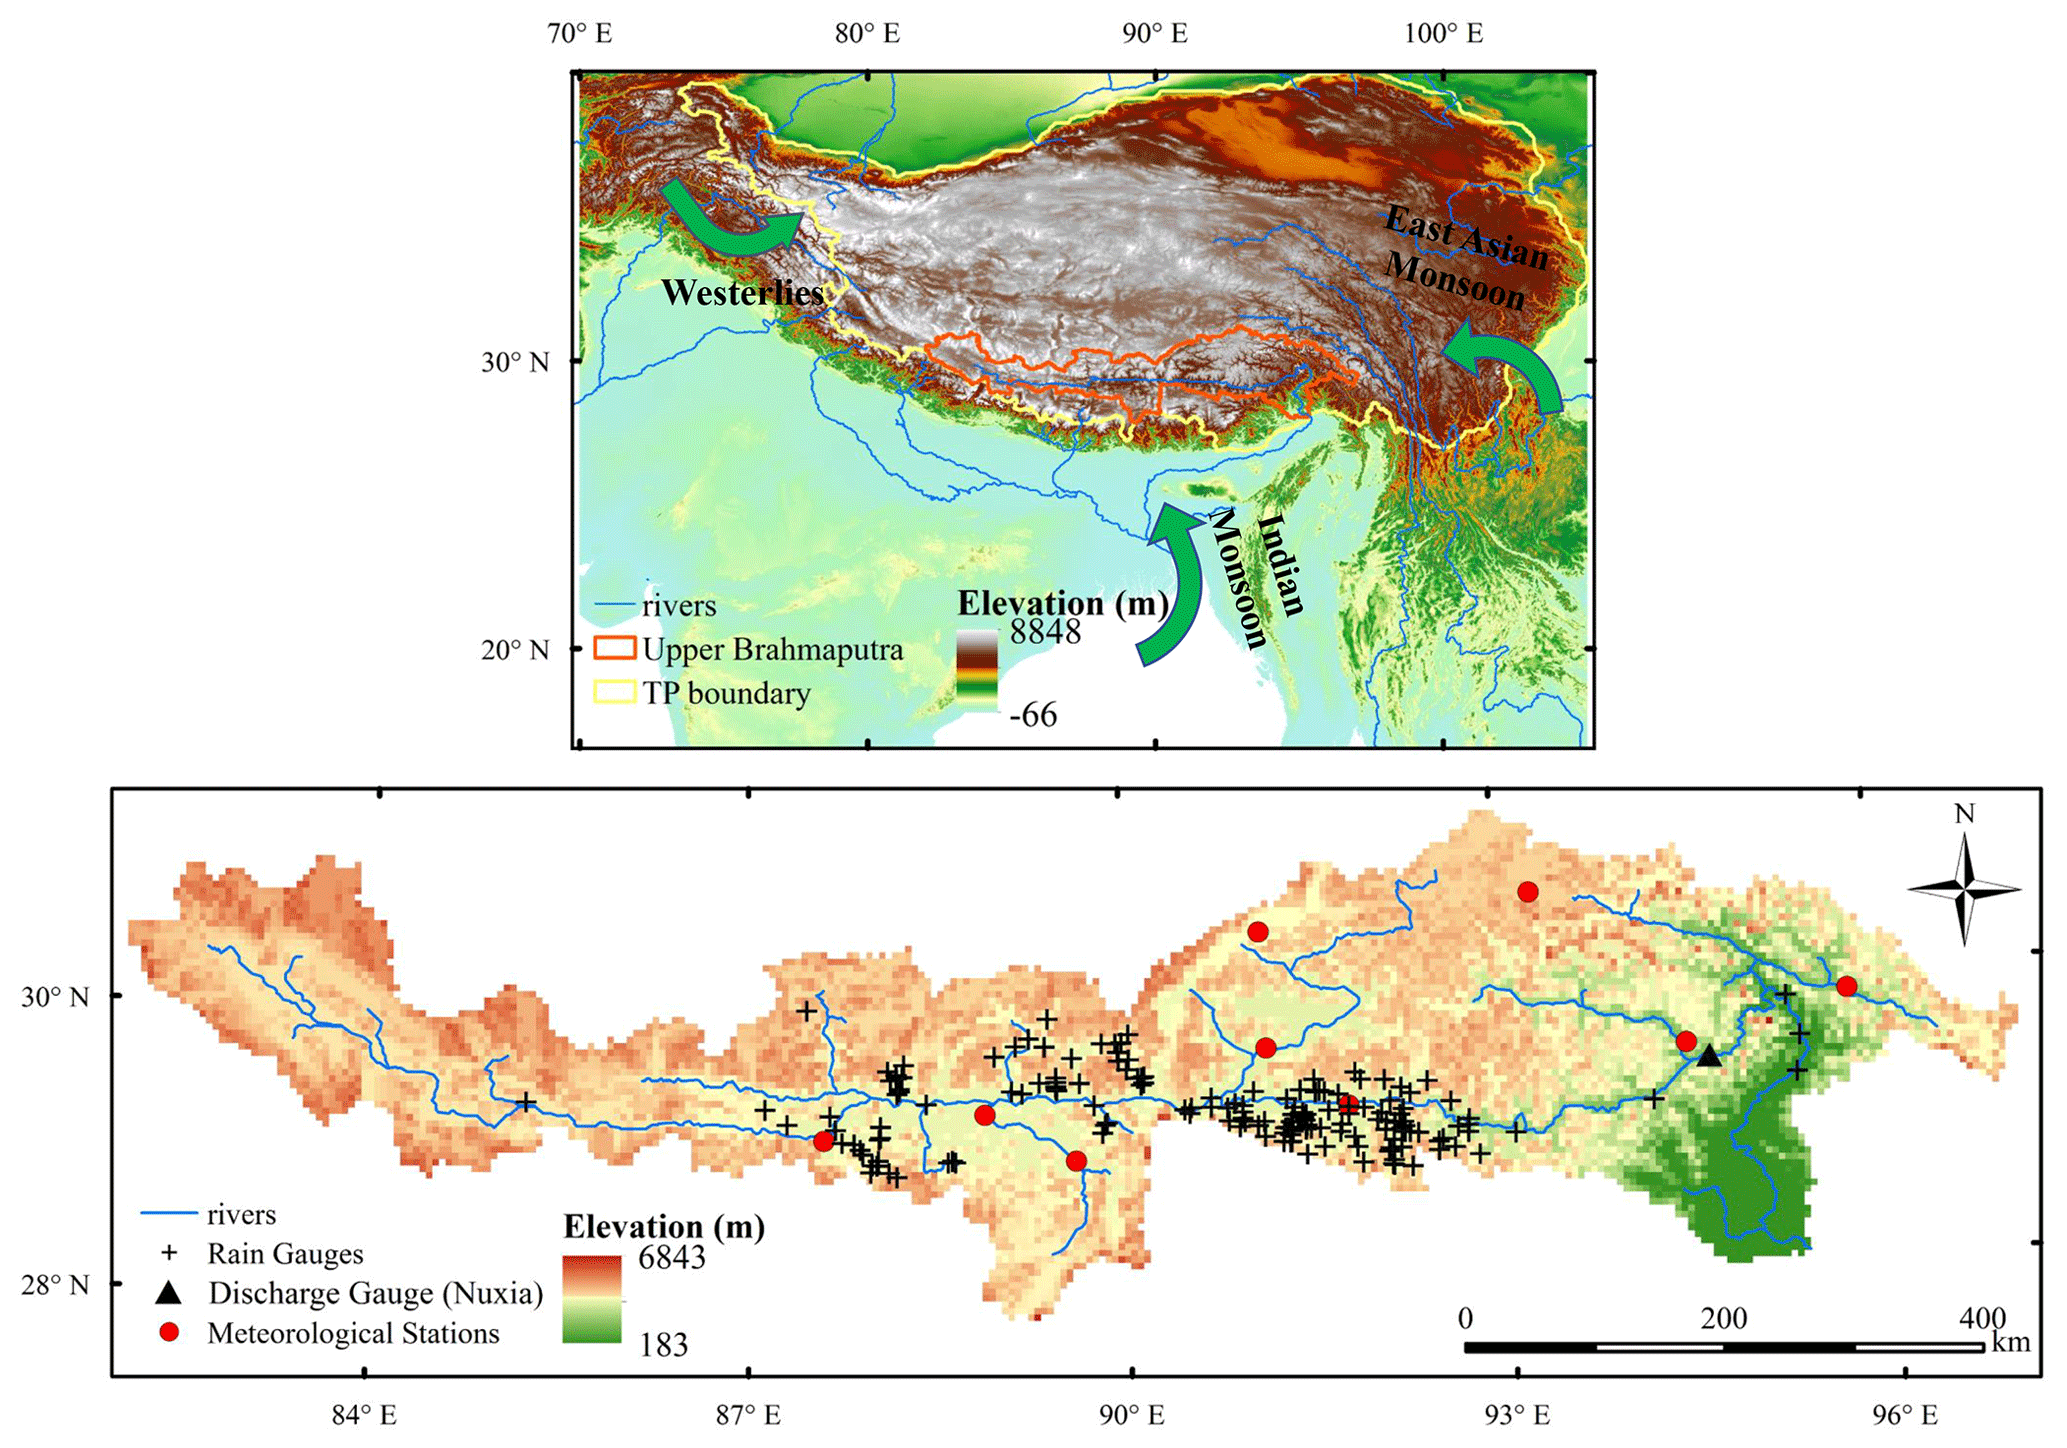
Figure 1The upper Brahmaputra River basin originates from the Tibetan Plateau (TP) with the spatial distribution of nine meteorological stations from the China Meteorological Administration (CMA) and 166 rain gauges from the Ministry of Water Resources (MWR), China. The green arrow indicates the direction of the westerlies, the Indian monsoon, and the East Asian monsoon. The elevation data were obtained from the SRTM DEM datasets (https://earthexplorer.usgs.gov, last access: 30 January 2020).
The Tibetan Plateau (TP), known as the highest plateau in the world, is covered by massive glaciers, snow, and permafrost, which significantly affect the hydrological processes of all the large rivers that are fed by it: the Brahmaputra, the Salween, and the Mekong, among others. Therefore, it is necessary to explore the hydrological variations over the TP to achieve efficient utilization and protection of its water resources and a better understanding of the effects of climate change on the surrounding region. However, due to the irregular and sparse distribution of national meteorological stations, particularly in the upper Brahmaputra (precipitation data from only nine stations are available and are sparsely distributed; see Sang et al., 2016; Cuo et al., 2019), there are large data constraints on research on these hydrological processes and their responses to climate change. Although there are many more rain gauges managed by the Ministry of Water Resources (MWR), most of them are located in middle-stream regions, and rainfall datasets are only recorded over short time periods. Simply using the linear mean of these station observations to calculate variations in precipitation for the entire basin is impractical and prone to problems (Lu et al., 2015). Accurate spatial distributions of precipitation are unavailable. This influences the generation of historical runoff data (Mazzoleni et al., 2019), meaning that the specific contributions of glaciers, snow cover, permafrost, and vegetation to hydrological processes in this area cannot be analyzed and quantified, posing a threat to regional sustainable development and living conditions (Shen et al., 2010; Guo et al., 2016; Kidd et al., 2017; Shi et al., 2017; Ruhi et al., 2018; Sun et al., 2018).
A longer time series of spatially consistent and temporally continuous precipitation products could be used to improve our understanding of feedback mechanisms between different meteorological and hydrological components, especially under the background signal of climate change. Various satellite rainfall products have been widely used in previous studies, such as the National Oceanic and Atmospheric Administration/Climate Prediction Centre (NOAA/CPC) morphing technique (CMORPH; Ferraro et al., 2000; Joyce et al., 2004; Shen et al., 2014) and the Tropical Rainfall Measuring Mission (TRMM; Huffman et al., 2007; Roca et al., 2019). However, there are still problems in estimating daily (Meng et al., 2014; Bai and Liu, 2018) and extreme precipitation (Funk et al., 2015; Y. Zhou et al., 2015; Fang et al., 2019), especially in mountainous regions with high elevations and fewer ground measurements, such as the upper Brahmaputra (Xia et al., 2015; Xu et al., 2017; Qi et al., 2018). Additionally, there are several reanalysis datasets that have been widely used by researchers, such as the Global Land Data Assimilation System (GLDAS; Rodell et al., 2004; Zaitchik et al., 2010; Wang et al., 2011) and the Modern-Era Retrospective analysis for Research and Applications, Version 2 (MERRA2) dataset (Savtchenko et al., 2015; Gelaro et al., 2017; Reichle et al., 2017a, b). Evaluation of GLDAS data has generally been limited to the United States and other regions with adequate ground observations (Kato et al., 2007; Qi et al., 2016). Most studies have focused on evapotranspiration, soil moisture, and groundwater products derived from GLDAS or MERRA2 (Bibi et al., 2019; Deng et al., 2019; X. Li et al., 2019); meanwhile, to the best of our knowledge, there has been less focus on the evaluation of methods of precipitation estimation and little work on the corresponding river discharge simulations within the upper Brahmaputra River basin. These precipitation products generally have the advantage of wide and consistent coverage and have shown great potential in many applications (Li et al., 2015; Zhang et al., 2017; Fang et al., 2019) but also suffer from large uncertainties over the upper Brahmaputra River basin due to indirect observations, insufficient gauge calibration, and complex topography (Tong et al., 2014; Yong et al., 2015; Xu et al., 2017).
In this study, we focus on integrating gauge, satellite, and reanalysis precipitation datasets to generate a new dataset over the upper Brahmaputra, suitable for use in hydrological simulations and other scientific research related to climate change. The remainder of this study is structured as follows. Section 2 briefly describes the study area, datasets, and methodology used. Section 3 presents and discusses the evaluation results of different products and validates the accuracy and reliability of our integrated dataset. Then Sect. 4 is the data availability. Finally, conclusions are given in Sect. 5.
2.1 Study area
This study is conducted in upper Brahmaputra River basin (27–32∘ N, 81–98∘ E), located in the south of the Tibetan Plateau (Fig. 1). The Brahmaputra River is an important part of the whole GBM (Ganges, Brahmaputra, Meghna) basin, which significantly influences the natural resources and social development of the Tibetan Plateau and South Asia. The river is approximately 2057 km long with a drainage area of 240 000 km2. The climatic conditions are complicated by the extremely high altitude and highly varying topography (Wang et al., 2018; Y. Wang et al., 2019); elevation varies by up to 6500 m throughout the study region. Generally, the intra-annual distribution of precipitation is extremely uneven, with more precipitation distributed in the warm seasons (S. Wang et al., 2019). Since the Indian and East Asian monsoons bring more water vapor in summer, and the westerlies dominate in winter (Yi et al., 2013; Wang et al., 2018; Li et al., 2019a, b), there is a declining trend of precipitation from the humid southeast to the arid northwest on average. In recent decades, the TP has been experiencing a significant warming trend exceeding that in the Northern Hemisphere (Liu and Chen, 2000; Yang et al., 2014), which will affect the generation and distribution of precipitation and influence hydrological processes throughout the upper Brahmaputra.
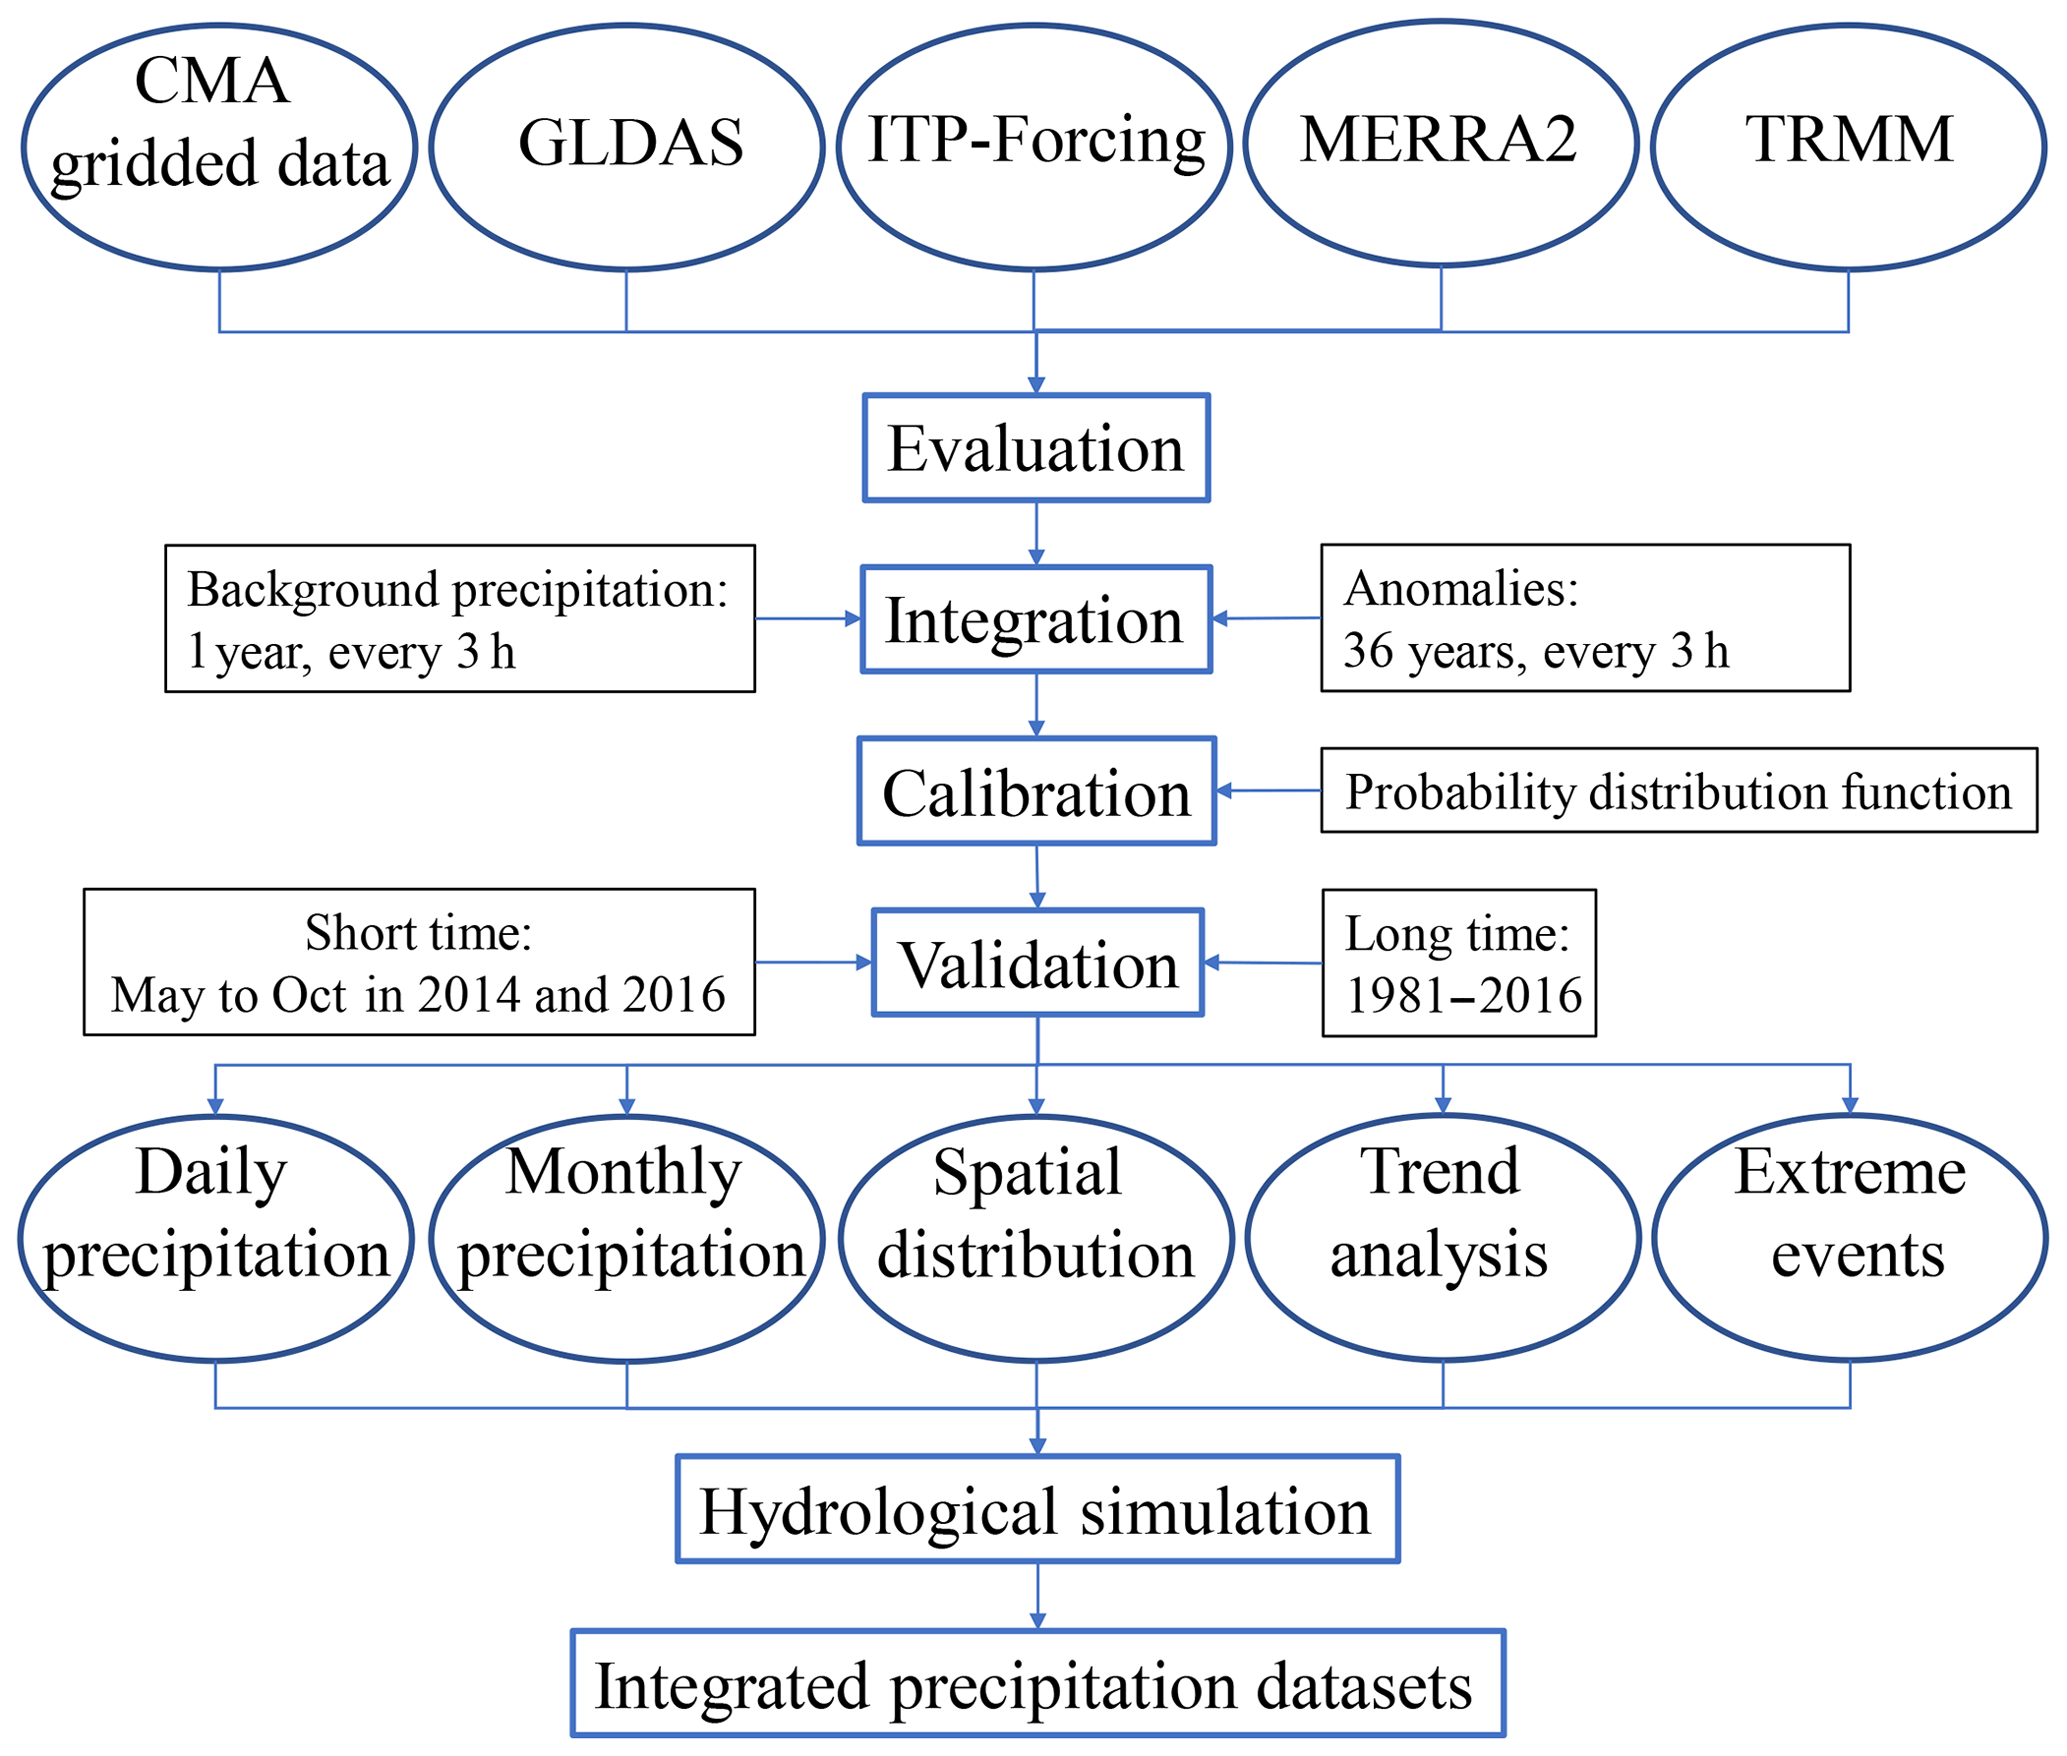
Figure 2The flowchart used to produce the spatiotemporal continuous precipitation dataset (P_int).
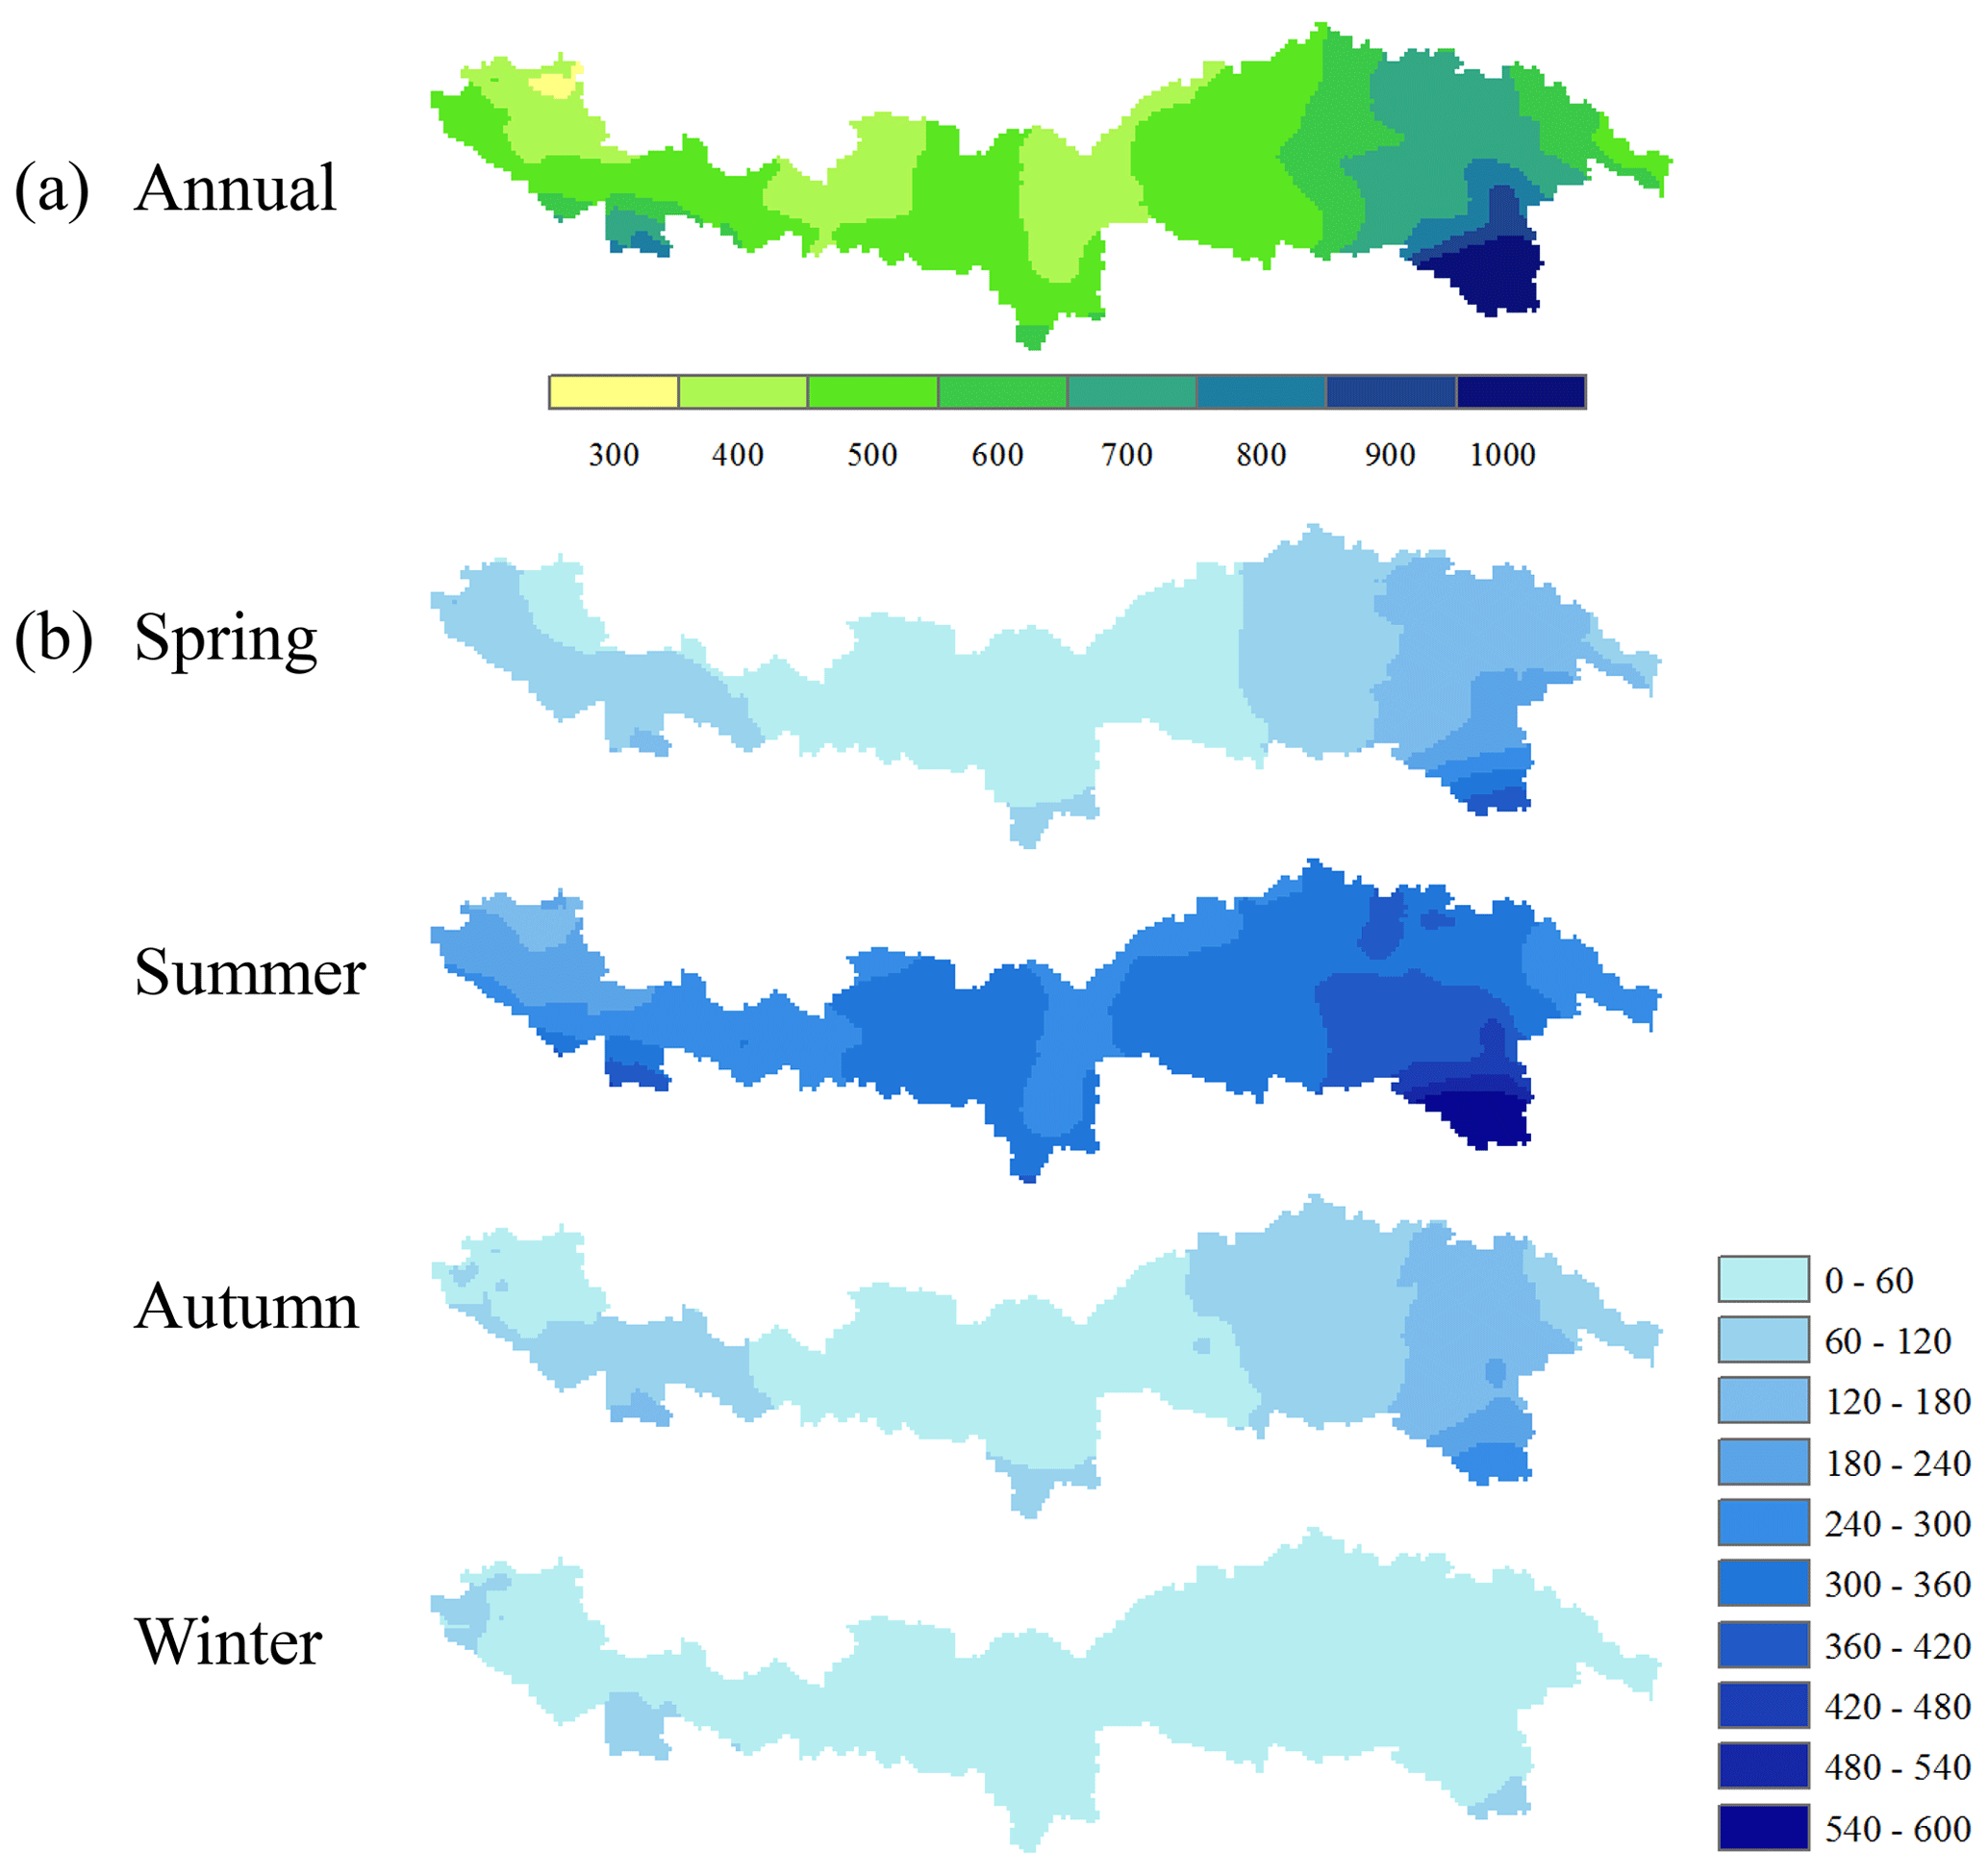
Figure 3The spatial distribution of P_int (mm) averaged from 1981 to 2016 (a annual; b seasonal).

Figure 4The spatial distribution of different precipitation products during the warm season (May to October) and the cold season (November to April) averaged from 2008 to 2016.
2.2 Datasets
Monthly precipitation data (1981–2016) from nine meteorological stations were obtained from the China Meteorological Administration (CMA), and daily precipitation data (May to October in 2014 and 2016) from 166 rain gauges were accessed through the Ministry of Water Resources (MWR), China (Fig. 1). Both of these are regarded as observed precipitation data. Daily river discharge data at Nuxia station (Fig. 1) are used to assess the simulation performance when forced by different precipitation products.
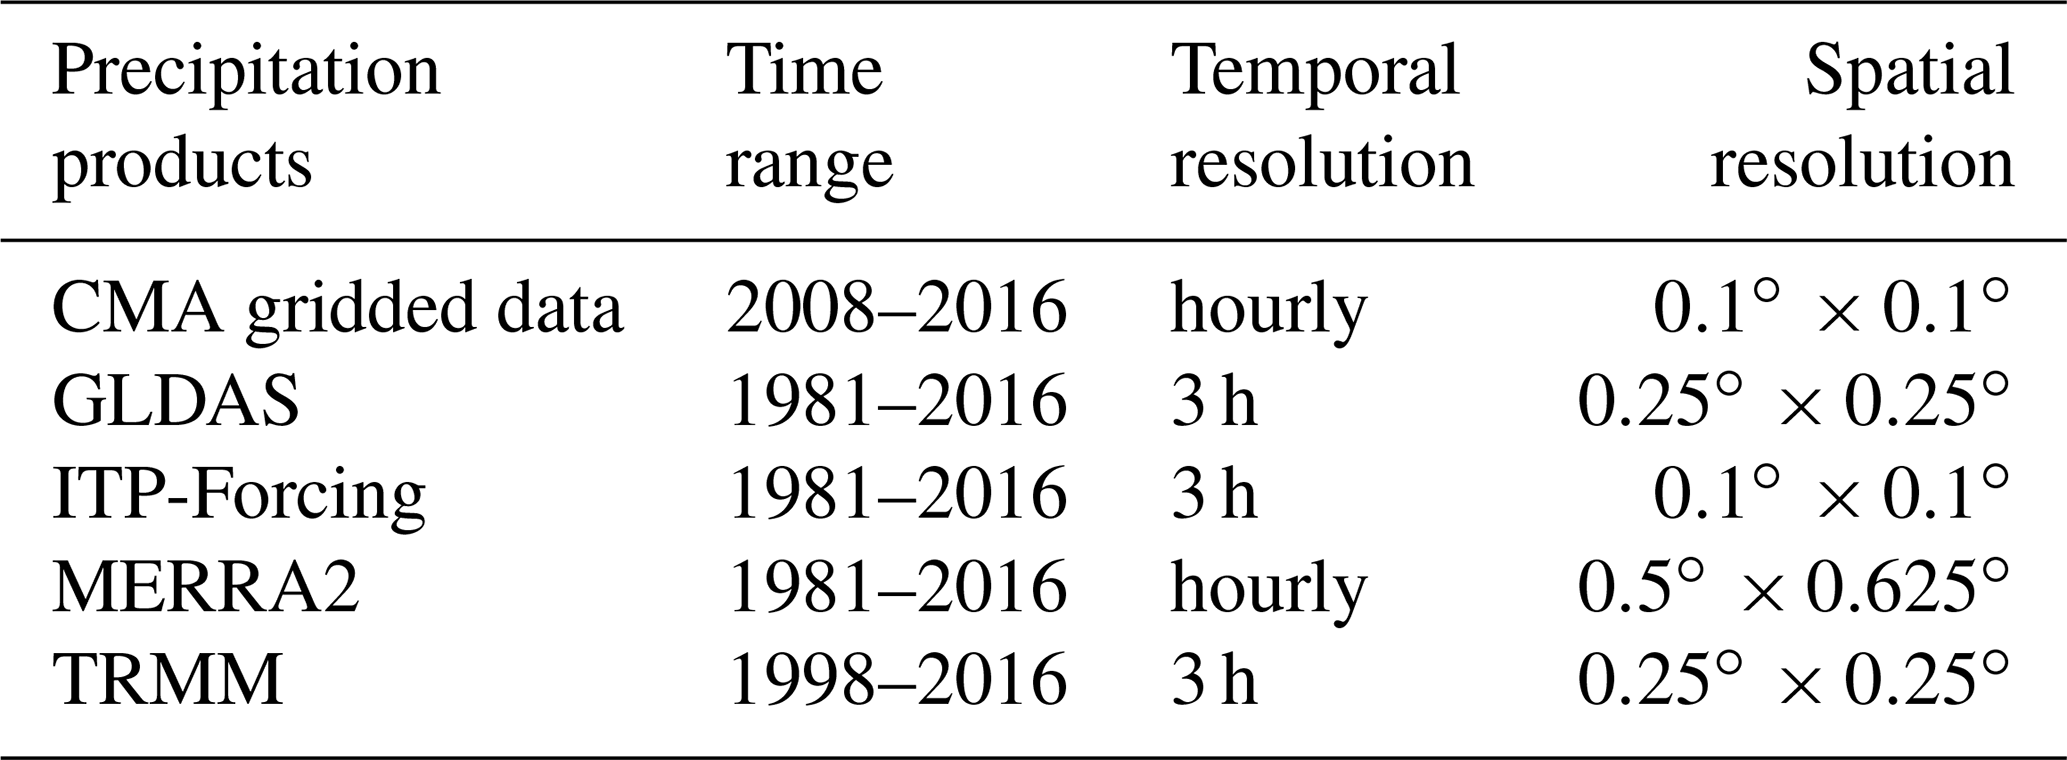
In this study, we chose five types of satellite and reanalysis precipitation products (Table 1). We first evaluated their performance in detecting precipitation and then integrated them to generate a better product, designed to enhance the strengths of each product.
The three satellite and reanalysis data products GLDAS, MERRA2, and TRMM were acquired from the National Aeronautics and Space Administration (NASA) website (https://disc.gsfc.nasa.gov/, last access: 10 July 2020 ). GLDAS ingests satellite- and ground-based observational data products and applies advanced land surface modeling and data assimilation techniques (Rodell et al., 2004; Zaitchik et al., 2010; Xia et al., 2019); it has been widely used for river discharge simulations, groundwater monitoring, and many other fields (Wang et al., 2011; Chen et al., 2013; Qi et al., 2018; Verma and Katpatal, 2019). MERRA2 is the first long-term global reanalysis dataset to assimilate space-based observations of aerosols and represent their interactions alongside other physical processes in the climate system (Marquardt Collow et al., 2016; Reichle et al., 2017a, b), and TRMM is a joint mission between NASA and the Japan Aerospace Exploration Agency (JAXA) to study rainfall for weather and climate research (Xu et al., 2017; Ali et al., 2019; S. Wang et al., 2019). The ITP-Forcing dataset has been developed by the hydrometeorological research group at the Institute of Tibetan Plateau Research, Chinese Academy of Sciences (He, 2010), and has been shown to perform well on the TP (Yang et al., 2010; Chen et al., 2011). These data were downloaded from the Cold and Arid Regions Science Data Center (http://westdc.westgis.ac.cn/, last access: 10 July 2020 ).
2.3 Methods
In this study, because of the different spatial resolutions of different products, we extracted the precipitation values from each product according to the locations of the gauges to generate product–gauge data pairings for evaluation. Where there are at least two gauges in the pixel of one product, we used the average value of the gauges to evaluate the performance of the corresponding precipitation product data.
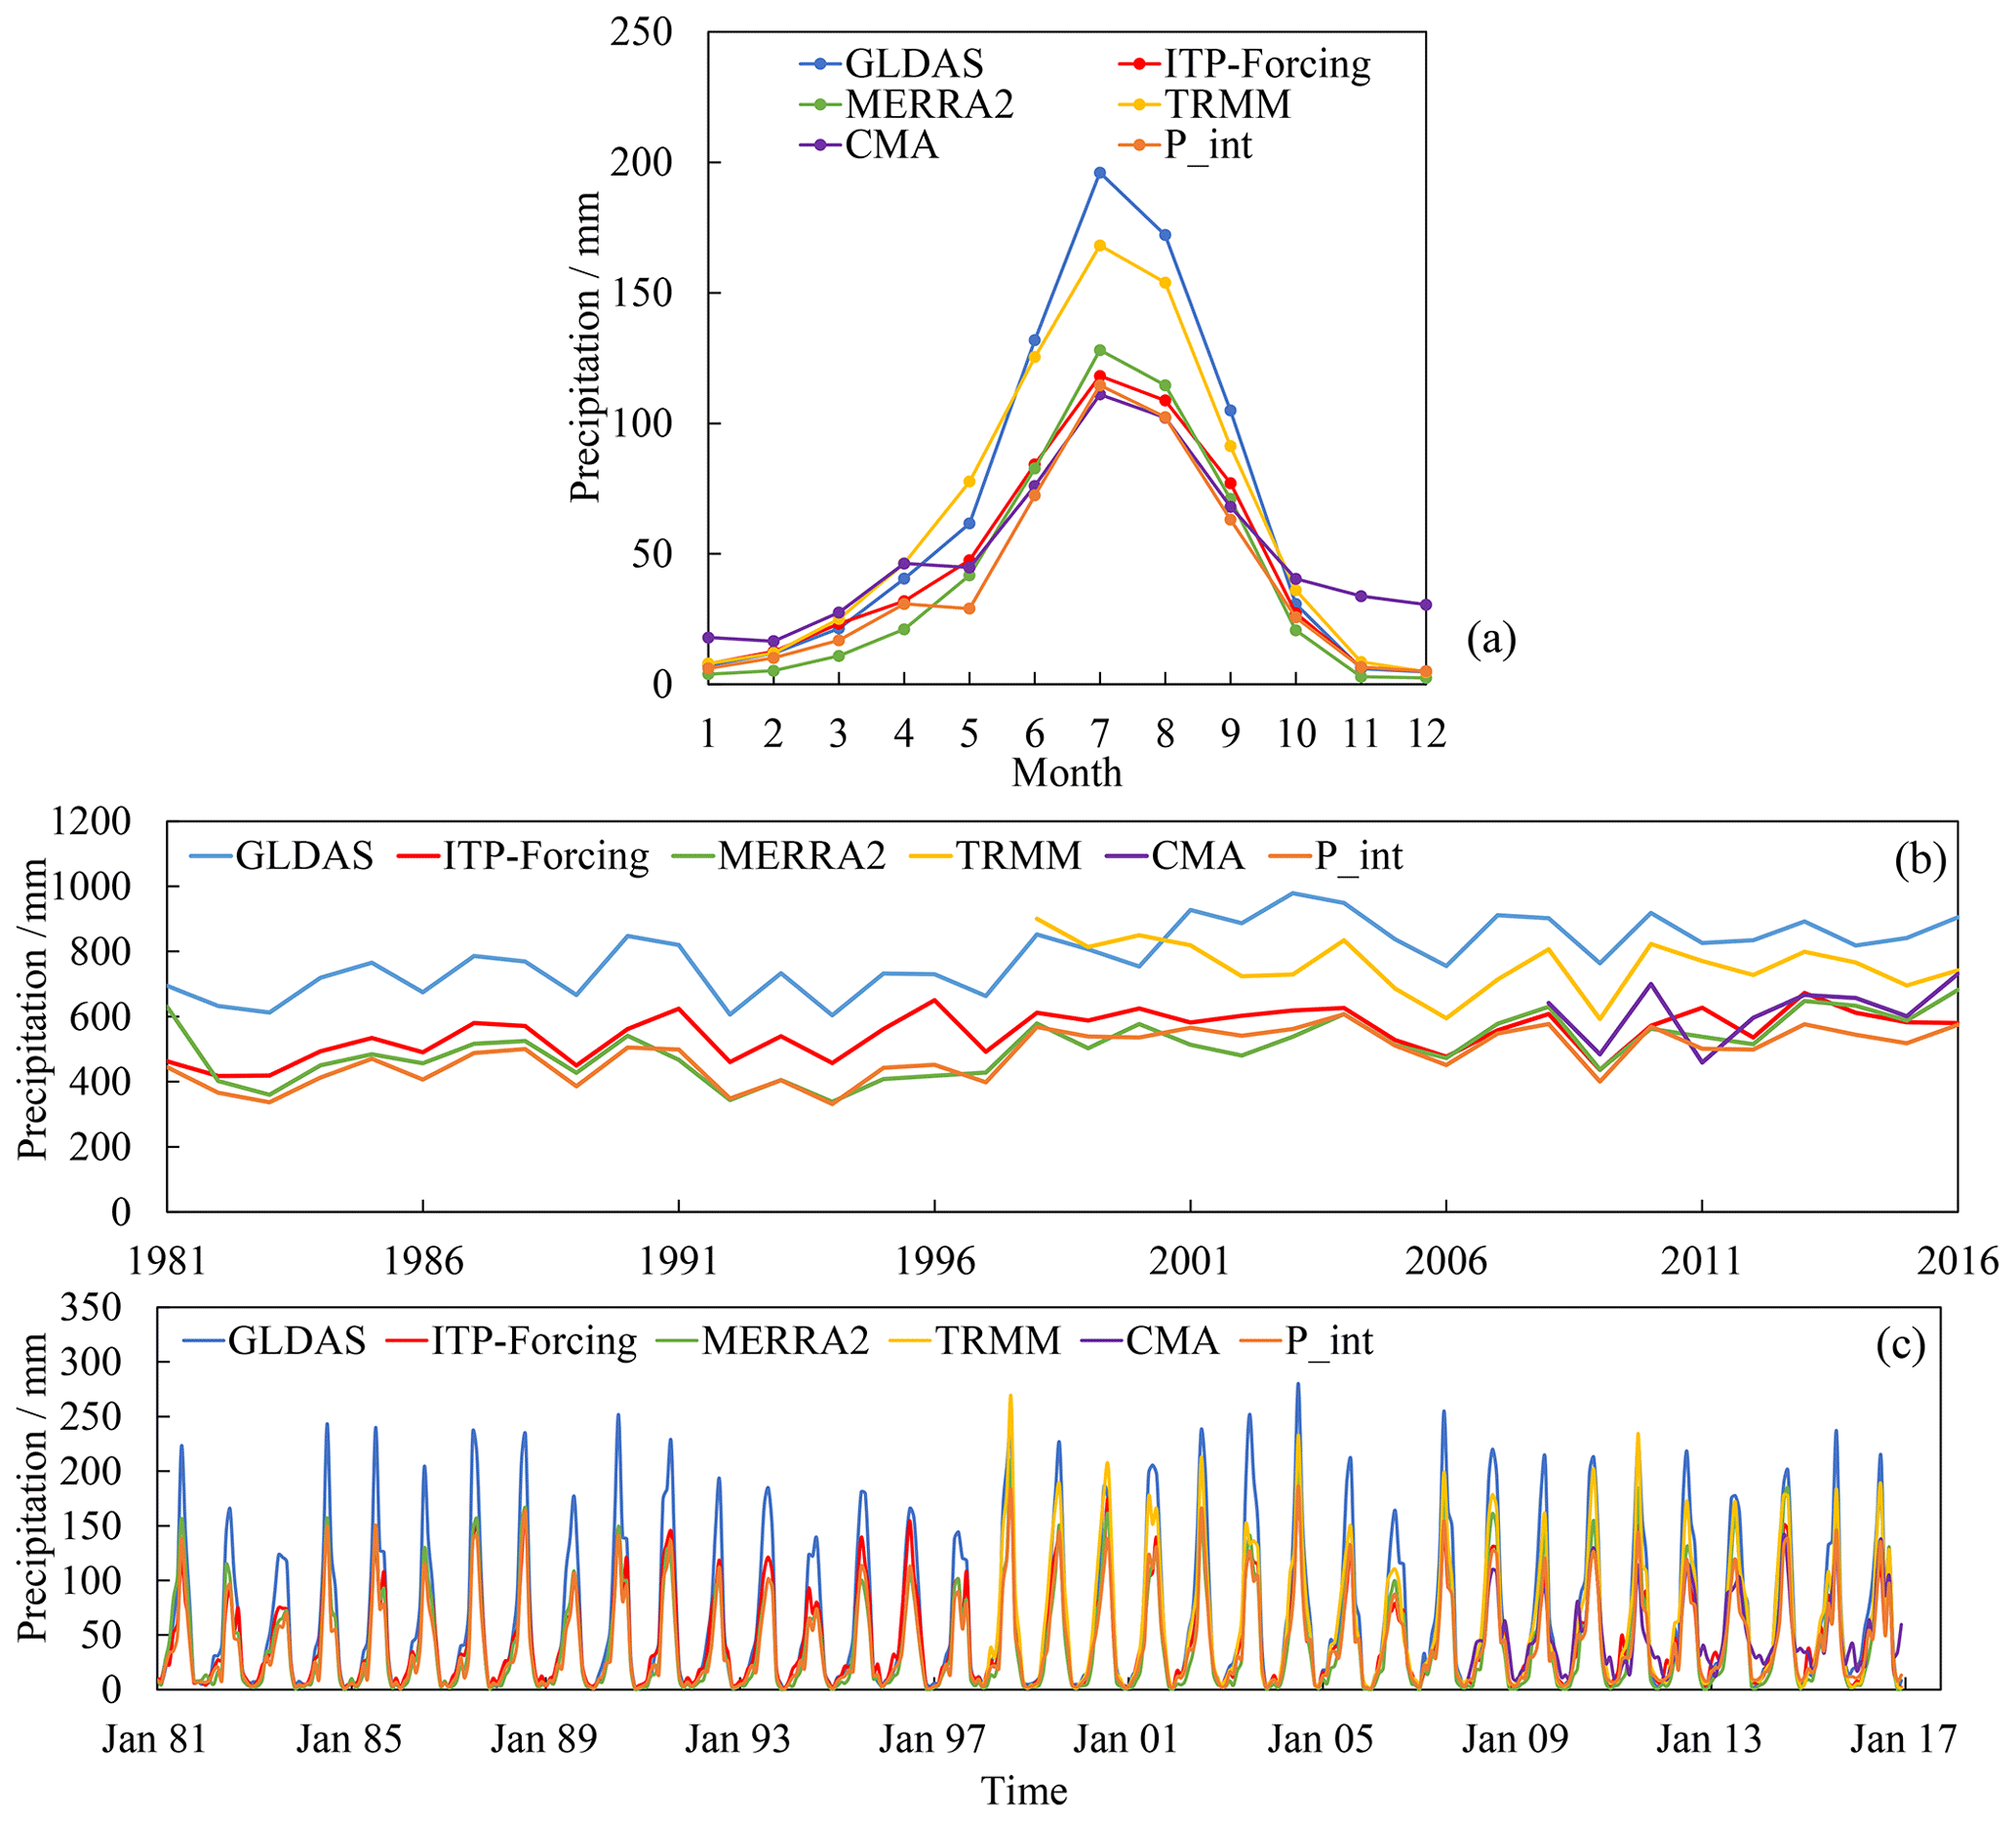
Figure 5Variations in basin-averaged precipitation from multiyear monthly mean values (a), annual values (b), and monthly values (c) for the different products.
To ensure the consistency of different products, we interpolated all the products into the same 5 km spatial resolution grid using the inverse distance weighted (IDW) method (Ma et al., 2019; Qiao et al., 2019; Sangani et al., 2019) and calculated them at 3-hourly resolution. Due to its good performance on the TP, we then used the ITP-Forcing data (1981–2016) to derive the multiyear mean 3 h data as background climatological precipitation. Then, the precipitation anomalies between CMA, GLDAS, ITP-Forcing, MERRA2, TRMM, and the background were calculated 3-hourly using
where PB, PC, PG, PI, PM, and PT represent the background precipitation and different products, respectively, and ε denotes the corresponding precipitation anomalies. Considering different weights for these anomalies, we combined the background precipitation with these anomalies,
where w represents the weight for each anomaly, and P_int refers to the new integrated precipitation at 5 km and 3-hourly resolution.
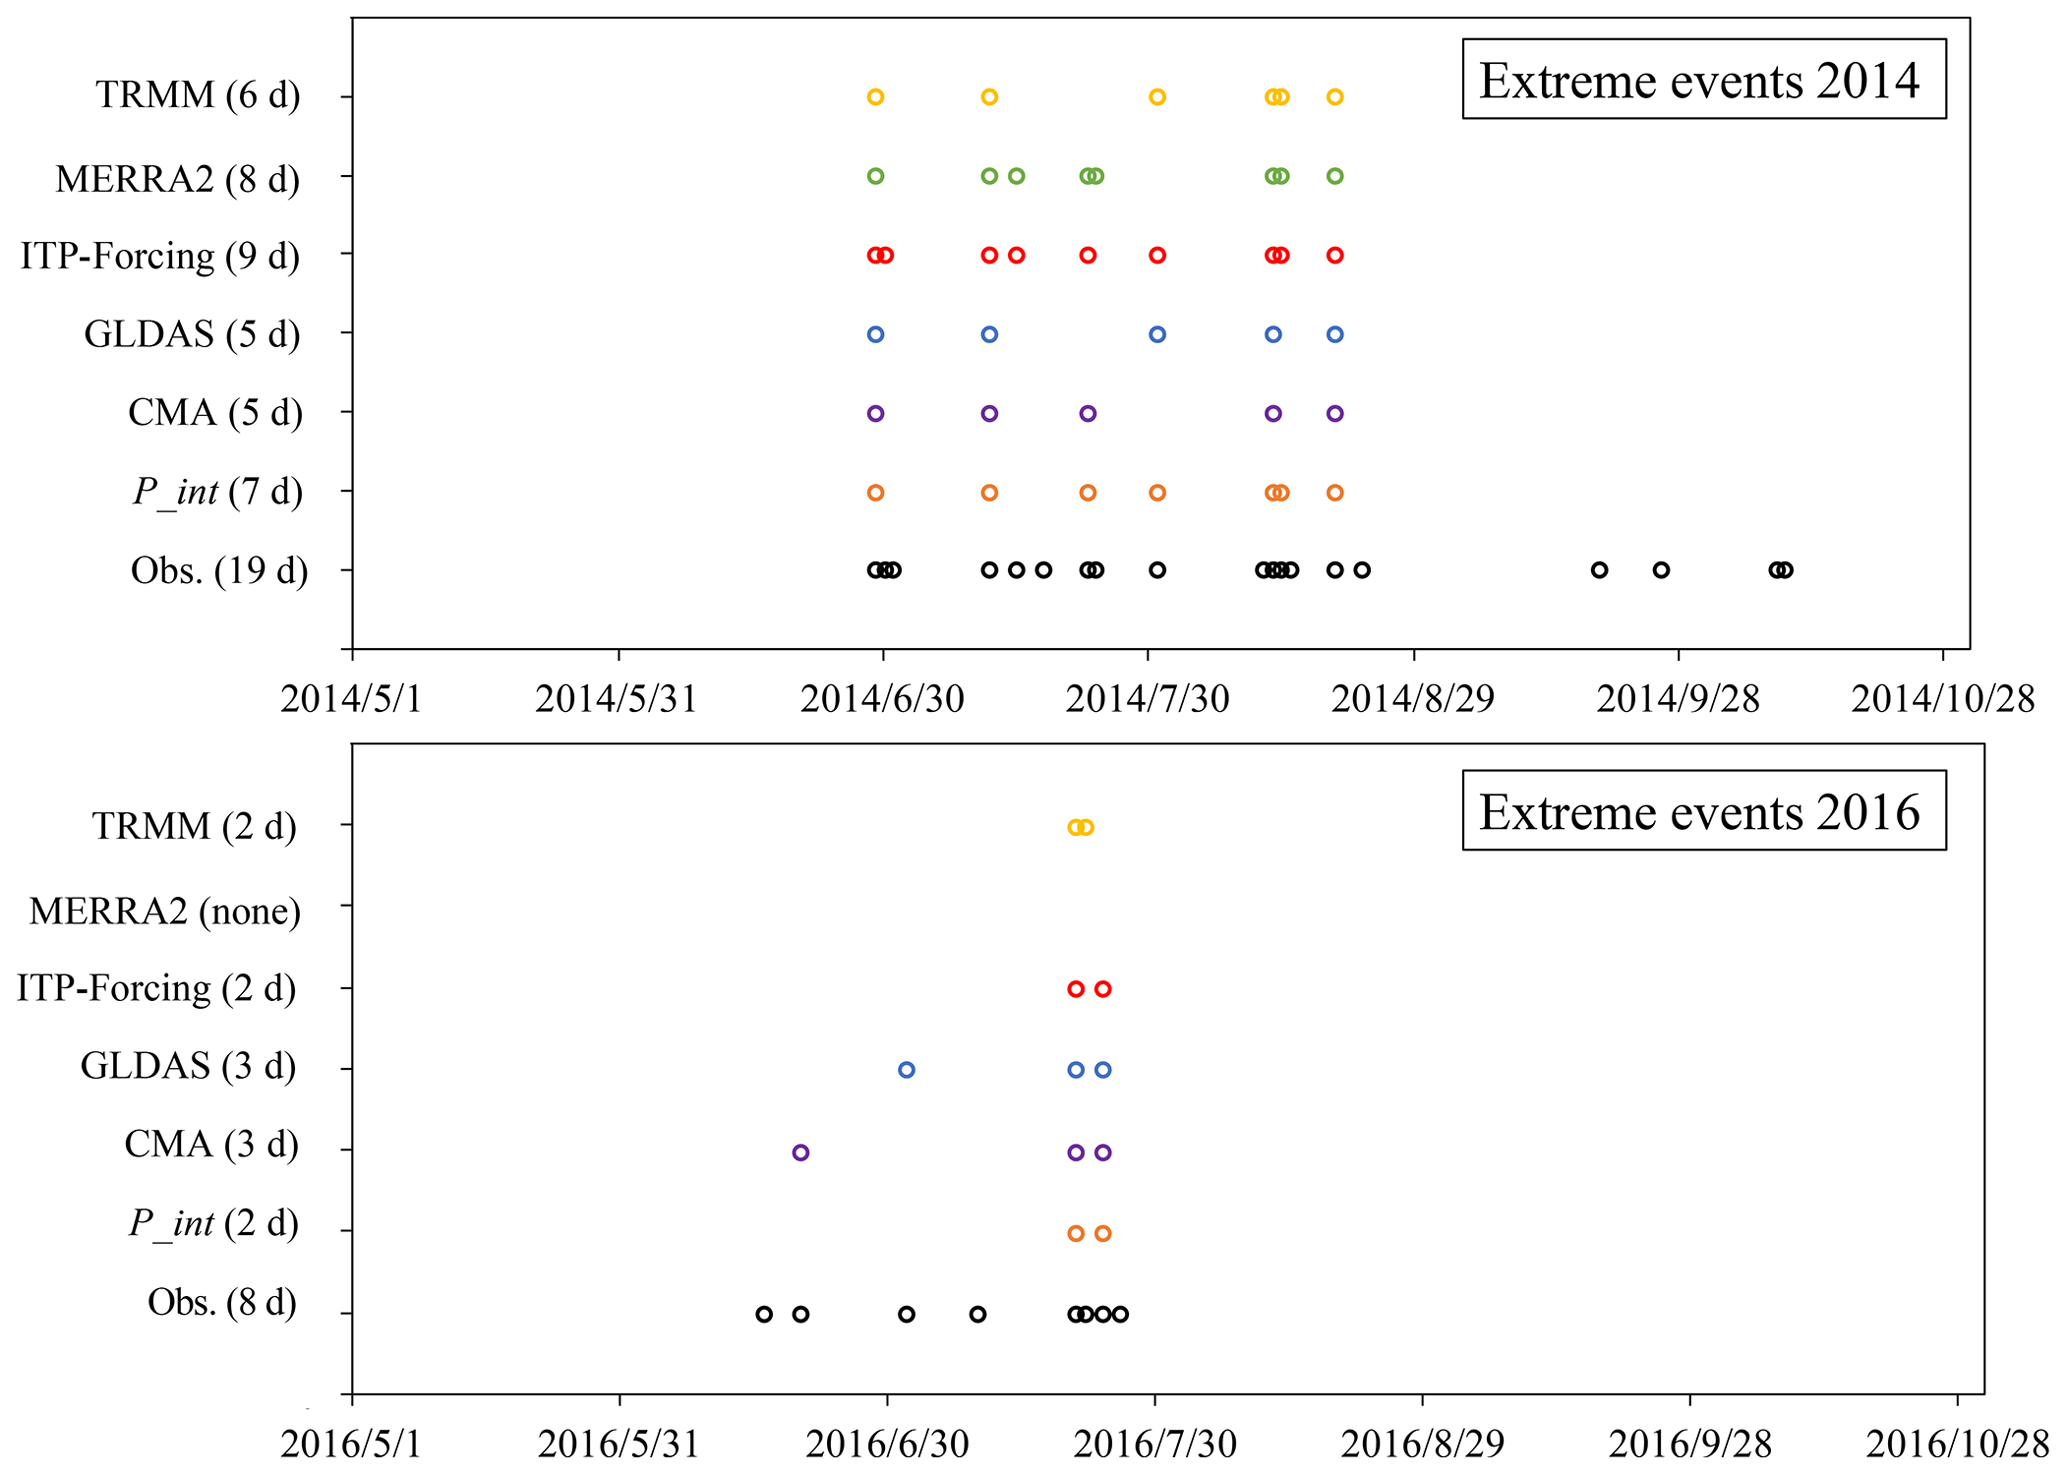
After P_int was acquired, we corrected its probability distribution function (PDF) based on the rain gauges and undertook several validation steps for spatial distribution and at different timescales (e.g., extreme events, seasonal to interannual variability, and long-term trends). At the same time, we also analyzed the changing trend over the 36 years and the extremely high precipitation events during the warm months in 2014 and 2016. In order to identify the extreme events, we first assumed that daily precipitation conforms to a normal distribution. From this we calculated a threshold, above which the probability of precipitation values occurring is less than 0.05 (e.g., Fang et al., 2019, use 0.1). We considered events with precipitation values above this threshold as extreme events.
where P denotes the probability. Finally, based on the observed discharge data at Nuxia station, we compared the simulated daily discharges (normalized) from 2008 to 2016 using a water- and energy-budget-based distributed hydrological model (WEB-DHM) to check the accuracy and reliability of our integrated precipitation. Evaluation criteria used in the discharge error assessment include relative bias (RB) and the Nash–Sutcliffe coefficient of efficiency (NSE).
where Qnormalized, Qobs, and Qsim represent the normalized discharge, observed discharge, and simulated discharge, respectively. The perfect value of RB is 0, and that of NSE is 1. More information about this model can be found in many studies (Wang et al., 2009; Wang and Koike, 2009; Xue et al., 2013; J. Zhou et al., 2015; L. Wang et al., 2016, 2017). Figure 2 shows the flowchart of this study, and Fig. 3 presents the final spatial distribution of our integrated product.
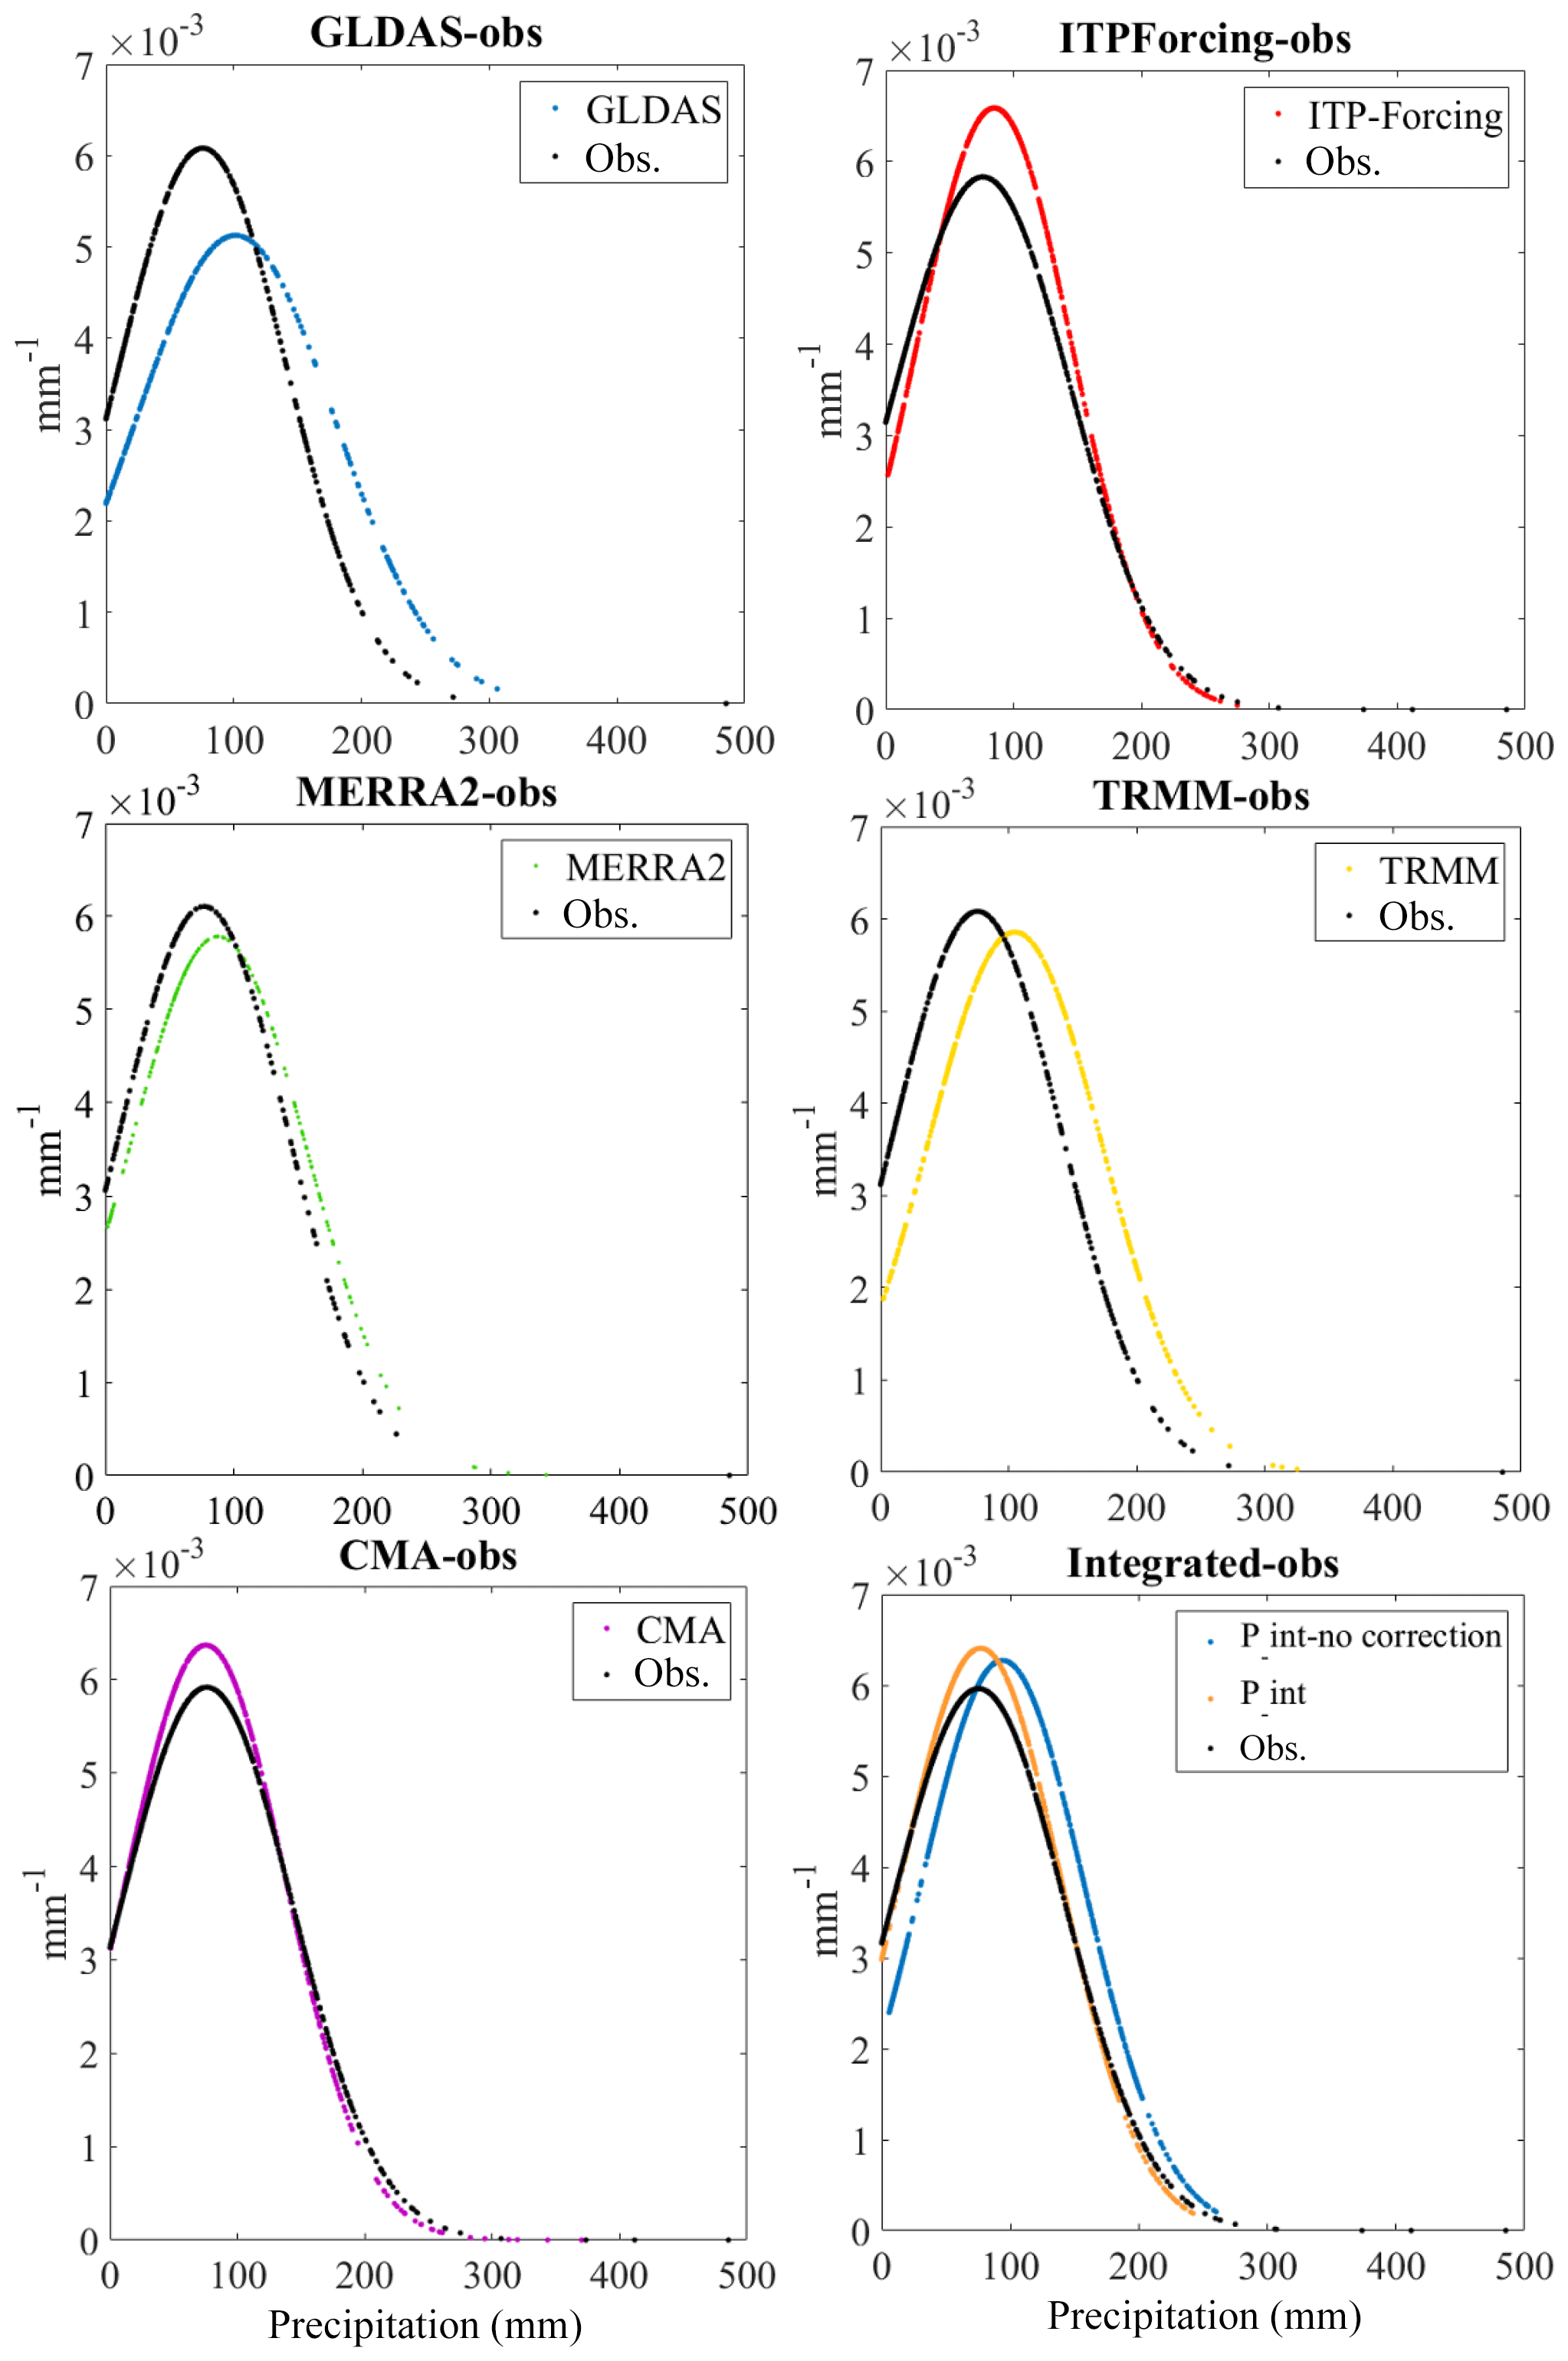
Figure 6A comparison of the probability distribution function (PDF) between all the monthly observations and different precipitation products in the warm seasons (May to October in 2014 and 2016).
3.1 Evaluation of precipitation products at the basin and grid scale
Figures 4 and 5 analyze the overall regime of different precipitation products at the basin scale. Figure 4 is the spatial distribution in warm (May to October) and cold (November to April) months, and Fig. 5 presents the time series of basin-averaged annual and monthly precipitation values. The spatial pattern indicates that more precipitation occurs in warm seasons and less in cold seasons. During the warm months, GLDAS and TRMM present obvious regional differences between upstream and downstream, while CMA gridded data show the lesser values in the upstream source region. In the cold seasons, all products present almost the same pattern, among which MERRA2 gives the lowest precipitation values.
For annual precipitation, CMA, ITP-Forcing, and MERRA2 show similar characteristics (annual mean value: 615, 550, and 506 mm, respectively), while GLDAS and TRMM are 789 and 757 mm, respectively. There are also significantly (p<0.01) increasing trends in annual precipitation of GLDAS, ITP-Forcing, and MERRA2 (6.42, 3.28, and 4.68 mm yr−1, respectively) over the 36 years of the data. For monthly precipitation, GLDAS and TRMM greatly overestimate summer precipitation compared to the others, which explains why these two products give anomalously high annual values (nearly 200 mm greater than the other three data products). On the other hand, the monthly variations indicate that the intra-annual distribution of precipitation is extremely uneven.
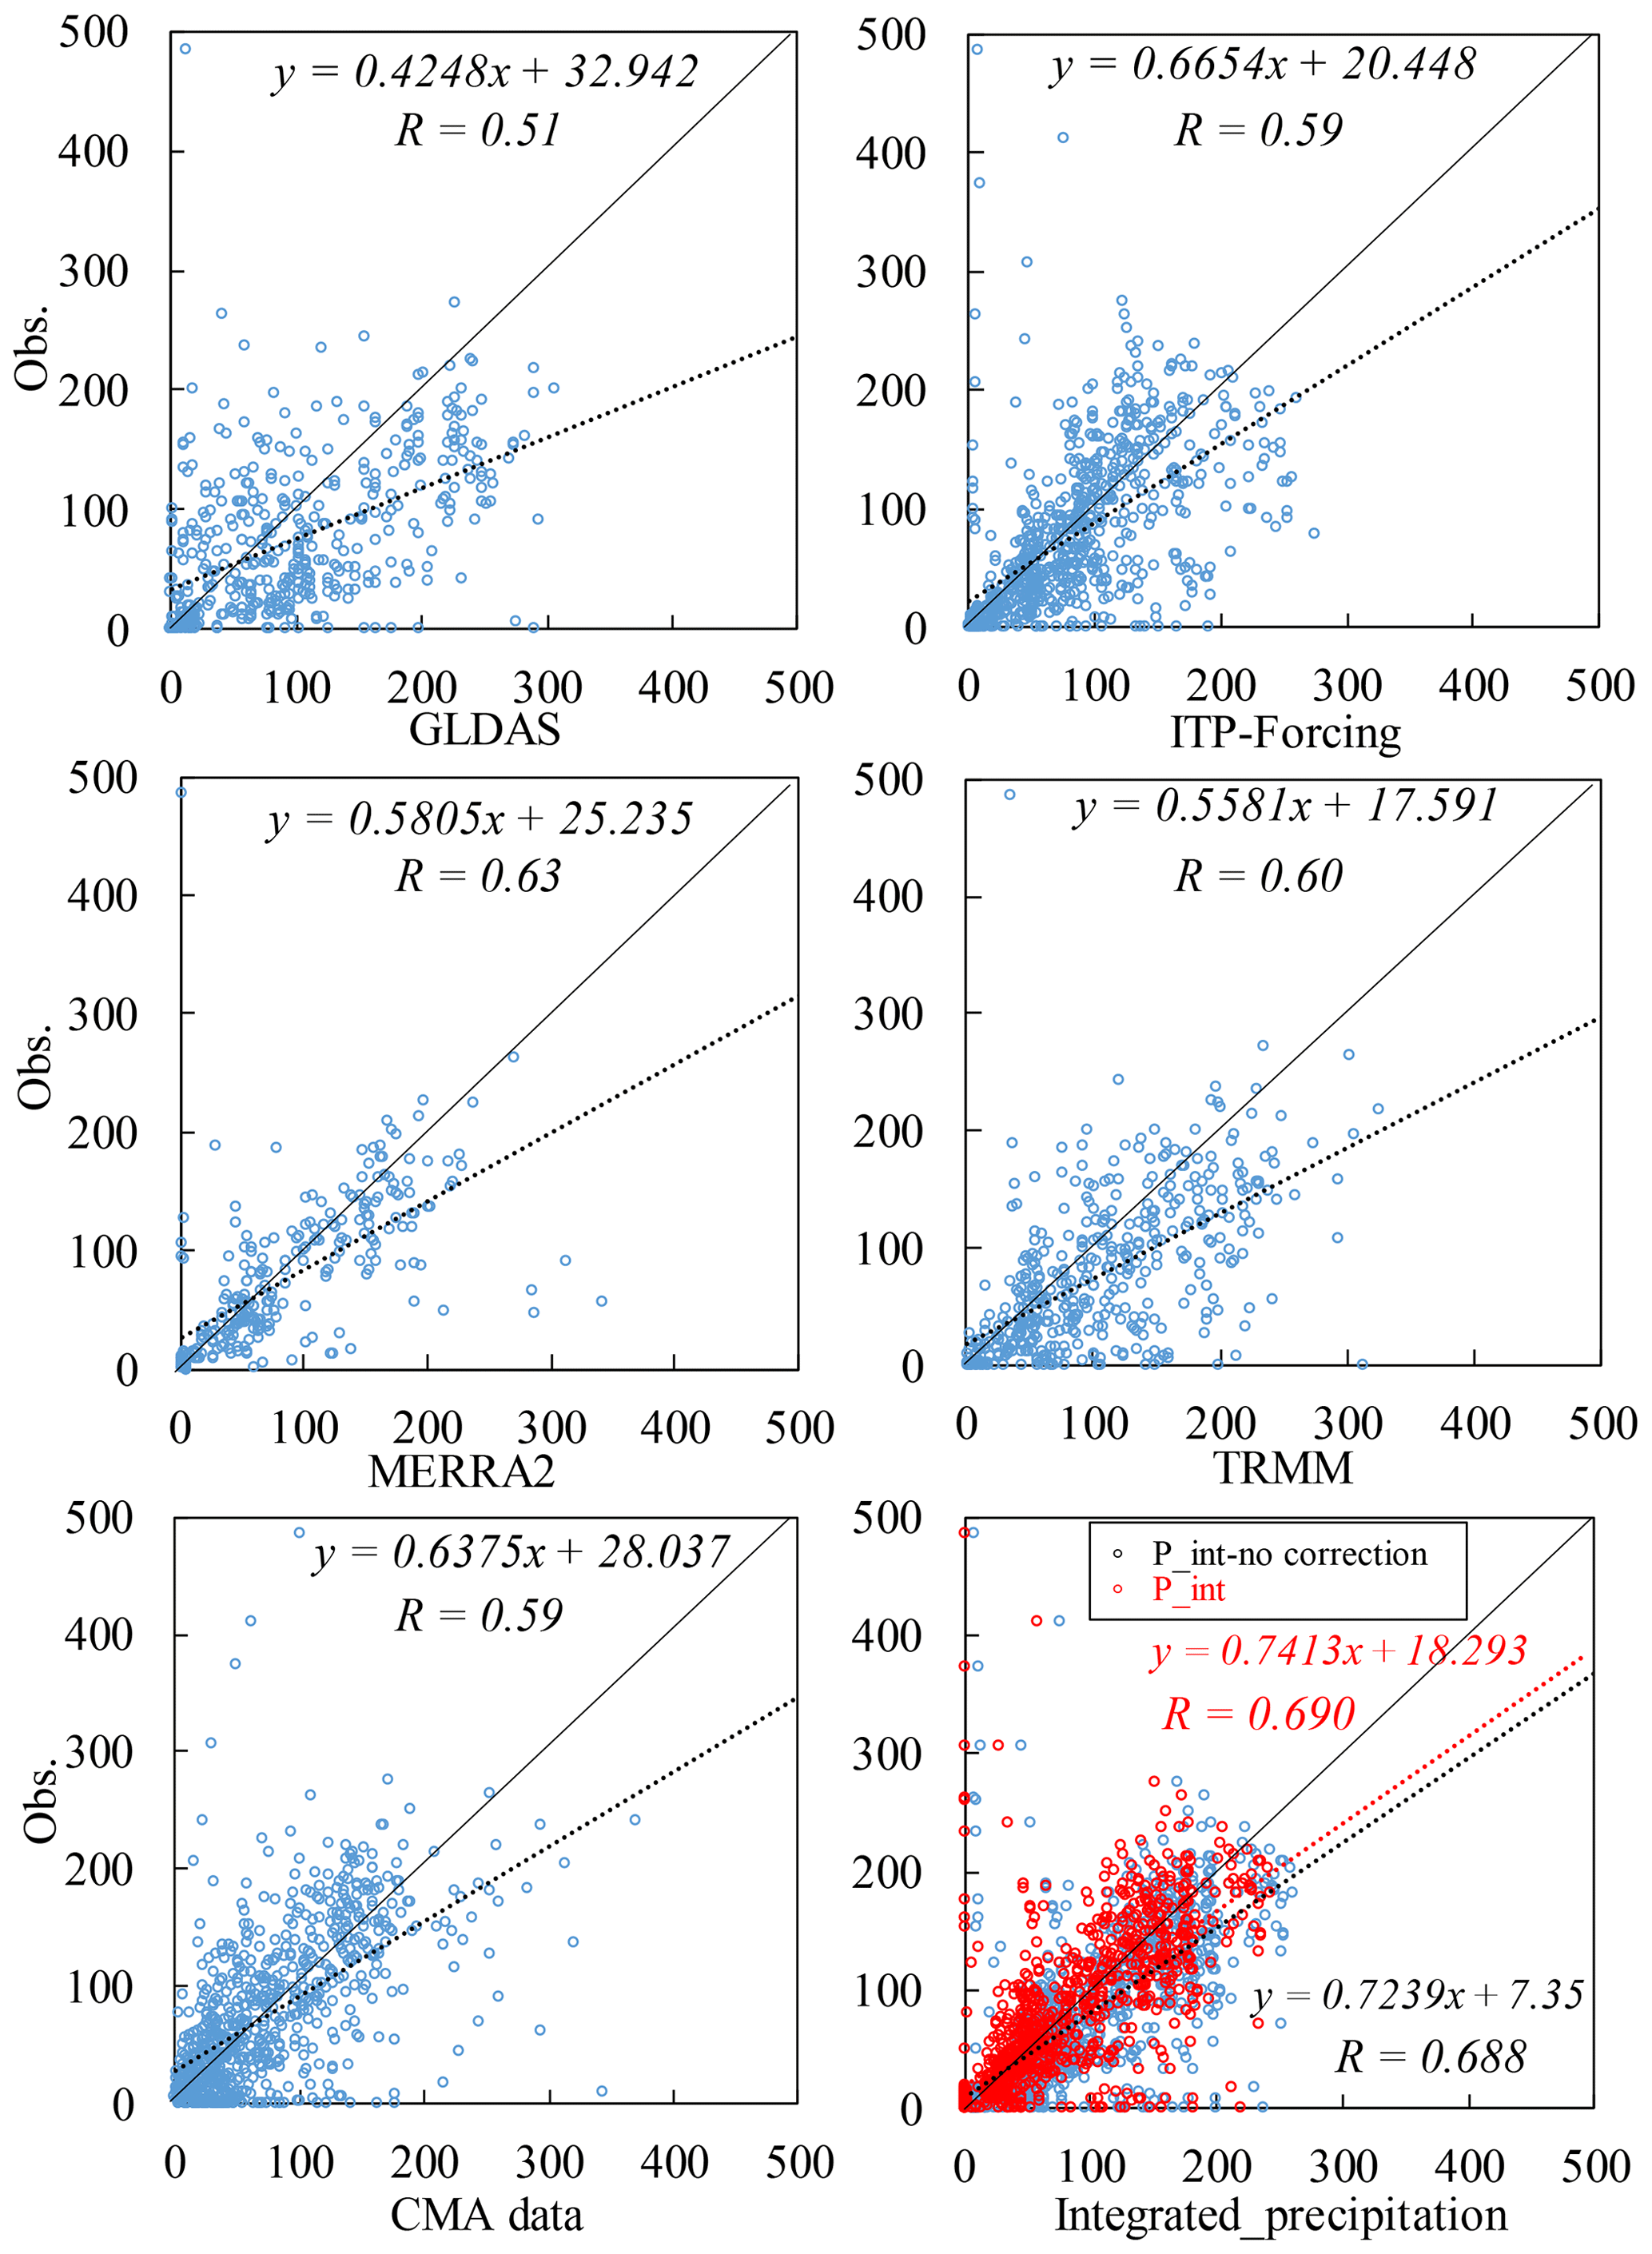
Figures 6 and 7 compare the accuracy of monthly rainfall from different products at the grid scale. Due to the coarse spatial resolution of MERRA2 (), there are fewer product–gauge data pairings available for evaluation. All the products show similar correlation relationships with the observations, with most rain gauges overestimating monthly precipitation (Fig. 7). The highest correlation coefficient is 0.63 (MERRA2), and the lowest is 0.51 (GLDAS). The PDFs, however, show different characteristics (Fig. 6). The CMA data are more consistent with the gauge data, while GLDAS and TRMM exhibit clear overestimations. As for ITP-Forcing, its precipitation is more concentrated on the average value, as indicated by the narrow curve.
3.2 Integration of precipitation products and validation of P_int
3.2.1 Integration of precipitation products and validation against different time series
Figure 3 presents the spatial distribution of annual and seasonal precipitation estimated by our integrated dataset, which shows a declining trend from the southeast to northwest. Figure 5 then compares the monthly and annual precipitation calculated from our integrated dataset with the satellite and reanalysis products. As discussed in Sect. 2.3, we interpolated all the products into a spatial resolution of 5 km using the IDW method and calculated them at a temporal resolution of 3 h. Comparing different weights for the anomalies mentioned in Eq. (2), we finally adopted the same weight for each product, and the sum of the weights is 1 ( from 1981 to 1997; w=0.25 from 1998 to 2007; w=0.2 from 2008 to 2016) to develop the new product. We made the integrated precipitation data using equal weights essentially according to the number of available precipitation products at different time periods (Table 1). Then we corrected the PDF of the newly integrated data based on the rain gauge observations (Fig. 6).
After P_int was derived, we first validated its performance against short time series (Fig. 8). P_int shows optimal performance in detecting daily precipitation, with correlation coefficients of 0.43 in 2014 and 0.55 in 2016. In 2014, the average bias is 0.20 mm, and the root mean square error (RMSE) is 4.18 mm. P_int successfully captures the daily variation in precipitation except for late September and early October. For 2016, the average bias and RMSE are −0.006 and 2.62 mm, respectively, much better than those for 2014.
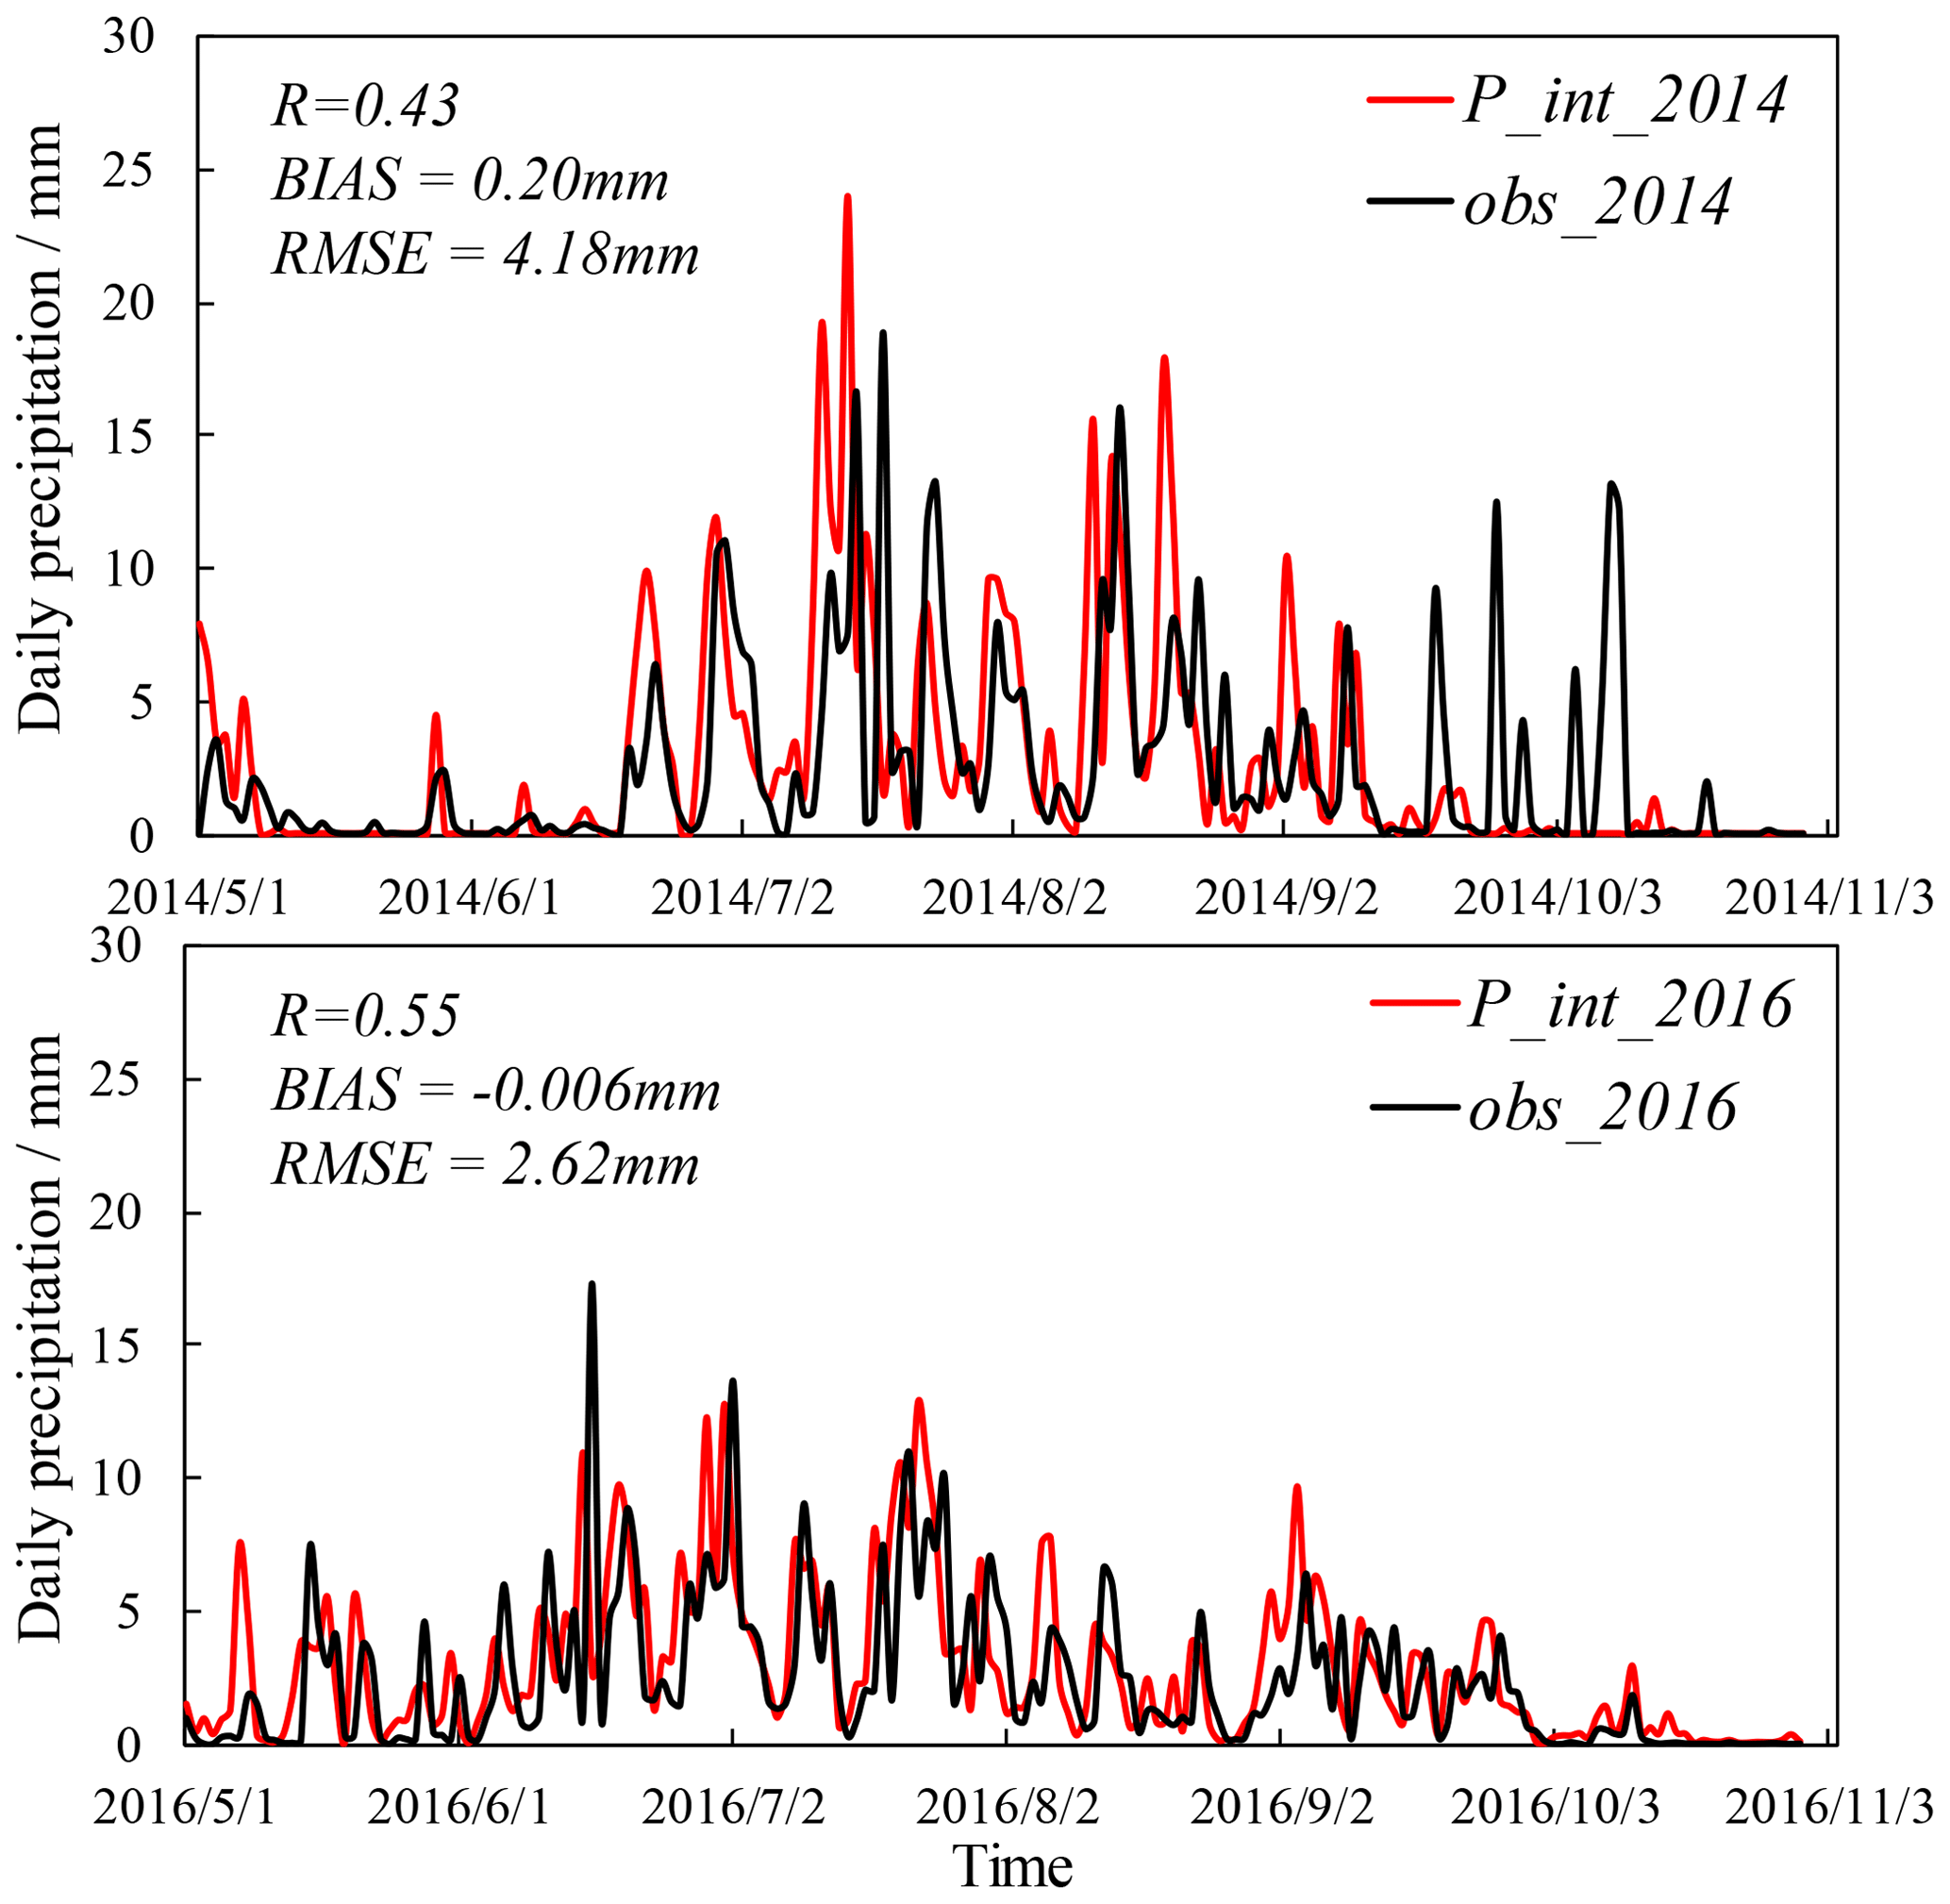
Figure 8A validation of P_int against short time series by comparing with daily gauge-averaged precipitation from May to October in 2014 and 2016.
We then check the spatial distribution of P_int from May to October in 2014 and 2016 (Fig. 9). Every rain gauge is compared with its corresponding grid in P_int to explore the spatial heterogeneity. P_int well reproduces the precipitation pattern described by less rain in the upstream (western) regions and more rain in the downstream (eastern) regions. Meanwhile, abundant rainfall occurs in summer, particularly for July.
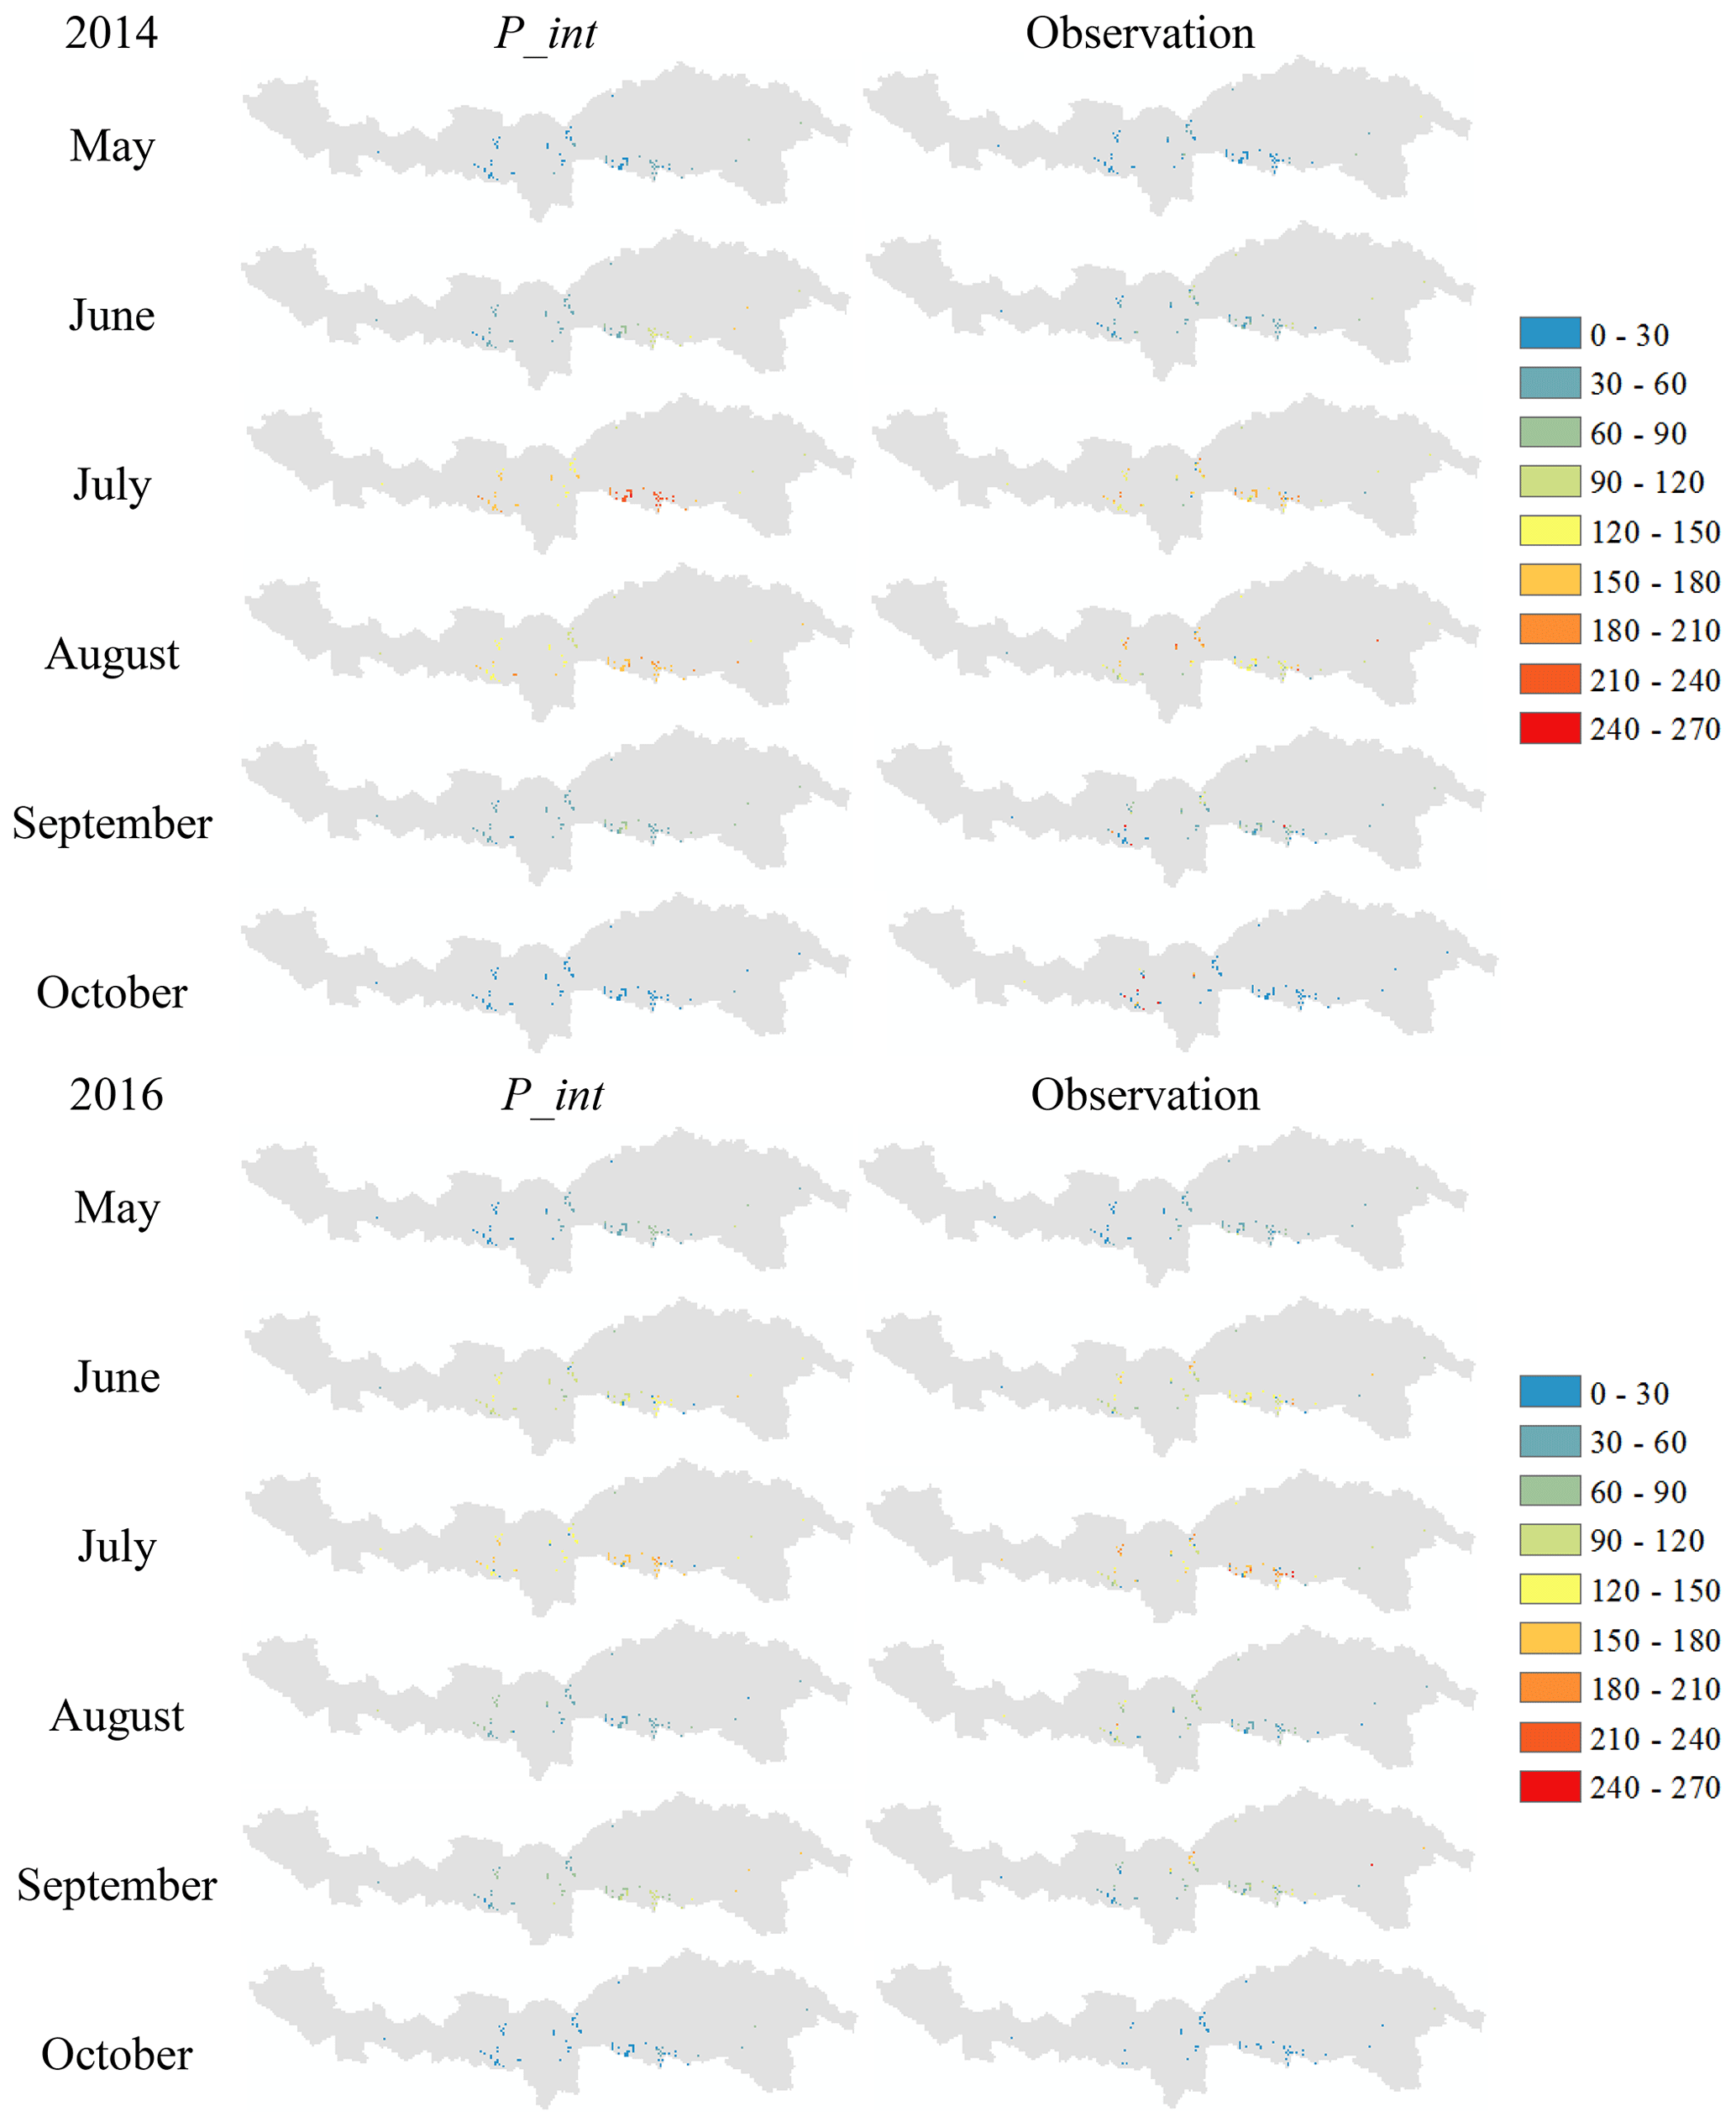
Figure 9A validation of P_int (mm) against short time series: spatial distribution of the observations and corresponding grids in P_int from May to October in 2014 and 2016.
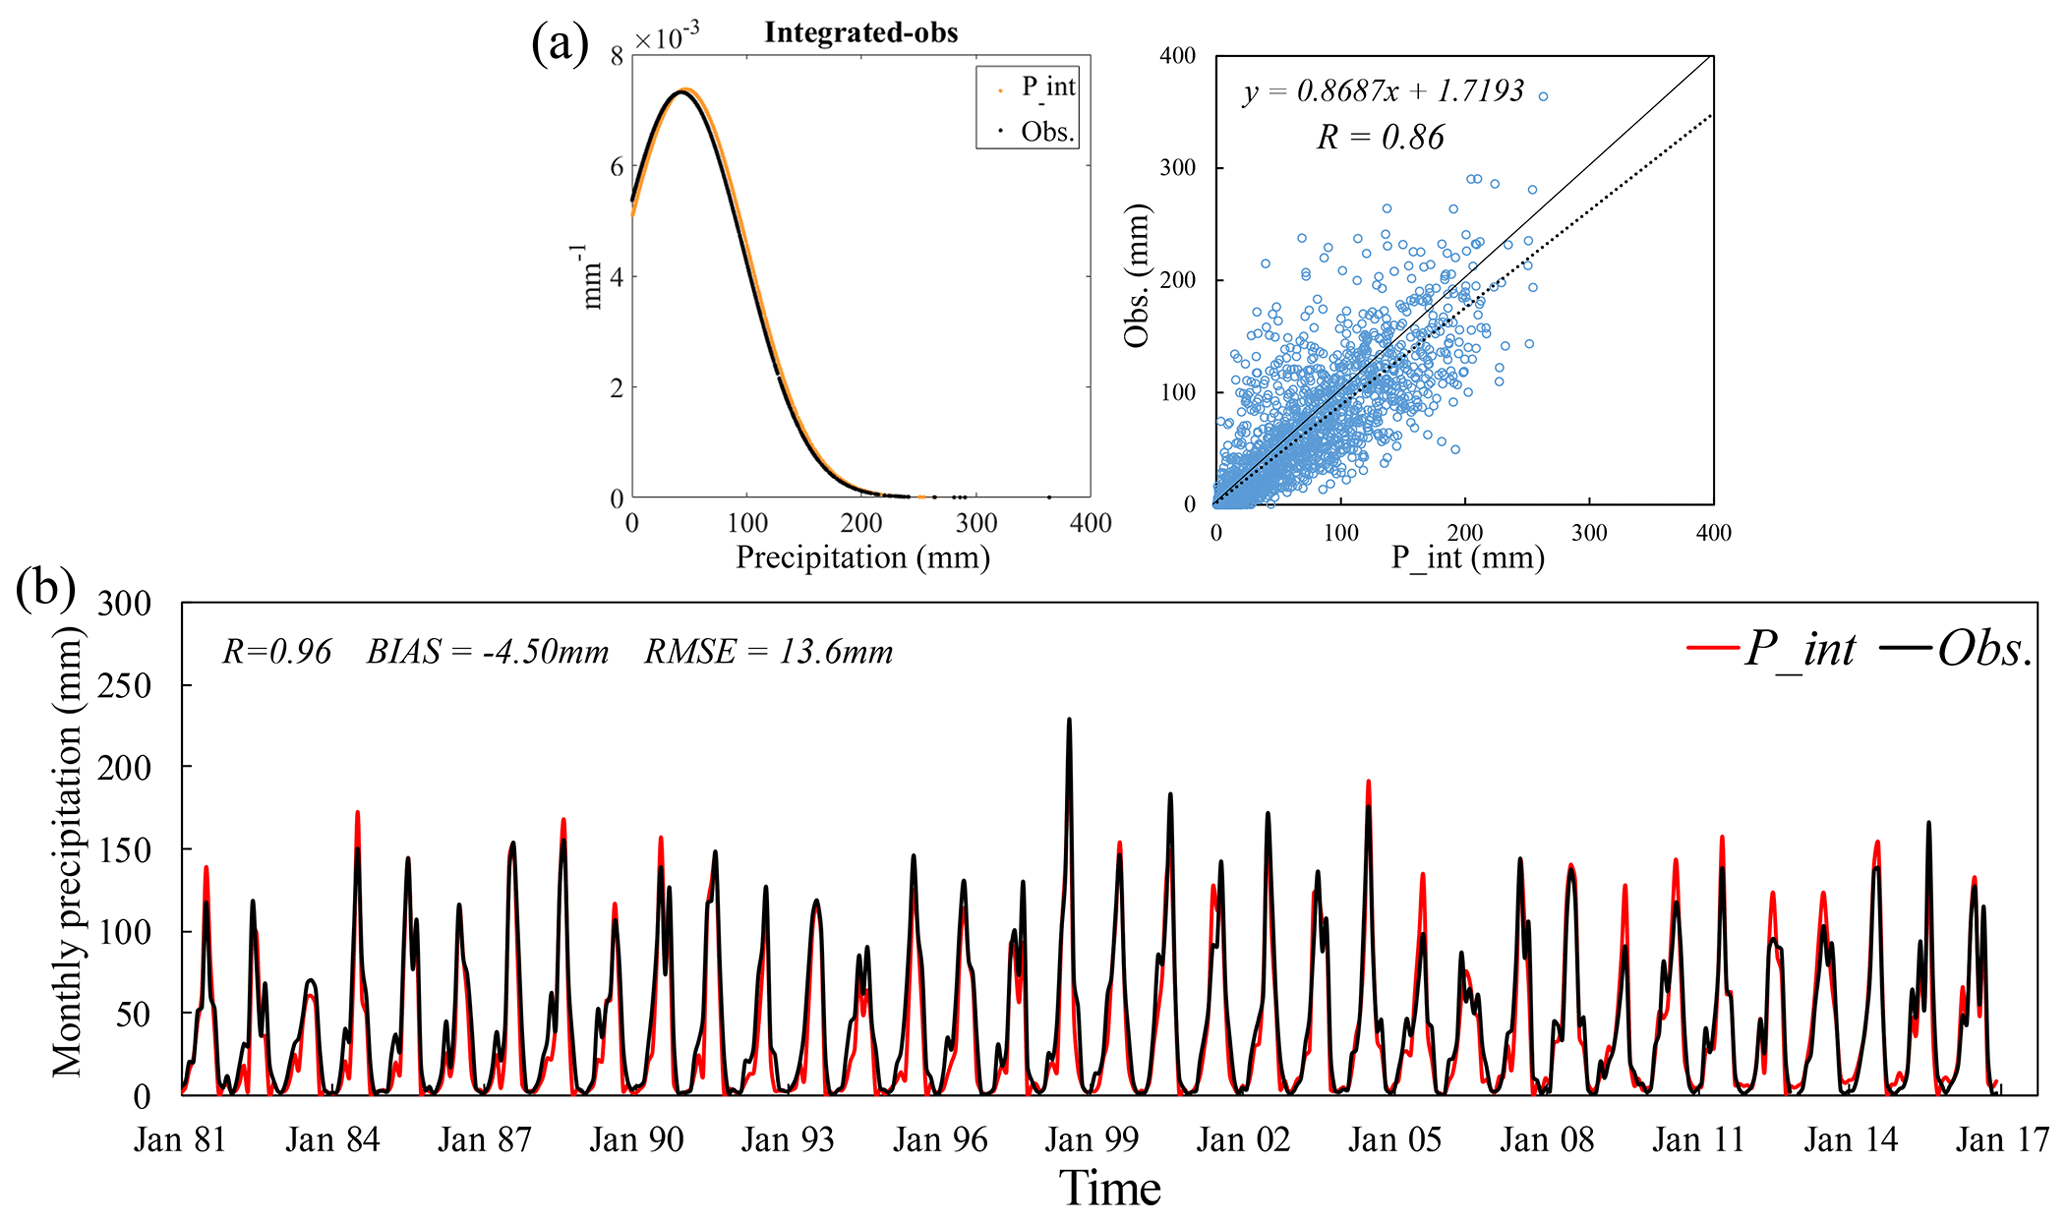
Figure 10A validation of P_int against a long time series: (a) PDF and scatterplots for monthly precipitation at nine CMA stations, (b) station-averaged monthly precipitation from 1981 to 2016.
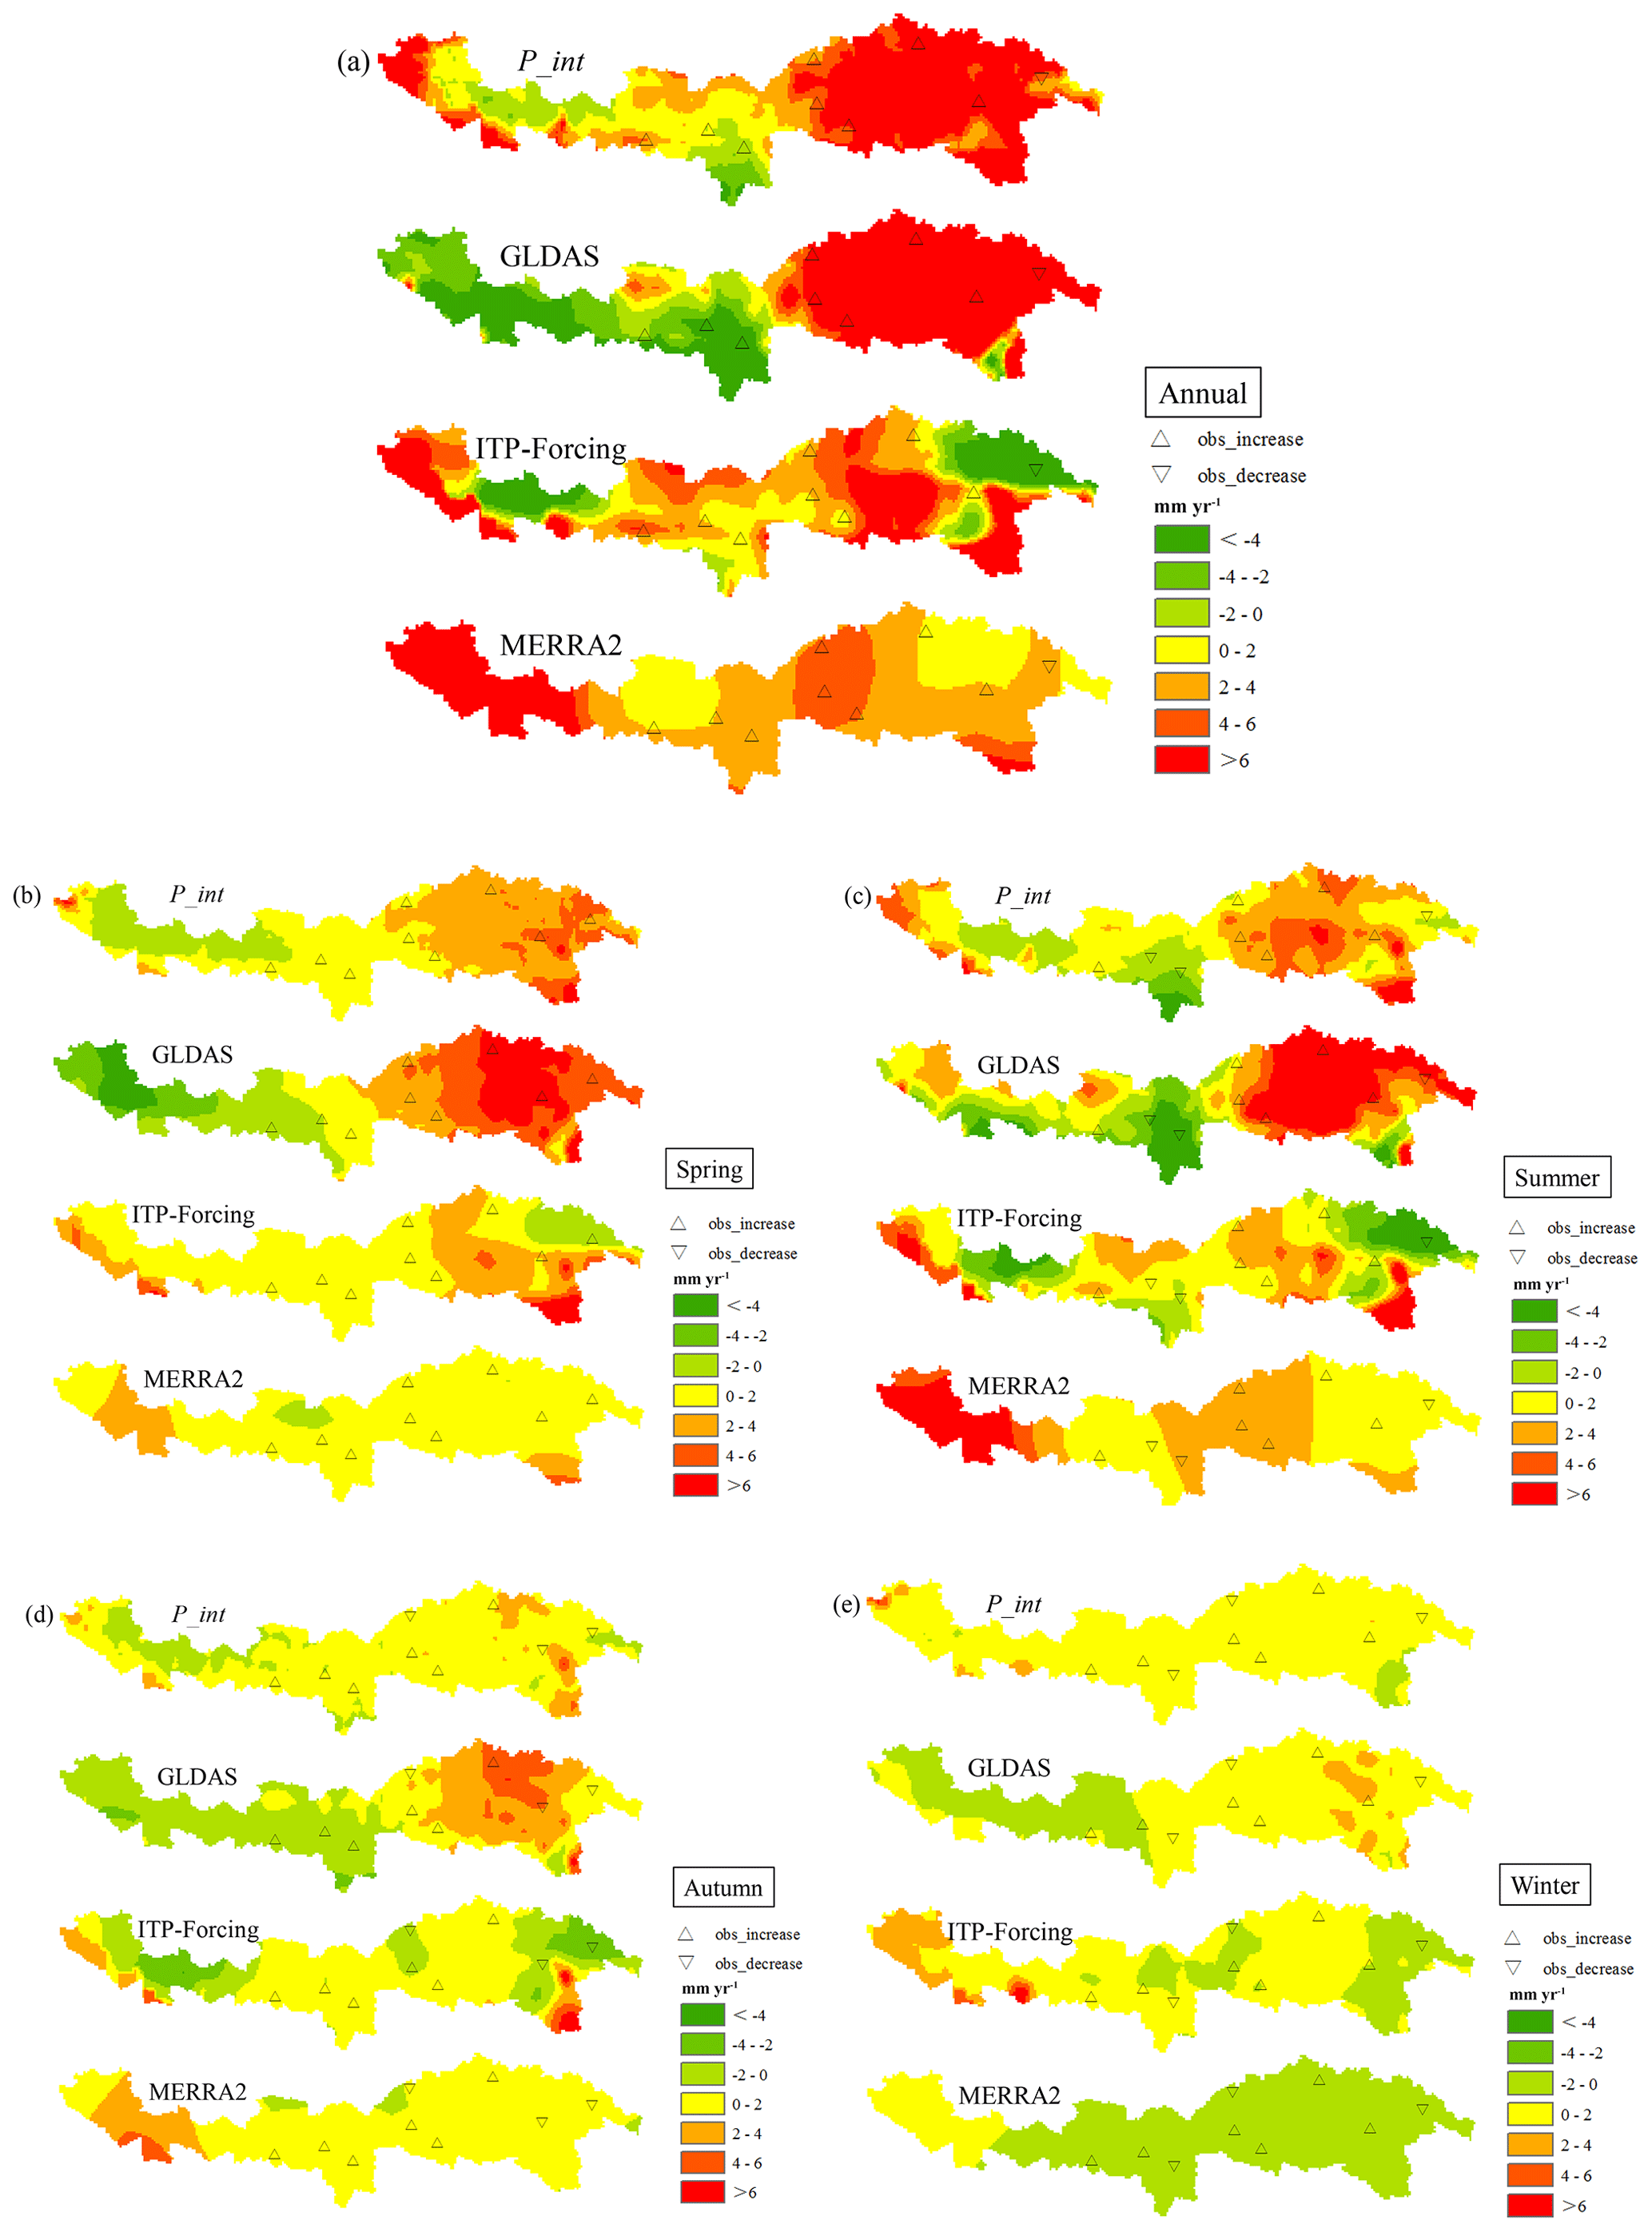
Figure 11A trend analysis of the annual and seasonal precipitation (a annual, b spring, c summer, d autumn, e winter) over 36 years (1981–2016) between P_int, GLDAS, ITP-Forcing, and MERRA2. The triangles represent the observed trend of the corresponding meteorological stations.
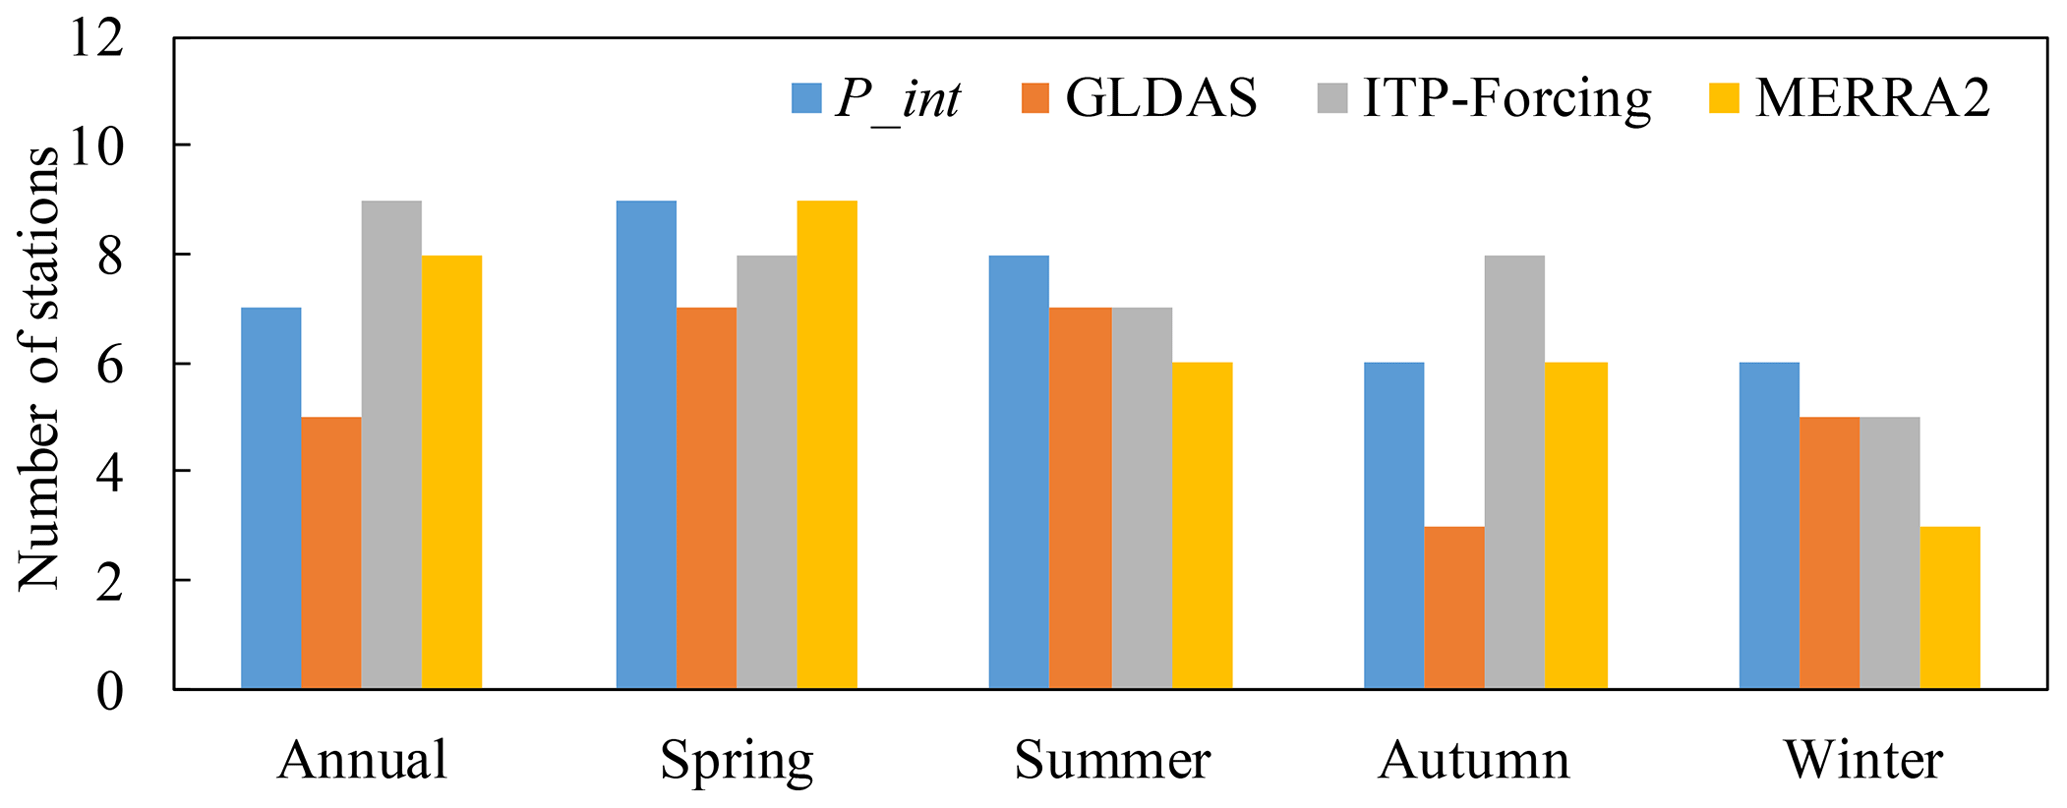
Figure 12The number of meteorological stations (total of nine) which present the same trends as the different precipitation products, according to Fig. 11.
Building on this, further validation was undertaken against a long time series. We chose the average monthly precipitation from the nine meteorological stations as the evaluation standard against which to assess P_int (Fig. 10). The PDF of P_int is consistent with that of the station data, which indicates that the mean value and standard deviation of P_int are much closer to the observed value (Fig. 10a). Similarly to the short time series, the average bias (−4.50 mm) and the RMSE (13.6 mm), especially with respect to the correlation coefficient (0.96), prove that the P_int is applicable and reliable.
3.2.2 Trend and extreme event analysis compared across different precipitation products
The trend analysis (Fig. 11) over 36 years indicates that there are different patterns of precipitation in different seasons and different regions. In summer, there are more complicated trends as the variations between upstream and downstream differ greatly. In contrast, trends of winter precipitation values over most of the study region vary by merely ±2 mm yr−1, illustrating that precipitation in winter generally remains unchanged or experiences minimal change. To find if P_int is able to reflect the true varying trend, we added a comparison between meteorological stations (triangles in Fig. 11 and their direction represent the true trend) and precipitation products. For observed annual precipitation, all the stations give an insignificantly increasing trend, except for Bomi station, which is located in the easternmost part of the study region. For seasonal precipitation, different stations present different patterns. As a result, P_int appears to reflect the changing pattern of more stations than any other product, with the exception of the ITP-Forcing dataset on an annual timescale or over autumn (Fig. 12).
We notice that there is an increasing trend in annual precipitation almost in the whole basin for P_int; only precipitation in the midstream area near the Himalayas and a small part of the upstream region are decreasing. Moreover, the majority of the increased precipitation in the downstream regions occurs over spring and summer, with only slight changes found in autumn and winter.
After the volume, the spatial distribution, and the trend of P_int at different timescales were completely verified, we continued to inspect whether P_int could capture the extreme events from May to October in 2014 and 2016 according to the rain gauge data (Fig. 13). There are 27 d in total (19 d in 2014 and 8 d in 2016) when extremely high daily precipitation occurred. All the products are comparable with each other in underestimating the frequency of extreme events. A total of 9 d are identified out of the P_int data, lesser only to the number of days detected by ITP-Forcing (11 d).
3.2.3 Evaluation of daily discharges simulated by different precipitation products
All the comparison and validation steps undertaken above support the accuracy and reliability of our integrated dataset. Furthermore, Fig. 14 indicates the superior suitability and application of P_int in hydrological simulation and investigation, with an RB of −5.94 % and an NSE of 0.643 (the highest). We simulate the daily discharge of Nuxia station using the various precipitation datasets as the input with the same initial conditions and physical parameters. All products overestimate the daily discharge, except for P_int (−5.94 %) and MERRA2 (−2.24 %). In terms of NSE, P_int (0.643), ITP-Forcing (0.543), and MERRA2 (0.544) are higher than others, explaining their better simulation performance. GLDAS and TRMM offer the worst performance in discharge simulation, which is consistent with their overestimation of precipitation in summer (Fig. 5). This indicates that these datasets should be corrected when undertaking hydrological research over the upper Brahmaputra.
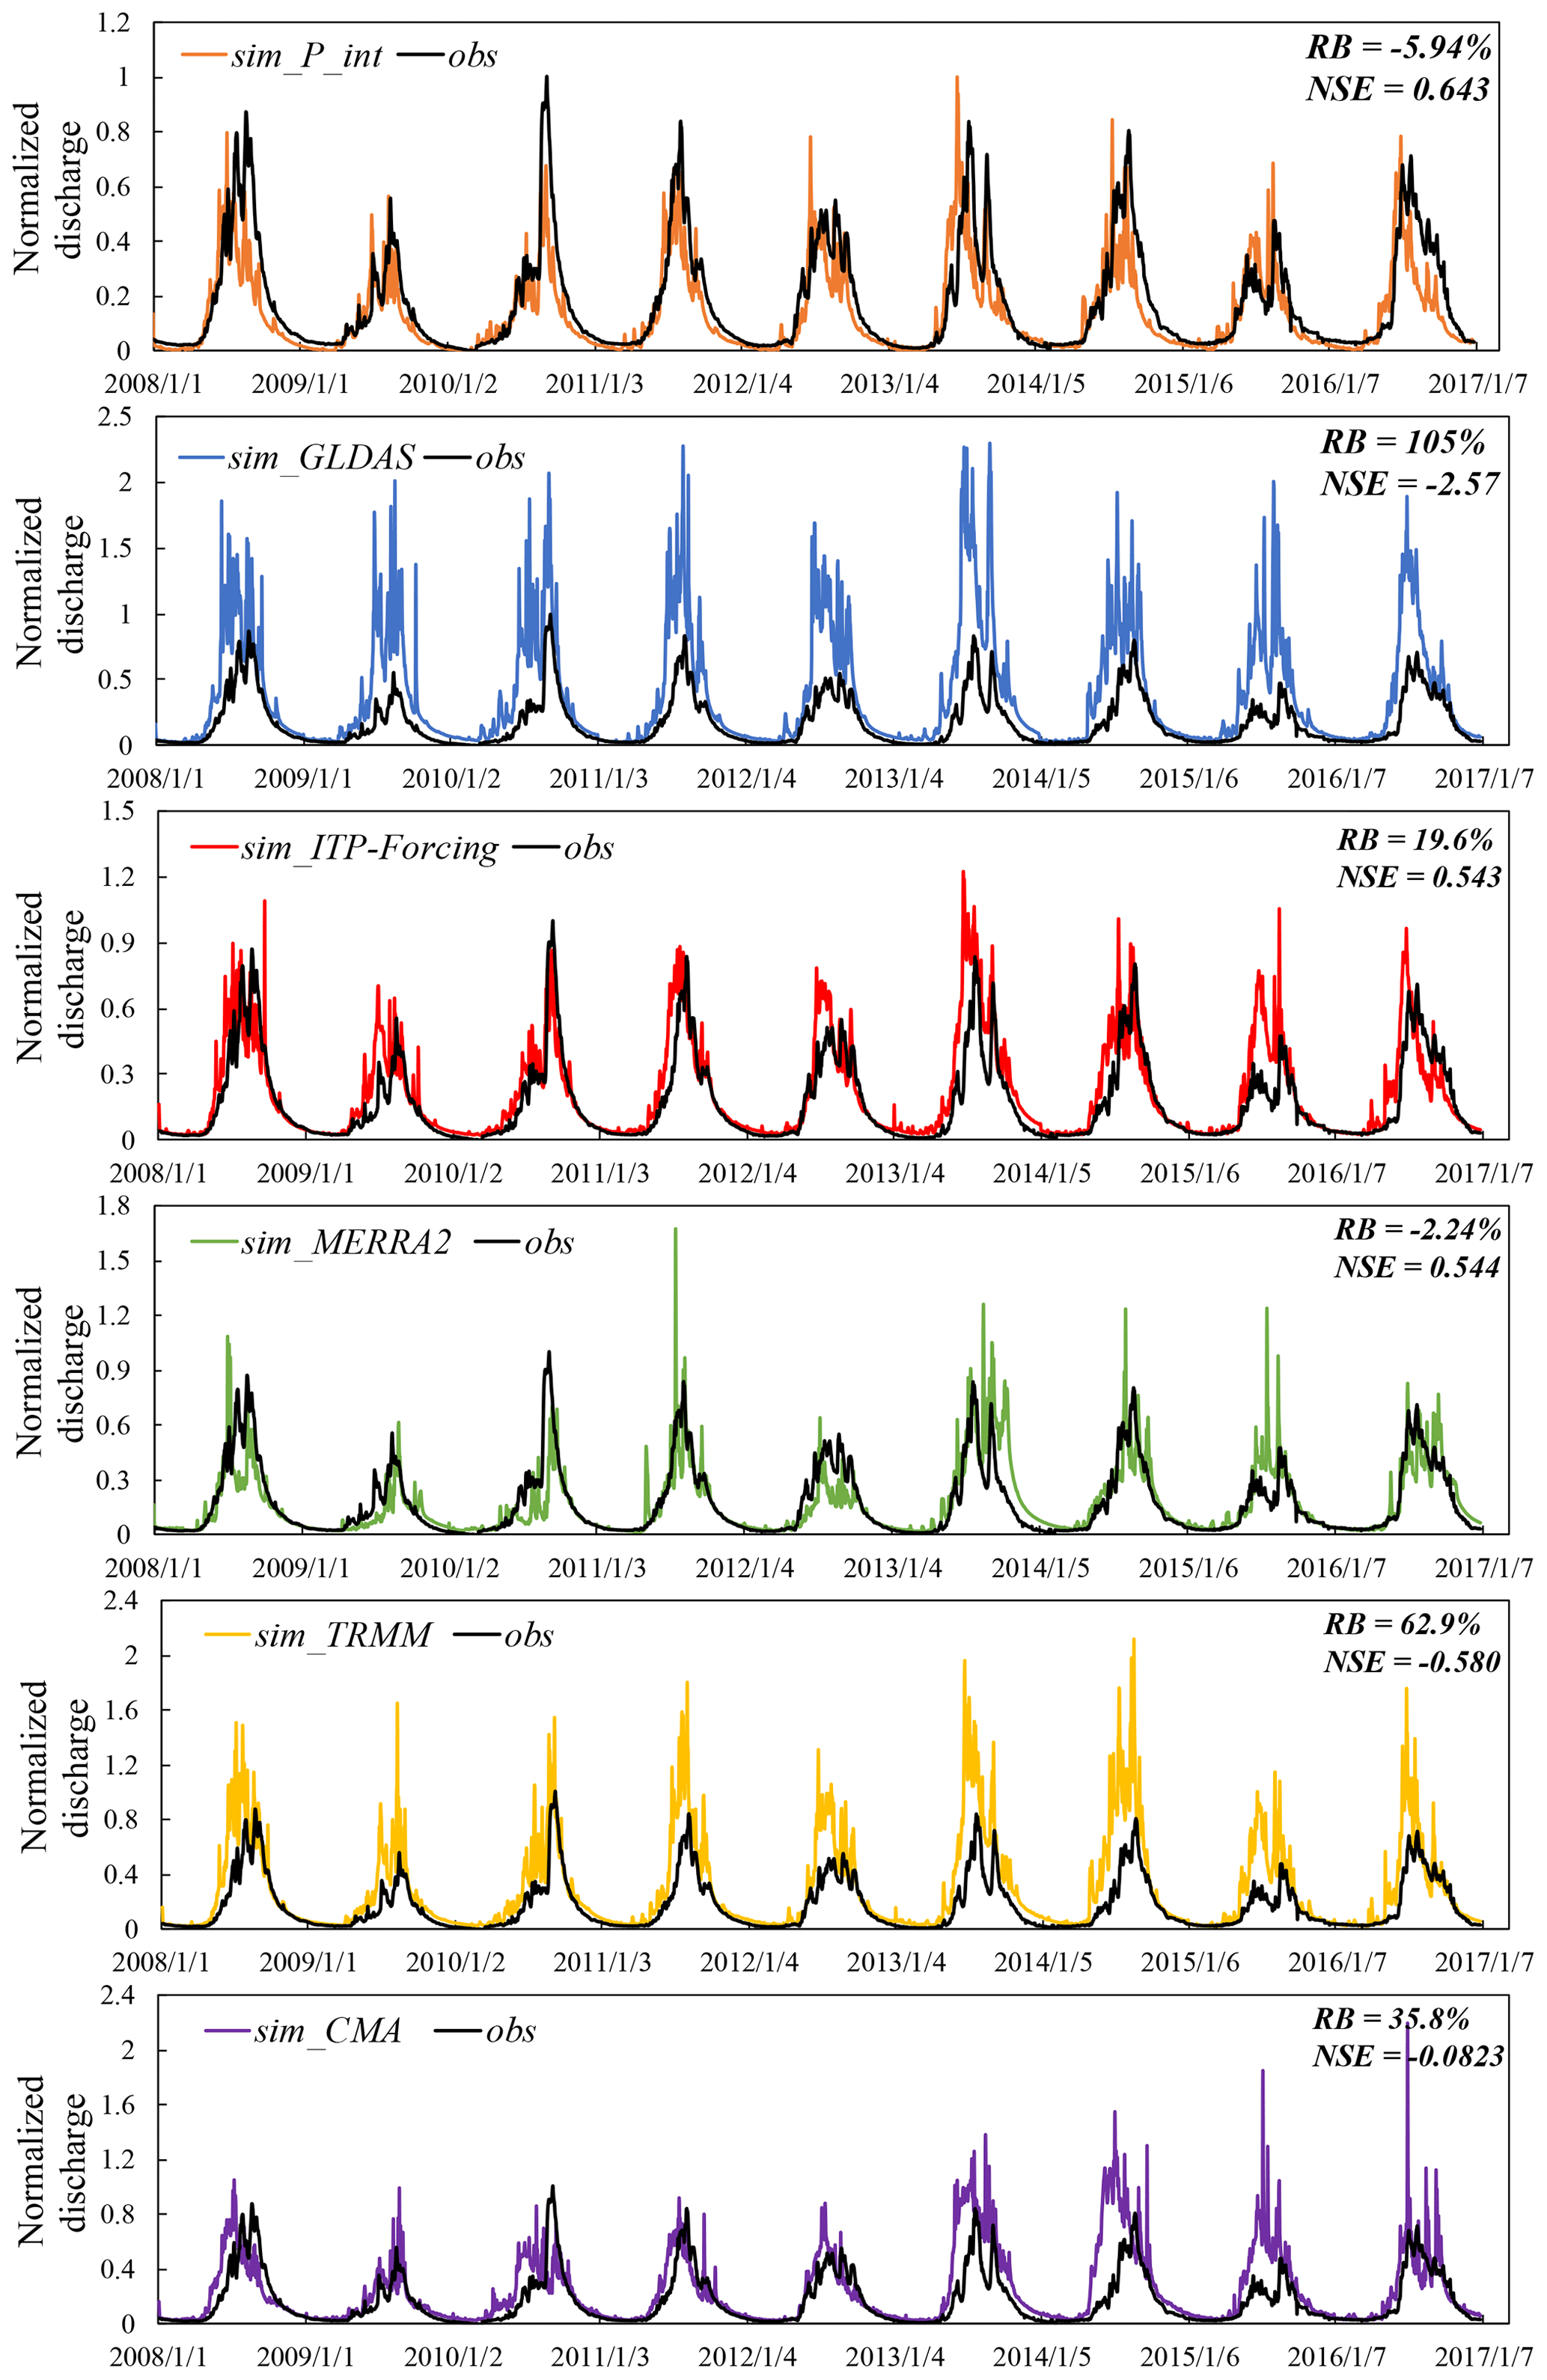
Figure 14An evaluation of simulated daily discharge at Nuxia station from 2008 to 2016 forced by different precipitation products. All the discharge values have been normalized.
This high-spatiotemporal-resolution (5 km, 3 h) precipitation dataset over the upper Brahmaputra River basin from 1981 to 2016 is freely available at https://doi.org/10.5281/zenodo.3711155 (Wang et al., 2020), which can be downloaded in TXT format.
In order to acquire suitable and accurate precipitation datasets which are helpful in hydrology, meteorology, and other scientific research over the upper Brahmaputra, we produced a new precipitation product by integrating gauge, satellite, and reanalysis precipitation datasets to reduce the uncertainties associated with a single product and limitation of few observation stations. Our integrated dataset performs better than the input datasets in estimating daily and monthly precipitation, describing the spatial heterogeneity, capturing variation trends and extreme events, and simulating river discharges. Furthermore, it is successful in reproducing daily precipitation variation, with smaller average biases (0.2 mm in 2014 and −0.006 mm in 2016) and RMSE values (4.18 mm in 2014 and 2.62 mm in 2016). Monthly precipitation shows higher correlation coefficients with the in situ data for various time series (0.69 for all the rain gauges in the warm months of 2014 and 2016; 0.86 for the nine meteorological stations between 1981 and 2016). This high spatiotemporal resolution assures us that we can use this new dataset to explore more detailed physical processes and further understand the impacts of climate change on the water resources of the upper Brahmaputra River basin, and we are confident that our precipitation dataset will greatly assist future research in this basin.
With this in mind, we note some aspects of this study that deserve further consideration. The effect of altitude on precipitation has not been taken into account in the development of this dataset. The 166 rain gauges used in this paper are all located at elevations above 3500 m, except for several eastern gauges. Generally, these gauges were installed in relatively plain-like areas, which may lead to large uncertainty in estimating precipitation (rain or snow) in high mountains, especially at daily or finer timescales (Ahrens, 2006; Haiden and Pistotnik, 2009). Due to the orographic effect on precipitation rates, this limitation can be even more severe in mountainous regions and transition zones between low and high altitudes, which will result in underestimates of the actual basin-wide precipitation (Anders et al., 2006; Hashemi et al., 2020). Increasing the density and the distribution area of observational stations can directly weaken these altitude effects. We also note uncertainties that may arise from the regridding of the remotely sensed datasets in order to pair with the in situ gauge data. In addition, the assumption of normal distribution when analyzing extremely high daily precipitation can also lead to uncertainty. Generally, the non-normal (skewed) distribution of precipitation is caused by the zero-rainfall events at single sites (Kumar et al., 2009; Semenov, 2008; Sloughter et al., 2007). An associated problem is the quantity and reliability of the data used to fit the distribution. If different probability distributions are used to describe the observed time series of daily precipitation, then different extreme values may be obtained (Angelidis et al., 2012). This study provides a foundation from which further studies can be carried out to explore these aspects in more detail.
In the future, more studies are needed to validate the method and data in regions with complex topography and climatic conditions and to further improve the retrieval algorithm. This will greatly benefit hydrological applications, especially in areas with sparse and irregular observation networks. Furthermore, no products used in this study accurately represent extreme precipitation events; thus, it is necessary to improve the ability of all of these products to capture extreme events.
All the authors contributed extensively to the work presented in this paper. WL conceived and designed the research. WY and WL developed the approach. WY downloaded the datasets and performed most of the computation and analysis work. WY drafted and WL coordinated the work on the paper. WL, LX, and ZJ contributed to the revising of the paper. WL, LX, and ZJ acquired project funds. HZ provided the rain gauge data of MWR.
The authors declare that they have no conflict of interest.
The Shuttle Radar Topographic Mission (SRTM) Digital Elevation Model (DEM), with a ground resolution of 30 m, is available from the United States Geological Survey's (USGS) web portal (https://earthexplorer.usgs.gov, last access: 30 January 2020). We would also like to thank NASA for different precipitation data, including GLDAS, MERRA2, and TRMM (https://disc.gsfc.nasa.gov/, last access: 10 July 2020). Lastly, we are pleased to acknowledge the anonymous reviewers' and editor's valuable comments and suggestions to improve this paper.
This research has been supported by the National Natural Science Foundation of China (grant no. 91747201) and the Strategic Priority Research Program of Chinese Academy of Sciences (grant no. XDA20060202). Jing Zhou was supported by NSFC (grant no. 41771089).
This paper was edited by Ge Peng and reviewed by two anonymous referees.
Ahrens, B.: Distance in spatial interpolation of daily rain gauge data, Hydrol. Earth Syst. Sci., 10, 197–208, https://doi.org/10.5194/hess-10-197-2006, 2006.
Ali, S., Tong, D., Xu, Z., Henchiri, M., Wilson, K., Shi, S., and Zhang, J.: Characterization of drought monitoring events through MODIS- and TRMM-based DSI and TVDI over south Asia during 2001–2017, Environ. Sci. Pollut. R., 26, 33568–33581, 2019.
Anders, A. M., Roe, G. H., Hallet, B., Montgomery, D. R., and Putkonen, J.: Spatial patterns of precipitation and topography in the himalaya, Geol. Soc. Am. Spec. Pap., 398, 39–53, 2006.
Angelidis, P., Maris, F., Kotsovinos, N., and Hrissanthou, V.: Computation of Drought Index SPI with Alternative Distribution Functions, Water Resour. Manag., 26, 2453–2473, 2012.
Bai, P. and Liu, X.: Evaluation of Five Satellite-Based Precipitation Products in Two Gauge-Scarce Basins on the Tibetan Plateau, Remote Sensing, 10, 1316, https://doi.org/10.3390/rs10081316, 2018.
Bibi, S., Wang, L., Li, X., Zhang, X., and Chen, D.: Response of groundwater storage and recharge in the Qaidam Basin (Tibetan Plateau) to climate variations from 2002 to 2016, J. Geophys. Res.-Atmos., 124, 9918–9934, 2019.
Chen, Y., Yang, K., He, J., Qin, J., Shi, J., Du, J., and He, Q.: Improving land surface temperature modeling for dry land of China, J. Geophys. Res.-Atmos., 116, D20104, https://doi.org/10.1029/2011JD015921, 2011.
Chen, Y., Yang, K., Qin, J., Zhao, L., Tang, W., and Han, M.: Evaluation of AMSR-E retrievals and GLDAS simulations against observations of a soil moisture network on the central Tibetan Plateau, J. Geophys. Res.-Atmos., 118, 4466–4475, 2013.
Cuo, L., Li, N., Liu, Z., Ding, J., Liang, L., Zhang, Y., and Gong, T.: Warming and human activities induced changes in the Yarlung Tsangpo basin of the Tibetan plateau and their influences on streamflow, J. Hydrol., 25, 100625, https://doi.org/10.1016/j.ejrh.2019.100625, 2019.
Deng, M., Meng, X., Li, Z., Lyv, Y., Lei, H., Zhao, L., Zhao, S., Ge, J., and Jing, H.: Responses of soil moisture to regional climate change over the Three Rivers Source Region on the Tibetan plateau, Int. J. Climatol., 40, 2403–2417, https://doi.org/10.1002/joc.6341, 2019.
Fang, J., Yang, W., Luan, Y., Du, J., Lin, A., and Zhao, L.: Evaluation of the TRMM 3B42 and GPM IMERG products for extreme precipitation analysis over China, Atmos. Res., 223, 24–38, 2019.
Ferraro, R. R., Weng, F., Grody, N. C., and Zhao, L.: Precipitation characteristics over land from the NOAA-15 AMSU sensor, Geophys. Res. Lett., 27, 2669–2672, 2000.
Funk, C., Peterson, P., Landsfeld, M., Pedreros, D., Verdin, J., Shukla, S., Husak, G., Rowland, J., Harrison, L., Hoell, A., and Michaelsen, J.: The climate hazards infrared precipitation with stations-a new environmental record for monitoring extremes, Scientific Data, 2, 1–21, 2015.
Gelaro, R., McCarty, W., Suárez, M. J., Todling, R., Molod, A., Takacs, L., Randles, C.A., Darmenova, A., Bosilovicha, M. G., Reichlea, R., Wargan, K., Coya, L., Cullather, R., Draper, C., Akella, S., Buchard, V., Conaty, A., Silva, A. M., Gu, W., Kima, G.-K., Koster, R., Lucchesi, R., Merkova, D., Nielsen, J. E., Partyka, G., Pawsona, S., Putman, W., Rienecker, M., Schubert, S. D., Sienkiewicz, M., and Zhao, B.: The modern-era retrospective analysis for research and applications, version 2 (MERRA-2), J. Climate, 30, 5419–5454, 2017.
Guo, H., Chen, S., Bao, A., Behrangi, A., Hong, Y., Ndayisaba, F., Hu, J., and Stepanian, P. M.: Early assessment of integrated multi-satellite retrievals for global precipitation measurement over China, Atmos. Res., 176, 121–133, 2016.
Haiden, T. and Pistotnik, G.: Intensity-dependent parameterization of elevation effects in precipitation analysis, Adv. Geosci., 20, 33–38, https://doi.org/10.5194/adgeo-20-33-2009, 2009.
Hashemi, H., Fayne, J. V., Lakshmi, V., and Huffman, G. J.: Very high resolution, altitude-corrected, TMPA-based monthly satellite precipitation product over the CONUS, Scientific Data, 7, 74, https://doi.org/10.1038/s41597-020-0411-0, 2020.
He, J.: Development of surface meteorological dataset of China with high temporal and spatial resolution, Master dissertation, Institute of Tibetan Plateau Research, Chinese Academy of Science, 2010.
Huffman, G. J., Adler, R. F., Rudolf, B., Schneider, U., and Keehn, P. R.: Global precipitation estimates based on a technique for combining satellite-based estimates, rain gauge analysis, and NWP model precipitation information, J. Climate, 8, 1284–1295, 1995.
Huffman, G. J., Bolvin, D. T., Nelkin, E. J., Wolff, D. B., Adler, R. F., Gu, G., Hong, Y., Bowman, K. P., and Stocker, E. F.: The TRMM multisatellite precipitation analysis (TMPA): Quasi-global, multiyear, combined-sensor precipitation estimates at fine scales, J. Hydrometeorol., 8, 38–55, 2007.
Joyce, R. J., Janowiak, J. E., Arkin, P. A., and Xie, P.: CMORPH: A method that produces global precipitation estimates from passive microwave and infrared data at high spatial and temporal resolution, J. Hydrometeorol., 5, 487–503, 2004.
Kato, H., Rodell, M., Beyrich, F., Cleugh, H., Gorsel, E. V., Liu, H., and Meyers, T. P.: Sensitivity of land surface simulations to model physics, land characteristics, and forcings, at four CEOP sites, J. Meteorol. Soc. Jpn., 85, 187–204, 2007.
Kidd, C., Becker, A., Huffman, G. J., Muller, C. L., Joe, P., Skofronick-Jackson, G., and Kirschbaum, D. B.: So, how much of the Earth's surface is covered by rain gauges?, B. Am. Meteorol. Soc., 98, 69–78, 2017.
Kumar, M. N., Murthy, C. S., Sai, M. V., and Roy, P. S.: On the use of Standardized Precipitation Index (SPI) for drought intensity assessment, Meteorol. Appl., 16, 381–389, 2009.
Li, X., Long, D., Han, Z., Scanlon, B. R., Sun, Z., Han, P., and Hou, A.: Evapotranspiration Estimation for Tibetan Plateau Headwaters using Conjoint Terrestrial and Atmospheric Water Balances and Multisource Remote Sensing, Water Resour. Res., 55, 8608–8630, https://doi.org/10.1029/2019WR025196, 2019a.
Li, X., Long, D., Huang, Q., Han, P., Zhao, F., and Wada, Y.: High-temporal-resolution water level and storage change data sets for lakes on the Tibetan Plateau during 2000–2017 using multiple altimetric missions and Landsat-derived lake shoreline positions, Earth Syst. Sci. Data, 11, 1603–1627, https://doi.org/10.5194/essd-11-1603-2019, 2019b.
Li, Z., Yang, D., Gao, B., Jiao, Y., Hong, Y., and Xu, T.: Multiscale hydrologic applications of the latest satellite precipitation products in the Yangtze River Basin using a distributed hydrologic model, J. Hydrometeorol., 16, 407–426, 2015.
Liu, X. and Chen, B.: Climatic warming in the Tibetan Plateau during recent decades, Int. J. Climatol., 20, 1729–1742, 2000.
Lu, N., Trenberth, K. E., Qin, J., Yang, K., and Yao, L.: Detecting long-term trends in precipitable water over the Tibetan Plateau by synthesis of station and MODIS observations, J. Climate, 28, 1707–1722, 2015.
Ma, J., Ding, Y., Cheng, J. C. P., Jiang, F., and Wan, Z.: A temporal-spatial interpolation and extrapolation method based on geographic Long Short-Term Memory neural network for PM2.5, J. Clean. Prod., 237, 117729, https://doi.org/10.1016/j.jclepro.2019.117729, 2019.
Marquardt Collow, A. B., Bosilovich, M. G., and Koster, R. D.: Large-scale influences on summertime extreme precipitation in the northeastern United States, J. Hydrometeorol., 17, 3045–3061, 2016.
Mazzoleni, M., Brandimarte, L., and Amaranto, A.: Evaluating precipitation datasets for large-scale distributed hydrological modelling, J. Hydrol., 578, 124076, https://doi.org/10.1016/j.jhydrol.2019.124076, 2019.
Meng, J., Li, L., Hao, Z., Wang, J., and Shao, Q.: Suitability of TRMM satellite rainfall in driving a distributed hydrological model in the source region of Yellow River, J. Hydrol., 509, 320–332, 2014.
Miri, M., Masoudi, R., and Raziei, T.: Performance Evaluation of Three Satellites-Based Precipitation Data Sets Over Iran, J. Indian Soc. Remot., 47, 2073–2084, 2019.
Qi, W., Zhang, C., Fu, G., and Zhou H.: Global Land Data Assimilation System data assessment using a distributed biosphere hydrological model, J. Hydrol., 528, 652–667, 2015.
Qi, W., Zhang, C., Fu, G., Sweetapple, C., and Zhou, H.: Evaluation of global fine-resolution precipitation products and their uncertainty quantification in ensemble discharge simulations, Hydrol. Earth Syst. Sci., 20, 903–920, https://doi.org/10.5194/hess-20-903-2016, 2016.
Qi, W., Liu, J., and Chen, D.: Evaluations and improvements of GLDAS2.0 and GLDAS2.1 forcing data's applicability for basin scale hydrological simulations in the Tibetan Plateau, J. Geophys. Res.-Atmos., 123, 13128–13148, 2018.
Qiao, P., Li, P., Cheng, Y., Wei, W., Yang, S., Lei, M., and Chen, T.: Comparison of common spatial interpolation methods for analyzing pollutant spatial distributions at contaminated sites, Environ. Geochem. Hlth., 41, 2709–2730, 2019.
Reichle, R. H., Draper, C. S., Liu, Q., Girotto, M., Mahanama, S. P. P., Koster, R. D., and De Lannoy, G. J. M.: Assessment of MERRA-2 land surface hydrology estimates, J. Climate, 30, 2937–2960, 2017a.
Reichle, R. H., Liu, Q., Koster, R. D., Draper, C. S., Mahanama, S. P. P., and Partyka, G. S.: Land surface precipitation in MERRA-2, J. Climate, 30, 1643–1664, 2017b.
Roca, R., Alexander, L. V., Potter, G., Bador, M., Jucá, R., Contractor, S., Bosilovich, M. G., and Cloché, S.: FROGS: a daily gridded precipitation database of rain gauge, satellite and reanalysis products, Earth Syst. Sci. Data, 11, 1017–1035, https://doi.org/10.5194/essd-11-1017-2019, 2019.
Rodell, M., Houser, P. R., Jambor, U., Gottschalck, J., Mitchell, K., Meng, C.-J., Arsenault, K., Cosgrove, B., Radakovich, J., Bosilovich, M., Entin, J. K., Walker, J. P., Lohmann, D., and Toll, D.: The Global Land Data Assimilation System, B. Am. Meteorol. Soc., 85, 381–394, 2004.
Ruhi, A., Messager, M. L., and Olden, J. D.: Tracking the pulse of the Earth's fresh waters, Nature Sustainability, 1, 198–203, 2018.
Sang, Y., Singh, V. P., Gong, T., Xu, K., Sun, F., Liu, C., Liu, W., and Chen, R.: Precipitation variability and response to changing climatic condition in the Yarlung Tsangpo River basin, China, J. Geophys. Res.-Atmos., 121, 8820–8831, https://doi.org/10.1002/2016JD025370, 2016.
Sangani, M. F., Khojasteh, D. N., and Owens, G.: Dataset characteristics influence the performance of different interpolation methods for soil salinity spatial mapping, Environ. Monit. Assess., 191, 684, https://doi.org/10.1007/s10661-019-7844-y, 2019.
Savtchenko, A. K., Huffman, G., and Vollmer, B.: Assessment of precipitation anomalies in California using TRMM and MERRA data, J. Geophys. Res.-Atmos., 120, 8206–8215, 2015.
Semenov, M. A.: Simulation of extreme weather events by a stochastic weather generator, Clim. Res., 35, 203–212, 2008.
Shen, Y., Xiong, A., Wang, Y., and Xie, P.: Performance of high-resolution satellite precipitation products over China, J. Geophys. Res.-Atmos., 115, D02114, https://doi.org/10.1029/2009JD012097, 2010.
Shen, Y., Zhao, P., Pan, Y., and Yu, J.: A high spatiotemporal gauge-satellite merged precipitation analysis over China, J. Geophys. Res.-Atmos., 119, 3063–3075, 2014.
Shi, P., Bai, X., Kong, F., Fang, J., Gong, D., Zhou, T., Guo, Y., Liu, Y., Dong, W., Wei, Z., He, C., Yu, D., Wang, J., Ye, Q., Yu, R., and Chen, D.: Urbanization and air quality as major drivers of altered spatiotemporal patterns of heavy rainfall in China, Landscape Ecol., 32, 1723–1738, 2017.
Sloughter, J. M., Raftery, A. E., Gneiting, T., and Fraley, C.: Probabilistic Quantitative Precipitation Forecasting Using Bayesian Model Averaging, Mon. Weather Rev., 135, 3209–3220, 2007.
Su, F., Hong, Y., and Lettenmaier, D.P.: Evaluation of TRMM Multisatellite Precipitation Analysis (TMPA) and its utility in hydrologic prediction in the La Plata Basin, J. Hydrometeorol., 9, 622–640, 2008.
Sun, Q., Miao, C., Duan, Q., Ashouri, H., Soroosh, S., and Hsu, K.: A review of global precipitation data sets: Data sources, estimation, and intercomparisons, Rev. Geophys., 56, 79–107, 2018.
Tong, K., Su, F., Yang, D., and Hao, Z.: Evaluation of satellite precipitation retrievals and their potential utilities in hydrologic modeling over the Tibetan Plateau, J. Hydrol., 519, 423–437, 2014.
Verma, K. and Katpatal, Y. B.: Groundwater monitoring using GRACE and GLDAS data after downscaling within basaltic aquifer system, Groundwater, 58, 143–151, https://doi.org/10.1111/gwat.12929, 2019.
Wang, F., Wang, L., Koike, T., Zhou, H., Yang, K., Wang, A., and Li, W.: Evaluation and application of a fine-resolution global data set in a semiarid mesoscale river basin with a distributed biosphere hydrological model, J. Geophys. Res.-Atmos., 116, D21108, https://doi.org/10.1029/2011JD015990, 2011.
Wang, L. and Koike, T.: Comparison of a distributed biosphere hydrological model with GBHM, Annual Journal of Hydraulic Engineering-JSCE, 53, 103–108, 2009a.
Wang, L., Koike, T., Yang, K., and Yeh, P. J.: Assessment of a distributed biosphere hydrological model against streamflow and MODIS land surface temperature in the upper Tone River Basin, J. Hydrol., 377, 21–34, 2009b.
Wang, L., Sun, L., Shrestha, M., Li, X., Liu, W., Zhou, J., Yang, K., Lu, H., and Chen, D.: Improving snow process modeling with satellite-based estimation of near-surface-air-temperature lapse rate, J. Geophys. Res.-Atmos., 121, 12005–12030, 2016.
Wang, L., Zhou, J., Qi, J., Sun, L., Yang, K., Tian, L., Lin, Y., Liu, W., Shrestha, M., Xue, Y., Koike, T., Ma, Y., Li, X., Chen, Y., Chen, D., Piao, S., and Lu, H.: Development of a land surface model with coupled snow and frozen soil physics, Water Resour. Res., 53, 5085–5103, 2017a.
Wang, S., Liu, J., Wang, J., Qiao, X., and Zhang, J.: Evaluation of GPM IMERG V05B and TRMM 3B42V7 Precipitation products over high mountainous tributaries in Lhasa with dense rain gauges, Remote Sensing, 11, 2080, https://doi.org/10.3390/rs11182080, 2019.
Wang, Y., Wang, L., Li, X., and Chen, D.: Temporal and spatial changes in estimated near-surface air temperature lapse rates on Tibetan Plateau, Int. J. Climatol., 38, 2907–2921, 2018.
Wang, Y., Chen, J., and Yang, D.: Bayesian assimilation of multiscale precipitation data and sparse ground gauge observations in mountainous areas, J. Hydrometeorol., 20, 1473–1494, 2019.
Wang, Y., Wang, L., Li, X., and Zhou, J.: High temporal and spatial resolution precipitation data of Upper Brahmaputra River Basin (1981–2016), Zenodo, https://doi.org/10.5281/zenodo.3711155, 2020.
Xia, T., Wang, Z., and Zheng, H.: Topography and data mining based methods for improving satellite precipitation in mountainous areas of China, Atmosphere, 6, 983–1005, 2015.
Xia, Y., Hao, Z., Shi, C., Li, Y., Meng, J., Xu T., Wu, X., and Zhang, B.: Regional and Global Land Data Assimilation Systems: Innovations, Challenges, and Prospects, J. Meteorol. Res., 33, 159–189, 2019.
Xu, R., Tian, F., Yang, L., Hu, H., Lu, H., and Hou, A.: Ground validation of GPM IMERG and TRMM 3B42V7 rainfall products over southern Tibetan Plateau based on a high-density rain gauge network, J. Geophys. Res.-Atmos., 122, 910–924, 2017.
Xue, B., Wang, L., Yang, K., Tian, L., Qin, J., Chen, Y., Zhao, L., Ma, Y., Koike, T., Hu, Z., and Li, X.: Modeling the land surface water and energy cycles of a mesoscale watershed in the central Tibetan Plateau during summer with a distributed hydrological model, J. Geophys. Res.-Atmos., 118, 8857–8868, 2013.
Yang, K., He, J., Tang, W., Qin, J., and Chen, C. C. K.: On downward shortwave and longwave radiations over high altitude regions: observation and modeling in the Tibetan Plateau, Agr. Forest Meteorol., 150, 38–46, 2010.
Yang, K., Wu, H., Qin, J., Lin, C., Tang, W., and Chen, Y.: Recent climate changes over the Tibetan Plateau and their impacts on energy and water cycle: A review, Global Planet. Change, 112, 79–91, 2014.
Yi, X., Li, G., and Yin, Y.: Spatio-temporal variation of precipitation in the Three-River Headwater Region from 1961 to 2010, J. Geogr. Sci., 23, 447–464, 2013.
Yong, B., Liu, D., Gourley, J. J., Tian, Y., Huffman, G. J., Ren, L., and Hong, Y.: Global view of real-time TRMM multisatellite precipitation analysis: Implications for its successor global precipitation measurement mission, B. Am. Meteorol. Soc., 96, 283–296, 2015.
Zaitchik, B. F., Rodell, M., and Olivera, F.: Evaluation of the Global Land Data Assimilation System using global river discharge data and a source-to-sink routing scheme, Water Resour. Res., 46, W06507, https://doi.org/10.1029/2009WR007811, 2010.
Zhang, Q., Shi, P., Singh, V. P., Fan, K., and Huang, J.: Spatial downscaling of TRMM-based precipitation data using vegetative response in Xinjiang, China, Int. J. Climatol., 37, 3895–3909, 2017.
Zhou, J., Wang, L., Zhang, Y., Guo, Y., Li, X., and Liu, W.: Exploring the water storage changes in the largest lake (Selin Co) over the Tibetan Plateau during 2003–2012 from a basin-wide hydrological modeling, Water Resour. Res., 51, 8060–8086, 2015a.
Zhou, Y., Lau, W. K. M., and Huffman, G. J.: Mapping TRMM TMPA into average recurrence interval for monitoring extreme precipitation events, J. Appl. Meteorol. Clim., 54, 979–995, 2015b.