Simple and Cost-Effective Biomonitoring Method for Assessing Pollution in Tropical African Rivers ()
1. Introduction
Despite the worldwide popularity and longevity of the biomonitoring concept, the regional share and application of the biomonitoring methods between tropical and non-tropical regions are not rational. Tropical African rivers are known to be more speciose than other regions but their taxonomical and ecological knowledge on macroinvertebrates is still incomplete [1] [2] [3]. Such knowledge gap has hindered the potential use of tropical macroinvertebrate species in developing biomonitoring method(s) that can accurately evaluate the integrity of riverine ecosystems [2]. As a result, Rapid Biomonitoring Methods (RBMs), which have been developed for the past four decades in non-tropical regions using local macroinvertebrates [4] - [13], were adopted and/or modified to develop the Namibia Scoring System (NASS) in Namibia [14], Okavango Assessment System (OKAS) in the Okavango Delta [15], the Zambia Invertebrate Scoring System (ZISS) in Zambia [16], the Tanzania Riverine Scoring System (TARISS) [17] and Ethiopian Biomonitoring Scoring System (ETHbios) [18] for use in assessing pollution in tropical African rivers. Presence of geographical differences between tropical and non-tropical regions may, however, affect the capability, functioning, compatibility and reliability of the existing non-tropical biomonitoring methods when opted and applied on tropical rivers [1] [2] [19] [20]. As such, there is a risk of having unreliable findings when non-tropical biomonitoring methods are adopted, refined and used to assess water pollution in tropical African rivers.
Ecological and taxonomical variations between the regions can as well lead to variation in macroinvertebrate taxa composition, and their sensitivity levels to disturbance and general ecosystem impairment [21]. For instance, one ephemeropteran family (Teloganodidae) and five trichopteran families (Barbarochthonidae, Glossosomatidae, Hydrosalpingidae, Petrothrincidae and Sericosostomatidae) are prevalent in the southwest cape of South Africa representing the Mediterranean regions, as opposed to ephemeropterans (Ephemerythidae and Dicercomyzidae) which are endemically widespread in both afro-tropical and tropical regions [12] [14] [17]. Moreover, macroinvertebrate taxa in Temperate, Mediterranean, Arid and Semi-Arid regions do not necessarily correspond with those in tropics to confirm the existence of general adoption rules among macroinvertebrate-based methods from other regions [1] [3] [22] [23] [24]. Such varying regional complexities have increased recognition among ecologists on the new demands for having regional specific methods to render data accuracy in biomonitoring programmes [2]. Similarly, the inclusion of all identified macroinvertebrate assemblages in the existing biomonitoring methods (i.e., ETHbios, SASS5 and TARISS) has made their use more complex taxonomically and less cost-effective [2] [12]. Such taxonomic complications and conflicting aspects regarding the adoption of non-tropical biomonitoring methods in developing tropical biomonitoring methods have therefore necessitated the design of this study.
Novelty of the approach lies in the simplification of the taxonomic complication that has characterized the existing biomonitoring methods for more than four decades. Being developed using only four diverse orders (Appendix 1) with wider range of occurrences and sensitivity to pollution, EDOT method minimizes data variability, the need for greater expertise, cost, and time during taxa identification, and the aspects that are not hitherto considered by existing biomonitoring methods. Therefore, the simplified method will provide guidelines and directions to meet current and anticipated future status of water pollution along the tropical African rivers towards the achievement of at least a good ecological status for all surface waters.
2. Materials and Methods
2.1. Description of Study Areas
Eighty-five (85) sampling sites of varying degradation levels along Pangani and Wami-Ruvu river basins were selected for sampling to ensure the characterization of macroinvertebrate taxa and determination of physico-chemical parameters (Figure 1). Pangani river basin is found within the north and north-eastern coastal Tanzania’s ecoregion, whereas the Wami-Ruvu basin occupies the central and eastern coastal Tanzania’s ecoregion. However, the basins provide a wide range of riverine systems, climate, geology, topography and human disturbance within different hydro-geological patterns. The mean annual rainfall between 1100 and 3000 mm per annum, with a maximum mean temperature of 28˚C to 35˚C in the dry season, and lowest of 14˚C to 18˚C during the wet season.
The Pangani river basin is located in the north-eastern mainland Tanzania, 36˚23'E to 39˚13'E and 03˚03'S to 05˚59'S with an altitude ranging from 0 to 4500 m. The basin has an estimated area of about 43,650 km2 that covers Arusha (2369.76 km2), Manyara (17,911.35 km2), Kilimanjaro (10,346.76 km2), and Tanga (10,223.17 km2) regions. Land use practices along the Pangani basin range from small-scale farming to large-scale mechanized agriculture, overexploitation of riparian vegetation, construction of dams and hydropower projects, grazing, bathing and washing, dumping of industrial and domestic wastes and human settlement.
The Wami-Ruvu river basin is elongated and extends from the central part of Tanzania towards the eastern part between 36˚00'E and 39˚00'E and 05˚00'S to 07˚00'S with an altitude of between 0 and 2500 m before draining into the Indian Ocean at Saadani village. It extends from Dodoma, through Morogoro, Coast, and Dar es Salaam regions, covering a total area of 72,930 km2 of wide plains and mountain ranges. Human activities that are impacting the Wami-Ruvu river basin include mining, brick making, poor agricultural practices involving application of agrochemicals, saline water intrusion, uncontrolled and illegal water obstruction for irrigation, bathing and washing along the river basin, fauna droppings, and disposal of untreated industrial and domestic wastes.
![]()
Figure 1. Tanzanian map showing sampling sites along Pangani and Wami-Ruvu basins.
2.2. Sampling Design
The two basins were divided into two site categories representing reference (least impacted) and monitoring (impacted) sites in accordance with Barbour et al. [8]. Water and macroinvertebrate assemblage samples were collected at each site near the end of dry, short and long-rain seasons to capture the effect of respective seasons. The sampling sites were selected on the basis of habitat score selection criteria: presence and/or absence of sustained anthropogenic disturbances, pools, riffles and runs, and degree of water physico-chemical, and habitat degradation.
Selection of Reference and Monitoring Sites
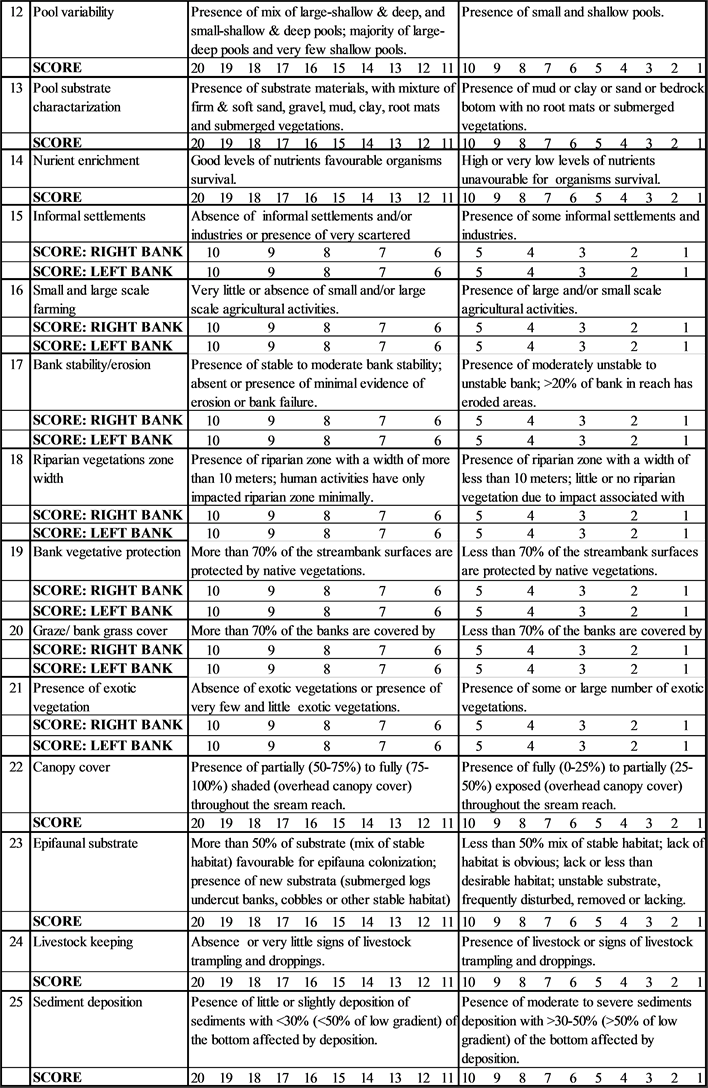
Habitat features were scored with the EPA Rapid Bioassessment Protocol (RBP) Habitat Assessment procedure prescribed by Barbour et al. [8]. This numerical scoring procedure qualitatively evaluates 200 meters reach for both spatial and longitudinal scales in order to distinguish reference sites from monitoring sites. Twenty-five habitat components described in Appendix 2 were assessed to categorize reference and monitoring sites. These include epifaunal substrate quantity and quality, embeddedness/siltation, velocity/depth regimes, sediment deposition, channel flow status, channel sinuosity, channel alteration, hydrological modifications, frequency of riffles or beds, in-stream flow modification, large and small scale farming, direct domestic pollution (washing, bathing, discharge and disposal), direct industrial pollution, livestock keeping, informal settlements, stream bank stability, nutrient enrichment, water quality and appearance, bank grass cover (graze), presence of exotic vegetation, canopy cover, bank vegetation protection, pool variability, pool substrate characterization, and riparian zone width. Each habitat component was scored on a 20-point scoring system to make the maximum summation of 500 points. Habitat score was calculated in each site by summing all rated screening criteria at a site (to get a total habitat score) and divided it by the highest possible score, before expressing it in percentage. The percentage habitat scores were then used to classify sites into two groups based on their degree of disturbance expressed as percentage. The first class having ≥ 90% degree of “naturalness” were considered as reference sites, whereas those with less than 90% naturalness are categorized as monitoring sites (Appendix 3).
2.3. Physico-Chemical Data Collection and Analysis
Water physico-chemical parameters i.e., pH, dissolved oxygen (DO), temperature, turbidity, conductivity, total dissolved solids (TDS), ammonia (
), potassium (K+), sulphate (
), soluble reactive phosphorus (SRP), nitrate (
) and nitrite (
) plus Biological Oxygen Demand (BOD) and Chemical Oxygen Demand (COD) were measured. Water temperature, conductivity, DO, TDS, and pH were measured and recorded in situ at each site using a multi-sensor probe device (Water Quality Instrument [Model 6,050,000]) while turbidity was measured using a turbidity meter. Laboratory analysis of water chemistry variables involved the filtering of collected water samples using 0.45 𝜇m glass fibre filters and placing them in hydrochloric acid washed polythene bottles before being preserved in a cool box at ≤10˚C. The samples were then taken to the Department of Aquatic Sciences and Fisheries Laboratory of the University of Dar es Salaam for analysis of chemical parameters.
Nitrate (
), nitrite (
), ammonia (
) and SRP (
) were analyzed using standard spectrophotometric methods described in APHA [25]. Ammonia was determined using the phenate method, nitrate and nitrite concentrations by cadmium reduction method, SRP analyzed using molybdate ascorbic acid method,
by turbid-metric method, BOD by instrumental (BOD track) method and COD using instrumental (semi-automated) calorimetric method [25] [26].
2.4. Macroinvertebrate Samples
Macroinvertebrates were sampled according to sampling methods developed by Barbour et al. [8], Dickens and Graham [12] and Lowe et al. [16], which were refined prior to use in order to match the study objectives and reflect tropical aquatic environment. The refinement/modification includes the use of tighter sampling technique, analytical methods and procedures. Macroinvertebrate samples were collected near the end of long-rain, short-rain and dry seasons in order to capture the effect of the respective seasons on macroinvertebrates and the recovery of the riverine ecosystems. Samples were collected throughout the study period by the same operator using a 30 cm × 30 cm kick-net with a 250-μm mesh size.
To avoid bias due to spatial and longitudinal variations and/or heterogeneity impact, samples were collected separately from different biotopes found available at each site. The biotopes include; stone (comprised stone in current—SIC and stone out of current—SOOC), vegetation (marginal and in-water vegetation) and GSM (gravel-sand-mud/silt). Each biotope was disturbed (by hand scooping, feet stirring and kicking, or net sweeping) while moving the kick-net that was placed closely downstream towards upstream for one minute to trap the detached macroinvertebrates. Apart from the available biotopes, one-minute visual observation and hand picking of macroinvertebrates were also done to increase site sample accuracy. All samples were then pooled as one composite sample and sorted grossly in the field to order level before preservation in 10% formaldehyde solution for subsequent laboratory processing, identification and recording. In the laboratory, macroinvertebrate specimens were identified to the lowest possible taxonomic level (family level) with the help of a dissecting microscope (10 × 45 magnifications for detailed observation) and Day et al. [27] [28], Thorp and Covich [29], Day and De Moor [30] [31], Day et al. [32], De Moor et al. [33] [34] and Stals and De Moor [35] identification keys, followed by listing and counting of individuals.
2.5. Selection Criteria for Potential Orders for Use in Biomonitoring Methods
Numerical and statistical redundant criteria were employed to select key bio-indicator families with the potential of separating reference sites from monitoring sites for use in developing a simple and cost-effective method (Figure 2). The selection was done by performing numerical truncate test, a non-parametric Mann-Whitney U test (p < 0.05), the degree of inter-quartile (IQ) overlap in Box-and-Whisker plots, Spearman’s rank (rs) correlation analysis, more diverse orders (with >10 taxa) criterion and validation test using CAP and Spearman’s rank correlation (rs). Orders with abundances of >0.5%, a p-value < 0.05 in a Mann-Whitney U test, a sensitivity score of 3, rs < 75% and higher numbers of taxa were considered as potential orders for inclusion in developing biomonitoring methods [9] [36].
1) Truncate test
Numerically, orders were truncated in order to eliminate the rare taxa (with <0.5% of total macroinvertebrate abundance) that would contribute only noise to other statistical analyses. To reduce variability in the data set, only dominant taxa (with total macroinvertebrate abundance of >0.5%) were retained for further
![]()
Figure 2. Selection criteria for potential BMI’s orders.
statistical analysis [37].
2) Mann-Whitney U test with p value < 0.05
A non-parametric Mann-Whitney U test was used as a statistical testing criterion for eliminating the resulting orders that exhibited no significant differences (p > 0.05) after pairwise comparison of abundances for orders observed in reference sites with those in monitoring sites. In that regard, orders found to have a p-value of <0.05 in the test were considered to be strong discriminators of reference and monitoring conditions [9] [36] [38].
3) Box-and-Whisker test
Sensitivity scores of the orders were based on the levels of overlapping interquartile ranges of Box-and-Whisker plots (Figure 3) according to the modified procedures prescribed by Barbour et al. [8], Baptista et al. [9], and Ferreira et al. [38]. Box-and-Whisker plots of reference and monitoring sites were examined in order to determine if there was a significant vertical separation between their interquartile ranges of the corresponding conditions. For each order, sensitivity scores of three, two and less than two, with the thresholds of median ranges between 25th and 75th percentiles of the reference site were used as selection criteria for potential orders representing a pivotal assessment tool. A sensitivity score of three (which meets the reference condition) was given if there was no overlap in the interquartile range (IQ) of Box-and-Whisker plots [9] [36] [38]. A score of two (that represents an intermediate condition) was scored if there was a partial overlap of the IQ range with both medians being outside of the overlap [9] [36] [38]. Likewise, a sensitivity score of less than two was given if the orders’ abundances were below the 25th percentile. These scores were attained if: a) there was a moderate overlap of IQ range but one median appeared outside the IQ range overlap; b) one range completely overlapped the other IQ range but one median is outside the IQ range overlap; and c) both medians were inside the IQ range overlap.
![]()
Figure 3. Sensitivity scores of Box-and-Whisker plots according to modified procedures prescribed by Barbour et al. [36], Baptista et al. [9] and Ferreira et al. [38].
4) Spearman’s rank correlation test
For more simplification of the index, a Spearman’s rank correlation was drawn with paired orders to eliminate any order if more than 75% of its values were identical. Orders with Spearman’s correlation (rs) > 0.75 were considered redundant in which the least abundant order was eliminated [38].
5) More diverse orders (n > 10 taxa) criterion
More diverse orders showing the highest representativeness of organisms distinguishing the reference sites from monitoring sites were chosen and used as potential candidates for developing the BMI. However, the orders were selected to establish the BMI if they had more than 10 families representing a wide range of occurrences and pollution sensitivity.
6) Validation of selected more diverse orders (n > 10 taxa)
A constrained CAP discriminatory analysis and Spearman’s rank correlation analysis were used for validating the selected bioindicator orders that showed a wide representativeness of taxa in all sites and ability of distinguishing reference sites from monitoring sites. Spearman’s rank correlation analysis was performed by correlating the selected more diverse orders with environmental variables.
Pollution Sensitivity Scoring of Selected Taxa of Bioindicator Orders
Each identified taxa of the selected macroinvertebrate orders with a potential of developing a biomonitoring method was assigned a pollution sensitivity weighting after an extensive literature review. The sensitivity scores of the reported taxa were assigned based on:
1) Known scores of taxa extracted from closely related existing indices which have been extensively tested and their capability and reliability for assessing water quality have been proven i.e., SASS5.
2) Autecological knowledge of macroinvertebrate taxa;
3) Association of taxa occurrences or abundances with environmental variables;
4) Simulated results for taxa with unknown sensitive scores to stressors using Canonical Analysis of Principal coordinates (CAP) predictive model.
The CAP predictive model was firstly calibrated by simulating only the abundance of taxa with known scores and their respective scores to facilitate the interpretation of unknown scores. The model was then re-simulated while including all abundances of taxa with their known and unknown sensitivity scores.
2.6. Data Analysis
MS Excel, PRIMER® version 7 (with PERMANOVA add-on), OriginPro® version 8.5, Community Analysis Package® version 4 (CAP IV), Species Richness and Diversity IV (SDR IV), and Instat® version 3 (GraphPad®) software packages were used for analysing the data. Prior to the analysis, all the data were transformed where appropriate and those with different S.I. unit were normalized into unit-less according to Barbour et al. [36], and Baptista et al. [9] in order to maintain uniformity among the values. Significance tests were performed with PRIMER version 7 after the biotic data had undergone transformation (to either log (x + 1), square root, or absent and present), with p value set at 0.05 to determine the differences among basins and site categories. Mann-Whitney U test and Non-Parametric Spearman’s rank correlation were performed by Instat® version 3 (GraphPad®) and Box-and-Whisker plots by OriginPro 8.5 used for revealing the discrimination power of the order among the site categories. Canonical Analysis of Principal coordinates (CAP) predictive model was simulated using PERMANOVA+ software package, which is an add-on to PRIMER® version 7 to calculate sensitivity weightings for taxa with unknown sensitivity ratings according to Anderson et al. [39]. Moreover, CAP and non-parametric Spearman’s rank correlation analysis were used for validating the ability of taxa to discriminate reference sites from monitoring sites.
3. Results
Approximately 97 freshwater macroinvertebrate families belonging to 17 orders were identified collectively to summarize macroinvertebrate data set for Tanzanian rivers (Appendix 4). Six validation criteria (Figure 2) were used for selecting potential orders for use in the biomonitoring index (BMI). The selection criteria included numerical and statistical tests that have been successfully applied in other regions to identify the potential candidates for inclusion during the development of their BMIs. Out of the 17 orders, Ephemeroptera, Diptera, Odonata and Trichoptera (EDOT) were found with significant discriminating power separating the reference from impaired sites according to truncate numerical test, Mann-Whitney U test (p < 0.05), Box-and-Whisker plot test, RDA and more diverse orders (n > 10 taxa) criterion. The rationale for the usefulness of each order is numerically and statistically tested in section 3.1 to 3.9.
3.1. Truncate Test
To reduce unusual variability of the data set [37], orders with ≤0.5% of the total macroinvertebrate abundance were numerically exempted for the next screening. Of the 17 macroinvertebrate orders, 10 had abundances of ≥0.5% and thus, passed the truncate numerical test and consequently were retained for the next screening test, with Arhynchobdellida, Rhynchobdellida, Hydroida, Pelecypoda, Megaloptera, Lepidoptera and Turbellaria orders, considered redundant.
3.2. Mann-Whitney U Test
Mann-Whitney U test was used for demonstrating the ability of orders to discern the difference between references and monitoring sites of the river basins. Orders were considered strong discriminators of impairment if the difference between monitoring and reference sites was significant (Mann-Whitney U, with p < 0.05). All the tested orders were found to be non-redundant (with p < 0.05) and thus considered for the next test (Table 1).
3.3. Box-and-Whisker Plot Test
Box-and-Whisker plots were used for evaluating how well each order could discriminate between the site categories, with a sensitivity score of three considered as a selection criterion [36]. The test showed that only six orders were highly sensitive (score = 3) and were consequently retained for non-parametric Spearman’s rank correlation selection test. These included: Diptera, Decapoda, Odonata, Ephemeroptera, Coleoptera, and Trichoptera (Table 2 and Figure 4).
![]()
Table 1. Results of Mann-Whitney U test for 10 Tanzanian orders of Tanzanian rivers.
![]()
Table 2. Results of Box-and-Whisker Plot tests for 10 tested orders.
3.4. Spearman’s Rank Correlation
Non-parametric Spearman’s rank correlation was used in order to avoid repeating information already summarized by other orders and for ensuring an accurate depiction of patterns by separating reference sites from monitoring sites. Orders with poor range are unlikely to differentiate monitoring and reference sites because the response gradient is highly compressed. Six orders that passed Box-and-Whisker plot tests were tested for redundancy amongst them using Spearman rank correlation analysis. Orders were considered redundant if the Spearman rank correlation coefficient (rs) was higher than 0.75 with a p-value of <0.05 [40]. However, all the tested Diptera, Decapoda, Odonata, Ephemeroptera, Coleoptera, and Trichoptera orders were unique with rs of <0.75 and p of <0.05 and thus, considered non-redundant and were retained for further selection tests.
3.5. More Diverse Orders (n > 10 Taxa) Criterion
More diverse orders showing the wide representativeness of families in all sites were chosen and used as potential candidates for developing BMI. Ephemeroptera (E), Diptera (D), Odonata (O) and Trichoptera (T) were the only four orders containing large numbers of different taxa (n > 10) at all levels of pollution tolerance. Odonata was represented by 12 instances, ephemeropterans by 13, whereas, dipterans and trichopterans contained 14 instances each, making a total of 53 instances, representing about 55% (N = 97) of all Tanzanian taxa.
3.6. Validation of EDOT Taxa
A constrained CAP discrimination analysis was performed to analyse macroinvertebrate assemblages for their ability to discern the reference sites from monitoring sites along Tanzanian river basins (Figure 5).
In developing biomonitoring method, it is also important to understand how the selected bio-indicator orders or taxa are correlated with environmental variables.
![]()
![]()
Figure 4. Box-and-Whisker plots for the orders distinguishing reference sites from monitoring sites of Tanzanian river basins.
![]()
Figure 5. Macroinvertebrate taxa of four selected orders showing their discriminatory power separating reference from monitoring sites using canonical discrimination analysis in Tanzanian river basins (δ2 = 0.8479, p < 0.001): r = reference sites; m = monitoring sites.
EDOT taxa were therefore assessed together with various factors that may influence the scores. The results from non-parametric Spearman’s rank correlation analysis showed strong significant correlation (with p of <0.0001) among the four orders and most environmental variables structuring macroinvertebrate assemblages. Ephemeroptera abundances showed strong correlation with conductivity (rs = −0.4330) and temperature (rs = −0.4235); dipterans with conductivity (rs = −0.4117), temperature (rs = 0.5023),
(rs = 0.6544), BOD (rs = 0.5434), COD (rs = 0.6005),
(rs = 0.7399),
(rs = 0.4914) and potassium (rs = 0.5734); Odonata with conductivity (rs = 0.4098) and pH (rs = 4152), and trichopterans with BOD (rs = −0.5229), COD (rs = −0.5492),
(rs = 0.6278),
(rs = −0.5324) and potassium (rs = −0.4530). Correlation strength reflects the reliability of the EDOT orders or taxa in detecting changes and/or discriminating the reference sites from monitoring sites along the rivers in the two basins. Since EDOT taxa have demonstrated their ability to discern the reference sites from monitoring sites via CAP and Spearman’s rank correlation analysis, they can therefore be used as potential bio-indicators in developing EDOT method.
3.7. Scoring of Selected Bioindicator Taxa
Generally, the sensitivity scores ranged from zero to 15, representing three categories of macroinvertebrate groups. Sensitivity scores for most tolerant taxa to stressors ranged from 11 to 15, whereas, six to 10 is for moderately tolerant taxa, and one to five for the least tolerant taxa [41]. If the species vary within taxa (i.e., Baetidae or Hydropsychidae) their sensitivity scores were assigned under the descending assumption that the more the species available at a site the less disturbed the site is, as such, a sensitivity rating of four is given to Baetidae 1 species, six to Baetidae 2 species and 12 to Baetidae > 2 species [42]. Of the 53 taxa, 50 were assigned scores based on related scoring systems [12] [14] [17] [42] while the sensitivity scores for the remaining three taxa were simulated by the CAP predictive model (Figure 6). The CAP predictive model with a correlation of 0.8543 and/or correlation square (δ2 = 0.7299) calculated sensitivity scores for Dicercomyzidae, Ephemerythidae and Macromiidae as 9.7246 ≈ 10; 8.8258 ≈ 9 and 3.1 ≈ 3 respectively (Figure 6).
![]()
Figure 6. Canonical Analysis of Principal coordinates (CAP) predictive model showing the position of taxa in relation to their sensitivity scores.
3.8. Application of EDOT Index (Calculating EDOT Index)
EDOT index (Appendix 1) is a field based rapid scoring system entailing in situ observation (with the help of 10 × 45 magnifying stereo microscope were deemed necessary), in which taxa are identified up to family level. Regardless of its abundance, each observed taxon is estimated upon observation and tallied in their respective biotope (stone, vegetation and GSM) and the combined column one of EDOT scoring sheet. A single macroinvertebrate is estimated as one organism whereas, less than one to 10 organisms as two, >10 to 100 as three, >100 to 1000 as four and >1000 as five in order to minimize scoring time. Time less than 10 minutes per site is recommended to end the fieldwork but if there is not any observed taxon in the duration of one minute.
The ticked sensitivity score of each taxon in the combined column is summed up to provide an EDOT(f) score, whereas, the total number of taxa is obtained by counting the recorded taxa. ASPT, on the other hand, is calculated by dividing the EDOT(f) scores by the number of taxa. EDOT Index can be calculated as EDOT(f) Score, Number of Taxa (No. Taxa) and Average Score per Taxa (ASPT) but only the result calculated from the combined column will represent the EDOT result for that particular site.
Mathematically, EDOT(f) is calculated as:
The Average Score Per Taxon (ASPT) is calculated by dividing EDOT(f) scores by the total number of taxa found as follows.
where: Scorei stands for the score of taxon i and n for the number of taxa.
Moreover, separate results may be achieved for each biotope and used in various investigations, only the result calculated from the total column will represent the EDOT(f) result for a site. Since this new index is designed to describe the degree at which tropical African riverine systems are impacted by human induced pollution, the scores towards zero represent stressed river while towards 100 refers to unstressed river. However, Dickens and Graham [12] have cautioned on the implication of combining the scores from the three biotopes by adding the score of any index, the number of taxa and ASPT and dividing the total by three. The resulting EDOT(f) score and ASPT score are interpreted using modified threshold values in Table 3.
4. Discussion
A 15-sensitivity scoring range following SASS5 [12], ETHbios [42] and TARISS [17] was used for all identified families of selected orders. Out of the total 97 taxa recorded from all sites, scores were assigned to only 53 taxa that showed clear water quality preferences, using either closely related earlier indices (50 taxa) or
![]()
Table 3. The suggested EDOT(f) threshold limits for assessing river health status.
CAP predictive model (three taxa). However, a flexible consideration was applied to assigning sensitivity scores for specific taxa groups with a number of types i.e., Baetidae (with 1 sp., 2 spp. and >2 spp.), and Hydropsychidae (1 sp., 2 spp. and >2 spp.) that cover wide pollution gradients [42] in order to increase the discrimination efficiency of these taxa among site categories.
The sensitivity scores for the taxa obtained from earlier indices strongly support the simulated CAP predictive model results with some families of the same order found matching the scores. For instance, the calculated score of 10 for Dicercomyzidae concurs with that of Polymitarcyidae whereas the score of nine awarded to Leptophlebiidae and Tricorythidae by earlier studies was at par with that simulated for Ephemerythidae (nine). Contrary to Dicercomyzidae and Ephemerythidae, Macromiidae was the least sensitive taxon (with a score of three) compared to the other Odonata families but close to the sensitive score of four, which was reported for Coenagrionidae and Libellulidae by existing biomonitoring methods. According to Gerber and Gabriel [41], the simulated sensitivity scores for Dicercomyzidae (10) and Ephemerythidae (nine) fall well within the range of moderately sensitive taxa while the Macromiidae (three) is grouped with the least sensitive taxa along the y-axis in Figure 6. The varied sensitivity levels to human stressors allow families of the EDOT orders to function as bio-indicators for assessing freshwater health status with strong relevance on conservation and management aspects [43].
Validation criteria, which included six selection criteria, were also set during the selection of orders to be involved in developing the index for the sake of simplifying taxonomic complications and improving the accuracy and efficiency of the index while minimizing the data collection time and cost. Indeed, EDOT orders are well known as more diverse and abundant orders in freshwater ecosystems with a large number of taxa and species [44] [45] [46], varied degrees of sensitivity to a wide range of anthropogenic stressors [47] and a recognizable contribution in the biomonitoring programmes [48]. In the presence of various environmental stress types i.e., organic pollution [49], heavy metals [50], hydro-morphological degradation [51], nutrient enrichment [52], acidification [53] and general stressors [8], their families can collectively reflect short and long-term health status of aquatic ecosystems [9]. However, 13 other orders were eliminated because they either failed to reflect the different features of freshwater macroinvertebrates communities or discriminating reference sites from monitoring sites according to truncate numerical test, the Mann-Whitney U test (with p < 0.05), Box-and-Whisker plot test, Non-parametric Spearman’s rank correlation test and more diverse taxa (n > 10) criteria. Similarly, the presence of cryptic species (e.g., chironomids) with varied responses towards pollution, and some being rarely identified to the species level [46] has restricted the development of species level EDOT index. Moreover, the lowest taxonomical unit identification has cost and time bound implications, and also requires more specialized knowledge and expertise [2] [42] [54]. However, the sensitivity variation for some families of the same order might contradict the biomonitoring efforts. For example, the Odonata family Gomphidae, has been classified among the most sensitive taxa whereas Coenagrionidae is far less sensitive to pollution [55].
Ephemeropterans are considered as ecologically an important order in biomonitoring programmes all over the world due to their least tolerant character against low dissolved oxygen, higher levels of nutrients, and toxicant chemical elements and compounds [56]. The order is abundantly found in sites with good water quality at interstitial spaces between rocks, rock surfaces, sediments, submerged underwater and marginal vegetation, with high amount of dissolved oxygen [56].
Contrary to Ephemeroptera, Trichoptera are somewhat more tolerant to pollution, but do not persist as a diverse community in the presence of significant impairment [57]. Trichopterans on the other hand inhabit a wide variety of habitats, ranging from fast flowing riffles to slow moving water type of sparsely vegetated pools. Being diverse, abundant and able to thrive in lentic conditions of both slow and fast-moving rivers makes them excellent indicators of habitat quality [57]. Regardless of their reported inconsistent nature in detecting impacts [48], the inclusion of trichopterans in biomonitoring programmes is not only virtual in evaluating the long-term interaction of several environmental conditions, but also in detecting short-term impact.
The strong significant correlation (with p < 0.0001) shown between the EDOT orders and most of the environmental variables structuring macroinvertebrate assemblages indicates better performance of the orders to organic pollution. In polluted rivers, abundance and diversity of more sensitive orders (ephemeropterans and trichopterans) are strongly reduced due to direct and indirect impact of pollutants where dipterans commonly possess the dominant status. The ability of dipterans to survive well in highly polluted freshwater environment and in slow moving water than most of the ephemeropterans, trichopterans and Odonata, render them good indicators for assessment of aquatic health status [58]. EDOT has ensured response of overall ecological status in river basins by segregating reference sites from monitoring sites and thus, concurring with other studies in the U.S.A [36], Europe [59], Brazil [9], and Tanzania [17].
5. Conclusion
The study has provided the first simplified biomonitoring method comprised of local based macroinvertebrate taxa with a wide range of occurrences, trophic levels and sensitivity to pollution as a tool for assessing water pollution in tropical African rivers. Being developed using only a few (four) and more diverse orders (with >10 taxa), minimizes data variability, needs for greater expertise and time in the field and thus makes it a less complex method than existing biomonitoring methods. A high EDOT method score describes an ecosystem containing diversified physical habitats, good water quality with conducive physicochemical conditions and adequate food resources for sustaining the lives of many species. This method is also in line with the interest shown by African and non-African environmental and water quality monitoring institutions and/or authorities in the application of biomonitoring methods, which tend to be lower cost and more effective than physical-chemical methods [18] [46], with emphasis on regionally or country-based water quality biomonitoring programmes. Upon validation, the resulting EDOT index can therefore be regarded as simple and cost-effective tool for assessing the ecological condition in Tanzanian rivers and other related watersheds in tropical African regions, where freshwater resources are under high pressure as a result of anthropogenic activities.
Acknowledgements
The authors would like to thank the Nelson Mandela African Institute of Science and Technology (NM-AIST) for their support during the field work and the Department of Aquatic Sciences and Fisheries Laboratory of the University of Dar es Salaam for space during the analysis of chemical parameters.
Funding
This study received financial support from Nelson Mandela Foundation through Tanzania Commission for Science and Technology (COSTECH).
Appendix
Appendix 1: The new EDOT Index developed under Tanzanian riverine conditions

Appendix 2: Modified EDOT Habitat Scores Criteria

Appendix 3.
(a) List of sampling sites with their respective geomorphological and biotopes (S = stone; MV = marginal vegetation; GSM = gravel-sand-mud) along Pangani basin.
(b) List of sampling sites with their respective geomorphological and biotopes (S = stone; MV = marginal vegetation; GSM = gravel-sand-mud) along Wami-Ruvu basin.
Appendix 4: Macroinvertebrate Species Collected Based on Major Site Categories