E-submission
Articles
- Page Path
- HOME > J Pathol Transl Med > Volume 57(1); 2023 > Article
-
Review
Single-cell and spatial sequencing application in pathology -
Yoon-Seob Kim1,2
 , Jinyong Choi1,3, Sug Hyung Lee3,4,5
 -
Journal of Pathology and Translational Medicine 2023;57(1):43-51.
DOI: https://doi.org/10.4132/jptm.2022.12.12
Published online: January 10, 2023
1Department of Microbiology, The Catholic University of Korea, Seoul, Korea
2Precision Medicine Research Center/Integrated Research Center for Genome Polymorphism, The Catholic University of Korea, Seoul, Korea
3Biomedicine & Health Sciences, The Catholic University of Korea, Seoul, Korea
4Department of Pathology, The Catholic University of Korea, Seoul, Korea
5Cancer Evolution Research Center, College of Medicine, The Catholic University of Korea, Seoul, Korea
-
Corresponding Author: Sug Hyung Lee, MD, PhD, Department of Pathology, College of Medicine, The Catholic University of Korea, 222 Banpo-daero, Seocho-gu, Seoul 06591, Korea, Tel: +82-2-2258-7311, Fax: +82-2-537-6586, E-mail: 'suhulee@catholic.ac.kr'
Corresponding Author: Jinyong Choi, PhD, Department of Microbiology, College of Medicine, The Catholic University of Korea, 222 Banpo-daero, Seocho-gu, Seoul 06591, Korea, Tel: +82-2-3147-8368, Fax: +82-2-537-0572, E-mail: 'jchoi@catholic.ac.kr'
© 2023 The Korean Society of Pathologists/The Korean Society for Cytopathology
This is an Open Access article distributed under the terms of the Creative Commons Attribution Non-Commercial License (https://creativecommons.org/licenses/by-nc/4.0) which permits unrestricted non-commercial use, distribution, and reproduction in any medium, provided the original work is properly cited.
Abstract
- Traditionally, diagnostic pathology uses histology representing structural alterations in a disease’s cells and tissues. In many cases, however, it is supplemented by other morphology-based methods such as immunohistochemistry and fluorescent in situ hybridization. Single-cell RNA sequencing (scRNA-seq) is one of the strategies that may help tackle the heterogeneous cells in a disease, but it does not usually provide histologic information. Spatial sequencing is designed to assign cell types, subtypes, or states according to the mRNA expression on a histological section by RNA sequencing. It can provide mRNA expressions not only of diseased cells, such as cancer cells but also of stromal cells, such as immune cells, fibroblasts, and vascular cells. In this review, we studied current methods of spatial transcriptome sequencing based on their technical backgrounds, tissue preparation, and analytic procedures. With the pathology examples, useful recommendations for pathologists who are just getting started to use spatial sequencing analysis in research are provided here. In addition, leveraging spatial sequencing by integration with scRNA-seq is reviewed. With the advantages of simultaneous histologic and single-cell information, spatial sequencing may give a molecular basis for pathological diagnosis, improve our understanding of diseases, and have potential clinical applications in prognostics and diagnostic pathology.
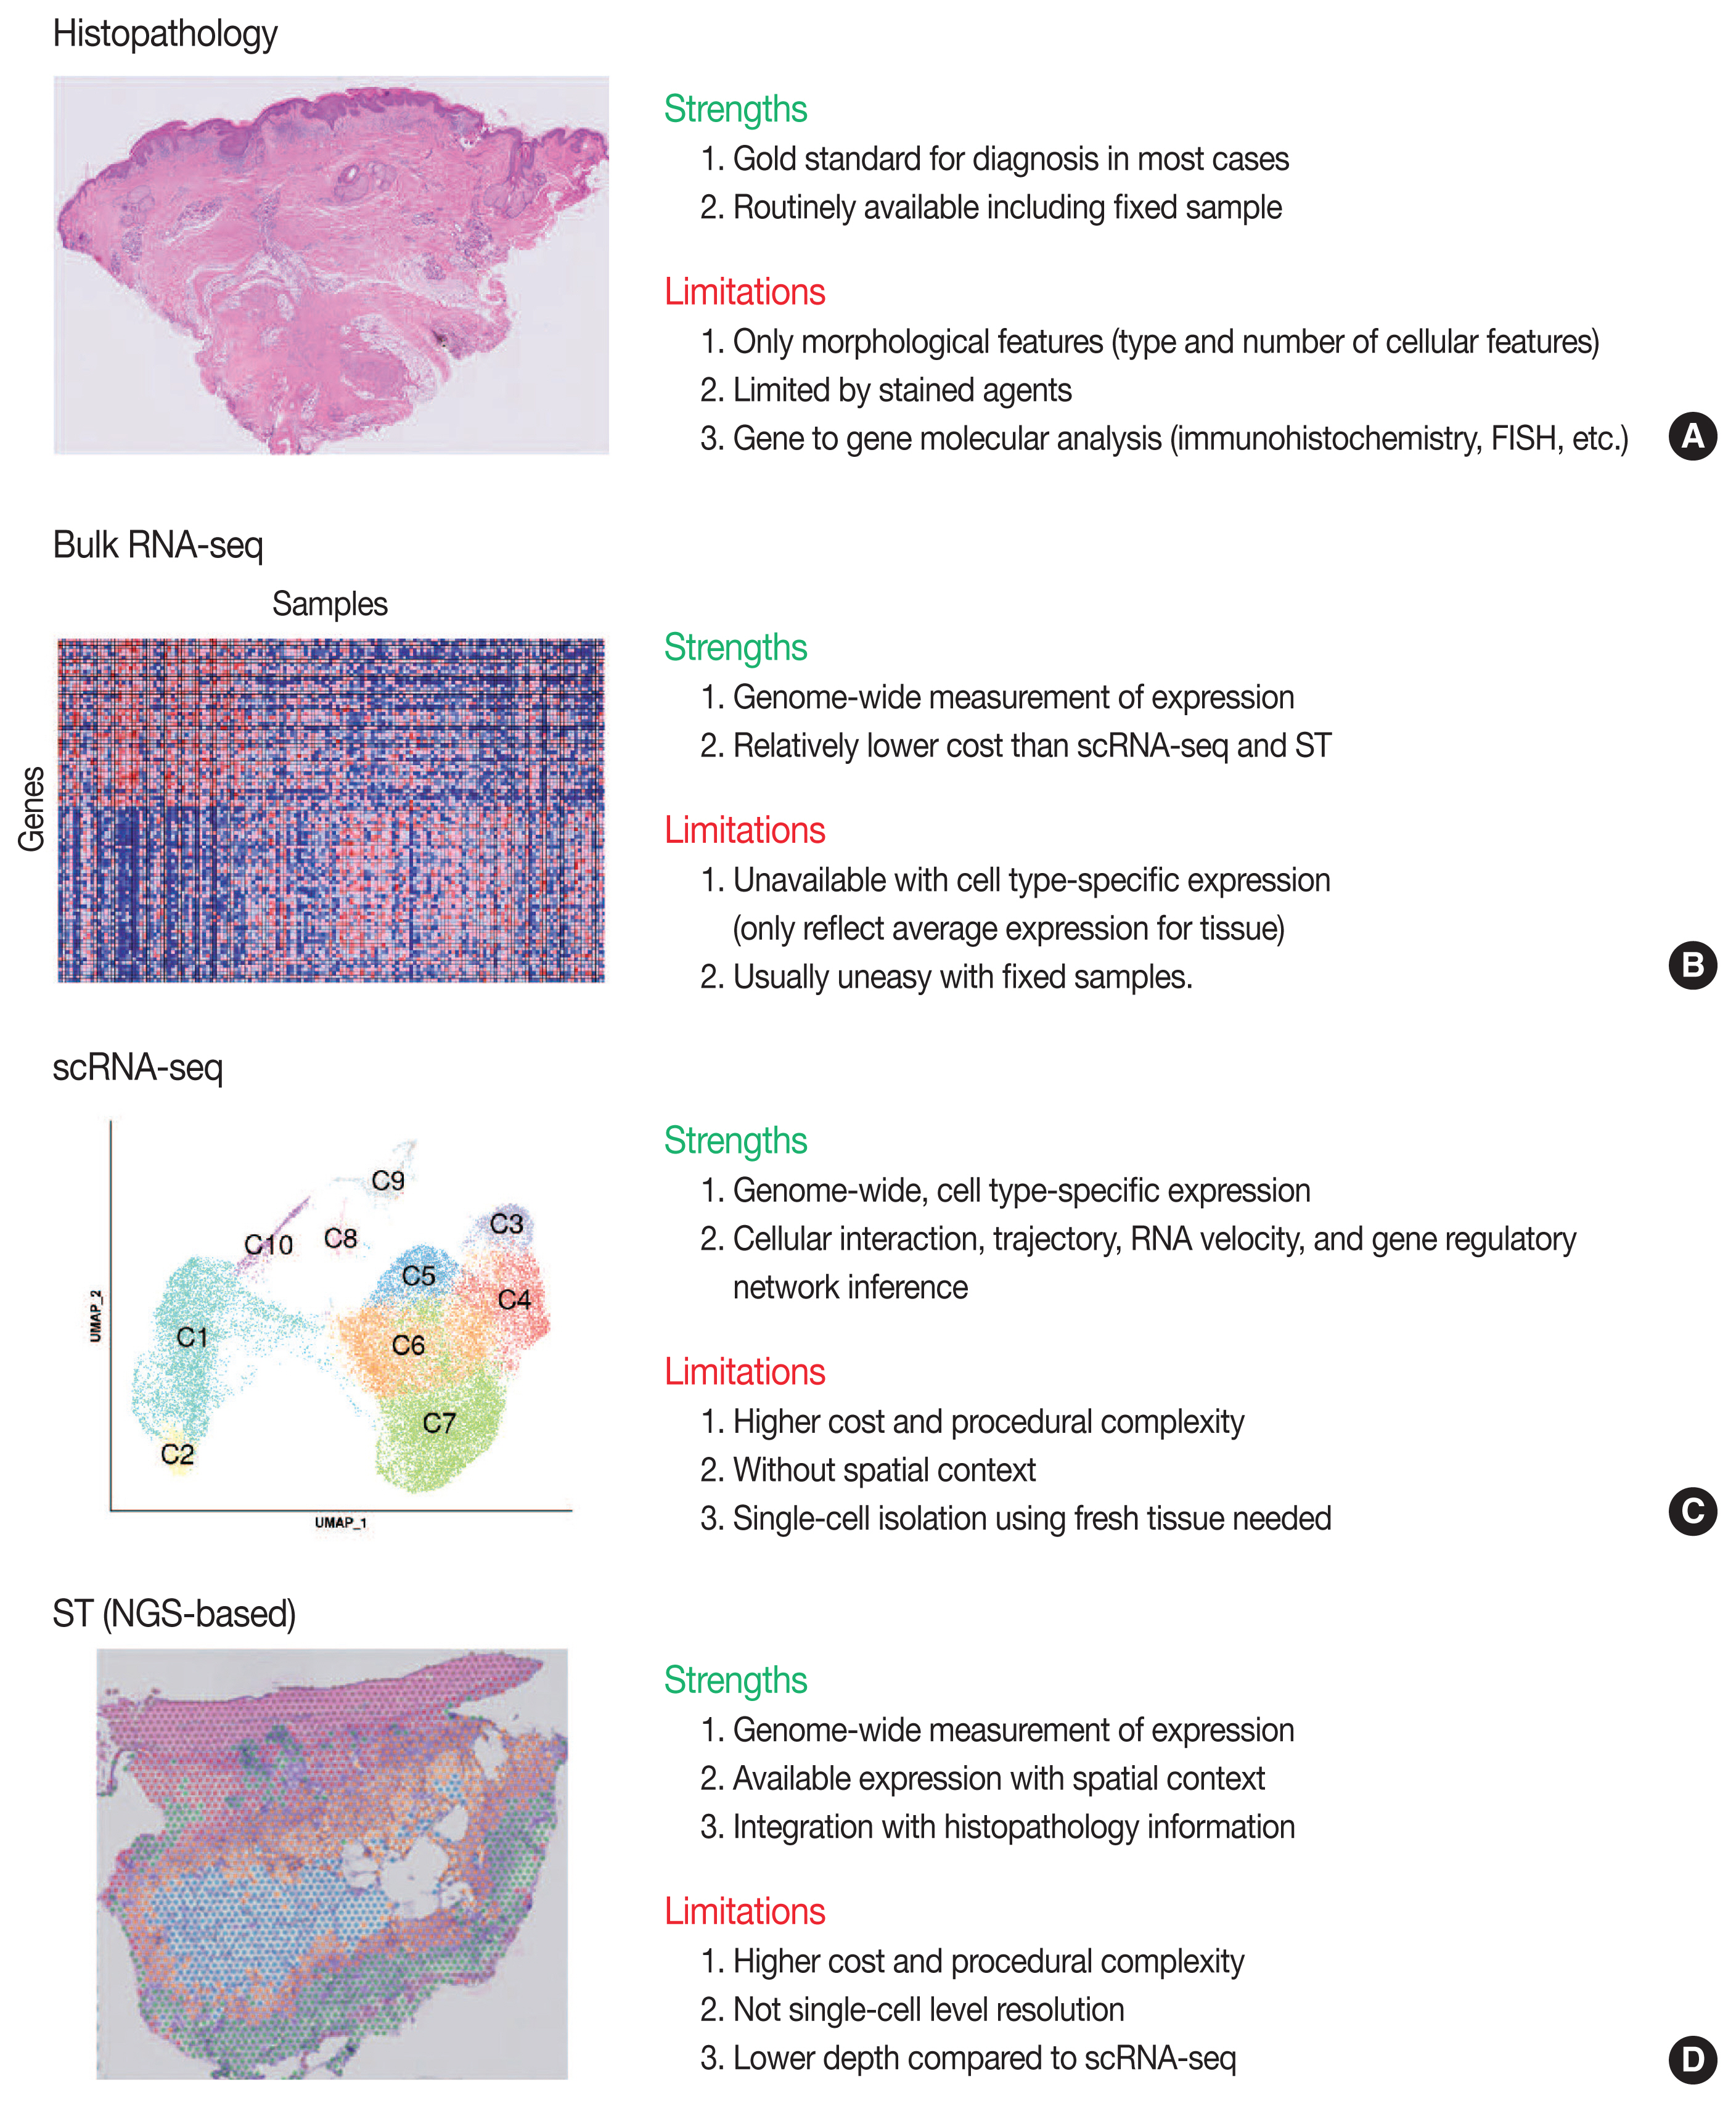
- Conventional transcriptome technologies, including microarrays and bulk RNA sequencing (RNA-seq), have shown a way to assay only the average expression RNA expression signal of all cell types within the tissue. However, gene expression is heterogeneous between many tissue cells and even between the same cell types, and thus these technologies are likely to miss important cell-to-cell variability [2]. After the introduction in 2009 [5], the droplet-based scRNA-seq has been the most popular scRNA-seq technology that can capture the transcriptomes in tens of thousands of single cells per sample to dissect transcriptomic heterogeneity masked in bulk RNA-seq [6]. Since there have been numerous reviews that comprehensively introduce the technological aspects and various analysis methodologies of scRNA-seq [2,7–12] and ST [3,13–16], we briefly introduce the overview of principles and analytical methods of scRNA-seq and ST in this review. We summarize the strengths and limitations of clinical and experimental gene expression methods: recent scRNA-seq and ST, compared to conventional histopathology and bulk RNA-seq (Fig. 1).
- The ordinary procedures for the generating scRNA-seq data include single-cell isolation and capture, cell lysis, reverse transcription, cDNA amplification, and library preparation [17]. Single-cell isolation and capture is the first process of acquiring high-quality single cells from a tissue in which all transcripts from single-cell will be uniquely barcoded. Polyadenylated mRNA molecules are captured by poly[T]-primers, reverse transcribed, polymerase chain reaction amplified, and resulting cDNA from every cell is pooled and sequenced by next-generation sequencing (NGS) [18]. Many methodologies are different in terms of the number of cell per sample (the breadth of cellular profiling) and the number of genes per cell (the depth of cellular profiling) [11]. Some provide full-length transcript coverage, while others only partial sequences from either 3′ or 5′ end of the transcript [7]. The preparation of high-quality single-cell suspension is key to successful scRNA-seq studies, and researchers should acknowledge the possible protocol-specific biases that can be developed during single-cell isolation [19,20]. While scRNA-seq needs prior tissue dissociation of fresh tissue for the preparation of single-cell suspension, single-nucleus RNA-seq capturing only transcripts present in the nucleus can be prepared from frozen or fresh tissue without the need for tissue dissociation [1,21].
- Workflows for scRNA-seq analysis include pre-processing (quality control, normalization, data correction, feature selection, and dimensionality reduction) and cell/gene-level downstream analysis (clustering, cluster annotation, trajectory inference, and differential expression analysis). The best-practice recommendations and details for each step of the analysis pipeline are comprehensively described elsewhere [8]. There have been various tools for analyzing scRNA-seq data, among which R-package Seurat is the most commonly used tool for analysis and visualization of scRNA-seq data [22]. Researchers easily find the sample analysis pipeline using Seurat R-package with the representative dataset at https://satijalab.org/seurat/articles/pbmc3k_tutorial.html. Major applications of scRNA-seq include the clustering and identification of known or novel cell types, inferring cellular trajectory, and inferring gene regulatory networks [2]. Unsupervised clustering is preferred in most cases for clustering and identification of cell types, although supervised clustering using prior assumptions and canonical marker genes is also available [18]. Dimensional reduction and visualization are performed using algorithms such as principal component analysis, t-distributed stochastic neighbor embedding, and uniform manifold approximation and projection, followed by cell clustering into subpopulations with biological significance using algorithms such as a graph-based clustering [18,20]. In addition to the unsupervised clustering, cell types can be determined by reference-based annotation using reference expression profiles from bulk RNA-seq [23]. Trajectory inference reconstructs dynamic cellular trajectories during the cellular transition between cell identities underlying biological process of interest [2]. Tools for trajectory inference have been developed for ordering single cells in pseudotime, an abstract unit of progress through the single-cell trajectory, by taking advantage of individual cells’ asynchronous progression of transcriptional dynamics along the biological process [24]. For trajectory inference, RNA velocity that is the time derivative of the gene expression state, can be analyzed to predict the future state of individual cells by distinguishing between unspliced and spliced mRNAs [25]. From scRNA-seq data, gene regulatory networks underlying gene expression by transcription factors, co-factors, and signaling molecules can be inferred, which may help to pinpoint key factors that determine phenotype in healthy systems as well as in diseases [26,27].
THE INTRODUCTION OF SINGLE-CELL RNA SEQUENCING
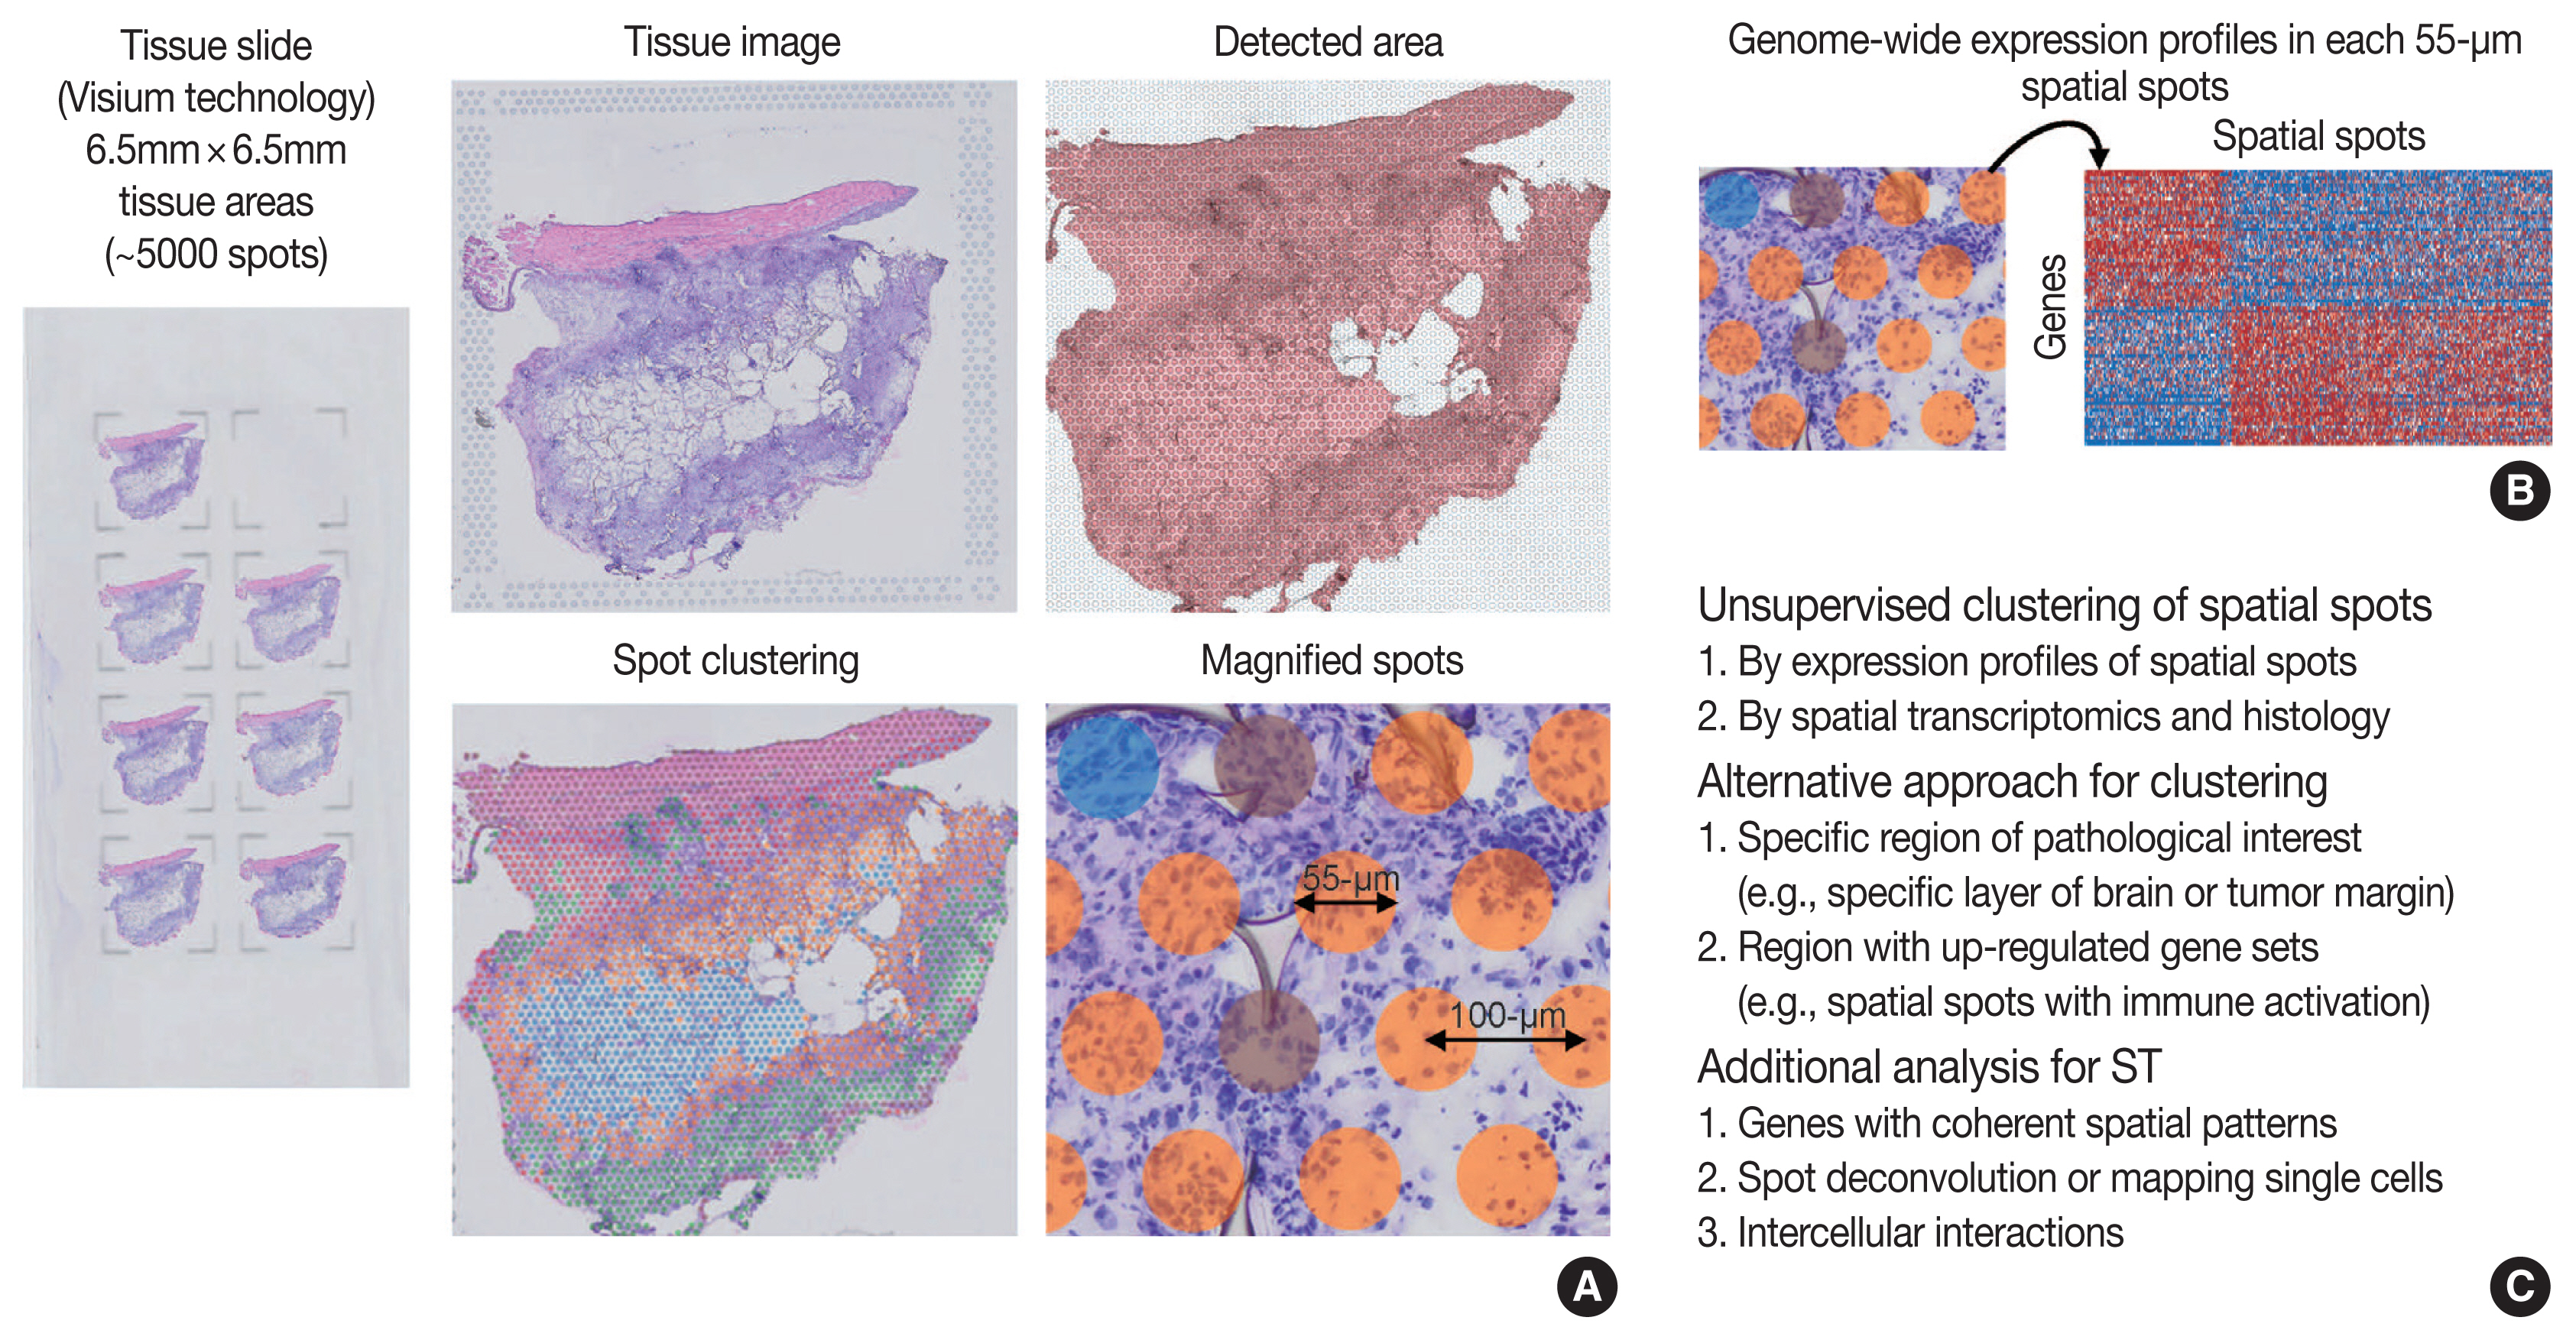
- Overview of ST was summarized in Fig. 2. One of the major limitations of scRNA-seq is the loss of spatial context since cells should be liberated from whole tissue before scRNA-seq. The spatial location of a cell can reveal helpful information for defining cellular phenotypes, cell states, intercellular interactions, and cell functions [15]. Although histopathology is the gold standard for diagnosis in most cases, it is limited by the type and number of cellular features delineated by stained agents [3]. Traditional methodologies for applying technologies for analyzing expression within tissues (in situ) include in situ hybridization (ISH) and immunohistochemistry; however, these methods limit analysis to, at most, a handful of genes or proteins at a time [13]. The recent development of ST technologies enables profile the whole transcriptome in spatially resolved way [13]. ST technologies can describe an unbiased picture of spatial composition that may provide valuable biological insights into development, physiology, and diseases microenvironment.
- As technologies and computational approaches for generating and analyzing ST data are rapidly evolving, there are various options for ST technologies that differ in terms of the number of genes and the size of tissues that can be assayed [13]. ST technologies are primarily categorized as (1) NGS-based, encoding positional information onto transcripts; and (2) imaging-based approaches, comprising in situ sequencing-based or ISH-based methods [28,29]. Recently introduced and widely used NGS-based ST have shown increased resolution (55 μm spot diameter with 100 μm center-to-center distance) and sensitivity (more than 10,000 transcripts per spot) compared to the previous ones [13]. Currently, commercial kits utilize fresh-frozen tissues for ST; however cutting-edge technologies have shown successful ST application to formalin-fixed, paraffin-embedded (FFPE) tissues that will expand the usages of ST for numerous FFPE samples in biobanks [30]. ISH-based high-plex RNA imaging (HPRI) is a targeted ST method that localizes and quantifies RNA transcripts of hundreds of genes in an intact tissue through multiplexed fluorescent microscopy [4]. Depth is a limiting factor for NGS-based techniques, while lack of transcriptome-wide coverage is for HPRI. Therefore, current ST technologies themselves still cannot reveal the deep transcriptomic information in tissue at single-cell level with accuracy, although they can shed light on the architecture of the cell-type distribution or the niches enriched for a specific gene set [4]. Until HPRI improves the transcriptome coverage and applicability of untargeted methods, the ST may stay advantageous, especially for obtaining an unbiased characterization of the spatial transcriptomics [4].
- Compared to scRNA-seq, the workflows for ST analysis and its integration with scRNA-seq have emerged recently and rapidly evolved. As previously described, the workflows for ST analysis are akin to those in scRNA-seq. Several additional points are needed for analyzing ST: (1) to identify genes with coherent spatial patterns, (2) spot deconvolution or mapping single cells, and (3) analysis and visualization in the intercellular interactions [3,15]. Researchers can utilize various ST methodologies for clustering analysis of spatially coherent domains and identification of spatially domain-enriched genes [3]. Unsupervised clustering and subsequent characterization aim to identify clusters of spots and sets of genes with biological significances [13]. A cluster of spots may be characterized by pathological findings or by molecular marker genes [13], indicating pathologists’ roles in the biological interpretation of ST data. Alternative to the unsupervised clustering, researchers may focus on a specific region of interest, for example a specific layer in the brain or the interface between cancer and microenvironment, or on context-specific genes, for example known gene sets or highly variable genes [13]. Widely used techniques for ST utilize 50–100-μm spot diameters with mixture of 10–20 cells, indicating that the spatial spots in the ST dataset may correspond to mixture expressions of several cells [31]. The proportion of cell type (deconvolution) or the designation of cell type (mapping) can be analyzed using both scRNA-seq and ST data, which will be explained in detail in the later chapter of the manuscript [4]. Surely, while scRNA-seq analysis cannot distinguish short-distance (juxtacrine and paracrine) and long-distance (endocrine) intercellular signaling due to lack of spatial information, ST dataset can seek the spatial coordinate of cell signaling [3].
- While currently often underused, the tissue image from ST analysis can be improved to show high-resolution information when combined with the knowledges in the field of histopathology [13]. For example, a previous study revealed that integrating ST data with high-resolution histology image data could improve the resolution of ST data [32]. Pathologists may play the main role in the integrative analysis and biological interpretation of ST for histopathology.
THE INTRODUCTION OF SPATIAL TRANSCRIPTOMICS
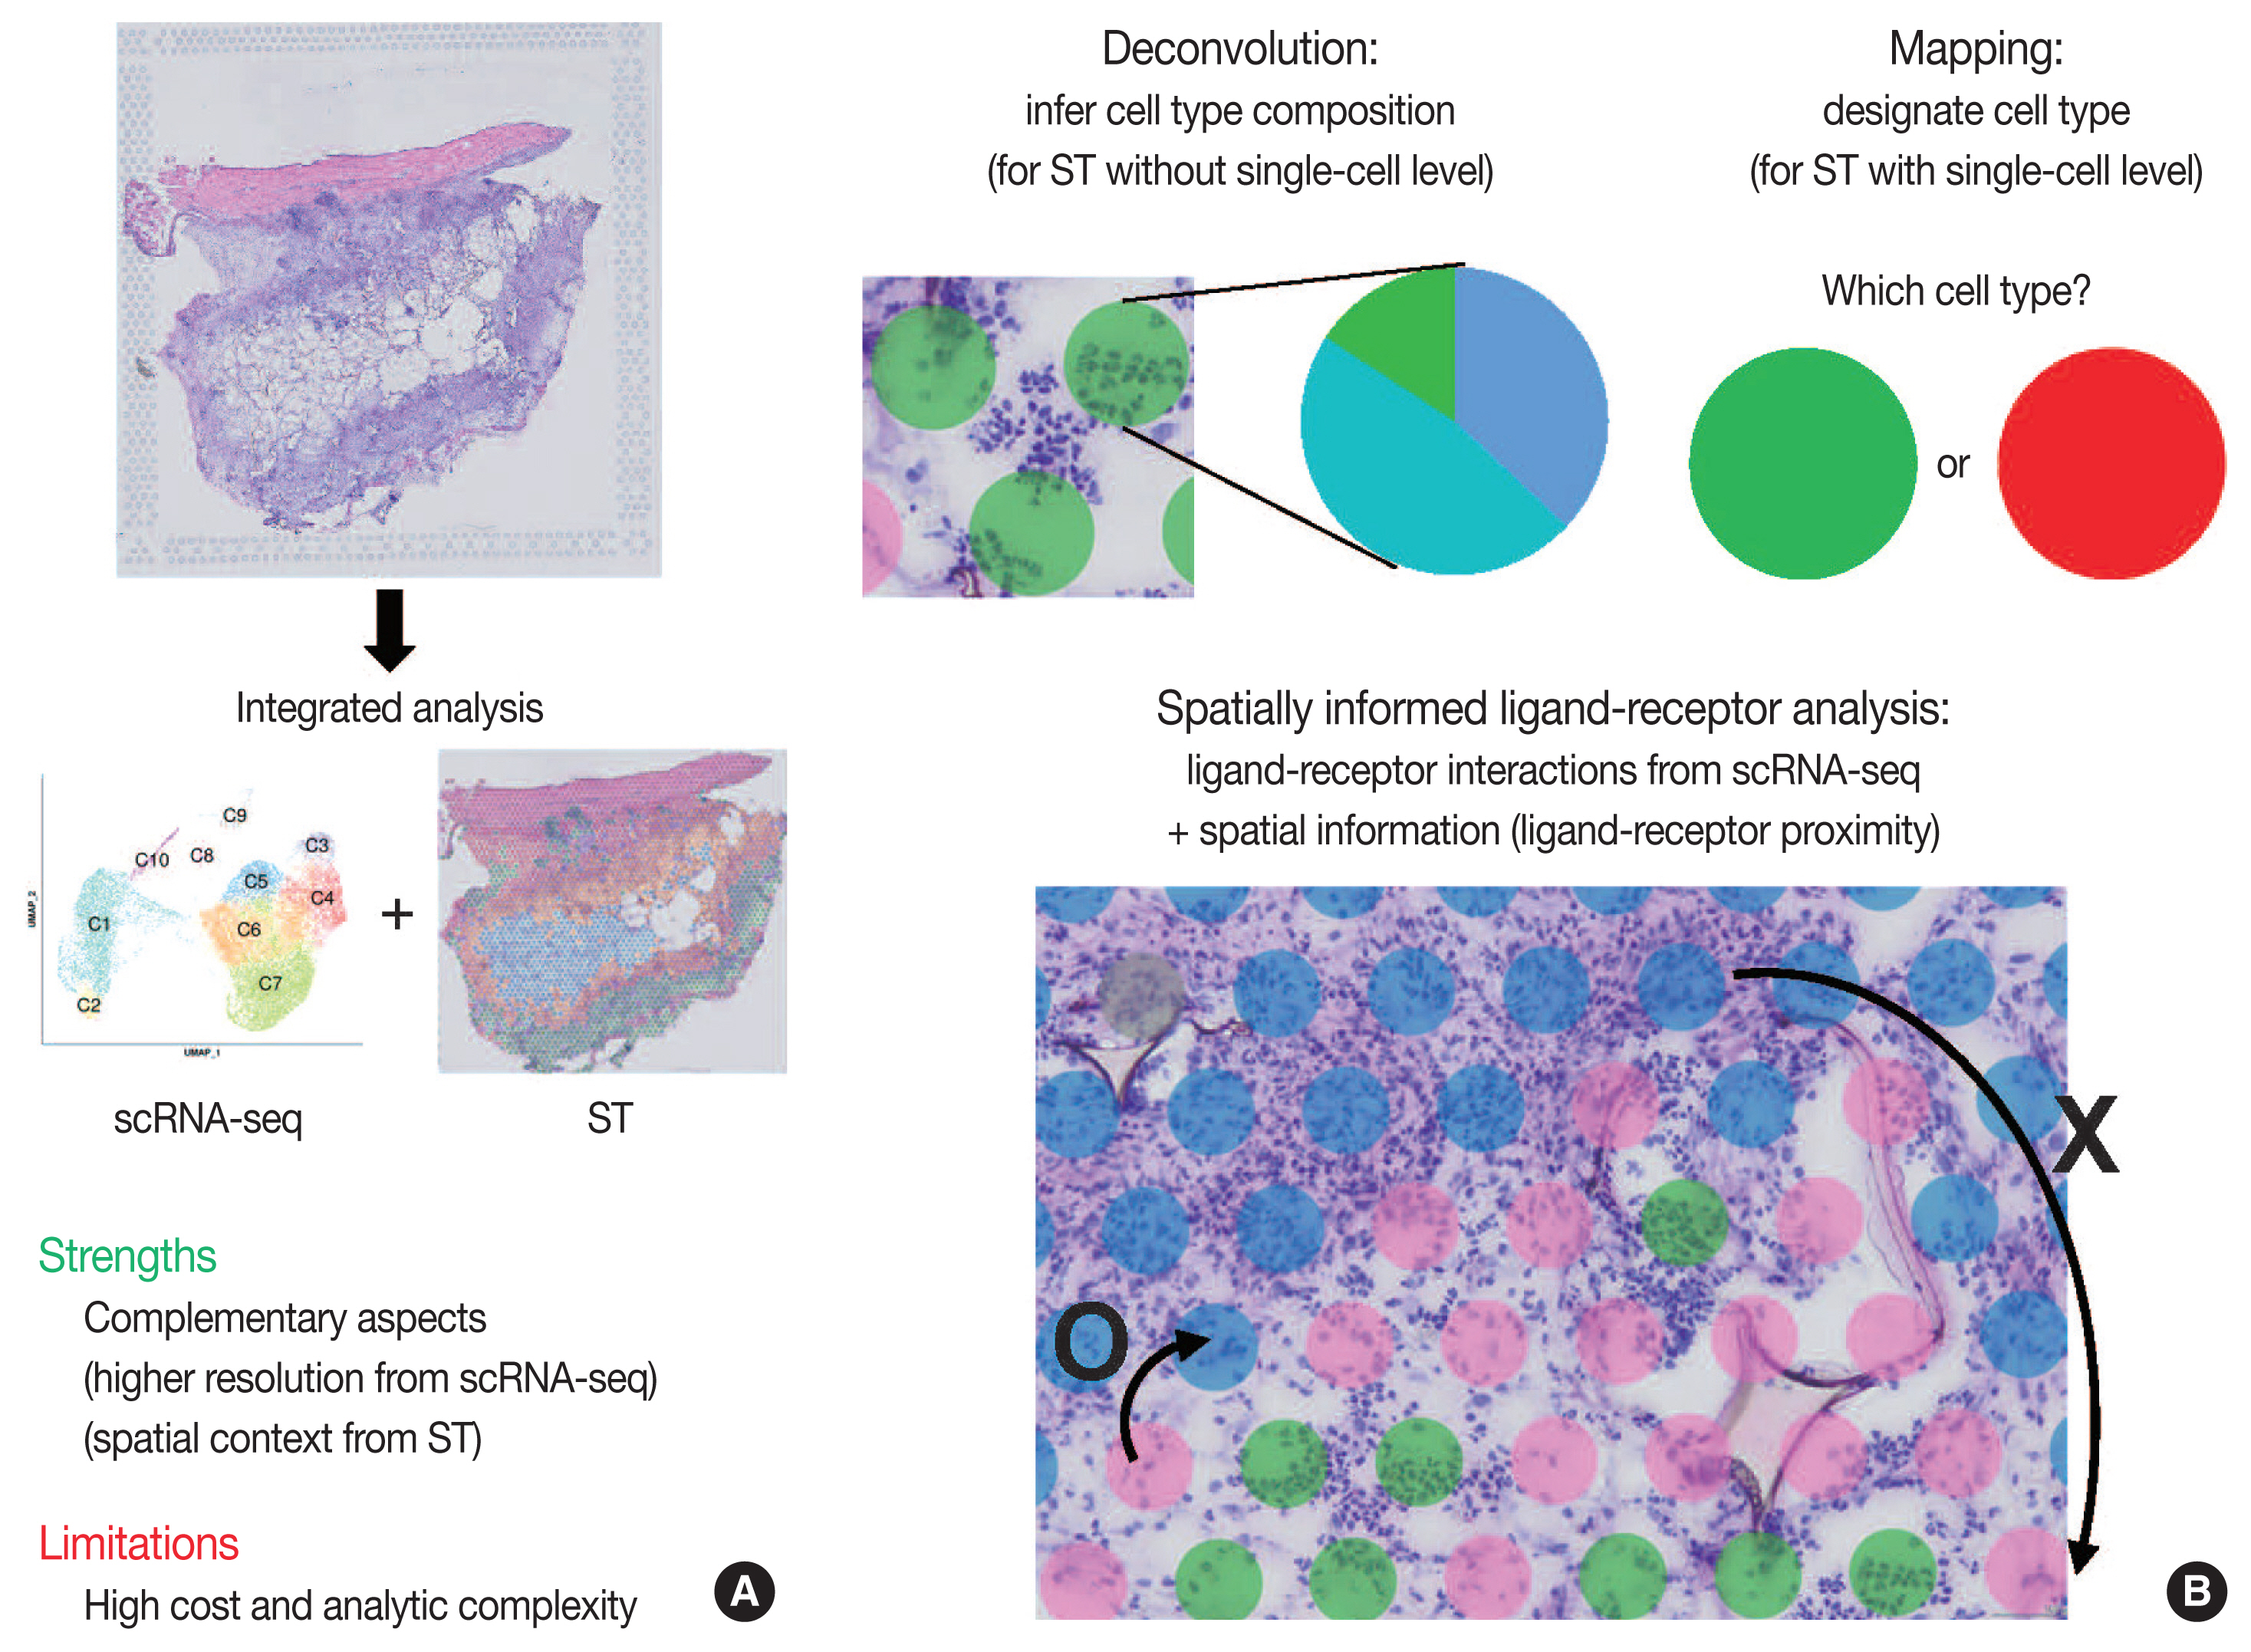
- Integrated analysis of scRNA-seq and ST is summarized in Fig. 3. The major limitations for scRNA-seq and ST are loss of spatial information and low resolution, respectively. Furthermore, the lack of reliable ST methods to implement deep sequencing necessitates the need to integrate scRNA-seq and ST data. Thus, simultaneous measurements followed by the integrated analysis of scRNA-seq and ST from the same tissue may improve the data quality. Herein, we summarize strategies for integrating scRNA-seq and ST data: deconvolution, mapping, and spatially informed ligand-receptor analysis.
- Because of the high read-depth and single-cell resolution of scRNA-seq compared with ST, cell subpopulations need to be defined firstly by scRNA-seq in a given tissue. There are two primary approaches for integration of scRNA-seq and ST data: first, deconvolution for ST without single-cell resolution such as spatial barcoding and second, mapping for ST with single-cell resolution such as HPRI [4]. Deconvolution refers to the process of quantifying the relative proportion of each cell type in spatial spots [15]. There are two main ways of the deconvolution: (1) inferring the proportion of cellular subtypes for a given spot, and (2) scoring a given spatial transcriptomic spot for how strongly it corresponds to a single cellular subtype. SPOTlight tool is good at validating the deconvolution analysis in terms of the accuracy, sensitivity, and specificity of cell-type detection [31]. The mapping has two facets: mapping assigned scRNA-seq–based cell subtypes to each cell and mapping each scRNA-seq cell to a specific niche or region of a tissue [13]. For mapping, pciSeq is one of the popular tools that have shown effectiveness in classifying cell type [33]. Researchers can adopt following statistical models for deconvolution and mapping: regression-based deconvolution and probabilistic modeling for deconvolution, and cell-type scoring and cluster-based mapping for mapping [4]. The possible mismatch between cell subtypes present in scRNA-seq data and those in spatial sequencing data that may complicate deconvolution and mapping should be acknowledged [4].
- Spatial data from ST, for example, the spot clusters from unsupervised clustering and the areas of pathological interests, can be analyzed for deconvolution or mapping of cell types identified by scRNA-seq. Unsupervised clustering of ST data can be performed using either gene expression of spatial spots alone or in combination with gene expression and histopathology [15], where pathologists may play an important role in the interpretation of pathological findings between identified cell subpopulations. Instead, the areas of pathological interests can be determined from the matched histological images by the pathologists, which are further investigated for distinct molecules of the areas: proportion of cell subtype, distinct expression, and intercellular interactions. For example, in cancer tissues, interesting areas of the tumor core and leading edges can be annotated by the pathologists for further investigations [34].
- Since intercellular interactions, especially juxtracrine and paracrine communications, are spatially restricted, ST data is well suited to validate the ligand-receptor interactions computed from scRNA-seq [4,35]. Standard algorithms for predicting ligand-receptor interaction pairs adopt both scRNA-seq data and a known database for ligand-receptor interactions, such as CellphoneDB [36]. In this, researchers can use ligand-receptor and ligand-receptor-target co-expression restriction to establish intercellular communications from scRNA-seq data. From ST data, a further restriction can be applied by ligand-receptor proximity where the spatial context can enhance the intercellular interaction analysis. Integrated analysis of scRNA-seq and ST can be used to nominate the receptors and ligands that mediate communication between the proximal cell subpopulations. The Giotto workflow is one of widely used tools for anticipating the likelihood that a given ligand-receptor interaction is used more or less based on the proximity of all of the co-expressing cells [37].
INTEGRATIVE ANALYSIS OF SINGLE-CELL AND SPATIAL RNA SEQUENCING
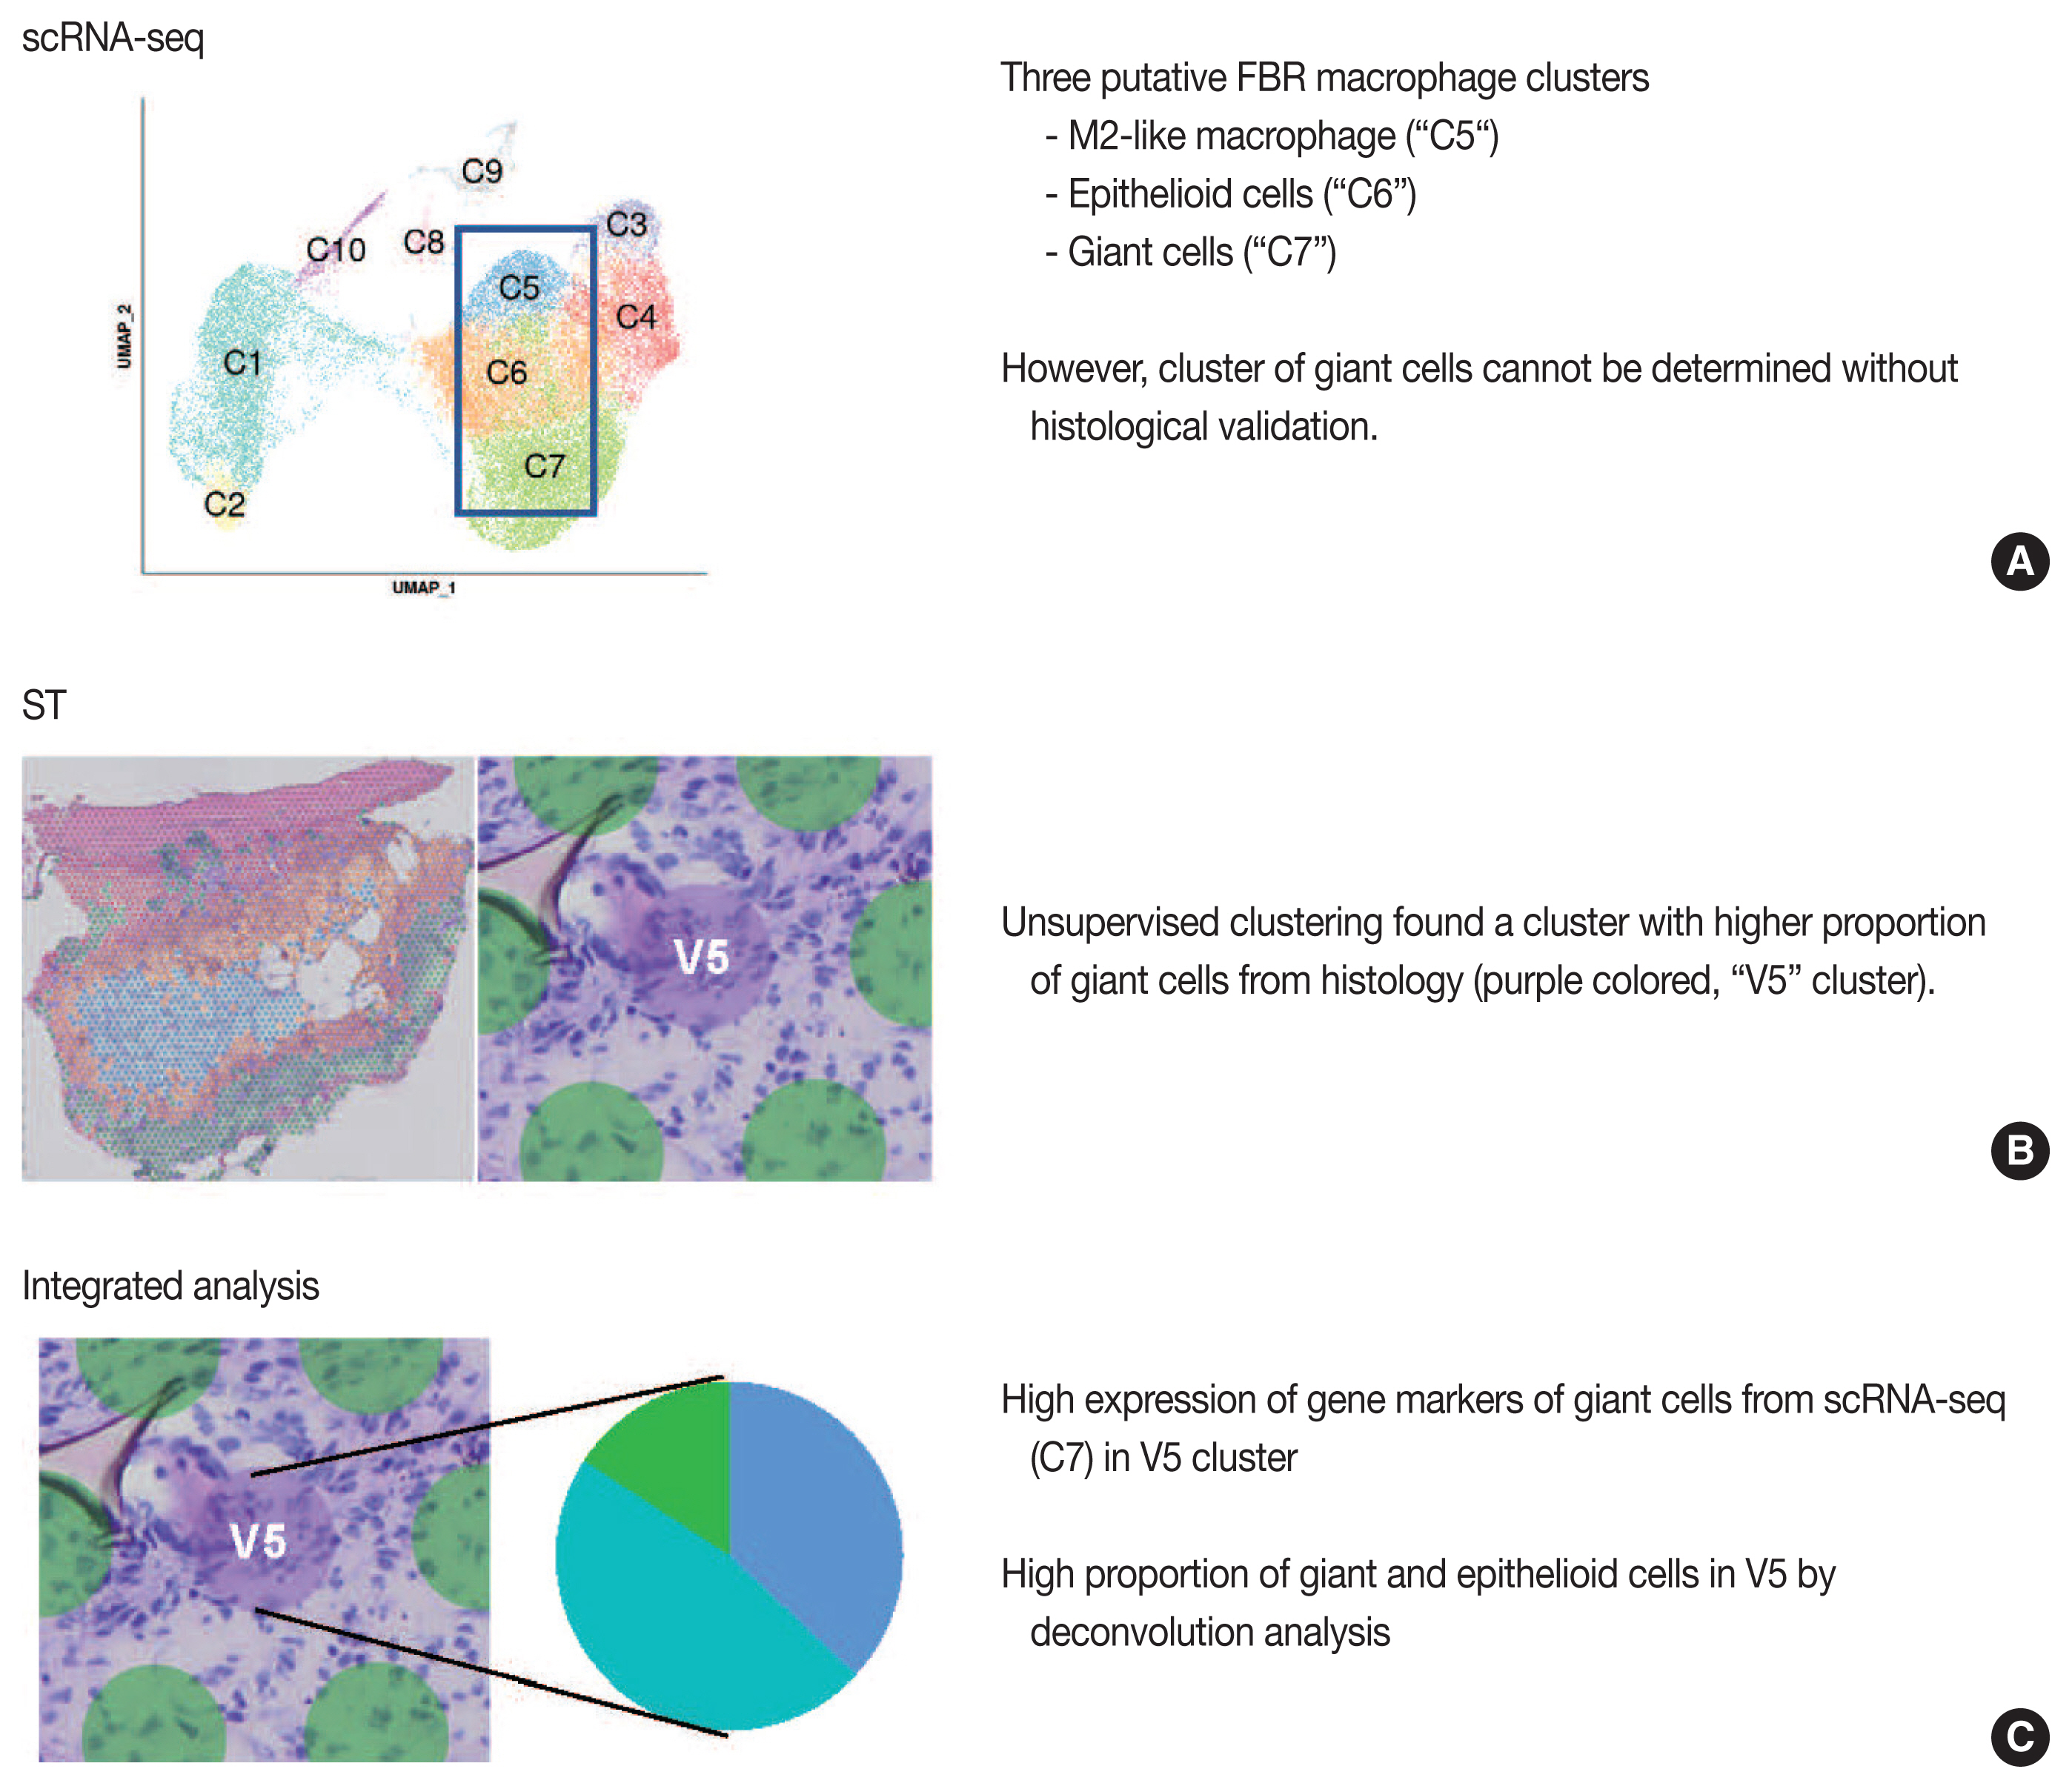
- Our group previously published the integrative analysis of scRNA-seq and ST of a foreign body reaction, which characterized the molecular signatures and cellular interactions of epithelioid cells and multinucleated giant cells in the foreign body reaction (Fig. 4) [38]. From the scRNA-seq data, we designated three putative clusters of macrophages, such as M2-like macrophage, epithelioid cells, and giant cells; however the designation of cell types cannot be completely from scRNA-seq data alone [38]. Unsupervised clustering of the ST data using the same foreign body reaction tissue found a cluster with the smallest number of spatial spots with scattered distribution, in which pathological examination found a relatively higher proportion of giant cells compared with other spot clusters [38]. Consistently, deconvolution analysis also supported a relatively high proportion of giant and epithelioid cells in this cluster [38]. scRNA-seq discovered the marker genes for giant cells, which were further validated by both ST and immunohistochemistry [38].
- We also present another two integration studies for human cancer transcriptomics. Profiling of human cutaneous squamous cell carcinoma (cSCCs) and matched normal tissues was performed via scRNA-seq, ST, and multiplexed ion beam imaging in ten cSCC patients [39]. In the scRNA-seq, tumor cells in cSCC showed four subpopulations, three recapitulating normal skin epidermis and a tumor-specific keratinocyte population unique to the cancer [39]. Integration analysis of the scRNA-seq and ST found that tumor-specific keratinocytes expressing epithelial-to-mesenchymal signature were mainly located to the tumor leading edges with enrichment of adjacent stroma of fibrovascular niche, thus being a hub for intercellular communication [39]. Multiplexed ion beam imaging, ST technology at a single-cell level, was further performed for validation [39]. Next, an integrative study of scRNA-seq and ST were performed in two tumors from patients with pancreas ductal adenocarcinomas [40], wherehigh concordance was found between pathological annotation by histological features and unsupervised clustering of ST data [40]. A statistical approach to overlap cell type-specific and tissue region-specific gene sets, called the multimodal intersection analysis, was used for identification and mapping of cell-type subpopulations across tissue regions [40]. A multimodal intersection analysis found that the subpopulations of ductal cells, macrophages, dendritic cells and cancer cells were spatially restricted [40]. Co-enrichment analysis of the multiple cell types found that inflammatory fibroblasts and cancer cells shared a stress-response gene module, which was further supported by a cancer genome database and immunofluorescence experiments [40].
- These example studies in area of tissue pathology highlight the importance of integrated analysis of scRNA-seq and ST along with histopathological features, in which the integrated approach helps to overcome the limitations of any individual method [38–40]. These studies confirmed that, the cellular subtypes in spatial spots by deconvolution or mapping from integrated scRNA-seq and ST were concordant with the histological findings, supporting the robustness of the integrative analysis [38–40]. Also, spatially informed ligand-receptor analysis suggested candidates of pivotal intercellular interactions in the pathological area of interest, which would lead to further mechanistic studies [38–40].
EXAMPLES FOR THE INTEGRATION OF SINGLE-CELL RNA SEQUENCING AND SPATIAL TRANSCRIPTOMICS TECHNOLOGIES
- Integrated analysis of scRNA-seq and ST spatially maps cell subtypes identified from scRNA-seq to decipher how cell populations are spatiotemporally participated in shaping tissue phenotypes. Such integration can also see the high-resolution maps of cellular subpopulations and intercellular interactions within the tissues, bridging the gap between the molecular characterization of a disease by the transcriptomics and the classical histological approaches. Among various available options, the study methodology of scRNA-seq and ST should be carefully designed and selected according to the biological questions. Especially for pathologists, coupling scRNA-seq and ST information with traditional morphological details will suggest novel insights for the molecular characterization as well as the cellular and spatial context of a disease, which can help diagnose and manage the diseases. The analytic tools in ST are rapidly evolving, especially in the area of scRNA-seq and ST integration. Given the rapid development, we expect new methodologies of a genome-wide ST at high sensitivity with a real single-cell resolution. In addition, the future direction of this area would be multiple integrative analyses of scRNA-seq and ST with other single-cell multi-omics technologies such as the genome, chromatin accessibility, and DNA methylation sequencing [41–43].
CONCLUSION
-
Ethics Statement
Not applicable.
-
Availability of Data and Material
Not applicable.
-
Code Availability
Not applicable.
-
Author Contributions
Conceptualization: SHL. Data curation: YSK. Formal analysis: YSK. Funding acquisition: SHL. Investigation: YSK, SHL. Methodology: YSK, SHL. Project administration: SHL. Resources: SHL. Software: YSK. Supervision: SHL. Visualization: YSK. Writing—original draft: YSK, JC, SHL. Writing— review & editing: JC, SHL.
-
Conflicts of Interest
The authors declare that they have no potential conflicts of interest.
-
Funding Statement
This study was supported by grants from National Research Foundation of Korea (2019R1A5A2027588 and 2020R1A2C2005031).
Notes


- 1. Stewart BJ, Clatworthy MR. Applying single-cell technologies to clinical pathology: progress in nephropathology. J Pathol 2020; 250: 693–704. ArticlePubMedPMCPDF
- 2. Hwang B, Lee JH, Bang D. Single-cell RNA sequencing technologies and bioinformatics pipelines. Exp Mol Med 2018; 50: 1–14. ArticlePubMedPMCPDF
- 3. Liu B, Li Y, Zhang L. Analysis and visualization of spatial transcriptomic data. Front Genet 2021; 12: 785290.ArticlePubMedPMC
- 4. Longo SK, Guo MG, Ji AL, Khavari PA. Integrating single-cell and spatial transcriptomics to elucidate intercellular tissue dynamics. Nat Rev Genet 2021; 22: 627–44. ArticlePubMedPMCPDF
- 5. Tang F, Barbacioru C, Wang Y, et al. mRNA-Seq whole-transcriptome analysis of a single cell. Nat Methods 2009; 6: 377–82. ArticlePubMedPDF
- 6. Zheng GX, Terry JM, Belgrader P, et al. Massively parallel digital transcriptional profiling of single cells. Nat Commun 2017; 8: 14049.ArticlePubMedPMCPDF
- 7. Chen G, Ning B, Shi T. Single-cell RNA-seq technologies and related computational data analysis. Front Genet 2019; 10: 317.ArticlePubMedPMC
- 8. Luecken MD, Theis FJ. Current best practices in single-cell RNA-seq analysis: a tutorial. Mol Syst Biol 2019; 15: e8746.ArticlePubMedPMCPDF
- 9. Andrews TS, Kiselev VY, McCarthy D, Hemberg M. Tutorial: guidelines for the computational analysis of single-cell RNA sequencing data. Nat Protoc 2021; 16: 1–9. ArticlePubMedPDF
- 10. Kashima Y, Sakamoto Y, Kaneko K, Seki M, Suzuki Y, Suzuki A. Single-cell sequencing techniques from individual to multiomics analyses. Exp Mol Med 2020; 52: 1419–27. ArticlePubMedPMCPDF
- 11. Papalexi E, Satija R. Single-cell RNA sequencing to explore immune cell heterogeneity. Nat Rev Immunol 2018; 18: 35–45. ArticlePubMedPDF
- 12. Ziegenhain C, Vieth B, Parekh S, et al. Comparative analysis of single-cell RNA sequencing methods. Mol Cell 2017; 65: 631–43. ArticlePubMed
- 13. Rao A, Barkley D, Franca GS, Yanai I. Exploring tissue architecture using spatial transcriptomics. Nature 2021; 596: 211–20. ArticlePubMedPMCPDF
- 14. Lewis SM, Asselin-Labat ML, Nguyen Q, et al. Spatial omics and multiplexed imaging to explore cancer biology. Nat Methods 2021; 18: 997–1012. ArticlePubMedPDF
- 15. Williams CG, Lee HJ, Asatsuma T, Vento-Tormo R, Haque A. An introduction to spatial transcriptomics for biomedical research. Genome Med 2022; 14: 68.ArticlePubMedPMCPDF
- 16. Moor AE, Itzkovitz S. Spatial transcriptomics: paving the way for tissue-level systems biology. Curr Opin Biotechnol 2017; 46: 126–33. ArticlePubMed
- 17. Jovic D, Liang X, Zeng H, Lin L, Xu F, Luo Y. Single-cell RNA sequencing technologies and applications: a brief overview. Clin Transl Med 2022; 12: e694.ArticlePubMedPMCPDF
- 18. Haque A, Engel J, Teichmann SA, Lonnberg T. A practical guide to single-cell RNA-sequencing for biomedical research and clinical applications. Genome Med 2017; 9: 75.ArticlePubMedPMCPDF
- 19. Denisenko E, Guo BB, Jones M, et al. Systematic assessment of tissue dissociation and storage biases in single-cell and single-nucleus RNA-seq workflows. Genome Biol 2020; 21: 130.ArticlePubMedPMCPDF
- 20. Lafzi A, Moutinho C, Picelli S, Heyn H. Tutorial: guidelines for the experimental design of single-cell RNA sequencing studies. Nat Protoc 2018; 13: 2742–57. ArticlePubMedPDF
- 21. Slyper M, Porter CBM, Ashenberg O, et al. A single-cell and single-nucleus RNA-Seq toolbox for fresh and frozen human tumors. Nat Med 2020; 26: 792–802. ArticlePubMedPMCPDF
- 22. Hao Y, Hao S, Andersen-Nissen E, et al. Integrated analysis of multimodal single-cell data. Cell 2021; 184: 3573–87. ArticlePubMedPMC
- 23. Aran D, Looney AP, Liu L, et al. Reference-based analysis of lung single-cell sequencing reveals a transitional profibrotic macrophage. Nat Immunol 2019; 20: 163–72. ArticlePubMedPMCPDF
- 24. Trapnell C, Cacchiarelli D, Grimsby J, et al. The dynamics and regulators of cell fate decisions are revealed by pseudotemporal ordering of single cells. Nat Biotechnol 2014; 32: 381–6. ArticlePubMedPMCPDF
- 25. La Manno G, Soldatov R, Zeisel A, et al. RNA velocity of single cells. Nature 2018; 560: 494–8. ArticlePubMedPMCPDF
- 26. Pratapa A, Jalihal AP, Law JN, Bharadwaj A, Murali TM. Benchmarking algorithms for gene regulatory network inference from single-cell transcriptomic data. Nat Methods 2020; 17: 147–54. ArticlePubMedPMCPDF
- 27. Skok Gibbs C, Jackson CA, Saldi GA, et al. High-performance single-cell gene regulatory network inference at scale: the Inferelator 3.0. Bioinformatics 2022; 38: 2519–28. ArticlePubMedPMCPDF
- 28. Zhuang X. Spatially resolved single-cell genomics and transcriptomics by imaging. Nat Methods 2021; 18: 18–22. ArticlePubMedPMCPDF
- 29. Larsson L, Frisen J, Lundeberg J. Spatially resolved transcriptomics adds a new dimension to genomics. Nat Methods 2021; 18: 15–8. ArticlePubMedPDF
- 30. Villacampa EG, Larsson L, Mirzazadeh R, et al. Genome-wide spatial expression profiling in formalin-fixed tissues. Cell Genomics 2021; 1: 100065.ArticlePubMedPMC
- 31. Elosua-Bayes M, Nieto P, Mereu E, Gut I, Heyn H. SPOTlight: seeded NMF regression to deconvolute spatial transcriptomics spots with single-cell transcriptomes. Nucleic Acids Res 2021; 49: e50.ArticlePubMedPMCPDF
- 32. Bergenstrahle L, He B, Bergenstrahle J, et al. Super-resolved spatial transcriptomics by deep data fusion. Nat Biotechnol 2022; 40: 476–9. ArticlePubMedPDF
- 33. Qian X, Harris KD, Hauling T, et al. Probabilistic cell typing enables fine mapping of closely related cell types in situ. Nat Methods 2020; 17: 101–6. ArticlePubMedPMCPDF
- 34. Arora R, Cao C, Kumar M, et al. Spatial transcriptomics reveals distinct and conserved tumor core and edge architectures that predict survival and targeted therapy response Preprint at: https://doi.org/10.1101/2022.09.04.505581 . 2022.
- 35. Armingol E, Officer A, Harismendy O, Lewis NE. Deciphering cell-cell interactions and communication from gene expression. Nat Rev Genet 2021; 22: 71–88. ArticlePubMedPMCPDF
- 36. Efremova M, Vento-Tormo M, Teichmann SA, Vento-Tormo R. CellPhoneDB: inferring cell-cell communication from combined expression of multi-subunit ligand-receptor complexes. Nat Protoc 2020; 15: 1484–506. ArticlePubMedPDF
- 37. Dries R, Zhu Q, Dong R, et al. Giotto: a toolbox for integrative analysis and visualization of spatial expression data. Genome Biol 2021; 22: 78.ArticlePubMedPMCPDF
- 38. Kim YS, Shin S, Choi EJ, et al. Different molecular features of epithelioid and giant cells in foreign body reaction identified by single-cell RNA sequencing. J Invest Dermatol 2022; 142: 3232–42. ArticlePubMed
- 39. Ji AL, Rubin AJ, Thrane K, et al. Multimodal analysis of composition and spatial architecture in human squamous cell carcinoma. Cell 2020; 182: 497–514. ArticlePubMedPMC
- 40. Moncada R, Barkley D, Wagner F, et al. Integrating microarray-based spatial transcriptomics and single-cell RNA-seq reveals tissue architecture in pancreatic ductal adenocarcinomas. Nat Biotechnol 2020; 38: 333–42. ArticlePubMedPDF
- 41. Argelaguet R, Clark SJ, Mohammed H, et al. Multi-omics profiling of mouse gastrulation at single-cell resolution. Nature 2019; 576: 487–91. ArticlePubMedPMCPDF
- 42. Abascal F, Harvey LM, Mitchell E, et al. Somatic mutation landscapes at single-molecule resolution. Nature 2021; 593: 405–10. ArticlePubMedPDF
- 43. Lee J, Hyeon DY, Hwang D. Single-cell multiomics: technologies and data analysis methods. Exp Mol Med 2020; 52: 1428–42. ArticlePubMedPMCPDF
References
Figure & Data
References
Citations
- Incorporating Novel Technologies in Precision Oncology for Colorectal Cancer: Advancing Personalized Medicine
Pankaj Ahluwalia, Kalyani Ballur, Tiffanie Leeman, Ashutosh Vashisht, Harmanpreet Singh, Nivin Omar, Ashis K. Mondal, Kumar Vaibhav, Babak Baban, Ravindra Kolhe
Cancers.2024; 16(3): 480. CrossRef - Potential therapeutic targets for hypotension in duchenne muscular dystrophy
Harshi Saxena, Neal L. Weintraub, Yaoliang Tang
Medical Hypotheses.2024; 185: 111318. CrossRef - A comparative analysis of single-cell transcriptomic technologies in plants and animals
Vamsidhar Reddy Netla, Harshraj Shinde, Gulshan Kumar, Ambika Dudhate, Jong Chan Hong, Ulhas Sopanrao Kadam
Current Plant Biology.2023; 35-36: 100289. CrossRef - Fibroblasts – the cellular choreographers of wound healing
Samuel Knoedler, Sonja Broichhausen, Ruiji Guo, Ruoxuan Dai, Leonard Knoedler, Martin Kauke-Navarro, Fortunay Diatta, Bohdan Pomahac, Hans-Guenther Machens, Dongsheng Jiang, Yuval Rinkevich
Frontiers in Immunology.2023;[Epub] CrossRef
 PubReader
 ePub Link
-
 Cite this Article
- Cite this Article
-
- Close
- Download Citation
- Close
- Figure
-