

Abstract
In a system of endotoxin (LPS)-mediated NO production in ANA-1 murine macrophages, suppression subtractive hybridization was used to identify genes up-regulated by NO. Osteopontin (OPN), a secreted acidic phosphoprotein that binds to a cell surface RGD integrin-binding motif, was found to be differentially expressed in the presence of NO. OPN has been demonstrated to inhibit NO production in a variety of cell types. Northern blot and nuclear run-on analyses demonstrated that OPN mRNA levels and gene transcription were significantly increased in the presence of LPS-induced NO synthesis. Transient transfection of an OPN promoter-luciferase reporter plasmid construct showed that promoter activity is increased in the presence of LPS and NO. Immunoblot analysis showed that OPN protein is secreted into the extracellular fluid. Similar results were noted with an alternative cell system, RAW 264.7 macrophages, and alternative inducers of NO synthesis, IFN-γ and IL-1β. In the presence of GRGDSP, a hexapeptide that blocks binding of RGD-containing proteins to cell surface integrins, NO production is significantly increased in the presence of LPS stimulation. These data suggest a unique trans-regulatory mechanism in which LPS-induced NO synthesis feedback regulates itself through up-regulation of OPN promoter activity and gene transcription.
In conditions of endotoxemia, inducible NO synthase (iNOS)3 production with subsequent synthesis of NO is associated with numerous cellular, biochemical, and molecular functions that alter the host response to sepsis. Although the molecular regulation of iNOS induction in this setting has been extensively characterized, the mechanisms that subsequently down-regulate iNOS activity and synthesis are largely unknown. Certainly, TGF-β-dependent transcriptional and posttranslational control of iNOS has been described (1). Substrate and cofactor availability can also modulate iNOS activity (1). Lowenstein and colleagues have demonstrated that both kalirin and NAP110 inhibit iNOS activity by preventing iNOS homodimer formation (2, 3). These mechanisms do not appear to be NO dependent. In contrast, a particularly unique feedback regulatory mechanism is NO-mediated S-nitrosation of NF-κB, a key transcription factor for iNOS gene transcription, with accompanying inhibition of NF-κB DNA binding and down-regulation of iNOS gene transcription. Given the ubiquity of negative feedback regulation as a mechanism for modulation of protein activity, NO-dependent inhibitory mechanisms for iNOS may also exist.
One approach to understanding regulatory mechanisms is the identification of patterns of gene expression associated with varying physiological states. A technique called suppression subtractive hybridization (SSH) has recently been described, which is based on technology similar to representational difference display but with modifications to normalize for mRNA abundance (4, 5, 6). In ANA-1 murine macrophages, we hypothesized that endotoxin (LPS)-mediated NO production induces a specific set of genetic programs that may serve to alter cellular NO metabolism. To identify genes differentially expressed in LPS-stimulated cells producing NO, RNA from LPS-treated cells was used as a “tester” and RNA from LPS plus NG-nitro-l-arginine methyl ester (l-NAME)-treated cells was used as a “driver.” Individual cDNA clones generated by SSH were used as probes in Northern blot analysis to identify differentially expressed genes.
Using SSH, osteopontin (OPN) was found to be specifically induced in the presence of LPS-induced NO synthesis. This observation was confirmed in both ANA-1 and RAW 264.7 murine macrophages and also in the context of IFN-γ and IL-1β stimulation. OPN is a secreted, acidic phosphoprotein that binds to an RGD integrin-binding motif; it is produced by cells of mineralized tissue and activated cells of the immune system (7). OPN production is increased in inflammatory states, atherosclerosis, nephritis, malignancy, and bone remodeling. Several investigators have demonstrated that OPN synthesis inhibits iNOS expression and/or NO synthesis in kidney epithelium, heart microvascular endothelium, macrophages, and rat thoracic aorta (7, 8, 9, 10, 11, 12, 13). The molecular regulation of this functional linkage has not been previously characterized. In this study, we demonstrate that OPN gene transcription and promoter activity is up-regulated by NO in endotoxin- and cytokine-stimulated murine macrophages. Our results suggest that OPN-mediated inhibition of iNOS expression and NO production is an NO-dependent negative feedback regulatory loop.
Materials and Methods
Materials
The mouse OPN promoter that included the 5′ sequence from nt −777 to nt +79 cloned into pXP2 plasmid encoding luciferase was kindly provided by Dr. David T. Denhardt (Rutgers University, New Brunswick, NJ). ANA-1 macrophages were a gift from Dr. George Cox (Uniformed Services University of the Health Sciences, Bethesda, MD).
Induction of NO synthesis in ANA-1 and RAW 264.7 macrophages
ANA-1 and RAW264.7 macrophages were maintained in DMEM with 10% heat-inactivated FCS, 100 U/ml penicillin, and 100 μg/ml streptomycin. LPS (100 ng/ml), IFN-γ (100 u/ml), or IL-1β (20 ng/ml) were used to induce NO synthesis. In selected instances, the competitive substrate inhibitor of NO synthase, l-NAME (40 μM), or the NO donor, S-nitroso-N-acetylpenicillamine (SNAP) (100 μM), or a combination of these compounds, was added. After incubation for 12 h at 37°C in 5% CO2, the supernatants and cells were harvested for assays.
Assay of NO production
NO released from cells in culture was quantified by measurement of the NO metabolite, nitrite (14). After stimulation, 50 μl of culture medium was mixed with 50 μl sulfanilamide (1%) in 0.5 N HCl. After a 5-min incubation at room temperature, an equal volume of 0.02% N-(1-naphthyl)-ethylenediamine was added. Following incubation for 10 min at room temperature, the absorbance of samples at 540 nm was compared with that of a NaNO2.
RNA preparation and Northern blot analysis
Total RNA was isolated from ANA-1 and RAW 264.7 macrophages using TRIzol reagent (Life Technologies, Rockville, MD). The RNA samples (10 μg/lane) were fractionated by electrophoresis on a 1% agarose formaldehyde gel and transferred to Hybond-C nylon membrane (Amersham Pharmacia Biotech, Piscataway, NJ). Hybridization using [32P]dATP-labeled probes was performed at 42°C for 18 h in ULTRA hybridization buffer (Ambion, Austin, TX). Following hybridization, filters were washed twice and subjected to autoradiography. cDNA probes were prepared by random primer labeling, followed by purification using a Sephadex G-50 mini-column (BioMax, Odenton, MD).
Differential screening of the subtracted cDNA library
SSH was performed as previously described (4, 5, 6). To identify genes differentially expressed in LPS-stimulated cells producing NO, RNA from LPS-treated cells was used as a “tester” and RNA from LPS plus l-NAME-treated cells was used as a “driver.” Differentially expressed sequences in subtracted cDNA were amplified by PCR to amplify only cDNA with different adaptors at both ends. Further enrichment was performed by a second PCR amplification with nested primers. The differentially expressed sequences were inserted into a T/A vector, pT-Adv cloning vector (Clontech, Palo Alto, CA). After a blue/white visual assay, PCR was used to rapidly amplify cDNA inserts. PCR products were blotted on nylon membrane (Hybond N+; Amersham Pharmacia Biotech). Following hybridization, positive clones were sequenced with the ABI PRISM 377 Genetic Analyzer (PE Applied Biosystems, Foster City, CA). Resulting sequences were compared with the GenBank database.
Immunoblot analysis
Protein was extracted from both cells and media. To determine the amount of secreted protein, media were centrifuged and concentrated using Microcon YM-10 (Amicon, Beverly, MA). To determine cellular expression of protein, the cells were detached using PBS, centrifuged, and lysed in buffer (0.8% NaCl, 0.02 KCl, 1% SDS, 10% Triton X-100, 0.5% sodium deoxycholic acid, 0.144% Na2HPO4, and 0.024% KH2PO4, pH 7.4); the lysate was centrifuged at 12,000 × g for 10 min at 4°C. Protein concentration was determined by absorbance at 560 nm using protein assay reagent (Bio-Rad, Richmond, CA). Ten micrograms of protein in each lane was separated by SDS-12% PAGE, and then the products were electrotransferred to polyvinylidene difluoride membrane (Amersham Pharmacia Biotech) for 60 min at 100 V. The membrane was blocked with 5% skim milk in PBS-0.05% Tween for 1 h at room temperature. After being washed three times, blocked membranes were incubated with the goat anti-mouse OPN Ab (R&D Systems, Minneapolis, MN) or rabbit anti-mouse iNOS Ab (Transduction Laboratories, Lexington, KY) for 1 h at room temperature, then washed three times in PBS-0.05% Tween and incubated with HRP-conjugated anti-goat-IgG (Santa Cruz Biotechnology, Santa Cruz, CA) for 1 h at room temperature. After an additional three washes, bound peroxidase activity was detected by the ECL detection system (Amersham Pharmacia Biotech).
Nuclear run-on assays
Macrophage nuclei were prepared in lysis buffer (10 mM Tris-HCl, pH 7.4, 10 mM NaCl, 3 mM MgCl2, and 0.5% Nonidet P-40) and pelletted at 500 × g. The nuclei (2 × 10⁷) were resuspended in 100 μl glycerol buffer, then 150 μCi of [α-32P]UTP (800 Ci/mmol) in 100 μl of 10 mM Tris-HCl (pH 8.0), 5 mM DTT, 5 mM MgCl2, 300 mM KCl, and 1 mM (each) ATP, CTP, and GTP were added for 30 min at 30°C with shaking. Labeled RNA was treated with 10 U RNase-free DNase I (Life Technologies) for 5 min at 30°C and extracted with phenol:chloroform (24:1) once and chloroform once. Before ethanol precipitation, 10 μg yeast tRNA was added, and labeled RNA was treated with 0.2 M NaOH for 10 min on ice. The solution was neutralized by the addition of HEPES (acid free) to a final concentration of 0.24 M. After ethanol precipitation, the RNA pellet was resuspended in 10 mM N-tris(hydroxymethyl)methyl-2-aminoethanesulfonic acid, pH 7.4, 0.2% SDS, and 10 mM EDTA. Target DNA was spotted onto nylon membranes with a slot blot apparatus; β-actin and pT-Adv vector served as positive and negative controls, respectively. Hybridization was performed at 42°C for 48 h with 5 × 10⁶ cpm of labeled RNA in hybridization buffer (50% formamide, 4× SSC, 0.1% SDS, 5× Denhardt’s solution, 0.1 M sodium phosphate, pH 7.2, and 100 μg/ml salmon sperm DNA). After hybridization, the membranes were washed twice at room temperature in 2× SSC and 0.1% SDS and three times at 56°C in 0.1× SSC and 0.1% SDS. The membranes were then exposed to x-ray film with an intensifying screen.
Transient transfection reporter assay
ANA-1 macrophage cells were transfected with the pXP2-OPN promoter by the calcium phosphate-DNA coprecipitation method. ANA-1 cells were plated onto 60-mm dishes at a density 6 × 10⁵ cell/dish; after 24 h, cells were transfected with the plasmid containing the pXP2-OPN promoter and pCMV.SPORT-βgal. The final amount of DNA added per dish was 8 μg of the OPN promoter reporter construct and 2 μg pCMV.SPOT-βgal. ANA-1 cells were incubated with LPS with or without l-NAME and/or SNAP for 12 h. The cells were harvested and lysed by scraping in a solution consisting of 25 mM Tris-phosphate, pH 7.8, 2 mM DTT, 2 mM 1,2-diaminocycloheane-N,N,N,N-tetracetic acid, 10% glycerol, and 1% Triton X-100. Luciferase activity was assayed using the Luciferase assay system kit (Promega, Madison, WI); β-galactosidase expression was determined using the β-galactosidase enzyme assay kit (Promega) at 420 nm with a MAXLINE microplate reader. Luciferase activity was normalized for transfection efficiency using β-galactosidase expression.
Statistical analysis
All data are presented as mean ± SEM of three or four experiments. Analysis was performed using a Students t test. Values of p < 0.05 were considered significant.
Results
LPS-NO dose-response relationship in ANA-1 and RAW 264.7 murine macrophages
ANA-1 macrophage production of NO in response to a 12-h incubation with LPS (0–10 μg/ml) was determined in the presence and absence of the competitive substrate inhibitor, l-NAME (40 μM) (Fig. 1). Nitrite levels in unstimulated control cells were 23.1 ± 3.3 nmol/mg. There was a significant concentration-dependent increase in media levels of nitrite, the NO metabolite, in response to LPS stimulation (ANOVA p = 0.001). In the presence of [LPS] = 100 ng/ml, nitrite production was 74 ± 5.6 nmol/mg. LPS plus l-NAME-treated cells exhibited levels of NO production that were not significantly from that of controls for all concentrations of LPS used. Nitrite levels from cells treated with l-NAME alone did not differ from that of unstimulated controls cells, 19.3 ± 2.9 nmol/mg vs 23.1 ± 3.3 nmol/mg (p = NS). In a similar fashion, RAW 264.7 macrophages also exhibited a significant concentration-dependent increase in nitrite following LPS stimulation (ANOVA p = 0.001). In the presence of [LPS] = 100 ng/ml, nitrite production in RAW 264.7 cells was 54 ± 6.7 nm/mg. Nitrite levels in unstimulated control cells were 15.1 ± 1.7 nmol/mg. LPS plus l-NAME-treated cells’ level of NO production was not significantly different from that of controls for all concentrations of LPS used. In subsequent assays, an LPS concentration of 100 ng/ml was used for both ANA-1 and RAW 264.7 cells, unless otherwise stated.

Effect of LPS stimulation on ANA-1 and RAW 264.7 macrophage NO production. Semilogarithmic plot of NO-LPS dose-response relationships. Nitrite production were determined in LPS-stimulated macrophages, as described in Materials and Methods (ANOVA for LPS alone, p = 0.0001; ∗, p < 0.01 LPS vs LPS plus l-NAME by Students t test for both ANA-1 and RAW 264.7).
Effect of LPS stimulation on ANA-1 and RAW 264.7 macrophage NO production. Semilogarithmic plot of NO-LPS dose-response relationships. Nitrite production were determined in LPS-stimulated macrophages, as described in Materials and Methods (ANOVA for LPS alone, p = 0.0001; ∗, p < 0.01 LPS vs LPS plus l-NAME by Students t test for both ANA-1 and RAW 264.7).
Differential expression of the OPN gene in ANA-1 and RAW 264.7 cells
Using SSH and Northern blot screening in ANA-1 cells, genes exhibiting greater than a 5-fold increase in expression in the presence of both LPS and NO were completely sequenced and queried against the National Center for Biotechnology Information GenBank database. One of these genes was found to be OPN. Northern blot analysis was performed to confirm that steady-state OPN mRNA expression was up-regulated in ANA-1 and RAW 264.7 cells in the setting of LPS-induced NO synthesis (Fig. 2). Baseline expression of OPN mRNA was found in unstimulated control cells. In the presence of LPS, OPN mRNA expression (1.5-kb band), normalized to that of β-actin, was increased ∼10-fold. Inhibition of NO production by addition of l-NAME to LPS-treated cells significantly decreased OPN mRNA expression to a level equivalent to that of controls. l-NAME alone did not alter OPN mRNA levels. When an exogenous source of NO, SNAP (50 μM), was then added with LPS plus l-NAME, normalized OPN mRNA expression was restored to a level not statistically different from that of LPS-treated cells. When NO alone, in the form of SNAP (50 μM), was delivered in the absence of LPS, OPN mRNA expression was not different from that of controls for both ANA-1 and RAW 264.7 macrophages (data not shown). These data indicate that LPS-mediated NO production is associated with significantly increased OPN mRNA expression in both ANA-1 and RAW 264.7 macrophages.

Northern blot analysis of OPN mRNA in ANA-1 and RAW264.7 macrophages. Northern blot analysis of OPN mRNA from ANA-1 and RAW 264.7 cells treated with LPS, LPS plus l-NAME, l-NAME, and LPS plus l-NAME plus SNAP for a period of 12 h, as described in Materials and Methods. Blot is representative of four experiments. Histogram representation of densitometric analysis of OPN mRNA expression normalized to β-actin mRNA (∗, p < 0.01 LPS vs control, l-NAME, and LPS plus l-NAME; ∗∗, p < 0.01 LPS plus l-NAME plus SNAP vs control, l-NAME, and LPS plus l-NAME by Students t test). Values are expressed as mean ± SEM of four experiments.
Northern blot analysis of OPN mRNA in ANA-1 and RAW264.7 macrophages. Northern blot analysis of OPN mRNA from ANA-1 and RAW 264.7 cells treated with LPS, LPS plus l-NAME, l-NAME, and LPS plus l-NAME plus SNAP for a period of 12 h, as described in Materials and Methods. Blot is representative of four experiments. Histogram representation of densitometric analysis of OPN mRNA expression normalized to β-actin mRNA (∗, p < 0.01 LPS vs control, l-NAME, and LPS plus l-NAME; ∗∗, p < 0.01 LPS plus l-NAME plus SNAP vs control, l-NAME, and LPS plus l-NAME by Students t test). Values are expressed as mean ± SEM of four experiments.
OPN protein expression
Immunoblot analysis was used to determine OPN protein expression in LPS-treated cells (Fig. 3). After 12 h of incubation, no immunoreactive OPN protein was found in cell lysates from any of the ANA-1 or RAW 264.7 treatment groups. In contrast, OPN protein (∼45 kDa) was detected in the cell culture medium of LPS-treated cells. Inhibition of NO synthesis by addition of l-NAME with LPS resulted in ablation of the secreted OPN protein. Restoration of NO levels by treatment of cells with LPS plus l-NAME plus SNAP resulted in detectable secreted OPN protein. In the ANA-1 cells treated with LPS plus l-NAME plus SNAP, the level of protein expression was only ∼60% of that noted in LPS-treated cells. In contrast, LPS plus l-NAME plus SNAP treatment normalized OPN protein expression in RAW 264.7 cells. Again, addition of SNAP alone did generate OPN protein secretion in either ANA-1 or RAW 264.7 cells. These data suggest that LPS-mediated NO production is associated with significantly increased OPN protein secretion in both ANA-1 and RAW 264.7 macrophages.

Immunoblot analysis of secreted OPN protein in LPS-stimulated ANA-1 and RAW 264.7 macrophages. Immunoblot analysis of secreted OPN protein from ANA-1 and RAW 264.7 macrophages treated with LPS, LPS plus l-NAME, l-NAME, and LPS plus l-NAME plus SNAP for a period of 12 h, as described in Materials and Methods. Blot is representative of four experiments. Histogram representation of densitometric analysis of OPN protein expression (∗, p < 0.01 LPS vs control, l-NAME, and LPS plus l-NAME; ∗∗, p < 0.01 LPS plus l-NAME plus SNAP vs control, l-NAME, and LPS plus l-NAME by Student’s t test). Values are expressed as mean ± SEM of four experiments.
Immunoblot analysis of secreted OPN protein in LPS-stimulated ANA-1 and RAW 264.7 macrophages. Immunoblot analysis of secreted OPN protein from ANA-1 and RAW 264.7 macrophages treated with LPS, LPS plus l-NAME, l-NAME, and LPS plus l-NAME plus SNAP for a period of 12 h, as described in Materials and Methods. Blot is representative of four experiments. Histogram representation of densitometric analysis of OPN protein expression (∗, p < 0.01 LPS vs control, l-NAME, and LPS plus l-NAME; ∗∗, p < 0.01 LPS plus l-NAME plus SNAP vs control, l-NAME, and LPS plus l-NAME by Student’s t test). Values are expressed as mean ± SEM of four experiments.
The time-dependent response of cellular iNOS and secreted OPN protein expression was then determined in ANA-1 cells (data not shown). Macrophage iNOS protein expression was initially detected following 4 h of LPS treatment; peak iNOS expression was noted at 8–12 h of stimulation. Following 24 h, only trace immunoreactive iNOS protein was found. In contrast, secreted OPN protein lagged that of iNOS. OPN protein was detected after 12 h of LPS treatment with significant diminution of expression thereafter. This pattern is consistent with the hypothesis that LPS-stimulated NO expression induces OPN production and secretion following an 8-h lag. The LPS concentration dependence of secreted OPN protein expression was also determined. Densitometric analysis indicates that OPN protein expression was maximal at LPS concentrations of 25 and 50 ng/ml after 12 h of incubation.
SNAP and OPN expression in ANA-1 and RAW 264.7 cells
To determine the effect of exogenous NO in the absence of an iNOS induction agent, such as LPS, SNAP (50 μM) was added to ANA-1 and RAW 264.7 cells for a 12-h incubation period (data not shown). In both cell lines, unstimulated controls and SNAP-treated cells did not exhibit iNOS mRNA or protein expression. Control and SNAP expression of OPN mRNA did not differ, and there was no detectable secreted OPN protein in either control or SNAP cells. These data indicate that exogenous NO alone cannot induce OPN mRNA or protein expression in either ANA-1 or RAW 264.7 cells.
OPN gene transcription in ANA-1 and RAW 264.7 cells
Nuclear run-on analysis was performed to determine whether the NO-mediated increase in OPN mRNA levels was the result of increased gene transcription in ANA-1 and RAW 264.7 cells (Fig. 4). The OPN transcriptional signal was normalized with the β-actin-positive control. Baseline OPN gene transcription was found in control cells. In the presence of LPS, OPN gene transcription was increased by over 7- and 6-fold in ANA-1 and RAW 264.7 cells, respectively (p < 0.01 vs control). In LPS plus l-NAME-treated cells in which NO production was ablated, OPN gene transcription was not different from that of controls. OPN gene transcription was then restored when SNAP was added with LPS plus l-NAME (p = NS, LPS vs LPS plus l-NAME plus SNAP). As expected, no signal was noted in the negative control, PT-Adv. In ANA-1 macrophages, the half-life of OPN mRNA was measured in the presence of actinomycin D (50 μg/ml)-associated inhibition of global gene transcription. There was no difference in mRNA half-life detected between the control and LPS treatment groups (data not shown). These data indicate that the NO-mediated increase in OPN mRNA expression was the result of increased OPN gene transcription.
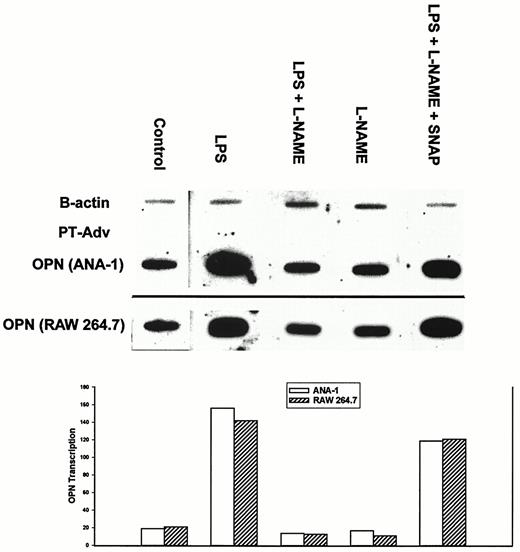
Effect of LPS-induced NO production on OPN gene transcription in ANA-1 and RAW 264.7 macrophages. ANA-1 and RAW 264.7 macrophages were treated with LPS, LPS plus l-NAME, l-NAME, and LPS plus l-NAME plus SNAP for a period of 12 h. Target DNA for murine OPN was amplified by PCR based upon the published sequence. β-actin and pT-Adv DNA served as positive and negative controls, respectively. Blot is representative of three experiments. The histogram is representation of LPS-induced OPN gene transcription normalized to β-actin.
Effect of LPS-induced NO production on OPN gene transcription in ANA-1 and RAW 264.7 macrophages. ANA-1 and RAW 264.7 macrophages were treated with LPS, LPS plus l-NAME, l-NAME, and LPS plus l-NAME plus SNAP for a period of 12 h. Target DNA for murine OPN was amplified by PCR based upon the published sequence. β-actin and pT-Adv DNA served as positive and negative controls, respectively. Blot is representative of three experiments. The histogram is representation of LPS-induced OPN gene transcription normalized to β-actin.
OPN promoter transient transfection analysis
To determine whether increased OPN gene transcription is the result of increased OPN promoter activity, transient transfection analysis was performed in ANA-1 cells using a plasmid construct in which the 856-bp OPN promoter was cloned upstream from a luciferase reporter gene (Fig. 5). Luciferase activity was normalized to that of β-galactosidase activity determined following cotransfection of a β-galactosidase-CMV promoter plasmid construct. In the presence of LPS, normalized luciferase activity was 7-fold greater than that of unstimulated controls (p < 0.01). OPN promoter activity in LPS plus l-NAME-treated cells was not significantly different from that of control or l-NAME-treated cells. Restoration of NO levels in LPS plus l-NAME plus SNAP-treated cells resulted in luciferase activity that was 4-fold greater than that of controls (p < 0.01). Interestingly, luciferase activity in LPS-treated cells was significantly greater by ∼40% than that noted in LPS plus l-NAME plus SNAP-treated cells (p < 0.05). These results suggest that LPS-induced NO production increases OPN promoter activity with resultant increases in OPN mRNA and secreted protein levels.

Effect of LPS-mediated NO production on activity of OPN promoter plasmid transfected into ANA-1 cells. The histogram is representation of luciferase activity normalized to β-galactosidase activity from cotransfected pCMV.SPORT-βgal-induced activity (∗, p < 0.01 LPS vs control, LPS plus l-NAME, and l-NAME; ∗∗, p < 0.01 LPS plus l-NAME plus SNAP vs control, LPS plus l-NAME, and l-NAME by Students t test). Values are expressed as mean ± SEM of three experiments.
Effect of LPS-mediated NO production on activity of OPN promoter plasmid transfected into ANA-1 cells. The histogram is representation of luciferase activity normalized to β-galactosidase activity from cotransfected pCMV.SPORT-βgal-induced activity (∗, p < 0.01 LPS vs control, LPS plus l-NAME, and l-NAME; ∗∗, p < 0.01 LPS plus l-NAME plus SNAP vs control, LPS plus l-NAME, and l-NAME by Students t test). Values are expressed as mean ± SEM of three experiments.
IFN-γ- and IL-1β-mediated NO production induces OPN expression
To determine whether NO-mediated OPN expression was LPS specific, ANA-1 murine macrophages were stimulated to produce NO by incubation with IFN-γ (100 U/ml) or IL-1β (20 ng/ml). The concentrations of IFN-γ and IL-1β were chosen to induce NO synthesis in concentrations comparable to that seen with [LPS] = 100 ng/ml. Media levels of nitrite were determined following a 12-h incubation. Unstimulated control cells produced 18.1 ± 1.2 nmol nitrite/mg protein. NO production was significantly increased in the presence of LPS, IFN-γ, and IL-1β: 74 ± 5.6 nmol/mg, 64.8 ± 4.7 nmol/mg, and 66.1 ± 3.8 nmol/mg, respectively (p < 0.01 vs control for LPS, IFN-γ, and IL-1β). Addition of l-NAME with LPS, IFN-γ, or IL-1β ablated NO production to a level that was not statistically different from that of control cells. These data indicate that LPS, IFN-γ, and IL-1β can each induce NO production in ANA-1 macrophages.
Northern blot analysis was then performed (Fig. 6). OPN mRNA was detected in control cells. Stimulation with LPS, IFN-γ, or IL-1β resulted in a 9-, 10-, and 9-fold increase in normalized OPN mRNA expression, respectively (p < 0.01 vs control for LPS, IFN-γ, and IL-1β). Ablation of NO synthesis by addition of l-NAME with LPS, IFN-γ. or IL-1β resulted in a decrease in OPN mRNA to a level equivalent to that of unstimulated controls. Reconstitution of NO levels by addition of SNAP (50 μM) with l-NAME to LPS-, IFN-γ-, or IL-1β-treated cells restored OPN mRNA expression to levels that were equivalent to those noted in the presence of LPS, IFN-γ, or IL-1β alone. Immunoblot analysis was then performed to determine levels of secreted OPN protein (Fig. 7). The pattern of protein expression paralleled that of OPN mRNA expression. No secreted OPN protein was found in unstimulated controls. LPS, IFN-γ, or IL-1β stimulation was associated with detectable OPN in the culture media. Again, addition of l-NAME with LPS, IFN-γ, or IL-1β resulted in ablation of the OPN protein signal. Secreted OPN protein was then restored when SNAP was added with l-NAME and LPS, IFN-γ, or IL-1β. These data indicate that endogenous NO synthesis, induced by LPS, IFN-γ, or IL-1β, is associated with OPN mRNA expression and protein secretion. However, NO alone will not induce OPN; a second signal transduction pathway that is common to LPS, IFN-γ, and IL-1β is required.

Northern blot analysis of ANA-1 macrophages stimulated by IFN-γ and IL-1β. Northern blot analysis of OPN mRNA from ANA-1 with IFN-γ or IL-1β in the presence or absence of l-NAME and SNAP for a period of 12 h, as described in Materials and Methods. Blot is representative of three experiments.
Northern blot analysis of ANA-1 macrophages stimulated by IFN-γ and IL-1β. Northern blot analysis of OPN mRNA from ANA-1 with IFN-γ or IL-1β in the presence or absence of l-NAME and SNAP for a period of 12 h, as described in Materials and Methods. Blot is representative of three experiments.

Immunoblot analysis of ANA-1 macrophages stimulated by IFN-γ and IL-1β. Immunoblot analysis of OPN mRNA from ANA-1 with IFN-γ or IL-1β in the presence or absence of l-NAME and SNAP for a period of 12 h, as described in Materials and Methods. Blot is representative of three experiments.
Immunoblot analysis of ANA-1 macrophages stimulated by IFN-γ and IL-1β. Immunoblot analysis of OPN mRNA from ANA-1 with IFN-γ or IL-1β in the presence or absence of l-NAME and SNAP for a period of 12 h, as described in Materials and Methods. Blot is representative of three experiments.
OPN and macrophage NO production
The functional correlate of NO-mediated up-regulation of OPN synthesis in endotoxin-stimulated ANA-1 macrophages was analyzed (Fig. 8). The hexapeptide, GRGDSP, blocks binding of RGD-containing proteins, such as OPN, to cell surface integrins (13). GRGDSP was used to determine the role of secreted OPN in the setting of LPS-induced NO synthesis. In comparison to unstimulated controls, GRGDSP (0–10 nM) was found to increase LPS (100 ng/ml)-mediated nitrite production by over 2-fold in a concentration-dependent fashion (ANOVA, p = 0.0001). The converse experiment was also performed by adding exogenous OPN protein (0–10 nM) with LPS to ANA-1 cells. In this setting, exogenous OPN was found to maximally decrease nitrite levels by over 50% (ANOVA, p = 0.0001). These data indicate that endogenously synthesized OPN secreted into the extracellular milieu can act to decrease LPS-mediated NO synthesis. The time course of the GRGDSP-mediated increase in LPS-stimulated NO production was evaluated using [GRGDSP] = 0, 0.1, 1.0, 5.0, and 10 nM (Fig. 9). There was a GRGDSP concentration- and time-dependent increase in NO production. Increasing GRGDSP concentration was associated with increased NO production. Maximal NO production was seen in cells treated with 10.0 nM GRGDSP following 18–24 h of incubation. These data suggest that blockade of the OPN integrin cell surface receptor with GRGDSP increases ANA-1 macrophage NO production.
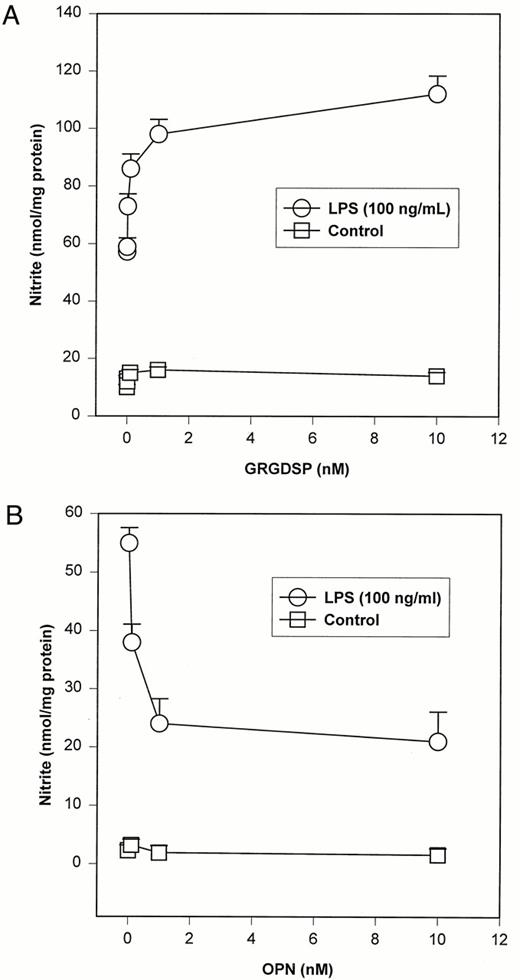
LPS-induced NO production in the presence of exogenous GRGDSP or OPN. A, Dose-response relationship between NO production and GRGDSP (0–10 nM) (ANOVA, p = 0.0001 for LPS). LPS and GRGDSP were added simultaneously. Cells were incubated for a period of 12 h. Values are expressed as mean ± SEM of three experiments. B, Dose-response relationship between NO production and OPN (0–10 nM) (ANOVA, p = 0.0001 for LPS). LPS and OPN were added simultaneously. Cells were incubated for a period of 12 h. Values are expressed as mean ± SEM of three experiments.
LPS-induced NO production in the presence of exogenous GRGDSP or OPN. A, Dose-response relationship between NO production and GRGDSP (0–10 nM) (ANOVA, p = 0.0001 for LPS). LPS and GRGDSP were added simultaneously. Cells were incubated for a period of 12 h. Values are expressed as mean ± SEM of three experiments. B, Dose-response relationship between NO production and OPN (0–10 nM) (ANOVA, p = 0.0001 for LPS). LPS and OPN were added simultaneously. Cells were incubated for a period of 12 h. Values are expressed as mean ± SEM of three experiments.
![FIGURE 9. Time dependence of a GRGDSP-mediated increase in LPS-induced NO production (ANOVA, p = 0.0001 for all values of [GRGDSP]). Values are expressed as mean of three experiments.](https://aai.silverchair-cdn.com/aai/content_public/journal/jimmunol/166/2/10.4049_jimmunol.166.2.1079/3/m_im0211693009.jpeg?Expires=1716313353&Signature=frCp-2Q~lfXQzlg6EAfMXBhnjFVUs6wZRx2q71FlMna~ib~ZHPyRKaah~uaZG-HZW61x~Te-srb8pEjwOvh7qKnlCFryuLX6mZe9FU2amPk6U~suVsERmEHmSTJRkGkf39orLuiezuh1kGlekRGTV7Ajg3tdgDO~L8MJrwmcVCHHGtXAn3aqfums68SN0gxUanTDscYwPVDTewaf9JY8LI0V5OOOnti3qw5KU6djfz644BZenJ9lNl7QzkKL8rFHidgQJnbuE0TFPvhDATk~huy3ysjOOSYhbMIb0~5HIYZymeo48u1wqyp~npUeK8PWfDd1a3zY49dTQJNz5egZ-w__&Key-Pair-Id=APKAIE5G5CRDK6RD3PGA)
Time dependence of a GRGDSP-mediated increase in LPS-induced NO production (ANOVA, p = 0.0001 for all values of [GRGDSP]). Values are expressed as mean of three experiments.
Time dependence of a GRGDSP-mediated increase in LPS-induced NO production (ANOVA, p = 0.0001 for all values of [GRGDSP]). Values are expressed as mean of three experiments.
Discussion
The technique of SSH allows isolation of differentially expressed cDNA clones from two RNA populations. In this study, we initially compared two populations of ANA-1 macrophages treated with LPS and LPS plus l-NAME, respectively. Using SSH, the OPN gene was found to be differentially expressed in the setting of LPS-stimulated NO production. Northern blot analysis in ANA-1 and RAW 264.7 cells confirmed that OPN mRNA expression was increased by over 10-fold in the presence of both LPS and NO. Nuclear run-on analysis demonstrated that increased transcription, rather than increased mRNA half-life, is the underlying mechanism for increased steady-state OPN mRNA levels in LPS-treated cells. In the presence of LPS and NO, OPN protein was also found to be significantly elevated in the cell culture media from both cell lines. Interestingly, OPN protein was not found in cell lysates from both unstimulated controls and LPS-treated cells. Induction of NO synthesis in ANA-1 cells with the proinflammatory cytokines, IFN-γ or IL-1β, was also associated with increased expression of OPN mRNA and protein. Delivery of NO alone in the form of SNAP did not induce OPN expression. This suggests that OPN expression is dependent upon NO and a second signal transduction pathway common to LPS, IFN-γ, and IL-1β. Transient transfection studies using an OPN promoter construct indicate that OPN promoter activity is significantly increased in the presence of LPS and NO. Finally, addition of a competitive inhibitor of OPN receptor binding resulted in a significant concentration- and time-dependent increase in LPS-induced NO synthesis. Conversely, exogenous OPN added at the time of LPS treatment also decreased NO production be over 50%. These results suggest that NO production acts through the OPN promoter to up-regulate OPN gene transcription and protein synthesis. NO may then feedback regulate its own production, in part, through induction of OPN synthesis.
OPN is a highly hydrophilic and negatively charged sialoprotein of ∼298 aa that contains a Gly-Arg-Gly-Asp-Ser sequence. It is a secreted protein with diverse regulatory functions, including cell adhesion and migration, tumor growth and metastasis, atherosclerosis, aortic valve calcification, and repair of myocardial injury. Its expression is tissue specific and subject to regulation by many factors (7, 15, 16, 17, 18). Constitutive expression of OPN is found in bone, kidney, placenta, and nerve cells. Induced expression of OPN is found in T cells, epidermal and bone cells, and macrophages in response to PMA, 1,25-dihydroxyvitamin D, basic fibroblast growth factor, TNF-α, IL-1, IFN-γ, and endotoxin. Interestingly, OPN and iNOS are induced in response to the many of the same agents, such as TNF-α, IL-1β, IFN-γ, and LPS (1, 19).
Recently, the relationship between NO and OPN has been examined by a number of investigators. Rollo et al. (10) demonstrated that exogenous recombinant OPN protein was effective in blocking RAW264.7 murine macrophage NO production and cytotoxicity toward the NO-sensitive mastocytoma cells. Their work suggested that OPN in extracellular fluid may protect certain tumor cells from macrophage-mediated destruction by inhibiting the synthesis of NO. However, these authors did not attempt to localize a potential cellular source for OPN in this setting (10). Singh et al. (11, 13) reported that a synthetic 20-aa OPN peptide analogue decreased iNOS mRNA and protein levels in ventricular myocytes and cardiac microvascular endothelial cells. Transfection of cardiac microvascular endothelial cells with an antisense OPN cDNA increased iNOS mRNA in response to IL-1β and IFN-γ, suggesting that endogenous OPN inhibits NO production (11, 13). Lastly, using an Ab directed against the OPN αVβ3 integrin receptor, Attur and coworkers demonstrated that ligand binding results in a trans-dominant inhibition of NO production in human cartilage (20). Hwang and colleagues found that OPN suppressed NO synthesis induced by IFN and LPS in primary mouse kidney proximal tubule epithelial cells, suggesting a regulatory role for OPN in the NO signaling pathway (21). These studies clearly demonstrate that endogenous OPN can inhibit induction of iNOS and that OPN is an important regulator of the NO signaling pathway and NO-mediated cytoregulatory processes. However, the converse relationship, the role of NO in the induction of OPN synthesis, has not been well studied.
In this study, we demonstrate that NO feedback regulates its own production by up-regulating OPN promoter activity in this murine macrophage model of endotoxin-mediated expression of iNOS. Recently, Takahashi and colleagues (22) also demonstrated that OPN mRNA expression is increased by IFN-LPS-induced NO production in RAW 264.7 cells. However, the effect of NO upon OPN transcription was not assessed (22). Although the regulation of iNOS has been examined at many levels, little is known of its negative feedback regulatory systems. In the mouse macrophage cell line RAW 264.7, Albakri and Stuehr (23) have shown that endogenously produced NO inhibits posttranslational assembly of dimeric iNOS by down-regulating heme insertion and availability. In addition, NO can directly inhibit catalysis by binding to the iNOS heme iron to form an inactive iron-nitrosyl complex (23). Subsequently, Park and colleagues have shown that NO inhibits DNA binding of NF-κB, an essential transcription factor, and down-regulates iNOS gene transcription (24). In this regard, we have demonstrated that NO S-nitrosylates a key active site cysteine residue in the NF-κB p50 DNA binding domain and inhibits subsequent DNA binding and iNOS promoter activity in ANA-1 macrophages (25, 26). Recently, Ratovitski and colleagues have used the yeast two-hybrid screening technique to isolate two proteins that interact with iNOS to prevent iNOS homodimer formation: NAP110 and kalirin (2, 3). Unfortunately, it is currently unknown whether NO itself induces increased production of these regulatory proteins. The presence of a system of NO-mediated regulation of iNOS suggests potential targets for modulation of the NO-dependent components of the inflammatory response.
A number of features of this OPN-iNOS regulatory system remain to be clarified. The specific signaling pathway by which OPN binding to αVβ3 integrin receptors ultimately modulates NO synthesis in endotoxin stimulated macrophages is unclear. The human αVβ3 integrin receptor was originally identified as a heterodimeric molecule with vitronectin binding activity. Subsequent studies indicate that it has a broad binding specificity and can mediate binding to fibronectin, fibrinogen, and thrombospondin (18). RGD-containing peptides and proteins modulate [Ca2+] transients in osteoclasts (16). Osteopontin stimulates gelsolin-associated src activity, leading to increased gelsolin-associated phosphatidylinositol 3-kinase activity and phosphatidylinositol-(3, 4, 5)-trisphosphate levels, which facilitate actin filament formation, osteoclast motility, and bone resorption (15, 16, 17). The equivalent pathway in macrophages has not been extensively characterized. In a similar fashion, the mechanism by which LPS and NO up-regulate OPN promoter activity is also unclear. Analysis of the murine OPN promoter demonstrates the presence of potential binding sites whose corresponding transcription factor activities are modified by NO, such as AP-1 (15). NO may induce binding of NO-sensitive transcription factors to the promoter or an enhancer region. Alternatively, NO and LPS may induce changes in the secondary and tertiary structure of the promoter. Studies addressing transcription factor binding are ongoing in our laboratory.
This study demonstrates that OPN inhibits NO production in the setting of endotoxin stimulation. OPN promoter activity and gene transcription are significantly up-regulated in the presence of LPS-mediated NO production. The existence of OPN as an example of an NO-dependent negative feedback regulatory mechanism is unique. In addition, the αVβ3 integrin receptor appears to transduce an inhibitory signal for the down-regulation of LPS-induced NO synthesis. Inhibition of αVβ3 integrin receptor-mediated functions may serve to be a potential target for future therapeutic interventions for inflammatory conditions.
Footnotes
This work was supported by the American College of Surgeons Clowes Award and National Institutes of Health Grant AI 44629 (to P.C.K.).
Abbreviations used in this paper: iNOS, inducible NO synthase; SSH, suppression subtractive hybridization; l-NAME, NG-nitro-l-arginine methyl ester; SNAP, S-nitroso-N-acetylpenicillamine; OPN, osteopontin.
