


Abstract
The long, shallow, parallel grooves that cut across the surface of the Martian moon Phobos remain enigmatic, with distinct implications for understanding the evolution of loose airless soils and the origin of Mars and its satellites. Phobos orbits deep inside the fluid Roche limit and is gradually spiraling in, creating global tidal strain, which leads to a model in which orbital decay is driving the formation of surface grooves on Phobos. Here we test this model by simulating the extension of a mildly cohesive regolith shell, driven by Phobos's tidal strain imposed by orbital migration. Modeling Phobos as a rubble-pile interior overlaid by a cohesive layer, we find that the tidal strain could create parallel fissures with regular spacing, depending on the latitude and longitude. Fracture opening triggers drainage of upper loose material into these deep-seated valleys, which we show could lead naturally to the formation of groove-like structures. We map the prominent linear depressions on Phobos and find that some at midlatitudes correlate with the model-predicted groove orientations. Our analysis supports a layered heterogeneous structure for Phobos with possible underlying failure-induced fractures, as the precursor of the eventual demise of the de-orbiting satellite. However, we do observe significant areas showing absences and anomalies that are not consistent with the tidal fracturing model. The in situ observations on Phobos by the Mars Moons eXploration mission will conclusively determine the origin of its enigmatic striations.
Export citation and abstract BibTeX RIS

Original content from this work may be used under the terms of the Creative Commons Attribution 4.0 licence. Any further distribution of this work must maintain attribution to the author(s) and the title of the work, journal citation and DOI.
1. Introduction
Phobos, the 22 km diameter innermost moon of Mars, orbits only 6000 km above the planet and is gradually spiraling in as a result of tides. Unlike Deimos, half its size and much farther from Mars, Phobos has developed a striking pattern of parallel linear features running over its surface (Thomas et al. 1979). These "grooves," typically 100–200 m wide and 10–30 m deep (Basilevsky et al. 2014), have experienced a long history since their origin and thus stand as records of past and ongoing geological processes at the local, regional, and global scale. Morphological analysis shows many of Phobos's linear features to be aligned with the satellite's intermediate axis (the tangent to its orbit), maintaining a mostly parallel orientation, within a few degrees, over tens of kilometers (Thomas et al. 1979). Groove widths and spacings are relatively homogeneous, reminiscent of extensional fractures in a uniform-thickness brittle layer (Hurford et al. 2016). However, there are anomalies near the leading side where different parallel collections of grooves crosscut each other (Basilevsky et al. 2014). In contrast, the zone about 50° wide centered around the trailing apex is almost devoid of grooves (Murray & Heggie 2014). Close-up images (Figure 1(a)) show that they vary in their geomorphologies. While some feature an irregular, roughly aligned string of separate pits with changing diameters and raised rims, resembling secondary crater chains (catenae; Nayak & Asphaug 2016), most appear to consist of coalescing crateriform depressions with similar sizes that have smooth concave-up cross profiles with scalloped or almost linear margins, analogous to pit chains or elongated grabens (Horstman & Melosh 1989; Wyrick et al. 2004).
Figure 1. Groove formation in response to the tidal orbital decay of Phobos. (a) Linear depressions cutting across Phobos's surface (ESA/DLR/FU Berlin). (b) Our simulated Phobos is a weak rubble pile covered by an exterior regolith that consists of a cohesive layer (blue) mantled by a shallow loose granular layer (white), as highlighted in the inset. Blue arrows indicate tidal forces exerted by Mars, and red patches represent the 23 local areas that we have simulated. Our simulations force the deformation of these patches to mimic the reshaping of Phobos as it spirals inward. (c) As the cells are stretched and compressed (top), fractures occur as indicated by abruptly accelerated regolith particles. (d) A parallel pattern of grooves and accompanying subsurface fractures develops over a regular spacing. The failure orientation is generally perpendicular to the direction of local principal tensile stress. The morphology and pattern of these extensional depressions are commensurate with some linear grooves on Phobos. Data shown are for the patch located at 60° N and 0° E with the cohesion strength c p = 36 kPa. An animation of panel (d) is available in the online journal that shows the tidal grooving process more clearly. The real-time duration of the animation is 29 s.
(An animation of this figure is available.)
Download figure:
Video Standard image High-resolution imageExogenic explanations have been proposed for Phobos grooves, such as pitting of regolith by impact-excavated boulders (Ramsley & Head 2017, 2019), re-accretion of escaping ejecta from larger craters formed on Phobos (Nayak & Asphaug 2016), and ejecta streamers from Mars cratering impacts (Murray et al. 1994; Murray & Heggie 2014). There have also been endogenic explanations, namely, volatile discharge through impact fractures (Thomas & Veverka 1979), or tidal stress due to orbital decay pulling the moon apart (Soter & Harris 1977). In the case of an orbital-decay-induced fracturing of the surface, it seems impossible to account for the buildup of failure stress to initiate surface rupture assuming an internally homogeneous Phobos, principally because the groove orientations do not line up simply with the body stress (Dobrovolskis 1982). Instead, they appear to align with the field of accumulating surface deformation that arises as Phobos migrates closer to Mars, becoming increasingly ellipsoidal under greater tidal forcing. For models starting with a weak interior covered in a layer of regolith with lunar-like properties, Hurford et al. (2016) show that the tidal deformation mechanism agrees well with the measured groove geometry, over significant regions of Phobos. However, whether such a surface-tectonic mechanism could produce parallel linear markings on Phobos's surface remains unclear, and the low and irregular gravitational potential (surface gravity ∼1/300 that of the Moon) is a challenge to the traditional interpretation of tectonic landforms (Morrison et al. 2009; Watters et al. 2011).
Here we take a more detailed look at the problem, by modeling explicitly in 3D the stretching and squeezing of a realistic granular regolith experiencing this kind of tidal evolution, to test the tidal fracturing model as the origin of Phobos grooves. As in Hurford et al. (2016), we assume a weak interior, with a rupturable cohesive layer above that. We also envision an uppermost layer of very loose material and then examine what happens to this two-layer regolith when Phobos is de-orbited and its weak interior changes equilibrium shape as a result of tides. We show how the cohesive layer undergoes rupture and how the upper loose regolith then drains into these open fissures, forming geological striations that are a good match to some observations. Regimes and modes of granular failure are analyzed to deduce the critical cohesion strength required for the formation of grooves with the observed parallel patterns. We further discuss the implications of the results in connection with Phobos's structure and evolution. We note that significant areas of Phobos are not consistent with the model-predicted results. But our simulations do demonstrate the possibility that some of the groove regions on Phobos could be surface expressions of deeper hidden crevices opened by the tidal stresses during its orbital decay. A more detailed study focusing on these mismatches would be a suitable application of the higher-resolution topographic data anticipated from future Phobos missions, which may conclusively determine the origin of these enigmatic striations.
2. Methods
2.1. Tidal Stresses on Phobos
A layered heterogeneous structure is adopted for Phobos to predict its tidal response as shown in Figure 1(b). The Phobos interior is represented as a weak core, barely holding together as a mechanical rubble pile, surrounded by layers of regolith represented by discrete particles. This highly damaged, weak interior structure is consistent with density data in Andert et al. (2010) and gravity data in Guo et al. (2021). The weak interior allows stress from the increasing tidal field to readily deform the interior, thereby forcing the outer regolith to reshape and experience surface ruptures (Hurford et al. 2016). Note that the friction forces between constituent gravels can provide enough structural strength for this cohesionless granular body to remain intact inside the fluid Roche limit. The outer regolith consists of a cohesive subsurface layer (100 m) and an upper loose layer (50 m), consistent with structural interpretations of asteroids Ryugu (Arakawa et al. 2020) and Bennu (Barnouin et al. 2019).
Phobos is tidally evolving on a timescale of tens of millions of years, based on the exchange of angular momentum with Mars. The orbital migration dynamics of Phobos is derived in Appendix A, which, combined with its possible initial positions, can be used to reconstruct the orbital history of Phobos since its origin (see Appendix B). For the proposed layered structure for Phobos, we adopt a thin-shell spherical approximation as suggested in Kattenhorn & Hurford (2009) and Hurford et al. (2016) to calculate the surface tidal stresses exerted by its evolving global shape due to orbital decay (see Appendix C). The evolving stress field is then applied to the surface regolith to predict the response of Phobos driven by its tidal deformation.
2.2. Soft-sphere Discrete-element Model
To explicitly model the particle dynamics of granular regolith during the tidal deformation processes, we perform discrete-element simulations using an original soft-sphere discrete-element model code DEMBody (Cheng et al. 2019, 2020), which is capable of accurately simulating the complex behavior of particle–particle and particle–boundary interactions. In this code, the nonlinear contact forces between two contacting objects (sphere–sphere, sphere–wall) are calculated based on Hertz–Mindlin–Deresiewicz contact theory (Somfai et al. 2005) according to the particle overlaps (typically <1% of their reduced radii). The implementation of SSDEM in DEMBody consists of four components in the normal, tangential, rolling, and twisting directions, which indicate the elastic forces, damping resistances, and frictions in contact point (Cheng et al. 2018). A friction coefficient μ is used to control the stick-slip Coulomb friction between colliding particles, and a shape parameter β, which represents a statistical measure of real particle nonsphericity, controls the rotational resistance to relative motions in rolling and twisting directions (Jiang et al. 2015). A second-order leapfrog integrator with a time step of 0.02 s is used for integration of the equations of motion of the granular system. Note that the shear failure of a granular system is triggered by microscopic sliding or rolling between particles in contact; therefore, the combination of the above two friction coefficients controls the overall friction angle of granular materials. A dry cohesion model, parameterized by an interparticle cohesive strength c p , is adopted to mimic the weak attractive force within granular regolith (Zhang et al. 2018). The contact between the two particles will break if the external tensile force along the normal direction exceeds the cohesive force; therefore, the interparticle cohesive strength c p stands for the macroscopic tensile strength of granular materials.
The mechanical properties of Phobos's surface are basically unknown; however, some remote-sensing observations and laboratory experiments can help constrain the parameter space (Ballouz et al. 2019). Radar albedo data in Busch et al. (2007) imply a near-surface porosity of Phobos's regolith of at least 40% ± 10%. Photogrammetric measurements show that the steepness of local slopes on Phobos's surface can reach 30°–40° (Basilevsky et al. 2014). We thus set μ and β to 0.6 and 0.6, respectively, corresponding to sand particles with medium hardness and material friction angle of ∼30° as determined by laboratory tests (Jiang et al. 2015). The free parameter c p is used to adjust the material tensile strength T, ranging from c p = 0 to 48 kPa. Note that c p is the microcohesion between contacting particles, while T is the macroscopic tensile strength of granular materials.
2.3. Simulation Setup
Considering the expansive parameter space and significant computational expense per run, we restrict our simulations to 23 local regolith patches across the surface of Phobos as shown in Figure 1(b), rather than simulating the global outer layer. We set up simulations of regolith beds with length of 800 m, width of 800 m, and height of 150 m initially. The regolith layers have an initial porosity of 40% and are made up of 3,576,846 grains with material density of 2.8 g cm−3 and radii between 1.0 and 2.0 m (Andert et al. 2010). The particle size distribution is selected to allow numerically resolvable groove structures to develop in a reasonable runtime (∼10 days), which is a compromise between simulation accuracy and computational efficiency. Once the granular bed settles down under the Phobos gravity (0.57 cm s−2), particles with initial height below 100 m are set to be cohesive with corresponding cohesive strength c p , and the whole system is then allowed to re-equilibrate to remove possible local disturbances. Deformable periodic boundary conditions (DPBCs) are imposed on the simulated patch in the directions perpendicular to the initial local gravity vector to allow the grains to deform freely in an unconfined environment as suggested by Ballouz et al. (2019). DPBCs are implemented by replicating a patch of particles in the horizontal directions. Each replicated patch contains "ghost" particles that match the relative positions of the original particles. The sizes of the simulated patch in the x- and y-directions are adjusted according to the corresponding deformation velocities. In addition, for continuity, when a particle crosses one of the deformable boundaries, its velocity component in this direction is modified to account for the cell deformation. Therefore, depending on whether it crosses over in the direction of increasing coordinates or vice versa, its velocity component in this direction will be adjusted by ±2 vdeform, where vdeform is the deforming velocity of the patch boundary that the particle crosses.
After this setup process, the simulation patch is expanded and/or shrunk gradually in the directions of local principle stresses, mimicking the deformation of the regolith layer as Phobos's global shape evolves owing to orbital migration toward Mars. For simplicity, the gravity in each patch is assumed to remain constant in the normal direction during deformation.
The deforming velocities vdeform of patch boundaries are determined by the corresponding local tidal stresses, specifically the ratio of principle strain rates derived from the tidal stress field given by the thin-shell model (see details in Appendix A). Figure 1(c) gives an example of the biaxially deformable periodic boundaries used for the modeled patch located at 60° N and 0° E.
As for varying the strength, we used nine different values of cohesion, but only for those of the 23 patch locations that had the most differing stress ratios. Considering the computational cost per simulation, for patch locations with similar stress ratios only one simulation was performed, c p = 36 kPa, allowing for across-the-board comparison, for a total of ∼100 simulations.
3. Results
3.1. Particle Dynamics of Tidal Fracturing and Draining
We take the patch located at 60° N and 0° E with c p = 36 kPa as a representation to detail the fracturing and draining dynamics of the granular beds during the tidal deformation process (see the animation embedded in Figure 1). The regolith patch is forced to reshape, as described above, and accumulates failure stresses on external loading. The cohesive layer deforms elastically at first. When the tensile yield strength T is exceeded, interparticle bonds fail and break, exhibiting quasi-brittle behavior. Parallel fractures are resolved, which initiate with nearly linear traces over a uniform spacing, whose appearance is slightly corrugated and oriented perpendicular to the extension direction. This regular organized pattern resembles the transverse crevasses on terrestrial glaciers under tensile stresses (Colgan et al. 2016), but here for much weaker materials in much lower gravity. As these cracks open up, the failure stresses intensify at the front of the fracture tip (Bassis & Jacobs 2013) and eventually overcome the overburden pressure. Therefore, new microcracks nucleate ahead of the tip and propagate downward perpendicular to the principal tensile stresses, forming a set of subvertical opening mode fissures, as shown in Figure 1(d).
Where fracture openings occur beneath unconsolidated surface material, they cause subsidence of the overlying loose sands into the crevice-generated void space (Horstman & Melosh 1989; Ferrill & Morris 2003; Wyrick et al. 2004), forming separate crateriform depressions that lack elevated rims. These pit craters align above the underlying dilational crack, whereby they develop a quasi-linear pattern naturally. As deformation goes on, particles near the pit walls migrate progressively toward the floor sinkholes in response to the expanding fractures. Initially isolated pits thus gradually grow and intersect, forming an elliptical morphology with the long axis along the chain. In the later stage of the drainage process, adjacent pits further merge into scalloped-sided troughs, and collapsing depressions ultimately coalesce into relatively smooth-sided continuous grooves (Figure 2 shows the development sequence). We analyzed the pattern of model-predicted grooves and found that most of them depart from the plane perpendicular to the tensile direction by less than 50 m over the simulated patch. The geomorphic transitions from pitted depressions to scalloped troughs to linear grooves that are observed on Phobos probably imply different stages of drainage development and are all reproduced in our tidal grooving scenario.
Figure 2. Evolution of grooves involves extensional fracturing and granular drainage. Groove development begins with isolated pits in loose regolith aligned above the underlying dilational fracture (panel (a)). As upper granular material progressively drains, the pit craters grow and then intersect (panels (b)–(c)), coalescing into elongated or scalloped troughs, whose beaded margins are the direct product of the circular edges of the original pits. Continued extension and drainage cause all depression segments to merge into a continuous groove with almost linear edges (panels (d)–(e)). Simulated grooved terrain with colors coded by elevations is shown in panel (f). Data are from the simulation case of c p = 36 kPa. An animation of this figure is available in the online journal. The real-time duration of the animation is 13 s.
(An animation of this figure is available.)
Download figure:
Video Standard image High-resolution imageFigure 3 demonstrates the cross-sectional profiles of the grooves formed by granular drainage. Most model-predicted grooves appear shallow. Morphological analysis shows that they are typically 10–30 m deep and 80–120 m wide. Slopes of groove walls vary from 10° to 30°, with an average value of 25°, which are around the angle of repose for loose materials. The simulated grooves also all have flat edges and lack raised rims that are typically associated with impact structures; thus, this could serve as a diagnostic of drainage grooves versus other formation scenarios, such as impact crater chains or boulder-excavated troughs, that will be studied in much further topographic detail using data from future missions. A number of the subsurface fractures show narrow and steeply plunging profiles with vertical or near-vertical walls, morphologically resembling extensional crevasses on terrestrial glaciers (Colgan et al. 2016), but here for much weaker materials in much lower gravity. This suggests that there could be underlying canyons inside Phobos hidden under the observed surface grooves, if they are created by tidal stresses.
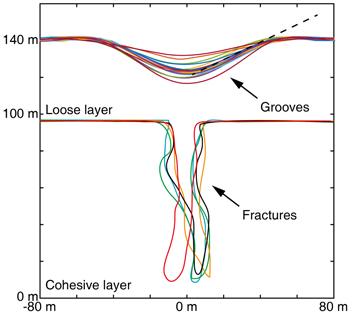
Figure 3. Model-predicted geomorphologies of grooves and underlying fractures. Most grooves appear shallow, with depths of 10–30 m and widths of 80–120 m, broadly consistent with observations. Slopes of groove walls are measured to be around ∼25°, close to the angle of repose for loose regolith. The narrow, steeply plunging fractures penetrate deep inside the cohesive layer, morphologically analogous to extensional crevasses on terrestrial glaciers, but here for much weaker materials in much lower gravity. Data are from the simulation case of c p = 36 kPa.
Download figure:
Standard image High-resolution image3.2. Regimes of Granular Failure Landscapes
To consider a range of potential cohesion strengths, we systematically vary the interparticle bonding strength c p for different simulated patches across Phobos's surface. A summary of granular failure patterns for a range of c p and patch locations (determining the tidal stress ratio) can be seen in Figures 4 and 5, which reveals well-defined transitions between four regimes of outcomes as distinguished by outline colors: (i) intact deformation for lower cohesion cases, in which the layer distorts without surface fissures, showing high ductility upon mechanical loading; (ii) polygonal failure for higher stress ratio cases (biaxial stretching), in which two or more crosscutting fractures with disparate orientations coexist, sculpting the topography to a complex craquelure-like appearance that is similar to the wrinkling patterns observed on biaxially compressed shells (Al-Rashed et al. 2017); (iii) fragmented forms for intermediate cohesion cases, in which several subtle discontinuous depressions develop, exhibiting scattered segments with lateral offsets; and (iv) parallel patterns such as in Figure 1(d) for higher cohesion cases, showing quasi-brittle behavior during the grooving process. These distinct regimes are strongly dependent on the cohesion strength and the stress state, plausibly due to the plastic-to-brittle transition of cohesive granular materials (Iveson & Page 2004; Smith & Litster 2012; Alarcon et al. 2018). The intriguing patterns reveal the complexity of the failure behavior of granular mediums. The results here could be applied not only to Phobos grooves but also for general understanding on the granular failure mode of small-body regolith under tensile/compressing loading.

Figure 4. Different regimes of granular failure pattern deduced from SSDEM simulations using different cohesion strengths for regolith patches across the surface of Phobos. The simulated cells are expanded and/or shrunk biaxially, the ratio of which is determined by the predicted tidal stresses imposed by the moon's orbital migration (Hurford et al. 2016). Arrows show the deformation directions. The stress ratio and tensile strength can be used to distinguish between intact deformation, polygonal topology, fragmented segments, and parallel pattern, as indicated by their outline colors. The formation of parallel grooves requires larger cohesion and lower stress ratio. Only one of the patches with similar stress ratio is shown here.
Download figure:
Standard image High-resolution image
Figure 5. Different regimes of granular failure pattern of subsurface cohesive substrates.
Download figure:
Standard image High-resolution imageResults imply that grooving parallel stretch marks across the midlatitudes of Phobos surface is possible in larger cohesion cases such as c p = 42 kPa or even larger. This corresponds to a macroscopic material tensile strength of T ∼ 1.0 kPa (see Appendix C for the translation from microscopic parameter to macroscopic quantity of granular matter). We map the prominent linear depressions on Phobos and find that most grooves at midlatitudes line up with the model-predicted groove orientations as shown in Figure 6. This consistency demonstrates the possibility that some observed linear striations might be the surface manifestations of underlying canyons hidden inside the small moon. The low gravity and tenuous cohesion, combined together, make the powdery but mildly cohesive layer show brittle behavior, a characteristic once thought to be reserved for coherent materials. This unique process produces well-defined granular fractures on low-gravity regolith. If true, then many linear features on small bodies (Sullivan et al. 1996; Watters et al. 2011) and icy bodies (Morrison et al. 2009; Spencer et al. 2020) that are previously believed to form through tectonism on monolithic bodies with structural continuity could plausibly be granular landforms with mild cohesion.
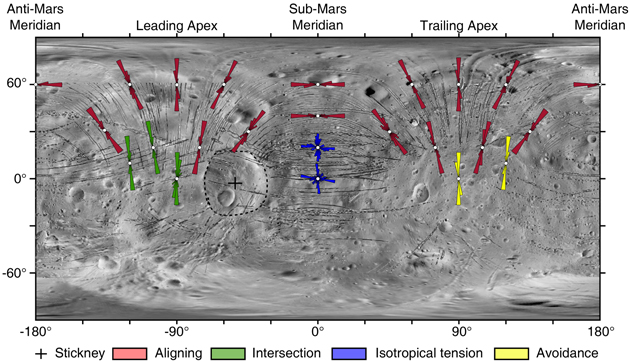
Figure 6. Simulated grooves mapped onto Phobos geomorphic mosaic. Rose diagrams show the orientation distributions of predicted grooves at corresponding locations. Some depressions on Phobos form distinct linear, parallel patterns perpendicular to the tensile direction, consistent with the expectations of the tidal fracturing model at midlatitudes. Three significant regions mainly along the equator that seem to contradict with our predictions are highlighted: within the intersecting zone (green), two crosscutting sets with disparate orientations coexist, in which one family is aligned with predicted grooves; near the sub-Mars region (blue), the tidal stresses are almost isotropically tensile and would generate polygonal fractures as predicted in Figure 4; around the trailing apex (yellow), a deficiency of grooves is observed. All data are from simulations for c p = 48 kPa.
Download figure:
Standard image High-resolution imageHowever, there are significant regions of Phobos showing absences and anomalies compared with the tidal fracturing model predictions. No grooves are found in a ∼50° wide region centered around the trailing apex (Murray & Heggie 2014). In the tidal formation scenario, this might be attributed to a paucity of cohesive material (i.e., coarser regolith; Scheeres et al. 2010), so the tidal strain might create more continuous deformation and not fissures as predicted in Figure 4. Such regional compositional differences have been invoked to solve the weakness stated here by Hurford et al. (2016). This explanation might be consistent with the observation that discontinuous depressions predominate near the absence zone (Thomas et al. 1979; Murray & Heggie 2014), possibly the marks of underdeveloped subsurface fractures. In addition, near the sub-Mars region the tidal fracturing model predicts almost isotropic tensile stresses and polygonal fractures. However, only east–west linear grooves are observed in this location (Murray & Heggie 2014). A plausible explanation is that stress concentrations (Bruck Syal et al. 2016), especially the long-wavelength topography associated with Stickney (Hurford et al. 2016), make the stress field anisotropic compared to a spherical model. Crisscrossed grooves cluster in the equatorial zones of the leading side. One subset is still aligned with the current orbital decay stress field. The other one, however, crisscrosses the tensile stresses. This mismatch was associated with possible multiple stages of tectonic extension and direction by Hurford et al. (2016). It means that ancient stress fields of Phobos that are different from its current stess fields generated the mismatched grooves.
Other mechanisms are also thought to have contributed to groove formation, such as rolling and bouncing boulders (Ramsley & Head 2019) and chains of impact craters formed by ejecta from Mars (Murray & Heggie 2014) or Phobos (Nayak & Asphaug 2016). There is a possibility that more than one mechanism is responsible for groove formation on Phobos, and that the tidal fracturing model is one of them, or the correlation between the tidal stress orientations with Phobos grooves in midlatitudes is just a coincidence. It is premature to draw conclusions beyond the scope of what is presented here. A more detailed study including the 3D shape of Phobos, as well as studying these absences and anomalies of grooves, would be a suitable application of the higher-resolution topographic data anticipated from the Mars Moons eXploration (MMX) mission (Kuramoto et al. 2022), which may conclusively determine the origin of these enigmatic striations.
3.3. Orbital History Constrains Interior Structure
Assuming that the tidal fracturing model is at work on Phobos, the tidal stresses accumulate as Phobos drifts inward, sculpting the striking grooves on its surface. These linear striations, therefore, serve as "tree rings" recording the past tidal evolution and surface modification on the Martian moon. This makes the orbital history a powerful tool, when combined with the grooving scenario, for inferring the hidden structure and formation history of Phobos. Competing theories suggest either that the Martian satellites are captured asteroids (Pajola et al. 2013) or that they were formed following a giant impact on Mars (Citron et al. 2015; Hesselbrock & Minton 2017; Canup & Salmon 2018). The extrinsic origin, however, is difficult to reconcile with the current nearly circular and coplanar orbits of Phobos and Deimos (Canup & Salmon 2018). Alternatively, this would be a natural consequence of the moons coalescing from an ancient equatorial disk around the red planet. A basin-forming impact on Mars over 4.3 Gyr ago has been invoked for the formation of the debris ring that proceeds to accrete Phobos- and Deimos-like moons directly, i.e., a single giant impact model (Citron et al. 2015; Canup & Salmon 2018). However, such an early forming of Phobos requires an initial orbital height far from Mars (Rosenblatt et al. 2016; Hesselbrock & Minton 2017), near the synchronous orbit. This means that Phobos should pass a 2:1 resonance with Deimos as it moved inward, which would probably excite the eccentricity of the outer satellite to an order of magnitude greater than its current value (Yoder 1982; Ćuk et al. 2020). A cyclic Martian ring-moon hypothesis (Hesselbrock & Minton 2017; Ćuk et al. 2020) is a possible formation mechanism to solve this conundrum. In this model, Phobos, with a much younger age, is the latest generation of moons born in the repeating ring-forming episodes. The most recent cycle, which produced present-day Phobos, would have then occurred near 3.34 Mars radii as deduced from the equipotential figure of Phobos (Hu et al. 2020).
Based on the two possible in situ accreting formation scenarios, the orbital migration history of Phobos can be reconstructed respectively as shown in Appendix A. We adopt four internal models, with low rigidities of μi = 105, 106, 107, and 108 Pa, consistent with its low density, which implies a large porosity broadly (Andert et al. 2010; Taylor & Margot 2011). The cohesive layer is assumed to have a rigidity of μo = 108 Pa, to be consistent with Hurford et al. (2016) based on an analog to the Lunar regolith layer. Its past orbits, in conjunction with the layered tidal stress model (see Appendix A), are used to deduce the tensile stress field experienced on the de-orbiting Phobos (Figure 7).

Figure 7. Tidal stresses driven by the orbital degradation of Phobos in two possible in situ formation scenarios: (a) single giant impact model; (b) moon-ring cycle model. The cohesive layer is assumed to have a rigidity of μo = 108 Pa. Four internal models are adopted, with rigidity of μi = 105, 106, 107, and 108 Pa (boxed labels on black lines). The horizontal shaded region shows the estimated material tensile strength, ∼1 kPa, required to generate parallel grooves. Based on the maximum failure criterion, the orbital history suggests that these grooves probably began forming 1.5–3.8 Ga or 60–90 Ma ago, respectively.
Download figure:
Standard image High-resolution imageWe consider the maximum stress criterion to estimate the stress required to fracture the granular regolith, which assumes that tensile cracking occurs once the maximum tensile stress exceeds the corresponding material yield strength T (estimated to be at least ∼1 kPa to reproduce parallel grooves; see Appendices B and C). In the single giant impact scenario, Phobos started its inward migration from about 5.76 Mars radius at 4.5 Ga. Assuming that Phobos has experienced the same solar system impactor flux as Mars (Schmedemann et al. 2014), Stickney is then estimated to be 4.0–4.2 Gyr old through crater statistics. This impact event should predate the groove formation given the stratigraphic order that grooves superpose Stickney; therefore, most grooves probably began forming about 1.5–3.8 Ga ago, corresponding to interior rigidities between 106 and 107 Pa (Figure 7(a)). For Phobos with a moon-ring cyclic origin, in which it evolved from near 3.34 Mars radii at 93 Ma, the fracturing of Phobos's surface probably could date back to 60–90 Ma, with interior rigidities restricted within 106–107 Pa (Figure 7(b)). This more recent estimate of the grooves' age seems to be in tension with the crater-age determination mentioned above. We speculate that while the body was accreting, impacts with ring material and sesquinary ejecta would have contributed to the overabundance of craters (Nayak & Asphaug 2016; Hesselbrock & Minton 2017). Such a planetocentric bombardment, mixed up with background cratering, makes it easy to overestimate the crater age.
4. Summary
This paper tests the hypothesis that global tidal deformation can explain many of the grooves on Phobos based on SSDEM simulations. A granular bed, which consists of a cohesive subsurface layer and an upper unconsolidated layer, is made to expand and/or contract biaxially according to the surface stress field predicted by the tidal evolution. Hundreds of simulations were performed, for different cohesion strengths and locations on the surface of a spherical Phobos. Often the tidal strain opens up fissures within the cohesive substrate; this triggers drainage flow of upper loose material into the fissure. The similarity between model-predicted structures and those observed on Phobos demonstrates the possibility that the tidal grooving scenario, which requires mildly cohesive regolith, can explain some linear striations at midlatitudes of Phobos.
Assuming that the tidal fracturing model is true, once fractures have been opened on Phobos's subsurface, they can remain active and grow under the increasing de-orbital stresses and even much smaller diurnal tidal stresses (Hurford et al. 2007). The reworking and dilation of fractures by these stresses may be natural seismic sources, which could be exploited by future missions to probe Phobos's interior. These "active" grooves, with possibly underlying seismicity, may correspond to those in their early stages of developments, which are more likely to be discontinuous pits as suggested by our grooving evolution model. Note that as predicted by Black & Mittal (2015), with continued inward migration of Phobos, it will break apart to form a Martian ring. Our analysis suggests that some of the grooves lining the surface of Phobos are likely early signs of the eventual demise of the de-orbiting satellite. Moreover, we propose that the progressing granular drainage in response to expanding fractures could expose subsurface pristine material (Ballouz et al. 2019) near the groove walls and possibly accumulate larger pebbles at the bottom owing to landslide size segregation (Gray 2018). Combining these predictions with data from future space missions such as the MMX mission could further resolve Phobos's hidden interior structure and help to uncover the origin of Mars and its satellites.
We are conscious of the fact that the tidal fracturing model seems to work well only at midlatitudes. Grooves in some regions along the equator of Phobos are different from the model-predicted results, including the sub-Mars point where the model predicts polygonal fracturing, the area near the leading apex where several families of grooves intersect at this point, and the area around the trailing apex where a deficiency of grooves is observed. Although assuming some regional compositional differences or modifying the model can resolve part of the problems, these mismatches still cast doubt on associating the grooves at the equator with the tidal stresses. There is a possibility that more than one mechanism is responsible for groove formation, and that the tidal fracturing model is one of them, or the correlation between the tidal stress orientations with Phobos grooves at midlatitudes is just a coincidence. Therefore, the geological features of tide-induced grooves as predicted in this paper, such as the side wall angle, the absence of raised rims, the plausible size segregation, and underlying seismicity, could serve as diagnostics of drainage grooves against other formation scenarios. The in situ observations on Phobos by the MMX mission will conclusively determine the origin of its enigmatic striations.
The results here could be applied not only to Phobos's surface but also for general understanding on the failure mode of celestial body surfaces under tensile/compressing loading, e.g., pit crater chains on the surface of Mars, Neptune's moon Triton that is also slowly falling inward, a possible past or future captured asteroid into a planet, or even extrasolar planets falling into their host star. The intriguing failure patterns found in this study also enrich our understanding of the fundamental physics controlling the dynamics of cohesive granular materials. The plastic-to-brittle transition of cohesive granular materials opens up the possibility that some tectonic features on small bodies that were previously believed to form on monolithic bodies could be granular landforms with mild cohesion.
B.C. was supported by the Postdoctoral Innovative Talent Support Program of China (No. BX20220164) and China Scholarship Council (No. 201906210345). Y.Y. acknowledges support from the Natural Science Foundation of China (No. 11702009). Visualization support is provided by POV-Ray ray-tracing package and ParaView software.
Appendix A: Tidal Stresses on Phobos
A.1. Orbital Evolution of Phobos
As a result of tidal dissipation, Phobos, which orbits within the synchronous limit, evolves gradually inward. We made a reasonable assumption of tidal locking in 1:1 spin–orbit resonance during its orbital decay (Black & Mittal 2015; Samuel et al. 2019). By considering the exchange of angular momentum with Mars, the evolution of the satellite's orbit (Charnoz et al. 2010; Hesselbrock & Minton 2017) is given as

Here k2 = 0.148 ± 0.017 is the degree-2 tidal potential Love number of Mars and Q = 88 ± 16 is its tidal quality factor (Nimmo & Faul 2013). Parameters n, e, and a are the mean motion, eccentricity, and semimajor axis of Phobos, respectively. MPh and MM are the masses of Phobos and Mars, and RM is the radius of Mars. Because the orbital eccentricity of Phobos is very small (∼0.0151), its eccentricity change is neglected (Charnoz et al. 2010; Hesselbrock & Minton 2017).
A.2. Possible Initial Position of Phobos
The origin of the Martian satellites, Phobos and Deimos, is not well understood. An external origin has been proposed, in which the two moons are suggested to be captured asteroids (e.g., Pajola et al. 2013); this scenario, however, does not readily explain the current small inclination and eccentricity of Phobos and Deimos (Burns 1978). Other scenarios advocate for an in situ origin from an ancient equatorial disk around the planet, such as might be created by a single giant impact (Citron et al. 2015; Canup & Salmon 2018). In this hypothesis, Phobos formed directly from the coalescence of a debris disk ejected during a violent collision with the Martian surface over 4.3 Gyr ago, for instance, the impact responsible for Hellas basin (Craddock 2011) or the planet's notable hemispheric dichotomy (Marinova et al. 2008). The challenge of disk coalescence models is that the impact-generated disk must be massive enough to be gravitationally unstable and not disperse, making it difficult to form such small satellites.
For parameters of k2 = 0.148 and Q = 88 for Mars, integrating back in time from Phobos's current orbit at 2.76 RM implies that at 4.5 Ga the orbital semimajor axis of Phobos would have been ∼5.76 RM. However, such an orbital migration of Phobos would probably result in a 2:1 resonance with Deimos that might push the outer satellite onto a strongly elliptical orbit, which is inconsistent with its present state (Hesselbrock & Minton 2017). A possible solution to this conundrum, which could also explain the small mass of Phobos and Deimos, is that Phobos was originally a much larger body that coalesced from a massive debris ring produced in a giant impact. Forming inside the corotation radius of Mars, it then experienced cycles of progressive tidal breakup (Hesselbrock & Minton 2017; Ćuk et al. 2020). In this cyclic Martian ring-moon hypothesis, Phobos is the latest in a sequence of in-spiraling moons that were tidally disrupted inside the Roche limit. The largest remnant of the disruption (currently Phobos) would then migrate outward owing to resonant interactions with its own tidally stripped debris. This remnant would then spiral in again owing to tidal dissipation in Mars, repeating the cycle.
Agnostic of the nature of its origin, equipotential analysis of Phobos (Hu et al. 2020) suggests that the current satellite might have been originally emplaced near 3.34 RM, giving a relatively young age of 93 Myr deduced from its current location. This leads us to consider two end-member candidates for the orbital histories of Phobos, as plotted respectively in Figure 8: on the one hand, beginning at ∼5.76 RM at 4.5 Gyr, and on the other hand, beginning at 3.34 RM at 93 Myr.
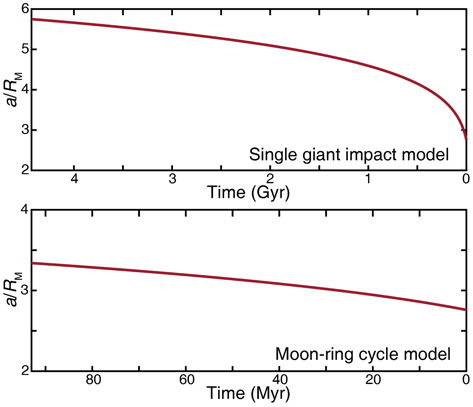
Figure 8. Orbital evolution of Phobos within two possible in situ accreting formation scenarios.
Download figure:
Standard image High-resolution imageA.3. Tidal Stress Model
We consider Phobos as having a layered heterogeneous structure, made up of a homogeneous spherical interior and a discrete granular outer layer. Surface stresses are computed using a thin-shell spherical approximation (Kattenhorn & Hurford 2009). The horizontal strain in the elastic shell, induced by the increasingly tidally distorted interior, results in stresses on the surface (Hurford et al. 2016) given by
where θ is the colatitude with respect to the tidal distortion's axis of symmetry and σθ θ is the stress along the surface in the direction radial to the axis of symmetry, while σφ φ is along the surface orthogonal to σθ θ (Hurford et al. 2007). Parameter ρPh is the average density of Phobos, and ai and af are the starting and final semimajor axes during any span of orbital decay. The magnitude of the surface tidal stress is proportional to the second-order tidal Love number h2 of Phobos. Parameter h2 can be deduced from the internal rigidity μi (Hurford et al. 2016), which is set to 105–108 Pa given the weakness of Phobos's porous interior (Andert et al. 2010). Parameter μo is the rigidity of the outer cohesive layer, which is set to 108 Pa to be consistent with Hurford et al. (2016). The layered tidal stress model, in conjunction with the possible orbital history of Phobos, is used to reconstruct its de-orbiting stress field as Phobos spiraled closer to Mars. For simplicity, Phobos is here assumed to be a homogeneous spherical interior covered by a discrete two-layer outer regolith. Phobos's highly irregular shape and regional topography like Stickney and other craters could make the tidal stresses deviate from the symmetrical state, which has the possibility to lead to the north–south asymmetric distribution of grooves, or the mismatch could be resolved by assuming some regional compositional differences in cohesive strength. Future modeling work should include the 3D shape of Phobos to compute the surface stress field more accurately from the tidal deformation.
Appendix B: Tensile Failure Criterion
We adopt the maximum stress criterion (Helfenstein & Parmentier 1983; Ferrill & Morris 2003) to estimate the stress required to fracture the granular regolith, which assumes that tensile cracking occurs once the maximum tensile stress exceeds the corresponding yield strength. The tensile failure strength T, in turn, can thus be derived from the maximum tensile stress exerting on the granular layer when fracturing. This failure criterion, although simple, has been extensively used to predict the opening fractures on icy shells (Greenberg et al. 1998) and rocky crusts (Ferrill & Morris 2003).
Appendix C: Tensile Strength Calibration
The interparticle cohesive strength c p used directly in our codes only provides the failure limit between two contacting particles. In order to connect the macroscopic material tensile strength with the micromechanical parameter c p , we need to average the cumulative effect of interparticle interactions inside the disordered and anisotropic medium. Here we use a two-step evaluation procedure.
First, the stress distribution at the moment of structural failure initiation is required. Here the macroscopic stress tensor in the granular assembly is derived by homogenization and averaging methods based on representative volume elements (RVEs; Nicot et al. 2013; Zhang et al. 2018) and is given as
where  is the average Cauchy stress tensor of an RVE with volume V. The equation represents the summation of the dyadic product of the branch vector
x
PC and the contact force
f
PC over all the contacts "C" between two adjoining particles "P" inside the corresponding RVE "V." An RVE is an assembly of several adjacent particles that serve as averaging volumes for the macroscopic quantities (see more details in Nicot et al. 2013); the size of an RVE usually is set to contain about 200 particles. Figure 9 presents an example of the distribution of internal stresses inside each RVE over a cross section of the granular regolith. The loose layer experiences compressive stresses caused by the overburden weight, while the cohesive layer is dominant by tensile stresses exerted by the expanding deformation. In addition, it is clear to see that the buildup of tensile stresses opens a narrow fracture and triggers the subsequent granular drainage, which in turn relieves the tensile stresses in the vicinity of the crack.
is the average Cauchy stress tensor of an RVE with volume V. The equation represents the summation of the dyadic product of the branch vector
x
PC and the contact force
f
PC over all the contacts "C" between two adjoining particles "P" inside the corresponding RVE "V." An RVE is an assembly of several adjacent particles that serve as averaging volumes for the macroscopic quantities (see more details in Nicot et al. 2013); the size of an RVE usually is set to contain about 200 particles. Figure 9 presents an example of the distribution of internal stresses inside each RVE over a cross section of the granular regolith. The loose layer experiences compressive stresses caused by the overburden weight, while the cohesive layer is dominant by tensile stresses exerted by the expanding deformation. In addition, it is clear to see that the buildup of tensile stresses opens a narrow fracture and triggers the subsequent granular drainage, which in turn relieves the tensile stresses in the vicinity of the crack.

Figure 9. Tidal deformation and internal stresses of the granular regolith. Tension is positive and compression negative. The patches represent the RVEs used for the stress evaluation. Data are from the simulation case of c p = 36 kPa. Note that only part of the width of the simulation is shown.
Download figure:
Standard image High-resolution imageBased on the maximum failure criterion in Appendix B (Ferrill & Morris 2003), the material tensile strength T can be derived from the maximum tensile stress exerting on the granular layer when fracturing. Figure 10 shows the stress distributions of all RVEs over the granular regolith with different microcohesion c p at the moment of structural failure. The envelopes (dashed lines) in the stress space give estimations of the material tensile strength T. As expected, an increase in c p can postpone the initialization of failure and thus significantly increase T. According to the micro-to-macro relationship from this figure, the minimum interparticle cohesion required to generate parallel grooves, c p = 42 kPa as shown in Figure 4, corresponds to T ∼ 1.0 kPa, which is commensurate with lunar soils (Arslan et al. 2008).

Figure 10. σθ θ vs. σϕ ϕ for each RVE of the granular regolith during deformation. The results for different microcohesion values c p are shown in different colors as indicated in the legend. The envelopes (dashed lines) give estimations of the material tensile strength T according to the maximum failure criterion.
Download figure:
Standard image High-resolution image