


Abstract
The precise localization of the repeating fast radio burst (FRB 121102) has provided the first unambiguous association (chance coincidence probability p ≲ 3 × 10⁻⁴) of an FRB with an optical and persistent radio counterpart. We report on optical imaging and spectroscopy of the counterpart and find that it is an extended (0 6–08) object displaying prominent Balmer and [O iii] emission lines. Based on the spectrum and emission line ratios, we classify the counterpart as a low-metallicity, star-forming, mr' = 25.1 AB mag dwarf galaxy at a redshift of z = 0.19273(8), corresponding to a luminosity distance of 972 Mpc. From the angular size, the redshift, and luminosity, we estimate the host galaxy to have a diameter ≲4 kpc and a stellar mass of M* ∼ (4–7) × 107 M⊙, assuming a mass-to-light ratio between 2 to 3 M⊙ L⊙−1. Based on the Hα flux, we estimate the star formation rate of the host to be 0.4 M⊙ yr−1 and a substantial host dispersion measure (DM) depth ≲324 pc cm−3. The net DM contribution of the host galaxy to FRB 121102 is likely to be lower than this value depending on geometrical factors. We show that the persistent radio source at FRB 121102's location reported by Marcote et al. is offset from the galaxy's center of light by ∼200 mas and the host galaxy does not show optical signatures for AGN activity. If FRB 121102 is typical of the wider FRB population and if future interferometric localizations preferentially find them in dwarf galaxies with low metallicities and prominent emission lines, they would share such a preference with long gamma-ray bursts and superluminous supernovae.
Export citation and abstract BibTeX RIS
1. Introduction
Fast radio bursts (FRBs) are bright (∼Jy) and short (∼ms) bursts of radio emission that have dispersion measures (DMs) in excess of the line of sight DM contribution expected from the electron distribution of our Galaxy. To date, 18 FRBs have been reported—most of them detected at the Parkes telescope (Lorimer et al. 2007; Keane et al. 2012, 2016; Thornton et al. 2013; Burke-Spolaor & Bannister 2014; Petroff et al. 2015; Ravi et al. 2015, 2016; Champion et al. 2016) and one each at the Arecibo (Spitler et al. 2014) and Green Bank telescopes (Masui et al. 2015).
A plethora of source models have been proposed to explain the properties of FRBs (see, e.g., Katz 2016 for a brief review). According to the models, the excess DM for FRBs may be intrinsic to the source, placing it within the Galaxy; it may arise mostly from the intergalactic medium (IGM), placing a source of FRBs at cosmological distances (z ∼ 0.2–1), or it may arise from the host galaxy, placing a source of FRBs at extragalactic, but not necessarily cosmological, distances (∼100 Mpc).
Since the only evidence to claim an extragalactic origin for FRBs has been the anomalously high DM, some models also attempted to explain the excess DM as a part of the model, thus allowing FRBs to be Galactic. All FRBs observed to date have been detected with single-dish radio telescopes, for which the localization is of the order of arcminutes, insufficient to obtain an unambiguous association with any object. To date, no independent information about their redshift, environment, and source could be obtained due to the lack of an accurate localization of FRBs. Keane et al. (2016) attempted to identify the host of FRB 150418 on the basis of a fading radio source in the field that was localized to a z = 0.492 galaxy. However, later work identified the radio source as a variable active galactic nucleus (AGN) that may not be related to the source (Bassa et al. 2016; Giroletti et al. 2016; Williams & Berger 2016; Johnston et al. 2017).
Repeated radio bursts were observed from the location of the Arecibo-detected FRB 121102 (Spitler et al. 2016; Scholz et al. 2016), with the same DM as the first detection, indicating a common source. As discussed by Spitler et al. (2016), it is unclear whether the repetition makes FRB 121102 unique among known FRBs, or whether radio telescopes other than Arecibo lack the sensitivity to readily detect repeat bursts from other known FRBs.
Chatterjee et al. (2017) used the Karl G. Jansky Very Large Array (VLA) to directly localize the repeated bursts from FRB 121102 with 100 mas precision and reported an unresolved, persistent radio source and an extended optical counterpart at the location with a chance coincidence probability of ≈3 × 10⁻⁴—the first unambiguous identification of multi-wavelength counterparts to FRBs. Independently, Marcote et al. (2017) used the European VLBI Network (EVN) to localize the bursts and the persistent source and showed that both are co-located within ∼12 mas.
Here, we report the imaging and spectroscopic follow-up of the optical counterpart to FRB 121102 using the 8 m Gemini North telescope.
2. Observations and Data Analysis
The location of FRB 121102 was observed with the Gemini Multi-Object Spectrograph (GMOS) instrument at the 8 m Gemini North telescope atop Mauna Kea, Hawai'i. Imaging observations were obtained with SDSS r', i', and z' filters on 2016 October 24, 25, and November 2, under photometric and clear conditions with 058–066 seeing. Exposure times of 250 s were used in the r' filter and of 300 s in the i' and z' filters with total exposures of 1250 s in r', 1000 s in i', and 1500 s in z'. The detectors were read out with 2 × 2 binning, providing a pixel scale of 0146 pixel−1. The images were corrected for a bias offset, as measured from the overscan regions, flat fielded using sky flats and then registered and coadded.
The images were astrometrically calibrated against the Gaia DR1 Catalog (Gaia Collaboration et al. 2016). To limit the effects of distortion, the central 2 2 × 22 subsection of the images were used. Each of the r', i', and z' images were matched with 35–50 unblended stars yielding an astrometric calibration with 7–9 mas root mean square (rms) position residuals in each coordinate after iteratively removing ∼4–5 outliers. The error in the mean astrometric position with respect to the Gaia frame is thus ∼1–2 mas.
We used the Source Extractor (Bertin & Arnouts 1996) software to detect and extract sources in the coadded images. The r' and i' images were photometrically calibrated with respect to the IPHAS DR2 catalog (Barentsen et al. 2014) using Vega-AB magnitude conversions stated therein. We measure isophotal integrated magnitudes of mr' = 25.1 ± 0.1 AB mag and mi' = 23.9 ± 0.1 AB mag for the optical counterpart of FRB 121102. The error value includes the photometric errors and rms zero-point scatter. Ongoing observations will provide full photometric calibration in g', r', i', and z' bands and will be reported in a subsequent publication.
Spectroscopic observations were obtained with GMOS on 2016 November 9 and 10 with the 400 lines mm−1 grating (R400) in combination with a 1'' slit, covering the wavelength range from 4650 to 8900 Å. A total of nine 1800 s exposures were taken with 2 × 2 binning, providing a spatial scale of 0292 pixel−1 and an instrumental resolution of 4.66 Å, sampled at 1.36 Å pixel−1. The conditions were clear, with 08–10 seeing on the first night, and 09–11 on the second. To aid the spectral extraction of the very faint counterpart, the slit was oriented at a position angle of 18 6, containing the counterpart to FRB 121102 as well as an mr' = 24.3 AB mag, mi' = 22.7 AB mag foreground star, located 28 to the south (shown later in Figure 3).
The low signal-to-noise ratio of the spectral trace of the FRB counterpart on the individual bias-corrected long-slit spectra complicated spectral extraction through the optimal method by Horne (1986). Instead, we used a variant of the optimal extraction method of Hynes (2002) by modeling the spectral trace of the reference object by a Moffat function (Moffat 1969) to determine the position and width of the spatial profile as a function of wavelength. Because of the proximity of the reference object to the FRB counterpart (20 pixels), we assume that the spatial profile as a function of wavelength is identical for both. We note that though the counterpart is slightly resolved in the imaging observations, the worse seeing during the spectroscopic observations (by a factor of 1.2–1.9) means the seeing dominates the spatial profile. The residual images validate this assumption; no residual flux is seen once the extracted model is subtracted from the image. To optimally extract the spectra of the FRB counterpart, the reference object as well as the sky background, we then simultaneously fit the spatial profile at the location of the counterpart and at the location of the reference object on top of a spatially varying linear polynomial for each column in the dispersion direction.
Wavelength calibrations were obtained from arc lamp exposures, modeling the dispersion location to wavelength through fourth-order polynomials, yielding rms residuals of better than 0.2 Å. The individual wavelength-calibrated spectra were then combined and averaged. The instrumental response of the spectrograph was calibrated using an observation of the spectrophotometric standard Hiltner 600 (Hamuy et al. 1992, 1994), which was taken on 2016 November 7 as part of the standard Gemini calibration plan with identical instrumental setup as the science observations. The flux-calibrated spectrum of the reference object gives a spectroscopic magnitude of  , about 11% higher than derived from photometry. Given that the spectrophotometric standard was observed on a different night with worse seeing (14), we attribute this difference to slit losses and scale the flux of the observed spectra of the reference object and the FRB counterpart by a factor 0.89.
3. Results and Analysis
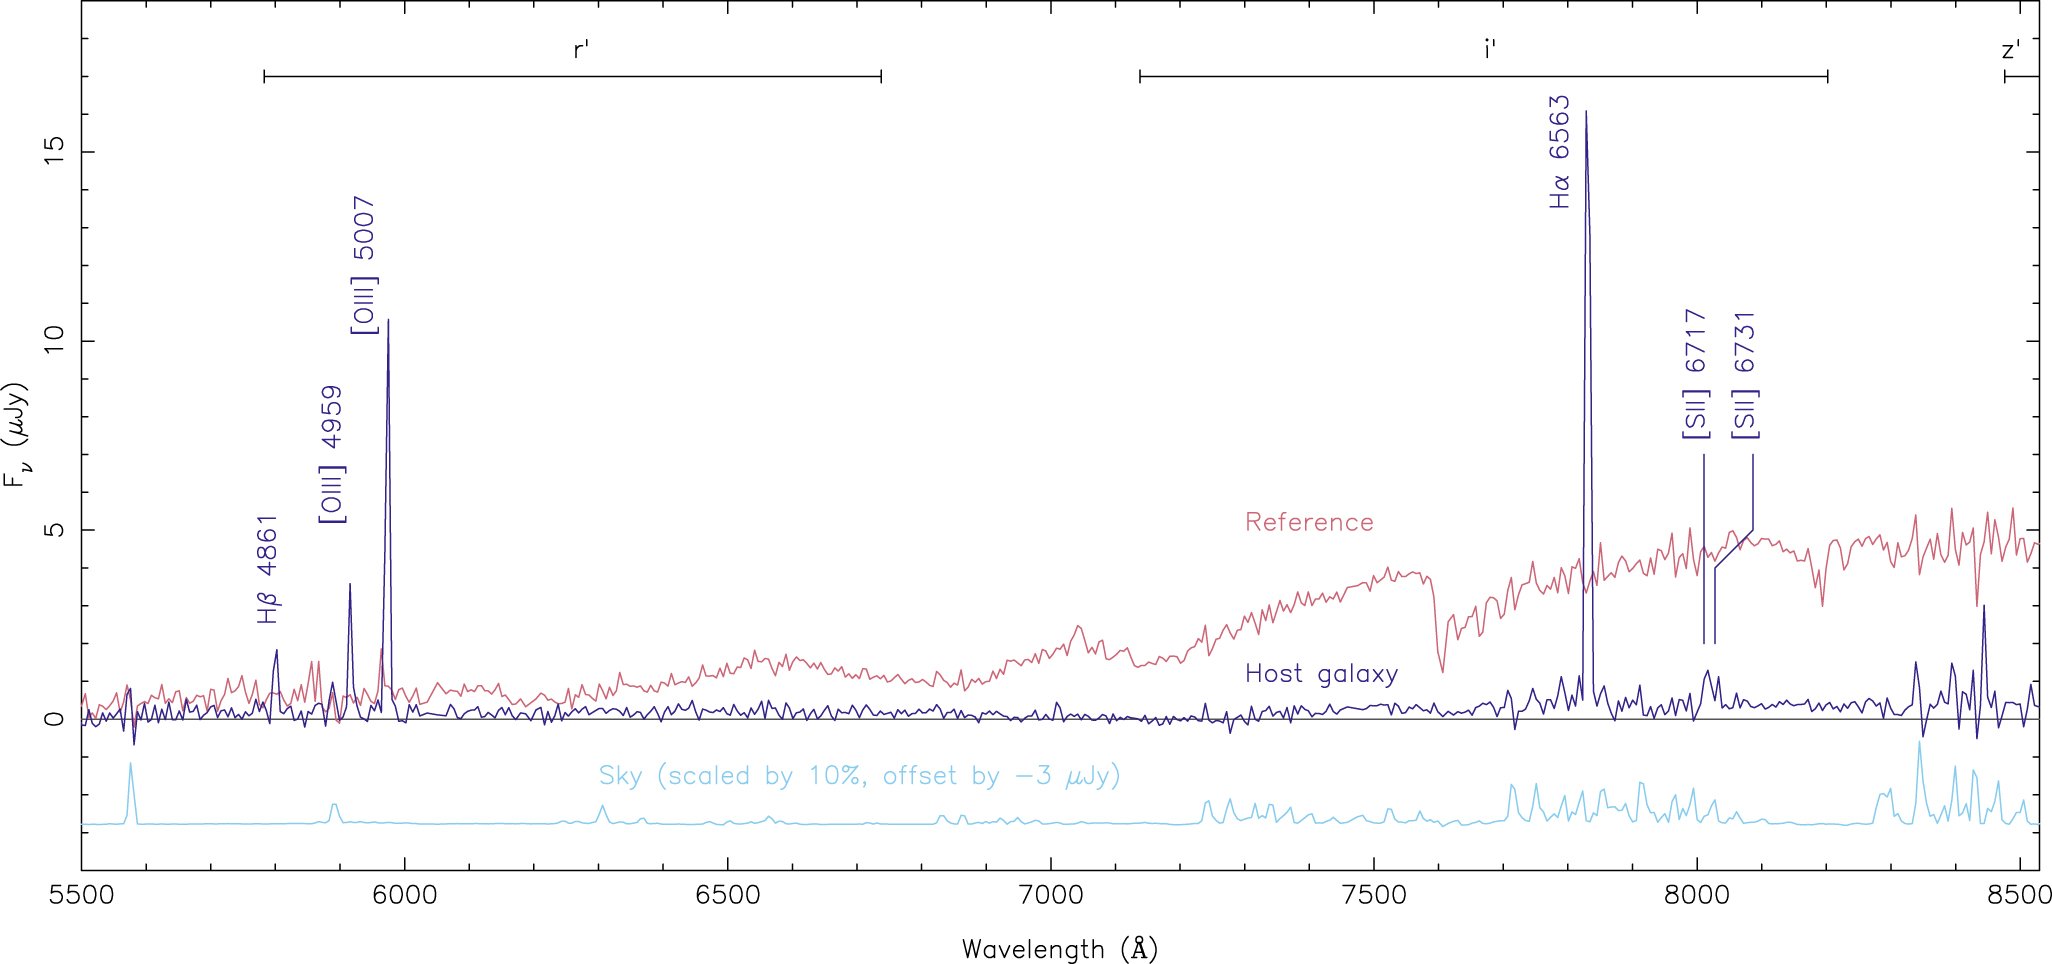
The final combined and calibrated spectrum is shown in Figure 1. Besides continuum emission, which is weakly detected in the red part of the spectrum, four strong emission lines are clearly visible and are identified as Hα, Hβ, and [O iii] λ4959 and [O iii] λ5007 indicating that the optical counterpart is a star-forming galaxy. The corresponding weighted mean redshift is z = 0.19273 ± 0.0008. Weaker emission lines from [S ii] λλ6717, 6731 are also detected. The [N ii] λλ6549, 6583 and the [O i] λ6300 lines are not seen.

Figure 1. Coadded spectrum of the host galaxy of FRB 121102, the reference object, and the sky contribution (scaled by 10% and offset by −3 μJy). The spectra have been resampled to the instrumental resolution. Prominent emission lines are labeled with their rest-frame wavelengths. Black horizontal bars denote the wavelength ranges of the filters used for imaging. Most of the wavelength coverage of the z' band is outside the coverage of this plot.
Download figure:
Standard image High-resolution imageGaussian fits to the emission lines in the rest frame yield the flux and 1σ width values listed in Table 1. We estimate rest-frame equivalent widths for the strongest emission lines; 392 ± 102 Å for [O iii] λ5007 and 290 ± 55 Å for Hα.
Table 1. Emission Line Properties
| Line | Obs. Flux | Width (σ) | Aλ/AV |
|---|---|---|---|
| (erg cm−2 s−1) | (Å) | (mag) | |
| Hβ | 0.118(11) × 10−16 | 1.91(19) | 0.941 |
| [O iii] λ4959 | 0.171(10) × 10−16 | 1.75(11) | 0.921 |
| [O iii] λ5007 | 0.575(11) × 10−16 | 1.89(4) | 0.911 |
| [O i] λ6300 | <0.009 × 10⁻¹⁶ | ⋯ | 0.670 |
| [N ii] λ6549 | <0.021 × 10⁻¹⁶ | ⋯ | 0.625 |
| Hα | 0.652(9) × 10−16 | 2.02(3) | 0.622 |
| [N ii] λ6583 | <0.030 × 10⁻¹⁶ | ⋯ | 0.619 |
| [S ii] λ6717 | 0.040(6) × 10−16 | 2.4(4) | 0.596 |
| [S ii] λ6731 | 0.024(6) × 10−16 | 2.4(6) | 0.593 |
Note. Observed emission line properties from fitting normalized Gaussians to the rest-wavelength host galaxy spectrum. Upper limits (3σ) on line fluxes assume Gaussian widths of σ = 2 Å. The absorption Aλ/AV at the observed line wavelengths is taken from Cardelli et al. (1989). To obtain unabsorbed line fluxes, multiply by  , where AV is the Galactic absorption toward FRB 121102.
Download table as: ASCIITypeset image
The ratios of measured line fluxes for [O iii]/Hβ against [N ii]/Hα and [S ii]/Hα — the well-known Baldwin, Phillips, & Terlevich (BPT) diagram (Baldwin et al. 1981) — are shown in Figure 2. The line ratios of the host galaxy of FRB 121102 are compared to those from the SDSS DR12 galaxy sample (Alam et al. 2015). The locations below and to the left of the solid and dashed gray lines indicate that the emission lines are due to star formation and not due to AGN activity (Kewley et al. 2001, 2006; Kauffmann et al. 2003). Note that the BPT diagram line ratios are insensitive to reddening (from the Milky Way as well as the host itself).

Figure 2. BPT (Baldwin et al. 1981) diagrams of [N ii]/Hα and [S ii]/Hα against [O iii]/Hβ for the SDSS DR12 (Alam et al. 2015) galaxy sample with significant (>5σ) emission lines. The black symbol with error bars denotes the location of the host galaxy of FRB 121102. The solid and dashed lines denote the demarcations between star-forming and AGN-dominated galaxies, respectively (Kewley et al. 2001, 2006; Kauffmann et al. 2003). The region between the two curves corresponds to composite objects with AGN and star formation.
Download figure:
Standard image High-resolution imageWe use the galfit software (Peng et al. 2002, 2010) to constrain the morphology of the optical counterpart. A Sérsic profile (![${\rm{\Sigma }}(r)={{\rm{\Sigma }}}_{{\rm{e}}}{e}^{-\kappa [{(r/{R}_{{\rm{e}}})}^{1/n}-1]}$](https://content.cld.iop.org/journals/2041-8205/834/2/L7/revision1/apjlaa558eieqn3.gif) ), convolved with the point-spread function (PSF), was fitted against the spatial profile of the counterpart. For the i'-band image, the best fit has an effective radius of Re = 041 ± 006, a Sérsic index of n = 2.2 ± 1.5, and an ellipticity of b/a = 0.25 ± 0.13. The lower signal-to-noise ratio of the counterpart in the r' and z' images did not permit meaningful results. Instead, we directly fit the spatial profile in all three bands with a two-dimensional elliptical Gaussian profile. In the case of the i'-band image, the fit provides a position and effective radius, taken as the Gaussian σ, consistent with the Sérsic profile convolved with the PSF. The results of the fits are shown in Figure 3.
), convolved with the point-spread function (PSF), was fitted against the spatial profile of the counterpart. For the i'-band image, the best fit has an effective radius of Re = 041 ± 006, a Sérsic index of n = 2.2 ± 1.5, and an ellipticity of b/a = 0.25 ± 0.13. The lower signal-to-noise ratio of the counterpart in the r' and z' images did not permit meaningful results. Instead, we directly fit the spatial profile in all three bands with a two-dimensional elliptical Gaussian profile. In the case of the i'-band image, the fit provides a position and effective radius, taken as the Gaussian σ, consistent with the Sérsic profile convolved with the PSF. The results of the fits are shown in Figure 3.

Figure 3. Top left, top right, and bottom left panels show respective 74 × 74 subsections of the GMOS r', i', and z' images, centered on the optical counterpart to FRB 121102. Each image has been smoothed by a Gaussian with a width of 02, while the plus sign and ellipse denote the position and extent of a two-dimensional Gaussian fit to the spatial profile of the counterpart. The i'-band image also shows the narrower Sérsic fit by galfit. The bottom right panel combines the positional and morphological measurements from the different bands on an astrometric frame of 1'' × 1'' in size. The colors are identical to those used in the other panels. The large ellipses denote the extent of the Gaussian and Sérsic fits, while the small ellipses denote the 1σ absolute positional uncertainties. The location of the persistent counterpart as measured with the EVN at 5 GHz by Marcote et al. (2017) is represented by the black cross. The uncertainty in the EVN location is much smaller than the size of the symbol.
Download figure:
Standard image High-resolution image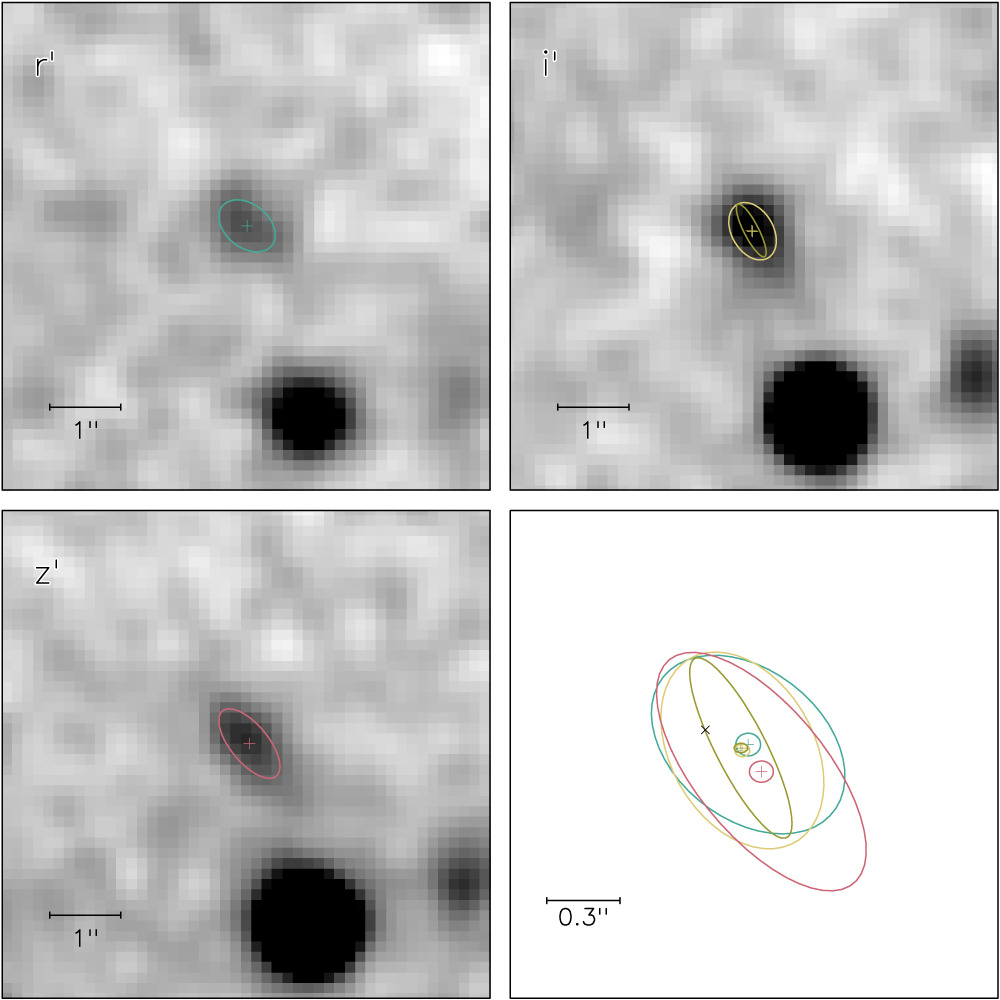
The position and extent of the host galaxy, as approximated with the two-dimensional elliptical Gaussian profile, agrees well in the r' and i' bands (semimajor axis σa = 044 with ellipticity b/a = 0.68), while the z'-band has a slightly offset position and appears larger (σ = 059 with b/a = 0.45). We attribute this difference to the fact that the the r' and i' bands are dominated by the bright emission lines of Hα, Hβ, [O iii] λ4959, and [O iii] λ5007, while the redder z'-band traces the continuum flux of the host galaxy. As such, the morphology suggests that the host galaxy has at least one H ii region at a slight offset from the galaxy center.
Finally, the bottom right panel of Figure 3 plots the Gaussian centroids on the International Celestial Reference Frame (ICRF) through the astrometric calibration of the r', i', and z' images against Gaia. The positional uncertainties in each axis are the quadratic sum of the astrometric tie against Gaia (of the order of 2 mas) and the centroid uncertainty on the image (between 20 and 50 mas). The Gaia frame is tied to the ICRF defined via radio VLBI to a ∼1 mas precision (Mignard et al. 2016), much smaller than the centroid uncertainty. We find that the position of the persistent radio source seen with the EVN at an observing frequency of 5 GHz with a 1 mas precision (Marcote et al. 2017) is offset from the galaxy centroids by 186 ± 68 and 163 ± 32 mas in the line-dominated r' and i' images, and 286 ± 64 mas in the continuum-dominated z' image. Though offset from the centroids, the persistent radio source is located within the effective radii of the different bands.
4. Discussion and Conclusions
The observations presented here confirm the interpretation by Chatterjee et al. (2017) that the extended optical counterpart associated with FRB 121102 is the host galaxy of the FRB. Our measurement of the redshift z = 0.19273 is consistent with the DM-estimated value of zDM < 0.32 (Chatterjee et al. 2017) and together with the very low chance superposition probability firmly places FRB 121102 at a cosmological distance, ruling out all Galactic models for this source, consistent with the conclusions of Scholz et al. (2016) and Chatterjee et al. (2017).
In the following discussion, we assume the cosmological parameters from the Planck Collaboration et al. (2016) as implemented in astropy.cosmology (Astropy Collaboration et al. 2013), giving a luminosity distance of DL = 972 Mpc, and 1'' corresponding to projected proper and comoving distances of 3.31 kpc and 3.94 kpc, respectively.
We use the Schlegel et al. (1998) estimate of the Galactic extinction along this line of sight18 , EB−V = 0.781. Using RV = 3.1, we find AV = 2.42, and use the Cardelli et al. (1989) Galactic extinction curve to correct the spectrum with band extinctions of Ar' = 2.15, Ai' = 1.63, and Az' = 1.16 mag. We note that the Schlafly et al. (2010) and Schlafly & Finkbeiner (2011) recalibrated extinction model predicts a slightly lower extinction of EB−V = 0.673. The results described below are insensitive to differences in the extinction at this level. We do not apply k-correction to the magnitudes as they are not needed for the precision discussed here.
4.1. Burst Energetics
The redshift measurement allows us to put FRB 121102's energetics on a firmer footing, confirming the energy scale of 1038 erg(δΩ/4π)(Aν/0.1 Jy ms)(Δν/1 GHz) calculated by Chatterjee et al. (2017) using a distance scale of 1 Gpc. Here, Aν and Δν are the fluence and bandwidth, respectively, at observing frequency ν, and δΩ is the opening angle of the bursts. A more detailed analysis of energetics of individual bursts detected by the VLA and their rates will be reported in C. J. Law et al. (2016, in preparation).
4.2. Physical Properties of the Host
The host of FRB 121102 is a small galaxy with a diameter of ≲4 kpc, inferred from the continuum-dominated z'-band image. The absolute magnitudes, including the emission line fluxes and after correcting for the Milky Way's extinction, are Mr' = −17.0 AB mag and Mi' = −17.7 AB mag, identifying the host as a dwarf galaxy.
From Table 1, the Hα luminosity of the host galaxy, corrected for Milky Way extinction, is LHα = 2.9 × 1040 erg s−1. The corresponding star formation rate is SFR(Hα) = 7.9 × 10−42 M⊙ yr−1 × (LHα/erg s−1) = 0.23 M⊙ yr−1 (Kennicutt et al. 1994). This value does not completely account for the extinction of Hα photons in the host galaxy. The correction suggested by Kewley et al. (2002) is SFR(IR) = 2.7 × SFR(Hα)1.3 ≈ 0.4 M⊙ yr−1 (in the 8–1000 μm band). This is consistent with the 3σ upper limit of <9 M⊙ yr−1 estimated from the ALMA non-detection of the host at 230 GHz assuming a submillimeter spectral index α = 3 (Chatterjee et al. 2017).
The mass-to-light ratio ϒ* is dependent on the star formation history and the initial mass function for star formation. As an estimate, we use  based on the dynamics of dwarf galaxies with high star formation rates (Lelli et al. 2014), implying a stellar mass M* ∼ (4–7) × 107 M⊙. As dwarf galaxies are usually gas-rich (e.g., Papastergis et al. 2012), we expect that this estimate is a lower limit to the host baryonic mass. We also note that dwarf galaxies are typically dark matter dominated (Côté et al. 2000), and so the total dynamical mass is likely to be larger.
We use the R23 (Kewley & Dopita 2002), N2, O3N2 (Pettini & Pagel 2004), and the recently defined diagnostic of Dopita et al. (2016; labeled here as y) to estimate the metallicity where

As the [O ii]λ3727 line is outside our spectral coverage and [N ii]λ6584 is not detected, we can only set an upper limit to the metallicity. Using the extinction-corrected line fluxes, we measure

where the limits are calculated from the 3σ limit on [N ii]λ6584 flux and assuming the lower limit for the unmeasured [O ii]λ3727 flux to be zero. This corresponds to a 3σ metallicity limit of ![${\mathrm{log}}_{10}([{\rm{O}}/{\rm{H}}])+12\lt 8.4$](https://content.cld.iop.org/journals/2041-8205/834/2/L7/revision1/apjlaa558eieqn5.gif) (Kewley & Dopita 2002), <8.4 (Pettini & Pagel 2004; N2), <8.4 (Pettini & Pagel 2004; O3N2)19
, and <8.1 (Dopita et al. 2016; not including scatter). We convert these into the oft-used KK04 scale (Kobulnicky & Kewley 2004) using the conversions of Kewley & Ellison (2008). All measurements are consistent with
(Kewley & Dopita 2002), <8.4 (Pettini & Pagel 2004; N2), <8.4 (Pettini & Pagel 2004; O3N2)19
, and <8.1 (Dopita et al. 2016; not including scatter). We convert these into the oft-used KK04 scale (Kobulnicky & Kewley 2004) using the conversions of Kewley & Ellison (2008). All measurements are consistent with ![${\mathrm{log}}_{10}([{\rm{O}}/{\rm{H}}])+12\lesssim 8.7$](https://content.cld.iop.org/journals/2041-8205/834/2/L7/revision1/apjlaa558eieqn6.gif) in the KK04 scale. The metallicity of the host is low—less than ∼15% of all galaxies brighter than MB < −16 have metallicity lower than 8.7 (Graham & Fruchter 2015). This set of galaxies accounts for less than 20% of the star formation of the local universe.
in the KK04 scale. The metallicity of the host is low—less than ∼15% of all galaxies brighter than MB < −16 have metallicity lower than 8.7 (Graham & Fruchter 2015). This set of galaxies accounts for less than 20% of the star formation of the local universe.
The host properties are similar to those of extreme emission line galaxies (EELGs; Atek et al. 2011), young, low-mass starbursts that have emission lines of rest-frame equivalent widths greater than 200 Å.
4.3. Ionized Gas Properties in the Host
The Balmer lines from the host also allow us to estimate the properties of its ionized ISM and its contribution to the total DM of FRB 121102.
The Hα surface density for the galaxy with flux FHα, semimajor axis a, and semiminor axis b is

where we have used the extinction-corrected flux FHα = 2.6 × 10⁻¹⁶ erg cm−2 s−1 and the semimajor and semiminor axes (a = 044, b/a = 0.68) from the i' and r' images. In the source frame (denoted below by the subscript, "s"), the surface density is

For a temperature T = 104 T4 K, we express the emission measure ( ) given by Reynolds (1977) in the galaxy's frame

We get a smaller value from the extinction-corrected Hβ flux, EM(Hβ)s ≈ 530 pc cm−6. For the calculations below, we proceed with a combined estimate, EMs ≈ 600 pc cm−6.
This value is fairly large compared to measurements of the local Galactic disk. The WHAM Hα survey, for example, gives values of tens of pc cm−6 in the Galactic plane and about 1 pc cm−6 looking out of the plane (Hill et al. 2008). However, lines of sight to distant pulsars and studies of other galaxies give EM values in the hundreds (Reynolds 1977; Haffner et al. 2009).
The estimate for EMs is sensitive to the inferred solid angle of the galaxy and emitting regions. Ongoing observations with the Hubble Space Telescope will better resolve the Hα emitting structures and improve our constraint on the EM with respect to the location of the burst.
The implied optical depth for free–free absorption at an observation frequency ν (in GHz) is

Free–free absorption for FRB 121102 is therefore negligible even at 100 MHz. This suggests that the radio spectra of the bursts and possibly the persistent source are unaffected by absorption and are inherent to the emission process or to propagation effects near the sources, confirming the inference made by Scholz et al. (2016) based on the widely varying spectral shapes of the bursts alone.
4.3.1. Implied DM from Hα-emitting Gas
The EM implies a DM value sometimes given by DM = (EMffL)1/2, where ff is the volume filling factor of ionized clouds in a region of total size L (Reynolds 1977). As summarized in Appendix B of Cordes et al. (2016), additional fluctuations reduce the DM derived from EM, giving a source-frame value

where  ≤ 1 is the fractional variation inside discrete clouds due to turbulent-like density variations and ζ ≥ 1 defines cloud-to-cloud density variations in the ionized region of depth Lkpc in kpc. Here, we have used EMs = 600 pc cm−6 and assumed 100% cloud-to-cloud variations (ζ = 2) and fully modulated electron densities inside clouds ( = 1).
The host contribution to the measured DM is a factor (1 + z)−1 smaller than the source-frame DM.20
Also, the line of sight to the FRB source may sample only a fraction of  depending on if it is embedded in or offset from the Hα-emitting gas. For an effective path length through the ionized gas LFRB ≤ L, we then have

This estimate can be compared with empirical constraints discussed in Chatterjee et al. (2017) on contributions from the host and the IGM to the total DM made by subtracting the NE2001 model's DM contribution from the Milky Way (Cordes & Lazio 2002; DMMW = 188 pc cm−3) and the Milky Way halo ( ) from the total DM = 558 pc cm−3. This gives DMIGM + DMhost = 340 pc cm−3. The Milky Way contributions have uncertain errors but are likely of the order of 20%. The measured redshift implies a mean IGM contribution DMIGM ≈ 200 pc cm−3 (Ioka 2003; Inoue 2004) but can vary by about ±85 pc cm−3 (McQuinn 2014). This yields a range of possible values for DMhost: 55 ≲ DMhost ≲ 225 pc cm−3 that further implies
 ![$0.09\lesssim ({L}_{\mathrm{FRB}}/L){[{L}_{\mathrm{kpc}}{f}_{{\rm{f}}}/\zeta (1+{\epsilon }^{2})]}^{1/2}\lesssim 0.35$](https://content.cld.iop.org/journals/2041-8205/834/2/L7/revision1/apjlaa558eieqn10.gif) . The ionized region therefore must have some degree of clumpiness or the effective path length is significantly smaller than the size of the ionized region.
. The ionized region therefore must have some degree of clumpiness or the effective path length is significantly smaller than the size of the ionized region.
Radio pulsars in the Large and Small Magellanic Clouds have DMs spanning the ranges 45–273 pc cm−3 and 70–200 pc cm−3, respectively (Manchester et al. 2005). This empirically demonstrates that the free electron content of star-forming dwarf galaxies is of the order we estimate. The relatively large DM contribution from the host galaxy (as inferred from the Hα emission) implies that any contributions from the vicinity of the FRB source itself are probably quite small. This may rule out a very young (<100 year) supernova remnant (e.g., Piro 2016).
4.4. Implications for Source Models
Chatterjee et al. (2017) reported the locations of the radio bursts, the optical and variable radio counterparts, and the absence of millimeter-wave and X-ray emission. Marcote et al. (2017) have shown that the bursts and the persistent radio source are co-located to within a linear projected separation of 40 pc, suggesting that the two emission sources should be physically related, though not necessarily the same source. The radio source properties are consistent with a low-luminosity AGN or a young (<1000 year) supernova remnant (SNR) powered by an energetic neutron star (e.g., Murase et al. 2016).
The optical properties of the galaxies reported here do not add support to the AGN interpretation, although it cannot be conclusively ruled out. The BPT diagnostics for the host (Figure 2) show no indication of AGN activity. However, this may not be conclusive as the majority of radio-loud AGN show no optical signatures of activity (Mauch & Sadler 2007). This is further supported by five low-luminosity AGN with no optical signatures that have also recently been discovered (Park et al. 2016). However, these objects are almost exclusively hosted in galaxies with much larger stellar masses (∼1010 M⊙). We also note that the radio source is offset from the optical center of the galaxy by 170–300 mas, corresponding to a transverse linear distance of 0.5–1 kpc, nearly a quarter to half of the radial extent, which is not consistent with a central AGN, but such offsets have been seen before in dwarf galaxies, e.g., Henize 2–10 (Reines et al. 2011).
The association of an optical/X-ray AGN with a dwarf galaxy is also extremely rare. A search of emission-line dwarf galaxies (108.5 ≲ M* ≲ 109.5 M⊙) using BPT line diagnostics identified an AGN rate of ∼0.5% (Reines et al. 2013), with an additional 0.05% of dwarf galaxies searched exhibiting narrow emission lines consistent with star formation, and, broad Hα consistent with an AGN. Similarly, an X-ray survey of z < 1 dwarf galaxies reported an AGN rate of 0.6%–3% (Pardo et al. 2016). Of the dwarf galaxies known to host AGN, only two exhibit nuclear radio emission that appears to originate from a black hole jet, Henize 2–10 and Mrk 709 (Reines et al. 2011, 2014). Both have strong nuclear X-ray emission that originates from the AGN but optical emission lines that are dominated by star formation processes. The combination of a compact radio source, absent nuclear X-ray emission, strong star formation optical emission lines, and weak or non-existent broad optical emission lines that we observe in the host of FRB 121102 has no analog in any known galaxy to the best of our knowledge.
The high star formation rate is consistent with the presence of a young SNR or a cluster of young massive stars (i.e., an OB association), which would naturally link FRBs to neutron stars, which are the favored progenitor models.
4.4.1. Relation to Dwarf Galaxies
It is interesting to note that the only FRB host directly identified so far is a low-metallicity dwarf galaxy rather than, say, an extremely high star formation rate galaxy such as Arp 220 or a galaxy with a very powerful AGN or some other extreme characteristics. Dwarf galaxies are also a small fraction of the stellar mass in the universe (Papastergis et al. 2012). Ravi et al. (2016) also suggested that the extremely low scattering of FRB 150807 compared to its DM may be linked to its origin from a low-mass (<109 M⊙) galaxy. However, the strong polarization and scattering properties of FRB 110523 do suggest the presence of turbulent magnetized plasma around the source (Masui et al. 2015), suggesting that individual FRB environments may be quite diverse.
If FRBs are indeed more commonly hosted by dwarf galaxies in the low-redshift universe, they would share this preference with two other classes of high-energy transients—long-duration gamma-ray bursts and superluminous supernovae, both of which prefer low-mass, low-metallicity, and high star formation rate hosts (e.g., Fruchter et al. 2006; Perley et al. 2013, 2016; Vergani et al. 2015; and other works). Indeed, superluminous supernovae are preferentially hosted by EELGs (Leloudas et al. 2015). If this relation is true, it may point to a link between FRBs and extremely massive progenitor stars, possibly extending to magnetars that have been associated with massive progenitor stars (e.g., Olausen & Kaspi 2014).
4.5. Future Optical Follow-up of FRBs
A link between FRBs and dwarf galaxies will impact future multi-wavelength follow-up plans. Without the precise localization for FRB 121102 (Chatterjee et al. 2017), the host galaxy is scarcely distinguishable from other objects in the deep Gemini images.
Due to the trade-off between field of view and localization precision, FRB search projects that have a large FRB detection rate such as CHIME (V. M. Kaspi et al. 2017, in preparation), UTMOST (Caleb et al. 2016), and HIRAX (Newburgh et al. 2016) will localize high signal-to-noise detections to only sub-arcmin precision. If FRB hosts are star-forming galaxies with strong emission lines, slitless objective prism spectroscopy could efficiently distinguish these objects from a field of stars and elliptical galaxies, leading to putative host identifications without very precise localization. However, this strongly depends on the link between FRBs and their host properties and the homogeneity of FRBs—which will first have to be confirmed with more interferometric localizations.
We note, of course, that our above discussion regarding the possible relationship between FRBs and dwarf galaxies in general is based on a single data point of a repeating FRB, which may not be representative of the broader FRB population (see Scholz et al. 2016; Spitler et al. 2016 for more details).
We are very grateful to the staff of the Gemini Observatory for their help and flexibility throughout this program. We also thank R. F. Trainor and A. Delahaye for helpful discussions.
Our work is based on observations obtained at the Gemini Observatory (program GN-2016B-DD-2), which is operated by the Association of Universities for Research in Astronomy, Inc., under a cooperative agreement with the NSF on behalf of the Gemini partnership: the National Science Foundation (United States), the National Research Council (Canada), CONICYT (Chile), Ministerio de Ciencia, Tecnología e Innovación Productiva (Argentina), and Ministério da Ciência, Tecnologia e Inovação (Brazil).
This work has made use of data from the European Space Agency (ESA) mission Gaia (http://www.cosmos.esa.int/gaia), processed by the Gaia Data Processing and Analysis Consortium (DPAC; http://www.cosmos.esa.int/web/gaia/dpac/consortium). Funding for the DPAC has been provided by national institutions, in particular the institutions participating in the Gaia Multilateral Agreement. This research made use of Astropy, a community-developed core Python package for Astronomy (Astropy Collaboration et al. 2013; http://www.astropy.org).
S.P.T. acknowledges support from a McGill Astrophysics postdoctoral fellowship. The research leading to these results has received funding from the European Research Council (ERC) under the European Union's Seventh Framework Programme (FP7/2007-2013). C.G.B. and J.W.T.H. gratefully acknowledge funding for this work from ERC Starting Grant DRAGNET under contract number 337062. J.M.C., R.S.W., and S.C. acknowledge prior support from the National Science Foundation through grants AST-1104617 and AST-1008213. This work was partially supported by the University of California Lab Fees program under award number LF-12-237863. The research leading to these results has received funding from the European Research Council (ERC) under the European Unions Seventh Framework Programme (FP7/2007-2013). J.W.T.H. is an NWO Vidi Fellow. V.M.K. holds the Lorne Trottier and a Canada Research Chair and receives support from an NSERC Discovery Grant and Accelerator Supplement, from an R. Howard Webster Foundation Fellowship from the Canadian Institute for Advanced Research (CIFAR), and from the FRQNT Centre de Recherche en Astrophysique du Quebec. B.M. acknowledges support by the Spanish Ministerio de Economía y Competitividad (MINECO/FEDER, UE) under grants AYA2013-47447-C3-1-P, AYA2016-76012-C3-1-P, and MDM-2014-0369 of ICCUB (Unidad de Excelencia "María de Maeztu"). L.G.S. gratefully acknowledges financial support from the ERC Starting Grant BEACON under contract number 279702 and the Max Planck Society. Part of this research was carried out at the Jet Propulsion Laboratory, California Institute of Technology, under a contract with the National Aeronautics and Space Administration. E.A.K.A. is supported by TOP1EW.14.105, which is financed by the Netherlands Organisation for Scientific Research (NWO). M.A.M. is supported by NSF award #1458952. S.B.S. is a Jansky Fellow of the National Radio Astronomy Observatory. P.S. is a Covington Fellow at the Dominion Radio Astrophysical Observatory.
Facility: Gemini:Gillett (GMOS). -
Software: ESO-MIDAS, astro-py, galfit, SExtractor.
Footnotes
- 18
From the IRSA Dust Extinction Calculator http://irsa.ipac.caltech.edu/applications/DUST/.
- 19
We note that the Pettini & Pagel (2004) calibration has high scatter for O3N2 ≳ 2, but the limit quoted here includes the scatter.
- 20
The factor of (1 + z)−1 is a combination of the photon redshift, time dilation, and the frequency−2 dependence of cold plasma dispersion.