


Abstract
Class I methanol masers (cIMMs) and 1720 MHz OH masers are believed to arise from a common collisional pumping mechanism, and both trace shocked gas regions in supernova remnants (SNRs). However, their coexistence in star formation regions (SFRs) and their association with a front of bipolar outflow (a source of shock-stimulated collisional pumping) remain unclear. To search for collisionally pumped OH(1720) masers, we conducted a Very Large Array survey of the 18 cm OH masers and continuum emission toward a sample of 80 SFRs associated with 44 GHz cIMMs. Main-line OH maser emission was detected in 50% of the sample, and OH(1720) maser emission was detected in 20%. Continuum emission was detected in 28% of sources. A catalog of the detected OH masers is presented. Individual OH masers are found in close proximity, and the regions of masers of different transitions are often overlapping. A typical linear projected offset between the OH(1720) and OH(1665) masers is ∼0.04 pc. A remarkable number of ∼81% of the OH(1720) masers are associated with the continuum emission. The median separation between the targeted 44 GHz cIMMs and OH(1720) masers is ∼0.2 pc, which is similar to reported distances between cIMMs and H ii regions. The observed properties of the detected OH(1720) masers are different from those in SNRs and indicate that a nonlocal line overlap mechanism is responsible for their excitation. Thus, while both 44 GHz cIMMs and OH(1720) masers trace shocked gas in SNRs, physical conditions favorable for excitation of cIMMs, but not OH(1720) masers, are present in SFRs.
Export citation and abstract BibTeX RIS
1. Introduction
Galactic hydroxyl (OH) masers occur in widely varying environments, including massive star formation regions (MSFRs), evolved stars, and supernova remnants (SNRs). Most commonly, the main lines (at 1665 and 1667 MHz) are found in star-forming regions (SFRs), while the satellite lines (1612 and 1720 MHz) are found in evolved stars (1612 MHz) and at SNR−molecular cloud interfaces (1720 MHz). Of the four ground-state OH maser lines, OH(1720) is both the rarest and the most diverse in the sense of its possible pumping schemes. There are two types of this maser: (1) the SNR-associated OH(1720) masers, pumped collisionally (e.g., Green et al. 1997), and (2) the SFR associated OH(1720) masers, pumped radiatively (Caswell 1999).
Galactic methanol (CH3OH) masers occur in two types: class I is collisionally pumped (e.g., 4−1–30E at 36 GHz, 70–61A+ at 44 GHz, and 80–71A+ at 95 GHz transitions), while class II is radiatively pumped (e.g., 51–60A+ at 6.7 and 20–3−1E 12.2 GHz transitions). Hereafter we will refer to these two maser classes with the abbreviations proposed in Menten (2012): cIMMs and cIIMMs, respectively. To date, cIIMMs are found exclusively in SFRs (Breen et al. 2013), and they are coincident with embedded continuum sources, OH, and H2O masers. In contrast, cIMMs have somewhat larger offset from a continuum source, and often (though not always) tracing molecular outflows (Gómez-Ruiz et al. 2016).
Collisionally pumped 1720 MHz OH and 44 GHz class I CH3OH masers are known to coexist (but not spatially overlap) in SNR environments and trace shocked regions produced by the SNR−molecular cloud interaction (e.g., Pihlström et al. 2011). However, of the two, only the 44 GHz cIMMs are found in SFRs. No detections of collisionally pumped OH(1720) masers have been found to date in targeted and "semi-blind" OH maser surveys (e.g., Caswell 2004; Beuther et al. 2019).
To test the possibility of the existence of collisionally pumped 1720 MHz OH masers in SFRs, we conducted a survey of 1720 MHz masers toward cIMM in SFR (Litovchenko et al. 2012) using the 70 m telescope in Evpatoria (Crimea). Emission and/or absorption at 1720 MHz were detected toward 45 of 72 observed cIMMs with an overall detection rate of 63%. In many cases the very narrow line widths and the high fluxes indicate maser emission. In other cases the situation is less clear; these detections may be thermal emission.
The Evpatoria 70 m telescope has a 9' beam at 1720 MHz. Each field was observed with a single pointing; thus, we had no knowledge of the spatial location of the OH emission/absorption with respect to the methanol masers, or of the spatial extent in the case of thermal emission. The importance of this spatial information is illustrated in Figure 4 of Pihlström et al. (2011), which shows that in some—but not all—cases there is a spatial coincidence between OH(1720) and 44 GHz cIMMs in SNRs. Among the 1720 MHz OH spectra observed with the Evpatoria telescope, there are many examples of a more exact velocity coincidence of methanol and OH 1720 MHz peak emission than was seen by Pihlström et al. (2011).
The Litovchenko et al. (2012) survey has discovered remarkable evidence indicating a strong correlation between 1720 MHz emission/absorption and cIMM. Unfortunately, the survey lacked the spatial resolution needed to fully interpret the data and to understand the nature of the strong correlation. The Very Large Array (VLA) observations we present here address this deficiency.
First, with the VLA, in many cases we are able to unambiguously confirm the maser nature of the emission. Second, we are able to precisely locate the OH masers within the field. The VLA synthesized beam provides a positional uncertainty of about an arcsecond or better, depending on maser strength. This is sufficient to determine whether the OH masers arise near the methanol masers, compact continuum sources, or other objects within the field. Third, it is important to know the OH masers' behavior (emission vs. absorption) in all four transitions. OH masers associated with SNRs show emission at 1720 MHz and broad absorption in main lines (e.g., Hewitt et al. 2008), while in the case of SFRs, OH maser emission at 1720 MHz is accompanied by emission at 1665/1667 MHz (Turner 1979). Collisionally pumped OH(1720) masers are able to operate in a low-density regime in SNRs (Pavlakis & Kylafis 1996a; Lockett et al. 1999), but higher densities of SFRs (in conjunction with radiation field and a large velocity gradient) give rise to both main and satellite (including OH(1720)) OH lines (Gray et al. 1992; Pavlakis & Kylafis 1996b; Cragg et al. 2002).
Continuum emission in many of the targets has been observed with the VLA before. Most of these observations were made at higher angular resolution and at higher frequencies, befitting their status as ultracompact H ii regions. By dedicating one baseband to continuum observations, we obtained ∼40 μJy rms images at 1.5 GHz; these data provide moderate-resolution, high-sensitivity 20 cm images for these 80 Galactic SFRs.
As a result of our study, we obtain a catalog of interferometric positions of OH maser spots 4 with flux densities above a 0.1 Jy threshold toward 80 SFRs associated with cIMMs. A complete set of spectra and maps for detected OH sources is presented. The data obtained allow us to verify the properties of the detected OH(1720) lines and clarify their nature.
2. The Sample
The catalog of cIMMs 5 (Bayandina et al. 2012) was used as the basis of our sample. The catalog contains 206 cIMMs detected toward known SFRs. Most of the sources were detected at 44 GHz in single-dish observations with a beam of ∼2'. The catalog includes information on the association of cIMM with cIIMM, OH, and H2O masers; UCH ii regions; bipolar outflows; CS emission; IRAS point sources; and infrared/Spitzer dark clouds (IRDC and SDC).
In these observations we follow the sample selection criteria established for our RT-70 single-dish survey of 1720 MHz OH masers toward cIMMs, thus allowing us to compare the results of the two studies.
First, we selected 132 sources with declinations north of −34° that are accessible with the VLA. Specific observation restrictions (such as LST time limits, availability of good phase calibrators, etc.) reduced the sample to 100 objects.
The full sample of 100 sources contains 80 known SFRs and 20 Extended Green Objects (EGOs; Cyganowski et al. 2008).
EGOs were placed in a separate sample, as they were considered to be outflow candidates because of their extended 4.5 μm emission imaged with the Spitzer GLIMPSE Legacy Survey. The 4.5 μm band contains both the H2 (v = 0–0, S(9, 10, 11)) lines and CO (v = 1–0) bandheads that may be excited by shocks (Reach et al. 2006). These sources also show a high cIMM detection rate (Cyganowski et al. 2009). Results of our VLA survey of these 20 EGOs in OH lines were published in Bayandina et al. (2015, 2020).
The subsample of 80 SFRs is less homogeneous than the EGO subsample and not necessarily associated with outflows (Bayandina et al. 2012). Coordinates and velocities of the previously detected cIMMs were set as pointing positions for the VLA survey; see the list of observed sources in Table 1.
Table 1. Observed Source List
| Source | Alias | R.A.(J2000) | Decl.(J2000) | VLSR | OH | Continuum | |||||||
|---|---|---|---|---|---|---|---|---|---|---|---|---|---|
| 1612 | 1665 | 1667 | 1720 | Synth Beam | PA | 1.5 | Synth Beam | PA | |||||
| (h m s) | (° ''') | (km s−1) | MHz | MHz | MHz | MHz | (arcsec) | (deg) | GHz | (arcsec) | (deg) | ||
| G0.54-0.85 | RCW 142 | 17:50:14.6 | −28:54:51.0 | +14.8 | ⋯ | + | + | + | 36.31 × 13.90 | 21.50 | + | 32.13 × 10.09 | 19.13 |
| G5.89-0.39 | W28-A2 | 18:00:30.3 | −24:03:59.0 | +8.8 | + | + | + | + | 31.66 × 13.86 | 24.13 | + | 25.79 × 9.98 | 20.12 |
| G6.05-1.45 | M8E, NGC 6530, Mol 37 | 18:04:53.8 | −24:26:41.0 | +10.8 | ⋯ | + | ⋯ | + | 27.43 × 13.58 | 12.13 | ⋯ | 22.78 × 8.84 | −168.84 |
| G8.67-0.36 | 18:06:19.2 | −21:37:38.0 | +35.7 | + | + | ⋯ | + | 26.31 × 13.78 | 16.76 | + | 24.59 × 11.78 | 14.51 | |
| G18.34+1.772 | Mol 46 | 18:17:57.0 | −12:07:22.0 | +32.2 | ⋯ | ⋯ | ⋯ | ⋯ | 22.94 × 17.60 | 65.33 | ⋯ | 20.82 × 16.18 | 51.17 |
| G19.61-0.23 | 18:27:38.0 | −11:56:40.0 | +41.4 | ⋯ | + | + | + | 21.41 × 14.25 | 18.71 | + | 17.45 × 9.75 | 14.51 | |
| G23.43-0.19 | W41 | 18:34:39.4 | −08:31:52.0 | +102.3 | ⋯ | + | + | ⋯ | 20.87 × 14.06 | 24.28 | ⋯ | 18.10 × 10.84 | 14.22 |
| G24.79+0.084 | W42 | 18:36:12.4 | −07:12:10.0 | +114.5 | + | + | + | ⋯ | 19.76 × 14.14 | 18.72 | + | 20.04 × 13.61 | −64.69 |
| G25.41+0.105 | 18:37:16.8 | −06:38:32.0 | +95.8 | ⋯ | ⋯ | ⋯ | ⋯ | 17.34 × 10.52 | 22.10 | ⋯ | 15.84 × 9.42 | 12.18 | |
| G25.647+1.053 | Mol 62 | 18:34:19.8 | −05:59:44.0 | +42.1 | ⋯ | + | + | ⋯ | 20.22 × 13.92 | 25.63 | ⋯ | 19.45 × 12.56 | 19.62 |
| G25.826-0.178 | 18:39:04.6 | −06:24:17.0 | +90.2 | ⋯ | + | + | ⋯ | 20.55 × 13.86 | 25.09 | ⋯ | 18.39 × 12.00 | 20.74 | |
| G26.508+0.283 | Mol 65 | 18:38:40.3 | −05:35:06.0 | +102.4 | ⋯ | + | + | ⋯ | 19.08 × 14.77 | 6.80 | ⋯ | 16.94 × 9.87 | 8.94 |
| G26.602-0.220 | 18:40:38.5 | −05:43:37.0 | +108.0 | ⋯ | + | + | ⋯ | 18.93 × 14.39 | 14.02 | + | 17.90 × 11.79 | 13.57 | |
| G27.286+0.151 | 18:40:34.5 | −04:57:14.0 | +31.6 | ⋯ | ⋯ | ⋯ | ⋯ | 17.21 × 12.04 | 10.30 | ⋯ | 16.90 × 10.62 | 14.12 | |
| G27.369-0.164 | 18:41:51.0 | −05:01:28.0 | +94.5 | ⋯ | + | + | ⋯ | 19.21 × 14.26 | 21.38 | + | 17.51 × 11.14 | 19.46 | |
| G27.909-0.016 | 18:42:18.8 | −04:28:37.0 | +97.6 | ⋯ | ⋯ | ⋯ | ⋯ | 16.96 × 10.24 | 21.17 | ⋯ | 18.46 × 11.83 | 19.25 | |
| G28.303-0.389 | 18:44:22.1 | −04:17:49.0 | +74.0 | + | + | + | ⋯ | 44.26 × 14.72 | −52.87 | + | 48.08 × 15.86 | −50.99 | |
| G29.96-0.02 | W43S | 18:46:03.9 | −02:39:22.0 | +98.5 | + | + | ⋯ | ⋯ | 36.61 × 14.16 | −49.90 | + | 39.74 × 15.86 | −49.95 |
| G30.69-0.06 | 18:47:34.9 | −02:01:06.0 | +89.5 | ⋯ | + | + | ⋯ | 33.45 × 14.08 | −49.25 | ⋯ | 36.55 × 15.84 | −49.27 | |
| G30.82-0.06 | W43-Main(3) | 18:47:46.9 | −01:54:35.0 | +96.8 | ⋯ | ⋯ | ⋯ | ⋯ | 34.93 × 15.26 | −48.72 | ⋯ | 36.50 × 15.84 | −49.33 |
| G31.41+0.31 | 18:47:34.2 | −01:12:50.0 | +100.2 | ⋯ | + | + | + | 31.31 × 14.96 | −52.20 | + | 34.16 × 16.74 | −52.27 | |
| G32.99+0.04 | Mol 73 | 18:51:24.8 | +00:04:19.0 | +83.7 | ⋯ | ⋯ | ⋯ | ⋯ | 41.76 × 13.45 | −52.43 | ⋯ | 44.17 × 15.97 | −52.52 |
| G34.82+0.352 | Mol 75, RAFGL 5542 | 18:53:37.7 | +01:50:25.0 | +56.7 | ⋯ | ⋯ | ⋯ | ⋯ | 25.58 × 10.96 | −52.15 | ⋯ | 27.11 × 11.64 | −52.27 |
| G35.05-0.52 | 18:58:09.0 | +01:39:03.0 | +49.9 | ⋯ | ⋯ | ⋯ | ⋯ | 24.57 × 11.02 | −51.74 | ⋯ | 35.79 × 14.69 | −54.63 | |
| G36.116+0.552 | Mol 77 | 18:55:16.8 | +03:05:07.0 | +75.7 | ⋯ | ⋯ | ⋯ | ⋯ | 30.87 × 13.72 | −49.25 | ⋯ | 32.25 × 15.94 | −50.96 |
| G37.267+0.082 | Mol 82 | 18:59:03.7 | +03:53:43.0 | +90.3 | ⋯ | ⋯ | ⋯ | ⋯ | 18.63 × 13.84 | 22.91 | ⋯ | 19.99 × 15.20 | 24.25 |
| G37.427+1.518 | Mol 76 | 18:54:13.8 | +04:41:32.0 | +44.0 | ⋯ | ⋯ | ⋯ | ⋯ | 19.33 × 13.87 | 26.54 | ⋯ | 20.12 × 15.28 | 27.07 |
| G40.494+2.541 | S76E | 18:56:10.7 | +07:53:14.0 | +33.3 | ⋯ | ⋯ | ⋯ | ⋯ | 19.36 × 13.83 | 30.99 | ⋯ | 20.09 × 15.46 | 32.56 |
| G41.377+0.038 | Mol 93 | 19:06:47.6 | +07:31:38.0 | +58.7 | ⋯ | ⋯ | ⋯ | ⋯ | 13.87 × 10.34 | 22.58 | + | 15.14 × 11.85 | 23.25 |
| G43.167+0.011 | W49N | 19:10:13.3 | +09:06:14.0 | +15.6 | + | + | + | + | 15.10 × 12.54 | 15.99 | + | 12.82 × 10.10 | 27.22 |
| G43.304-0.208 | Mol 97 | 19:11:15.9 | +09:07:27.0 | +58.7 | ⋯ | ⋯ | ⋯ | ⋯ | 11.23 × 12.58 | 37.83 | ⋯ | 12.15 × 9.14 | 41.18 |
| G45.07+0.13 | 19:13:22.1 | +10:50:59.0 | +59.3 | ⋯ | + | + | ⋯ | 16.26 × 13.24 | 33.55 | ⋯ | 18.26 × 9.81 | 36.56 | |
| G49.49-0.387 | W51e1/e2, W51Main/S | 19:23:43.8 | +14:30:36.0 | +48.9 | + | + | + | + | 14.74 × 12.76 | 14.71 | + | 17.21 × 14.87 | 19.93 |
| G53.032+0.117 | 19:28:54.0 | +17:51:56.0 | +6.1 | ⋯ | ⋯ | ⋯ | ⋯ | 15.83 × 14.05 | 15.36 | + | 17.29 × 15.32 | 19.51 | |
| G59.78+0.06 | 19:43:11.5 | +23:43:54.0 | +22.9 | ⋯ | + | + | ⋯ | 14.33 × 13.15 | 7.49 | ⋯ | 16.76 × 15.36 | 15.29 | |
| G59.832+0.671 | Mol 110 | 19:40:59.3 | +24:04:39.0 | +35.4 | ⋯ | + | + | + | 19.89 × 14.68 | 57.59 | ⋯ | 17.54 × 13.47 | 54.76 |
| G65.768-2.594 | Mol 114 | 20:07:00.7 | +27:28:53.0 | +6.6 | ⋯ | ⋯ | ⋯ | ⋯ | 19.73 × 15.23 | 55.64 | ⋯ | 15.80 × 13.02 | 53.37 |
| G69.541-0.975 | ON 1 | 20:10:09.1 | +31:31:37.0 | +12.0 | + | + | + | + | 18.27 × 14.81 | 62.46 | + | 14.99 × 12.61 | 64.87 |
| G73.062+1.797 | Mol 116 | 20:08:09.7 | +35:59:20.0 | +0.6 | ⋯ | + | ⋯ | ⋯ | 18.21 × 14.95 | 68.81 | ⋯ | 14.09 × 12.55 | 66.55 |
| G75.772+0.343 | ON 2 | 20:21:44.1 | +31:26:48.0 | +3.8 | ⋯ | ⋯ | ⋯ | ⋯ | 19.22 × 14.71 | 61.13 | ⋯ | 14.84 × 12.39 | 59.87 |
| G77.462+1.759 | Mol 121 | 20:20:39.3 | +39:37:52.0 | +3.0 | ⋯ | ⋯ | ⋯ | + | 15.93 × 14.24 | 57.34 | + | 13.37 × 11.66 | 23.79 |
| G78.122+3.636 | Mol 119 | 20:14:25.2 | +41:13:36.0 | −3.5 | ⋯ | + | + | ⋯ | 17.04 × 15.44 | 59.36 | ⋯ | 12.64 × 11.06 | 13.70 |
| G78.87+2.76 | V1318 CygS, HH 425 | 20:20:30.5 | +41:21:27.0 | +8.9 | + | ⋯ | ⋯ | ⋯ | 16.84 × 15.46 | 80.83 | ⋯ | 12.74 × 11.67 | 9.48 |
| G78.983+0.349 | 20:31:13.7 | +40:03:17.0 | +5.5 | ⋯ | ⋯ | ⋯ | ⋯ | 16.57 × 15.36 | 67.22 | ⋯ | 13.46 × 12.57 | 39.39 | |
| G81.722+0.572 | DR 21(OH), W75(OH) | 20:39:00.6 | +42:22:51.0 | +0.4 | ⋯ | + | + | ⋯ | 16.13 × 15.24 | 52.32 | ⋯ | 14.78 × 8.65 | −178.94 |
| G81.877+0.784 | W75N(0,22''), W75N OH | 20:38:36.7 | +42:37:59.0 | +8.9 | ⋯ | + | + | + | 15.23 × 14.71 | 29.59 | + | 10.49 × 8.97 | 7.30 |
| G94.259-0.411 | Mol 136 | 21:32:30.8 | +51:02:15.0 | −47.9 | ⋯ | ⋯ | ⋯ | ⋯ | 16.50 × 14.42 | 24.69 | ⋯ | 15.17 × 13.33 | −164.27 |
| G99.982+4.17 | IC 1396N, Mol 138 | 21:40:42.3 | +58:16:10.0 | −0.5 | ⋯ | ⋯ | ⋯ | ⋯ | 16.65 × 14.85 | 39.51 | ⋯ | 15.60 × 13.13 | −170.92 |
| G102.641+15.784 | L1157 B1, HH 375 | 21:39:08.0 | +68:01:13.0 | +0.7 | ⋯ | ⋯ | ⋯ | ⋯ | 19.89 × 15.76 | 33.38 | ⋯ | 17.13 × 13.14 | 3.31 |
| G105.469+9.828 | R146, NGC 7129 | 21:43:49.4 | +66:06:46.0 | −6.4 | ⋯ | ⋯ | ⋯ | ⋯ | 19.86 × 14.51 | −61.73 | ⋯ | 18.88 × 13.66 | −59.94 |
| G106.797+5.312 | S140 IRS1, LDN 1204 | 22:19:18.3 | +63:18:48.0 | −8.2 | ⋯ | + | ⋯ | + | 21.66 × 14.74 | −68.99 | ⋯ | 20.04 × 13.61 | −64.69 |
| G108.596+0.493 | Mol 151 | 22:52:38.6 | +60:00:56.0 | −51.3 | ⋯ | ⋯ | ⋯ | ⋯ | 18.65 × 14.18 | −50.67 | ⋯ | 17.82 × 12.61 | −55.72 |
| G110.093-0.065 | 23:05:25.7 | +60:08:08.0 | −54.1 | ⋯ | ⋯ | ⋯ | ⋯ | 19.11 × 11.73 | −25.47 | ⋯ | 17.71 × 10.37 | −29.08 | |
| G110.479+1.479 | HH 377 | 23:03:13.9 | +61:42:21.0 | −11.4 | ⋯ | ⋯ | ⋯ | ⋯ | 19.60 × 14.50 | −71.25 | ⋯ | 18.59 × 12.86 | −60.70 |
| G111.236-1.238 | 23:17:21.0 | +59:28:49.0 | −52.3 | ⋯ | + | ⋯ | ⋯ | 19.89 × 14.52 | −64.80 | ⋯ | 14.59 × 10.23 | −58.29 | |
| G111.542+0.777 | NGC 7538 IR, S158 | 23:13:45.3 | +61:28:10.0 | −57.4 | ⋯ | + | + | + | 20.62 × 15.55 | −81.55 | + | 16.62 × 11.47 | −78.81 |
| G114.513-0.535 | Mol 160 | 23:40:43.8 | +61:10:31.0 | −52.0 | ⋯ | ⋯ | ⋯ | ⋯ | 19.16 × 14.43 | −89.10 | ⋯ | 17.90 × 13.91 | −73.27 |
| G119.779-6.031 | CB3, NGC 2071, HH 7-11 | 00:28:42.7 | +56:42:07.0 | −34.0 | ⋯ | ⋯ | ⋯ | ⋯ | 18.34 × 15.38 | −72.37 | ⋯ | 16.91 × 14.15 | −62.27 |
| G121.298+0.659 | 00:36:47.5 | +63:29:02.0 | −17.5 | ⋯ | + | ⋯ | ⋯ | 18.90 × 15.60 | −63.02 | ⋯ | 17.00 × 13.64 | −59.68 | |
| G122.015-7.072 | Mol 3 | 00:44:57.6 | +55:47:18.0 | −48.8 | ⋯ | ⋯ | ⋯ | ⋯ | 18.20 × 15.25 | −75.65 | ⋯ | 16.63 × 13.98 | −67.13 |
| G133.749+1.198 | W3(3), LDN 1359 | 02:25:53.5 | +62:04:11.0 | −38.4 | ⋯ | ⋯ | ⋯ | ⋯ | 23.17 × 14.40 | 83.30 | ⋯ | 16.64 × 9.66 | 90.17 |
| G133.949+1.065 | W3(OH) | 02:27:04.6 | +61:52:26.0 | −46.5 | + | + | + | + | 22.82 × 13.80 | 87.83 | + | 16.73 × 8.44 | 89.61 |
| G158.395-20.575 | NGC 1333 IRAS 4A | 03:29:10.3 | +31:13:31.0 | +6.7 | ⋯ | ⋯ | ⋯ | ⋯ | 39.63 × 16.77 | −70.59 | ⋯ | 38.33 × 15.88 | −64.35 |
| G170.657-0.269 | Mol 9 | 05:20:16.1 | +36:37:21.0 | −4.9 | ⋯ | ⋯ | ⋯ | ⋯ | 16.61 × 14.27 | 81.41 | ⋯ | 15.22 × 13.95 | 76.22 |
| G173.481+2.446 | S231, RNO 49 | 05:39:12.9 | +35:45:54.0 | −16.7 | ⋯ | + | + | ⋯ | 16.93 × 14.44 | 85.23 | ⋯ | 15.50 × 13.93 | −75.16 |
| G173.719+2.698 | S235, S235B, RNO 52 | 05:40:53.3 | +35:41:49.0 | −16.4 | ⋯ | ⋯ | ⋯ | ⋯ | 16.21 × 14.23 | 81.96 | + | 15.19 × 13.36 | 76.52 |
| G174.20-00.08 | AFGL 5142, HH 190 | 05:30:48.0 | +33:47:54.0 | −2.7 | ⋯ | + | + | ⋯ | 16.42 × 14.00 | 75.92 | ⋯ | 14.79 × 13.62 | 70.77 |
| G183.348-0.577 | 05:51:10.6 | +25:46:14.0 | −9.8 | ⋯ | ⋯ | ⋯ | ⋯ | 16.46 × 14.53 | −37.68 | ⋯ | 15.62 × 13.61 | −30.89 | |
| G189.032+0.785 | RAFGL 6366S | 06:08:41.1 | +21:31:04.0 | +2.8 | ⋯ | + | + | ⋯ | 17.50 × 15.08 | −71.61 | ⋯ | 16.21 × 14.18 | −46.45 |
| G192.597-0.035 | S255, S257, IC 2162 | 06:12:56.4 | +17:59:54.0 | +11.2 | ⋯ | ⋯ | ⋯ | ⋯ | 15.72 × 14.81 | 35.36 | ⋯ | 14.20 × 13.60 | 30.81 |
| G194.934-1.227 | Mol 19 | 06:13:15.1 | +15:22:36.0 | +16.4 | ⋯ | ⋯ | ⋯ | ⋯ | 19.31 × 14.39 | −60.14 | ⋯ | 18.13 × 13.45 | −54.46 |
| G203.316+2.055 | NGC 2264 | 06:41:09.6 | +09:29:35.0 | +7.2 | ⋯ | + | ⋯ | ⋯ | 21.35 × 14.25 | −56.77 | ⋯ | 20.63 × 13.18 | −51.29 |
| G205.109-14.111 | NGC 2071, LDN 1630 | 05:47:04.1 | +00:21:42.0 | +10.1 | ⋯ | ⋯ | ⋯ | ⋯ | 19.71 × 17.04 | −43.58 | + | 18.33 × 15.78 | −37.98 |
| G205.539-14.602 | HH 25MMS, L1630 | 05:46:07.4 | −00:14:14.0 | +10.4 | ⋯ | ⋯ | ⋯ | ⋯ | 19.67 × 16.92 | −31.25 | ⋯ | 18.24 × 15.70 | −32.36 |
| G208.752-19.215 | OMC3 MMS9 | 05:35:26.0 | −05:05:42.0 | +11.2 | ⋯ | ⋯ | ⋯ | ⋯ | 20.13 × 11.83 | −8.23 | ⋯ | 18.59 × 10.12 | −1.10 |
| G208.816-19.239 | OMC-2 | 06:35:27.5 | −05:09:37.0 | +11.3 | ⋯ | ⋯ | ⋯ | ⋯ | 20.63 × 13.11 | −20.08 | ⋯ | 19.45 × 11.68 | −11.81 |
| G208.993-19.385 | Orion-KL, Orion A | 05:35:14.4 | −05:22:30.0 | +8.6 | + | + | + | ⋯ | 19.53 × 12.08 | −7.52 | ⋯ | 18.67 × 10.12 | −1.31 |
| G353.41-0.36 | RAFGL 5345S | 17:30:26.5 | −34:41:57.0 | −16.5 | ⋯ | + | ⋯ | + | 46.00 × 13.97 | 20.18 | + | 41.53 × 9.53 | 18.75 |
| G354.61+0.47 | 17:30:17.0 | −33:13:55.0 | −17.8 | ⋯ | + | + | ⋯ | 44.40 × 13.91 | 22.08 | + | 42.92 × 10.38 | 20.90 | |
| G359.94+0.17 | 17:44:53.2 | −28:54:05.0 | +16.5 | ⋯ | ⋯ | ⋯ | ⋯ | 32.22 × 12.40 | 20.30 | ⋯ | 30.98 × 8.08 | 18.94 | |
A machine-readable version of the table is available.
3. Observations
The observations were conducted with the VLA of the National Radio Astronomy Observatory. The array was in its C-configuration, and the observations were performed during 2013 July–August under project code 13A-406. At 18 cm the synthesized beam of the interferometer was ∼15'' (see Table 2). Although the B-configuration would provide more precise positions and better brightness temperature limits, the 1720 MHz OH masers in SNRs show not only bright, compact maser spots but also weak, extended emission (Brogan 2007), and we would risk resolving it out at the 5'' resolution of B-configuration, hence the choice of C-configuration.
Table 2. OH Maser Parameters
| Source | Trans. | Pol. | R.A.(J2000) | Decl.(J2000) | Integrated | Peak | VLSR |
|---|---|---|---|---|---|---|---|
| Flux | Flux | ||||||
| (MHz) | (h m s) | (° ''') | (Jy) | (Jy beam−1) | (km s−1) | ||
| G0.54−0.85 | 1665 | R | 17:50:14.570 ± 0.023 | −28:54:30.16 ± 0.64 | 0.62 ± 0.04 | 0.68 ± 0.02 | 9.31 |
| 17:50:14.517 ± 0.008 | −28:54:31.25 ± 0.26 | 2.13 ± 0.05 | 2.17 ± 0.02 | 11.07 | |||
| 17:50:14.506 ± 0.006 | −28:54:31.11 ± 0.18 | 6.17 ± 0.09 | 6.22 ± 0.05 | 12.83 | |||
| 17:50:14.511 ± 0.011 | −28:54:31.08 ± 0.35 | 1.94 ± 0.06 | 2.01 ± 0.03 | 14.94 | |||
| 17:50:14.543 ± 0.010 | −28:54:31.31 ± 0.32 | 1.78 ± 0.05 | 1.75 ± 0.03 | 17.05 |
Note. Table 2 is published in its entirety in the machine-readable format. A portion is shown here for guidance regarding its form and content.
Only a portion of this table is shown here to demonstrate its form and content. A machine-readable version of the full table is available.
Download table as: DataTypeset image
The total observing time of 20 hr was divided into 1 hr sessions. Typical integration times were about 8 minutes on source, which allowed us to observe from two to eight targets and two calibration sources during one session. The flux and bandpass calibration was done using 3C 286 and 3C 48. Standard quasars from the VLA calibrator list were used for the phase calibration.
Using L band, we simultaneously observed the continuum at 1000–2000 MHz and OH maser emission from the four ground-state transitions at 1612.231, 1665.402, 1667.359, and 1720.53 MHz.
For the continuum observations we used eight spectral windows centered around 1500 MHz, each with 64 channels of 2 MHz width. Typically about two spectral windows were strongly affected by RFI, thus reducing both bandwidth and sensitivity. Typical rms noise levels are about 1 mJy beam−1, and the images are sensitive to structures up to ∼8'.
The OH lines were observed in four spectral windows with 512 channels each. The channel width was 1.953 kHz, corresponding to a velocity resolution of about 0.34 km s−1 and a velocity coverage of 170 km s−1. The typical rms noise in a line-free channel was ∼20 mJy beam−1, which provides a 5σ detection limit of about 0.1 Jy.
4. Data Reduction
The data were calibrated and analyzed with the NRAO software package CASA (Common Astronomy Software Applications; 6 McMullin et al. 2007). The main stages of the data calibration were performed with the CASA package "VLA calibration pipeline." Since the pipeline was originally designed to work for Stokes I continuum data, the standard calibration process was slightly modified to accommodate the spectral line data. In particular, we excluded the automatic procedure that searches for and flags RFI and that may remove the spectral line; the RFI search was done manually. Also, Hanning smoothing was not applied to avoid the loss in spectral resolution. No self-calibration was performed.
The calibrated data for each target source were split and imaged using the Clark CLEAN algorithm (Clark 1980). The imaging process was automated with Python scripts prepared for our data. First, for each maser source and transition, we searched for emission over 640'' × 640'' (about 40% of the primary beam) in unCLEANed maps. Then, the final maps of 320'' × 320'' were formed and CLEANed separately for right-handed circular polarization (RCP) and left-handed circular polarization (LCP). In this paper, we do not analyze the magnetic fields associated with the OH masers, but given the high importance of the polarization properties of the OH maser emission, we present data for both polarizations instead of Stokes I. The maps were cleaned (CASA task "CLEAN") to a flux limit of twice the theoretical noise level, with cleaning masks set around each maser spot. Absolute positions for the maser spots in every spectral channel were determined from the maps with the CASA task IMFIT.
A two-dimensional Gaussian brightness distribution was fit to every channel showing flux density above the 3σ level. These fits determine absolute positions and the flux densities (integrated and peak) of the maser spots. Emission caused by spectral ringing or sidelobes of the synthesized beam from other (stronger) features were excluded from the fitting. Then, spectra for each source were inspected and channels corresponding to the spectral line peaks were identified, thus providing the maser velocity.
We constructed composite spectra for all masers in each source by plotting for each spectral channel the flux density within a region encompassing all maser emission. Region sizes ranged from 30'' × 30'' up to 60'' × 60'' (depending on the beamwidth and positional angle) centered on the maser emission. Spectra were obtained with the CASA Spectral Profile Tool.
5. Results
We detect OH emission from 40 sources (50%) of our sample. Main-line OH emission at 1665 and 1667 MHz was found toward 38 sources (48%) and 29 sources (36%), respectively. The satellite OH line at 1612 MHz was detected in 11 sources (14% of the sample). The 1720 MHz emission line was detected in 16 sources (20%). The detection summary for each source is presented in Table 1, where the plus sign indicates detection and the minus sign indicates nondetection.
Table 2 contains the data on the OH maser spots associated with spectral line peaks for all detected sources. Only maser features with a flux density above 0.1 Jy are listed. The fitting uncertainty of the position is about 0.5'' for a 1 Jy single-channel peak. Note that absolute coordinates of the maser spots detected with the VLA can be affected by uncompensated ionospheric propagation delay; the effect is manifested in large N–S position uncertainties (up to 8'') for sources of decl. ≤30° (Argon et al. 2000). The size of each maser spot is not given in the table; detected spots are point-like considering the synthesized beam of this survey. Note that with the current spectral resolution (about 0.34 km s−1) some maser spots appear to be spectrally blended.
The spectra of the detected OH lines are displayed in Figure 1. For every source there are four panels, one for each OH transition, regardless of any signal detection. The OH transition is indicated at the upper center of each panel. The red and blue lines indicate RCP and LCP emission, respectively.

Figure 1.
The OH spectra obtained by the VLA observations. The data for the main (1665 and 1667 MHz) and satellite (1612 and 1720 MHz) OH lines are shown in consecutive panels for each detected source. The corresponding OH transition is indicated in each panel. RCP and LCP emission is indicated by red and blue, respectively. The complete figure set (40 images) is available in the online journal. (The complete figure set (40 images) is available.)
Download figure:
Standard image High-resolution imageFor each source the OH maser spot positions from Table 2 are plotted in Figure 2. Left-hand polarization spots are marked by circles, while right-hand polarization is shown by triangles. The OH maser frequency is indicated by color: 1612 MHz is blue, 1665 MHz is green, 1667 MHz is yellow, and 1720 MHz is red. Maps are centered on the geometric center of an OH maser cluster in each source; the corresponding absolute coordinates are listed at the bottom of each panel.

Figure 2.
The fitted positions of the OH maser spots detected with the VLA from Table 2 color-coded by frequency (1612 MHz—blue; 1665 MHz—green; 1667 MHz—yellow; 1720 MHz—red). Triangles represent RCP maser spots, while circles are LCP. The (0,0) reference position represents the geometric center of an OH maser cluster in each source; the corresponding absolute coordinates are indicated at the bottom of each map. The complete figure set (40 images) is available in the online journal. (The complete figure set (40 images) is available.)
Download figure:
Standard image High-resolution imageContinuum emission at 20 cm was detected toward 22 sources (28% of the sample); parameters determined by fitting 2D Gaussian profiles are presented in Table 3. In the case of extended or irregularly shaped emission, the size of the emitting region is represented by the length of N−S/E−W slices (values are given without errors). If the size is not specified, then the emission was unresolved by our beam.
Table 3. Parameters of 20 cm Continuum Emission Associated with OH Masers
| Source | R.A.(J2000) | Decl.(J2000) | Size | PA | Integrated | Peak |
|---|---|---|---|---|---|---|
| Flux | Flux | |||||
| (h m s) | (° ''') | (arcsec) | (deg) | (Jy) | (Jy beam−1) | |
| G0.54−0.85 | 17:50:14.195 ± 0.012 | −28:54:27.02 ± 0.24 | (15.6 ± 1.1) × (12.1 ± 3.8) | 105 ± 45 | 0.77 ± 0.02 | 0.32 ± 0.01 |
| G5.89−0.39 | 18:00:30.421 ± 0.004 | −24:04:01.84 ± 0.15 | (37.2 ± 5.3) × (10.6 ± 6.7) | 134 ± 10 | 0.29 ± 0.01 | 0.33 ± 0.01 |
| G8.67−0.36 | 18:06:18.897 ± 0.003 | −21:37:33.45 ± 0.10 | ⋯ | ⋯ | 0.43 ± 0.01 | 0.38 ± 0.01 |
| G19.61−0.23 | 18:27:38.226 ± 0.003 | −11:56:34.89 ± 0.11 | (22.8 ± 0.6) × (11.1 ± 0.5) | 154 ± 2 | 2.12 ± 0.03 | 1.01 ± 0.01 |
| G24.79+0.084 | 18:36:10.298 ± 0.004 | −07:11:24.17 ± 0.17 | (42.7 ± 2.9) × (27.8 ± 2.4) | 81 ± 8 | 1.36 ± 0.01 | 0.17 ± 0.01 |
| G26.602−0.220 | 18:40:37.472 ± 0.006 | −05:43:19.37 ± 0.17 | ⋯ | ⋯ | 0.21 ± 0.01 | 0.18 ± 0.003 |
| G27.369−0.164 | 18:41:50.900 ± 0.020 | −05:01:45.02 ± 0.47 | ⋯ | ⋯ | 0.06 ± 0.01 | 0.05 ± 0.003 |
| G28.303−0.389 | 18:44:22.432 ± 0.055 | −04:17:46.41 ± 0.65 | (40.6 ± 2.0) × (36.0 ± 2.8) | 167 ± 26 | 0.17 ± 0.01 | 0.05 ± 0.002 |
| G29.96−0.02 | 18:46 04.189 ± 0.047 | −02:39:20.13 ± 0.62 | ⋯ | ⋯ | 0.55 ± 0.03 | 0.35 ± 0.01 |
| G31.41+0.31 | 18:47:34.105 ± 0.021 | −01:12:43.11 ± 0.25 | ⋯ | ⋯ | 0.21 ± 0.01 | 0.18 ± 0.004 |
| G41.377+0.038 | 19:06:48.398 ± 0.030 | +07:31:40.96 ± 0.85 | ⋯ | ⋯ | 0.06 ± 0.01 | 0.03 ± 0.002 |
| G43.167+0.011 | 19:10:13.622 | +09:06:14.03 | ⋯ | ⋯ | 0.62 | 0.58 |
| G49.49−0.387 | 19:23:42.058 ± 0.003 | +14:30:37.88 ± 0.19 | 63.4 × 64.4 | ⋯ | 2.32 ± 0.02 | 0.39 ± 0.01 |
| G69.541−0.975 | 20:10:09.084 ± 0.011 | +31:31:35.81 ± 0.09 | ⋯ | ⋯ | 0.04 ± 0.001 | 0.03 ± 0.001 |
| G77.462+1.759 | 20:20:39.250 ± 0.010 | +39:37:51.25 ± 0.15 | ⋯ | ⋯ | 0.03 ± 0.001 | 0.02 ± 0.001 |
| G81.877+0.784 | 20:38:37.768 ± 0.018 | +42:37:59.34 ± 0.27 | ⋯ | ⋯ | 0.08 ± 0.01 | 0.08 ± 0.005 |
| G111.542+0.777 | 23:13:45.440 ± 0.004 | +61:28:20.62 ± 0.02 | ⋯ | ⋯ | 0.89 ± 0.01 | 0.76 ± 0.003 |
| G133.949+1.065 | 02:27:04.129 ± 0.017 | +61:52:26.26 ± 0.04 | (51.2 ± 11.1) × (15.6 ± 6.8) | 159 ± 8 | 0.10 ± 0.01 | 0.10 ± 0.01 |
| G173.719+2.698 | 05:40:52.764 ± 0.010 | +35:42:18.70 ± 0.11 | (18.5 ± 0.4) × (16.1 ± 0.4) | 122 ± 9 | 0.30 ± 0.01 | 0.12 ± 0.002 |
| G205.109−14.11 | 05:47:04.852 ± 0.019 | +00:21:44.53 ± 0.29 | ⋯ | ⋯ | 0.01 ± 0.001 | 0.01 ± 0.001 |
| G353.41−0.36 | 17:30:27.451 ± 0.011 | −34:41:43.04 ± 0.31 | 85 × 65 | ⋯ | 5.02 ± 0.06 | 1.25 ± 0.01 |
| G354.61+0.47 | 17:30:14.822 ± 0.055 | −33:14:09.64 ± 0.72 | (52.9 ± 2.2) × (41.9 ± 4.3) | 55 ± 14 | 1.12 ± 0.09 | 0.16 ± 0.01 |
A machine-readable version of the table is available.
Download table as: DataTypeset image
6. Discussion
6.1. Detection Statistics
The detected OH maser spots in the majority of cases are unresolved by our synthesized beam of ∼15''. Nevertheless, this is sufficient to confirm the maser nature of the emission—a ∼2 Jy unresolved source has a brightness temperature greater than 5000 K.
Many of the sources show multicomponent, highly polarized OH spectra with strong fluxes (up to 389 Jy detected at 1665 MHz toward W3(OH)). Only a quarter of the sources have OH flux densities ∼1 Jy or less (Figure 1). Notable are the prevalence of 1665 MHz masers among the detected sources and the high OH(1665)/OH(1667) correlation (emission at 1667 MHz is accompanied by 1665 MHz OH lines in 76% of the cases). These results agree well with previous findings (e.g., Caswell 1998; Szymczak & Gérard 2004; Beuther et al. 2019).
Maps of the OH maser spatial distribution show clustering of the masers, with ubiquitous overlap of OH(1665) and OH(1667) maser spots. In most cases the size of the OH clusters does not exceed 12'' (Figure 2).
- 1.Five sources of the sample (W28-A2, W49N, W51e1/e2, ON 1, and W3(OH)) show all four OH maser transitions. These sources are known H ii regions, and we detect 20 cm continuum emission in addition to the masers.
- 2.Four sources (G73.062+1.797, G111.236−1.238, G121.298+0.659, G203.316+2.055) show OH emission solely at 1665 MHz. They show a simple single- or double-peak spectrum with weak flux density of ∼1 Jy. No 1.5 GHz continuum emission is found toward these four sources. Note that G111.236−1.238 was previously listed as a nondetection in main OH maser lines in single-dish surveys (Wouterloot et al. 1993; Edris et al. 2007).
- 3.Predominant emission at 1667 MHz is detected in 6 of the 38 sources showing OH main lines: G0.54−0.85, W28-A2, G25.826−0.178, G26.508+0.283, G26.602−0.220, G31.41+0.31. Emission at 1667 MHz can occur at lower OH densities than emission at 1665 MHz (Gray et al. 1992), thus suggesting a lower-density environment in these six sources.
- 4.The OH satellite lines are accompanied by main-line emission with only two exceptions: G78.87+2.76, with only an OH(1612) maser, and G77.462+1.759, with only an OH(1720) maser. OH(1612) is the rarest maser line detected in our survey. In all cases, the 1612 MHz emission is weaker than the main-line emission.
6.2. The OH(1720) Subsample
6.2.1. General Information
Following the original motivation of the survey, we will separately consider the 16 sources with detections of OH(1720) masers. The list of these masers is provided in Table 4.
Table 4. Separation between a 20 cm Continuum Source and Other Objects
| Source | Coordinates | Separation from 20 cm Cont. | Distance c | ||||||||||||||
|---|---|---|---|---|---|---|---|---|---|---|---|---|---|---|---|---|---|
| 20 cm Cont. | OH(1612) a | OH(1665) a | OH(1667) a | OH(1720) a | cIMM b | OH(1612) | OH(1665) | OH(1667) | OH(1720) | cIMM | |||||||
| (arcsec) | (pc) | (arcsec) | (pc) | (arcsec) | (pc) | (arcsec) | (pc) | (arcsec) | (pc) | (kpc) | |||||||
| G0.54−0.85 | 17:50:14.195 | ⋯ | 17:50:14.523 | 17:50:14.500 | 17:50:14.327 | 17:50:14.631* | ⋯ | ⋯ | 6.62 | 0.11 | 6.52 | 0.10 | 5.01 | 0.08 | 24.47 | 0.39 | 3.291 |
| −28:54:27.02 | −28:54:31.45 | −28:54:31.67 | −28:54:22.42 | −28:54:50.6 | |||||||||||||
| G5.89−0.39 | 18:00:30.421 | 18:00:30.405 | 18:00:30.362 | 18:00:30.429 | 18:00:30.536 | 18:00:29.522 | 0.38 | 0.002 | 2.12 | 0.01 | 0.2 | 0.001 | 3.30 | 0.02 | 52.53 | 0.33 | 1.282 |
| −24:04:01.84 | −24:04:01.54 | −24:04:03.77 | −24:04:01.68 | −24:04:04.65 | −24:03:52.6 | ||||||||||||
| G6.05−1.45 | ⋯ | ⋯ | 18:04:53.148 | ⋯ | 18:04:53.147 | 18:04:53.013 | ⋯ | ⋯ | ⋯ | ⋯ | ⋯ | ⋯ | ⋯ | ⋯ | ⋯ | ⋯ | 1.253 |
| −24:26:41.80 | −24:26:42.58 | −24:26:40.5 | |||||||||||||||
| G8.67−0.36 | 18:06:18.897 | 18:06:18.869 | 18:06:19.039 | ⋯ | 18:06:19.025 | 18:06:19.174 | 1.01 | 0.02 | 2.20 | 0.05 | ⋯ | ⋯ | 2.14 | 0.05 | 8.94 | 0.19 | 4.404 |
| −21:37:33.45 | −21:37:32.53 | −21:37:32.89 | −21:37:32.50 | −21:37:25.5 | |||||||||||||
| G19.61−0.23 | 18:27:38.226 | ⋯ | 18:27:38.052 | 18:27:38.045 | 18:27:37.950 | 18:27:37.442 | ⋯ | ⋯ | 3.26 | 0.05 | 3.68 | 0.06 | 5.39 | 0.09 | 12.30 | 0.20 | 3.381 |
| −11:56:34.89 | −11:56:36.85 | −11:56:36.69 | −11:56:31.44 | −11:56:38.4 | |||||||||||||
| G31.41+0.31 | 18:47:34.105 | ⋯ | 18:47:34.066 | 18:47:34.051 | 18:47:34.142 | 18:47:34.592 | ⋯ | ⋯ | 1.21 | 0.04 | 1.29 | 0.04 | 2.56 | 0.08 | 9.36 | 0.28 | 6.271 |
| −01:12:43.11 | −01:12:44.17 | −01:12:44.12 | −01:12:45.61 | −01:12:49.0 | |||||||||||||
| G43.167+0.011 | 19:10:13.622 | 19:10:14.115 | 19:10:13.172 | 19:10:13.477 | 19:10:13.412 | 19:10:13.315* | 13.24 | 0.71 | 6.99 | 0.38 | 2.18 | 0.12 | 7.81 | 0.42 | 4.69 | 0.25 | 11.115 |
| +09:06:14.03 | +09:06:25.01 | +09:06:12.20 | +09:06:14.10 | +09:06:21.18 | +09:06:14.3 | ||||||||||||
| G49.49−0.387 | 19:23:42.058 | 19:23:43.853 | 19:23:43.888 | 19:23:43.908 | 19:23:43.827 | 19:23:43.962 | 27.12 | 0.71 | 28.85 | 0.76 | 29.24 | 0.77 | 26.81 | 0.70 | 29.35 | 0.77 | 5.416 |
| +14:30:37.88 | +14:30:34.63 | +14:30:29.01 | +14:30:28.65 | +14:30:34.05 | +14:30:31.0 | ||||||||||||
| G59.832+0.671 | ⋯ | ⋯ | 19:40:59.274 | ⋯ | 19:40:59.727 | 19:40:59.043 | ⋯ | ⋯ | ⋯ | ⋯ | ⋯ | ⋯ | ⋯ | ⋯ | ⋯ | ⋯ | 3.541 |
| +24:04:44.70 | +24:04:43.30 | +24:04:44.2 | |||||||||||||||
| G69.541−0.975 | 20:10:09.084 | 20:10:08.960 | 20:10:09.006 | 20:10:09.013 | 20:10:09.501 | 20:10:08.112 | 1.87 | 0.02 | 1.38 | 0.02 | 1.37 | 0.02 | 6.67 | 0.08 | 14.86 | 0.17 | 2.357 |
| +31:31:35.81 | +31:31:35.61 | +31:31:35.07 | +31:31:34.95 | +31:31:38.12 | +31:31:33.1 | ||||||||||||
| G77.462+1.759 | 20:20:39.250 | ⋯ | ⋯ | ⋯ | 20:20:39.450 | 20:20:39.793 | ⋯ | ⋯ | ⋯ | ⋯ | ⋯ | ⋯ | 3.03 | 0.02 | 36.85 | 0.29 | 1.601 |
| +39:37:51.25 | +39:37:51.69 | +39:38:15.3 | |||||||||||||||
| G81.877+0.784 | 20:38:37.768 | ⋯ | 20:38:36.468 | 20:38:36.450 | 20:38:36.445 | 20:38:37.192 | ⋯ | ⋯ | 31.38 | 0.20 | 31.66 | 0.20 | 31.78 | 0.20 | 8.73 | 0.06 | 1.308 |
| +42:37:59.34 | +42:37:34.75 | +42:37:34.61 | +42:37:34.52 | +42:37:58.3 | |||||||||||||
| G106.797+5.312 | ⋯ | ⋯ | 22:19:18.134 | ⋯ | 22:19:17.665 | 22:19:18.254 | ⋯ | ⋯ | ⋯ | ⋯ | ⋯ | ⋯ | ⋯ | ⋯ | ⋯ | ⋯ | 0.769 |
| +63:18:48.90 | +63:18:40.29 | +63:18:48.3 | |||||||||||||||
| G111.542+0.777 | 23:13:45.440 | ⋯ | 23:13:45.300 | 23:13:45.347 | 23:13:45.343 | 23:13:45.532 | ⋯ | ⋯ | 10.84 | 0.14 | 10.79 | 0.14 | 11.21 | 0.14 | 21.12 | 0.27 | 2.6510 |
| +61:28:20.62 | +61:28:09.99 | +61:28:09.92 | +61:28:09.50 | +61:27:41.7 | |||||||||||||
| G133.949+1.065 | 02:27:04.129 | 02:27:03.891 | 02:27:03.720 | 02:27:03.782 | 02:27:03.862 | 02:27:04.625** | 4.54 | 0.04 | 6.29 | 0.06 | 5.97 | 0.06 | 4.16 | 0.04 | 7.39 | 0.07 | 1.9511 |
| +61:52:26.26 | +61:52:23.45 | +61:52:24.88 | +61:52:23.34 | +61:52:25.12 | +61:52:25.6 | ||||||||||||
| G353.41−0.36 | 17:30:27.451 | ⋯ | 17:30:26.281 | ⋯ | 17:30:26.282 | 17:30:26.481 | ⋯ | ⋯ | 17.55 | 0.32 | ⋯ | ⋯ | 17.54 | 0.32 | 20.24 | 0.37 | 3.8012 |
| −34:41:43.04 | −34:41:43.39 | −34:41:43.33 | −34:41:57.1 | ||||||||||||||
Note. Asterisk indicates single-dish data; double asterisk indicates that no 44 GHz masers were detected in this field in Kurtz et al. (2004).
a Position of the brightest maser spot detected in this survey. b Positions of the brightest cIMM spot; information is taken from (1) Slysh et al. (1994), (2) Kurtz et al. (2004), (3) Gómez-Ruiz et al. (2016), (4) Gómez et al. (2010), (5) Haschick et al. (1990). c Information on distances is taken from (1) Reid et al. (2016) (values calculated with "Bayesian Distance Calculator") (2) Motogi et al. (2011), (3) Prisinzano et al. (2005), (4) Green & McClure-Griffiths (2011), (5) Zhang et al. (2013), (6) Sato et al. (2010), (7) Xu et al. (2013), (8) Rygl et al. (2012), (9) Hirota et al. (2008), (10) Moscadelli et al. (2009), (11) Xu et al. (2006), (12) Fish et al. (2003).A machine-readable version of the table is available.
The OH(1720) masers detected by our survey are associated with OH(1665) emission in 94% of the cases, OH(1667) in 69%, OH(1612) in 31%, and 20 cm continuum emission in 81%. Six sources show all four OH lines, nine sources show OH(1720) emission together with the main lines, and one source shows only OH(1720) emission.
Two sources with OH(1720) detections were not detected previously in this line: M8E in the single-dish survey of high-mass protostellar objects of Edris et al. (2007), and S140 IRS1 in dedicated MERLIN observations of this source (Asanok et al. 2010).
All 16 sources showing 1720 MHz OH emission are well-known and well-studied objects identified with H ii regions. We detect continuum emission at 1.5 GHz toward all but three of them (M8E, G59.832+0.671, and S140 IRS1). All 16 sources in which we detect 1720 MHz OH maser emission are associated with outflows detected in thermal molecular lines (mostly in CO; see the catalogs of Bayandina et al. 2012; Wu et al. 2004).
In many cases the OH(1720) emission lines are weak, with flux densities <1 Jy, but there are four sources of ∼3–6 Jy and five sources of ∼20–50 Jy flux density (Figure 1). The brightest OH(1720) lines are found in RAFGL 5345 and the well-known sources W51e1/e2, W75N, NGC 7538, and W3(OH). There are three sources whose strongest OH emission is at 1720 MHz: G8.67−0.36, NGC 7538, and RAFGL 5345.
6.2.2. Comparison with Previous Surveys
The OH(1720) maser detection rate from this survey is 20%, which is similar to or higher than the rates of some other surveys. OH maser emission at 1720 MHz was found toward 6% of 100 northern SFRs hosting the 6.7 GHz cIIMMs with the Nançay radio telescope survey of Szymczak & Gérard (2004). A search for 1720 MHz OH maser emission toward 200 southern sites of 1665 and 6035 MHz OH masers, without regard to their association with the 6.7 GHz cIIMMs, had a detection rate of 14% (Caswell 2004). A recent VLBA survey searched for OH satellite lines in 41 SFRs and found a detection rate similar to ours—1720 MHz emission was detected in 24% of the sources (Ruiz-Velasco et al. 2016).
However, the OH(1720) maser detection rate of our VLA observations is lower than that of our previous RT-70 single-dish survey, where narrow (<2 km s−1) OH(1720) emission lines were detected toward 35% of the sources (Litovchenko et al. 2012). Both surveys had the same target sample—the cIMM maser catalog (Bayandina et al. 2012)—but, due to technical constraints (see Section 2), different sets of sources were observed with the RT-70 and with the VLA. There are 64 cIMMs that were included in both surveys. With the RT-70, OH(1720) maser emission was detected in 15 of these, and the VLA interferometric observations confirmed detection of 11 sources.
There are only four sources where narrow OH(1720) lines were detected with the RT-70 but not with the VLA: G35.05−0.52, DR21(OH), W3(3), and G354.61+0.47. There is no OH(1720) maser spot at the coordinates of G35.05−0.52 according to the VLA image, and there are no strong OH sources in the VLA field that would fall into the RT-70 beam. A possible explanation is that the emission detected with the RT-70 is variable or entered through an RT-70 sidelobe. Note that the 1720 MHz OH line detected with the RT-70 is shifted from the velocity of associated cIMM by about 15 km s−1, and the latter suggestion might also explain this velocity difference. The spectral feature detected in DR21(OH) with RT-70 is most probably associated with a relatively strong (∼9 Jy) maser in W75S, the distance between the sources is <2', and W75S falls in the field of view of the VLA and RT-70. A complex OH(1720) spectrum with weak emission shifted from the velocity of the cIMM and absorption lines (at the cIMM velocity) was observed in the direction of W3(3) with the RT-70, but no evidence of OH(1720) emission is found with the VLA. There is no indication of emission at 1720 MHz in the VLA image of G354.61+0.47; the narrow RT-70 line may be variable or resolved out.
6.2.3. Spatial Distribution of Maser Sources
For the 16 fields showing OH maser emission at 1720 MHz, we have prepared combined maps (see Figure 3) and calculated the projected linear distance from the 20 cm continuum sources to the positions of the OH masers and cIMMs (see Table 4). For each source only the strongest maser spot was used. The positions of OH(1612), OH(1665/1667), and OH(1720) masers and 20 cm continuum sources are from this survey. The cIMM positions were taken from the literature—interferometric observations of the 44 GHz methanol maser transition have been reported for 13 of the 16 sources. Single-dish positions were used in calculations for the remaining three sources (see the notes to Table 4 for the references of the maser position origin). A histogram showing the maser spatial offset from the continuum, based on the calculations from Table 4, is presented in Figure 4. Note that not all 16 detections of OH(1720) from Table 4 are plotted: we excluded sources in which no 20 cm continuum was detected (M8E, G59.832+0.671, and S140 IRS1) and sources in which the association between the continuum and maser emission is questionable because of the large spatial separation (W49N, W51e1/e2, W75N, and RAFGL 5345S). In these cases, the masers could be associated with younger objects in the field that do not emit at 20 cm. For example, W51e1/e2, where separation between the brightest maser spot and 20 cm continuum source is 0.7 pc (Figure 3).

Figure 3.
The objects detected in the sources showing OH emission at 1720 MHz: green circle—position of the brightest OH(1665) maser spot; red circle—position of the brightest OH(1720) maser spot; magenta (interferometric data) or purple (single-dish data) cross—position of the brightest 44 GHz cIMM maser spot (from literature); star—position of the detected 20 cm continuum source. If detected, the maps are centered on the position of 20 cm continuum emission; otherwise, the reference position is the brightest OH(1665) maser spot. The physical scale label (in parsecs) indicates 1'' of each map and assumes the source distances listed in Table 4. The complete figure set (16 images) is available in the online journal. (The complete figure set (16 images) is available.)
Download figure:
Standard image High-resolution image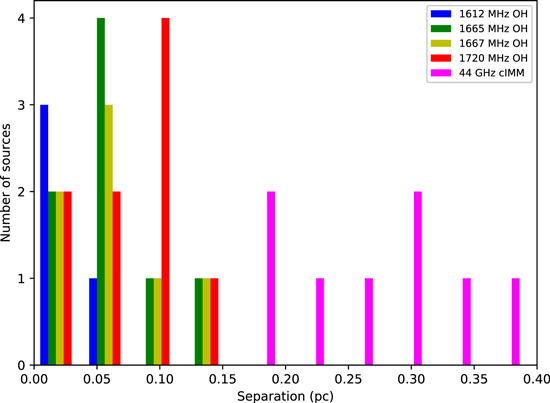
Figure 4. Histogram of the linear projected offset between the 20 cm continuum source position and the positions of the brightest OH and cIMM spots. Sources represented in the histogram and their adopted distances are given in Table 4.
Download figure:
Standard image High-resolution image
The histogram shows a clear distinction between the OH and 44 GHz methanol masers. The detected OH masers (including OH(1720)) are found in close proximity to a 20 cm continuum source with a separation of <0.15 pc, while the 44 GHz cIMMs are more distant at >0.15 pc.
OH masers at 1612 MHz are found to be the closest to the 20 cm continuum source—the median separation is 0.03 pc. OH masers at 1665, 1667, and 1720 MHz are located farther from a 20 cm continuum source, but all at roughly the same median distance of 0.08 pc, which is similar to the ≤0.1 pc size of ultracompact H ii regions (Kurtz 2005). In OH clusters, OH(1665) and OH(1667) masers show close spatial coexistence—their projected linear separation is ∼0.01 pc (median value). Both OH(1612) and OH(1720) are separated from OH(1665/1667) maser positions by ∼0.04 pc.
The median value of the linear projected offset between the cIMM positions and the corresponding 20 cm continuum source is 0.27 pc, i.e., cIMMs are located at distances similar to the reported sizes of outflows in MSFRs, which is ∼0.1 to >1 pc (with an average size of ∼0.8 pc; Beuther et al. 2002).
There are three sources whose projected linear separation between OH(1720) and cIMM is smaller than the separation between OH(1720) and OH(1665): W49N, W51e1/e2, and S140 IRS1. For both W49N and S140 IRS1 only single-dish positions for the 44 GHz cIMMs are available. Relatively close association of the 44 GHz methanol masers with an H ii region is confirmed by interferometric observations of W51e1/e2 (Kurtz et al. 2004). In the case of W49N, the OH(1665)/(1720) separation is ∼0.5 pc; there are two OH(1720) maser clusters each separated by ∼10'' (∼0.5 pc) from the main OH(1665/1667) cluster (see Figure 2). There are several nearby 20 cm continuum sources in the image of W49N, which causes confusion and precludes an accurate determination of the OH–continuum offset.
6.2.4. Possible Candidates of Collisionally Pumped OH(1720) Masers
A few potential candidates for harboring collisionally pumped OH(1720) masers were identified in our VLA survey, in this subsection we analyze the indications against and in favor of this pumping mechanism in each of the cases.
In Argon et al. (2003), possible outflow-associated 1720 MHz OH masers were found toward the pre-UCH ii source W3(OH)-TW, which drives an outflow. Because of the angular resolution limitations of the present C-configuration VLA survey, we cannot confirm the detection of such masers—the angular separation between W3(OH) and W3(OH)-TW is ∼7'', so both sources fall within our 22 8 × 138 beam. The VLA A-configuration study of Argon et al. (2003) showed that a weak 1665 MHz OH maser at ∼42 km s−1 is associated with the W3(OH)-TW outflow rather than the W3(OH) UCH ii region. We detect the maser feature at this velocity, but our spatial resolution is insufficient to associate it with either of the sources. W3(OH)-TW is a promising source for OH(1720) maser observations at 1720 MHz; for example, Sutton et al. (2004) showed that the region is dominated by collisional excitation based on the detection of extended cIMM emission at 84.5 GHz and 95.2 GHz.
There is one source in the sample that shows OH line emission solely at 1720 MHz—G77.462+1.759. OH maser emission from this source was previously reported in the single-dish survey of Edris et al. (2007). Those authors noted that such masers may trace postshock gas. We detected two weak ∼0.2 Jy OH(1720) lines in LCP polarization at velocities of −0.99 and −20.39 km s−1. These lines are shifted from the systemic velocity of ∼+2 km s−1 and fall under the blue wing of the CO line (Xu & Wang 2013), which may indicate their association with a bipolar outflow. There is also a highly variable H2O maser with a peak velocity of ∼−1.1 km s−1 (Codella et al. 1996). In the survey of Edris et al. (2007), only the ∼−1 km s−1 component was reported, with the flux density of 4.18 Jy; the line at ∼−20 km s−1 is absent in the single-dish spectrum. The feature at ∼−1 km s−1 seems to be spatially resolved in the VLA observations with an integrated flux density ∼0.2 Jy, which is ∼20 times lower than the single-dish flux. This fact may also suggest a shock-exited nature of the OH(1720) maser. It was noted that for OH(1720) masers in SNRs the flux densities obtained in single-dish observations are significantly higher than in interferometric observations (Hewitt et al. 2007, 2008). There is "extended" 1720 MHz maser emission detected in the direction of SNRs, i.e., these masers have a large angular size and are partially resolved out by interferometric observations (Hewitt et al. 2008). The OH(1720) maser spot at ∼ −1km s−1, detected in the present survey with a beam of ∼15'', is slightly elongated in the E–W direction with a length of ∼28''.
There are also some characteristics that argue in favor of radiative pumping for the OH(1720) maser in G77.462+1.759: a 20 cm continuum source is detected in the field, and a marginal detection of a 1665 MHz OH maser spot at a velocity of −7.44 km s−1 with flux density of 0.08 Jy (slightly below our threshold of 0.1 Jy) is found. The 20 cm continuum source is about 3'' to the west of the 1720 MHz maser and coincides with IRAS and VLA 3.6 cm and 6 cm sources (Jenness et al. 1995; Molinari et al. 1998) and CARMA 3 mm continuum core A (Wolf-Chase et al. 2013), which (of five compact cores present) is considered to be the oldest site of massive star formation in the region and is associated with an E–W outflow (Wolf-Chase et al. 2013). cIMM emission at 44 GHz (Gómez-Ruiz et al. 2016) and 95 GHz (Wolf-Chase et al. 2013) is detected in G77.462+1.759, in association with CARMA 3 mm continuum core D located ∼25'' to the north from core A. Emission at OH frequencies other than 1720 MHz has never been reported toward G77.462+1.759; additional OH observations are required to confirm our marginal detection at 1665 MHz.
Of particular interest are the sources detected with RT-70, but not with the VLA: G35.05−0.52, DR21(OH), W3(3), and G354.61+0.47. These sources were considered to be reliable detections in the RT-70 single-dish observations, with flux densities of >1 Jy (Litovchenko et al. 2012). In most of the RT-70 spectra there are highly polarized, narrow, single-peaked OH(1720) lines that are slightly shifted from systemic velocities of the sources. The only exception is W3(3) with a complicated OH(1720) emission/absorption spectrum. No OH maser lines are detected in the direction of G35.05−0.52 or W3(3) with the VLA. The other two sources—DR21(OH) and G354.61+0.47—show OH main-line emission, although the main-line velocities do not coincide precisely with the OH(1720) velocities in either case: in DR21(OH) the OH(1665) peak is at 1.56 km s−1 (VLA data) and the OH(1720) peak is at 3.95 km s−1 (RT-70 data); in G354.61+0.47 the OH(1665) peaks at −14.91 km s−1 (VLA data) and the OH(1720) peaks at −17.70 km s−1 (RT-70 data). These sources should be reobserved to check for the presence of "extended" 1720 MHz maser emission that was probably detected in the single-dish observations, but not with the interferometer.
6.2.5. OH(1720) Maser Pumping
It is known that the radiative pumping of the 1720 MHz OH masers associated with SFRs requires high densities (Caswell 1999), which is distinctly different from the collisional pumping of such masers in SNRs in a lower-density regime (Pavlakis & Kylafis 1996a).
Weak OH(1720) masers arise in SNRs under a very tight combination of conditions (temperatures of 50−125 K, densities of ∼105 cm−3, and OH column densities of ∼1016 cm−2) via collisional pumping (Pavlakis & Kylafis 1996a; Lockett et al. 1999). Although these conditions are favorable for OH(1720), they are not suitable for other OH maser transitions: OH(1665/1667) masers require higher dust temperatures, and OH(1612) requires a larger OH column density (Lockett et al. 1999). Thus, a clear indication of the detection of a collisionally pumped 1720 MHz OH maser is the absence of other OH lines in the spectra, since the OH(1720) maser will be destroyed if the physical conditions support any other OH species. The 1720 MHz OH maser emission lines accompanied by absorption in main OH lines at 1665 and 1667 MHz are known to indicate sites where SNRs interact with the interstellar medium (e.g., Hewitt et al. 2008 and references therein).
In contrast, star formation sites show OH in emission not only at 1720 MHz but also at 1665/1667 MHz (Turner 1979). Conditions favorable for both OH(1665/1667) and OH(1720) masers can exist in SFRs where higher densities (105−108 cm−3), an infrared radiation field, and a large velocity gradient admit the operation of radiative (nonlocal line overlap) excitation mechanism (Gray et al. 1992; Pavlakis & Kylafis 1996b; Cragg et al. 2002).
In the majority of the cases, OH(1720) maser lines detected in the present VLA survey are accompanied by OH main-line emission at the same velocities and 20 cm continuum emission, which may indicate the radiative pumping mechanism. Nevertheless, we conclude that the current data are insufficient to completely rule out the possibility of collisionally pumped 1720 MHz OH masers in SFRs.
The idea of our study is similar to Pihlström et al. (2014), where 36 GHz and 44 GHz cIMM lines were searched for in a sample of Galactic SNRs associated with 1720 MHz OH masers. The survey of Pihlström et al. (2014) is based on the fact that both types of masers—cIMMs and OH(1720)—are shock-excited and trace C-shocks in SNRs, but the authors emphasize that it is the larger range of physical conditions allowing methanol maser action that makes methanol a more widespread signpost for SNR−molecular cloud interactions. The severe limitation on the required OH column density significantly reduces the probability of the OH(1720) maser excitation and narrows down the physical conditions and geometry of the shocked regions in which the masers are formed (Lockett et al. 1999). Recent observations confirm the assumption of Pihlström et al. (2014)—a dedicated search for 44 GHz cIMMs in the Galactic center (McEwen et al. 2016) shows that cIMMs are much more abundant than OH. The same situation may also apply for SFRs. cIMMs are clearly the more widespread species, and hence more frequently encountered in SFRs than are the 1720 MHz OH masers.
In summary, our targeted survey for 1720 MHz OH masers in a sample of known 44 GHz cIMMs associated with SFRs identifies several promising targets in the search for collisionally pumped OH(1720). Our survey did not show a close spatial coincidence of cIMM and OH(1720), but while both 44 GHz cIMMs and 1720 MHz OH masers trace shocked gas in SNRs, it is known that they do not arise in the same volume of gas—methanol masers form in hotter and denser gas than OH (probably closer to the shock front; Pihlström et al. 2011, 2014; McEwen et al. 2016). Further interferometric observations of cIMMs are highly desirable to clarify the spatial coincidence of different types of masers. Also, there remains the problem of identification of the source hosting the OH masers owing to the relatively low angular resolution of our study. Thus, an important direction of future research suggested by our results is high spatial resolution observations of OH(1720) masers to confirm or refute their association with UCH ii regions. On the other hand, there are indications of the presence of "extended" 1720 MHz maser emission, which require additional single-dish/compact array observations. Finally, the possible existence of collisionally pumped OH(1720) masers in SFRs requires a dedicated modeling effort.
7. Conclusions
- 1.A survey of 80 cIMMs associated with SFRs was carried out in all four lines of the ground-state OH molecule in the 2Π3/2 transition at 18 cm wavelength. Observations were made with the VLA in C-configuration to test the hypothesis that shocks, possibly from molecular outflows related to star formation, give rise to the 44 GHz cIMM and 1720 MHz OH maser within the same field.
- 2.OH lines were detected in 40 sources (50%) of the sample. For all detected sources, interferometric positions and maps are presented. OH maser emission was detected toward 38 sources at 1665 MHz (48%) and toward 29 sources at 1667 MHz (36%). The maser OH line at 1612 MHz was detected in 11 sources (14%). The satellite maser line at 1720 MHz was detected in 16 sources (20%), with two new discoveries at this wavelength for sources M8E and S140 IRS1. Continuum emission at 20 cm was detected in the direction of 22 sources (28% of the 80 cIMMs sample).
- 3.From the survey data, the median separation between 20 cm continuum sources and OH maser positions (including OH(1720) masers) is 0.08 pc, which is similar to the ≤0.1 pc size of ultracompact H ii regions. The separation between continuum sources and cIMM positions is 0.27 pc, similar to the ∼0.8 pc reported sizes of outflows in MSFRs. Thus, spatial association of 1720 MHz OH masers and cIMMs is not revealed, but this does not contradict the results obtained for SNRs, where both types of masers trace shocked gas, but they do not arise in the same volume.
- 4.The survey has demonstrated several promising targets for follow-up studies. There are four sources where narrow OH(1720) lines were detected with the RT-70, but not with the VLA (G35.05−0.52, DR21(OH), W3(3), and G354.61+0.47), which may indicate a large angular size of OH(1720) maser spots. One source (G77.462+1.759) shows OH line emission solely at 1720 MHz, with the OH(1720) line associated in velocity with a CO outflow, and the maser spot is slightly elongated with a length of ∼28''.
- 5.In most cases the observed properties of the detected 1720 MHz OH masers indicate that a radiative pumping mechanism is responsible for their excitation: the 1720 MHz OH lines are accompanied by OH emission in main lines, and a remarkable number (of ∼81%) among detected OH(1720) masers are associated with 20 cm continuum emission. However, the obtained information is insufficient to rule out the possibility of collisionally pumped 1720 MHz OH masers in the fields of cIMM: there is still a lack of conclusive identification of the excitation sources of the OH(1720) masers and the possible presence of "extended" 1720 MHz maser emission. Testing of the possible joint existence of collisionally pumped OH(1720) and cIMMs in SFRs with numerical modeling is highly desirable.
We are grateful to the National Radio Astronomy Observatory of the USA for the opportunity to observe with the VLA and to the NRAO New Mexico staff for their assistance in carrying out the observations. The National Radio Astronomy Observatory is a facility of the National Science Foundation operated under cooperative agreement by Associated Universities, Inc.
We thank Dr. G. M. Larionov for help with the data reduction and paper preparation. We also thank the anonymous referee for the thoughtful analysis of our manuscript and helpful advice.
Footnotes
- 4
Hereafter, we call the maser emission in a single velocity channel of a data cube a "maser spot."
- 5
- 6