


Abstract
Using multipoint observations over 10 yr near 1 au, we investigate the spectra (5 minutes to 2 hr) of interplanetary Alfvén waves and the responses in the geomagnetic activities. We compute the two-point correlations of the wave magnetic field between the ACE and the THEMIS spacecraft, which are separated by ∼200 Earth radius (RE) in the solar wind. Alfvén waves associated with high two-point correlations exhibit steep spectra (spectra index ∼−1.63). Such Alfvén waves occur mostly in slow-speed streams. By contrast, Alfvén waves with low two-point correlations exhibit flatter spectra (spectra index ∼−1.51) with a relative enhancement of power above 2 × 10⁻⁴ Hz. The occurrence of Alfvén waves with low two-point correlations is more equally distributed between high-speed and low-speed streams. In general, interplanetary Alfvén waves show correlations with moderate geomagnetic responses in symmetric ring-current intensity, SuperMAG electrojet (SME), and Kp indices. Statistical analyses indicate that the Alfvén waves with flat spectra correspond to stronger responses in the geomagnetic indices than those with steep spectra, suggesting the importance of the tens of minutes (30–90 minutes) Alfvénic power spectra in the generation of SME/Auroral Electrojets. These observations may shed light on the response of the magnetosphere to fluctuating interplanetary magnetic field Bz.
Export citation and abstract BibTeX RIS

Original content from this work may be used under the terms of the Creative Commons Attribution 4.0 licence. Any further distribution of this work must maintain attribution to the author(s) and the title of the work, journal citation and DOI.
1. Introduction
Interplanetary Alfvén waves show a high correlation between velocity and magnetic field variations (Belcher & Davis 1971; Denskat & Burlaga 1977). The amplitude of the wave magnetic field can be larger than the average magnetic field (Belcher et al. 1969; Belcher & Davis 1971; Denskat & Burlaga 1977). The large-amplitude Alfvén waves are spherically polarized, with the rotation of the perturbation magnetic field on the surface of the sphere (Tsurutani et al. 1994, 2018). Alfvén waves are observed in a broad interplanetary region (Bruno et al. 2006). High levels of Alfvén wave activity are often observed in the high-speed solar wind streams and on their edges (Belcher & Davis 1971; Tsurutani et al. 2011; Shi et al 2015). Alfvén waves have also been investigated in the heliospheric current sheet (Dai et al. 2014; Li et al. 2020) and corotating interaction regions (CIRs; Tsurutani et al. 1994, 1995a, 1995b; Borovsky & Denton2010).
The spectra of the Alfvénic fluctuations have been a subject of great interest. The timescale of Alfvén waves varies from minutes to >10 hr (Belcher & Davis 1971; Smith et al. 1995). Power spectra of the Alfvénic magnetic field are shown to have a frequency dependence from f−1.5 to f−2.2 (Belcher & Davis 1971; Tsurutani et al. 1990, 2018). The spectral index of interplanetary fluctuations evolves with heliocentric distance (Bavassano et al. 1982; Tu et al. 1989; Tu & Marsch 1995). Power-law spectra have also been identified for Alfvénic fluctuations in the upstream region of the Earth's bow shock (Tsurutani et al. 1990; Wang et al. 2015; Guarnieri et al. 2018).
Alfvén waves represent a considerable source of southward interplanetary magnetic field (IMF; Gonzalez et al. 1999; Zhang et al. 2014). The magnetic reconnection between the southward Bz of interplanetary Alfvén waves and the magnetic field of the magnetosphere are considered to drive geomagnetic activity (Tsurutani & Gonzalez 1987; Tsurutani et al. 1990; Gonzalez et al. 1999; Hajra et al. 2014a). During CIR and high-speed streams, Alfvén waves produce the high-intensity long-duration continuous Auroral Electrojet (AE) activity (Tsurutani & Gonzalez 1987; Hajra et al. 2013). Interplanetary Alfvén waves are shown to be correlated with the AE index (Tsurutani & Gonzalez 1987; Tsurutani et al. 1990; Gonzalez et al. 1999; Diego et al. 2005; Chian et al. 2006; D'Amicis et al. 2007; Guarnieri et al. 2018). Repetitive substorms are reported to occur every ∼1–4 hr, associated with northward turnings of the Alfvénic IMF (Lee et al. 2006). Continuous Alfvén waves are inferred to extend the recovery phase of geomagnetic storms (Tsurutani et al. 2011; Raghav et al. 2018; Telloni et al. 2021).
Data from multiple spacecraft in the solar wind are often used to investigate the correlation of the magnetic field in the solar wind (Denskat & Burlaga 1977; Russell et al. 1980; Richardson et al. 1998; Richardson & Paularena 2001; Farrugia et al. 2005). The correlation of the magnetic field between multiple spacecraft may relate to information on the scales and evolution of the structure (Russell et al. 1980; Richardson & Paularena 2001; Farrugia et al. 2005). In this study, we provide multipoint observations of the spectra of the Alfvén waves and the geomagnetic response. The spectra and geomagnetic response of Alfvén waves are shown to depend on the two-point correlation between spacecraft.
The geomagnetic responses to interplanetary Alfvén waves are an important element in solar-wind–magnetosphere interaction. The southward Bz from Alfvén waves is quite unsteady compared to that in coronal mass ejection (CME)-driven storms. Fluctuating Bz components may drive intermittent magnetopause reconnection, resulting in time-dependent magnetosphere/ionosphere convection, and dynamical substorm activity (Kennel 1996; Gonzalez et al. 1999). The present study on the geomagnetic response to Alfvén waves may shed new light on the response of the magnetosphere to fluctuating IMFBz (e.g., Raab et al. 2016; Wang & Branduardi-Raymond 2018; Dai et al. 2020).
The remaining sections of the paper proceed as follows. In Section 2, we present the data and the instrumentation used in the study. Section 3 investigates the properties of spectra of Alfvén waves. The geomagnetic responses to the Alfvén waves are studied in Section 4. The results are summarized and discussed in Section 5.
2. Data and Instruments
This study uses data from the ACE, THEMIS-B(THB), and THEMIS-C(THC) in the solar wind near 1 au. The ACE is located around the L1 Lagrange point (about 220 ∼250RE upstream from Earth in the GSM X-axis). The X-GSM of THB and THC are ∼ −30–60RE . The magnetic field data are obtained from MAG/ACE with a 16 s resolution (Smith et al. 1998) and FGM/THEMIS in the spin resolution of about 3 s (Auster et al. 2008). The plasma data are obtained from SWEPAM/ACE with a 64 s resolution (McComas et al. 1998) and ESA/THEMIS in the spin resolution of about 3 s (McFadden et al. 2008). All the data used in our study are in the Geocentric Solar Magnetospheric (GSM) coordinates.
For the geomagnetic index, we use the symmetric ring-current intensity (SYM-H) index from the OMNI database. Dst and SYM-H are both indices to measure the intensity of the geomagnetic storm. SYM-H is essentially the same as the Dst index but with a high time resolution of 1 minute (Wanliss & Showalter 2006).
We use the SuperMAG electrojet (SME) indices, which is a generalized version of the AE indices (Newell & Gjerloev2011). Similarly, SMU and SML are the SuperMAG version of AU and AL, respectively. SME indices (SMU, SML) are at a 1 minute cadence and calculated with data from more than 100 stations. SMU/AU and SML/AL represent a measure of maximum eastward and westward AE current, respectively. SME/AE = SMU/AU-SML/AL represents a measure of the maximum AE current in the high-latitude ionosphere.
We use the 3 hr Kp index from the GFZ German Research Center for Geosciences (Matzka et al. 2021). The Kp is derived from 13 geomagnetic stations between 44° and 60° geomagnetic latitude. The Kp index ranges from 0–9 and is given in units of 1/3.
3. Multipoint Observation of Interplanetary Alfvén Waves
3.1. Alfvén Wave Events
Figure 1 provides an overview of the Alfvén wave events on 2011 February 8 and 2014 August 31. The solar wind speed is around ∼400–450 km s−1 during these time intervals (Figure 1(a), (d)). The THEMIS data is time shifted to the location of ACE. The time shift is estimated by finding the amount of time delay that corresponds to the maximal correlation of 6 hr intervals of Bz between ACE and THEMIS. For these two events, the time delay from ACE to THEMIS is roughly 1hr considering the solar wind speed and the separation of about ∼200RE between ACE and THEMIS. We obtain δBz (or δVz ) by subtracting the 6 hr running average Bz (or Vz ) from the original Bz (or Vz ). In each event, the δBz and δVz components exhibit a strong (>0.8) correlation (Figures 1(b), (c), (e), (f)). In our study, Alfvén waves are identified by high correlations (>0.8) between δVz and δBz in 6 hr intervals (Belcher & Davis 1971). Notice that the correlation between δB and δV may significantly vary in high-speed streams and CIRs (Tsurutani et al. 1995b, 2011).

Figure 1. Two events of interplanetary Alfvén waves observed by ACE and THB on 2011 February 8 (left) and 2014 August 31 (right). (a), (d) Solar wind velocity ∣V∣ from ACE (blue) and THB (red). (b), (e) δBz in GSM from ACE and THB. (c), (f) δVz in GSM from ACE and THB.
Download figure:
Standard image High-resolution imageThe Alfvén waves in the two events show significant differences. In the 2011 February 8 event, the δ Bz has a high correlation (≈0.901) between ACE and THB as shown in Figures 1(b) and (c). THB observes almost the same waveform of Bz as the Alfvén waves are convected by the solar wind from ACE to THB. In the 2014 August 31 event, however, ACE and THB observed distinctly different Bz waveforms. The correlation of δBz between ACE and THB is weak (≈0.325).
Previous studies from ISEE spacecraft suggest that small-scale IMF structures may have low correlations over the distance of ∼200RE (Russell et al. 1980; Tsurutani et al. 1990; Guarnieri et al. 2018). Fluctuations of small-wavelength are more likely to evolve and decorrelate over a certain distance (∼200RE ) (Russell et al. 1980; Richardson & Paularena 2001; Farrugia et al. 2005). Hence, the two-location correlation may reflect some information regarding the scales or evolution of Alfvén waves. The observations in Figure 1 motivate us to classify and analyze Alfvén waves using the two-point correlation in the solar wind in the next section.
3.2. Statistical Study of the Alfvén Waves' Spectra
The database for the statistical study consists of ACE and THEMIS data from 2010 October to 2020 October. THB and THC are mostly in the solar wind but occasionally traverse the Earth's magnetosphere. Two criteria are applied to ensure THB and THC are in the interplanetary space: the proton number density is less than 50 cm−3 and the proton velocity is more than 200 km s−1. The intervals when the two THEMIS spacecraft are located in the lunar shadow are also excluded (Sibeck et al. 2011).
We divide ACE and THEMIS data into samples of 6 hr intervals. ACE and THEMIS satellites move less than ∼15 RE during a 6 hr interval. The spacecraft motion is much less than the ACE-THEMIS separation of ∼200RE . Thus, ACE and THEMIS are treated as stationary in each 6 hr interval. The data from THEMIS are time shifted to ACE as described in the event study. The magnetic field and velocity data are all interpolated to the same (64 s) time resolution. Each 6 hr interval is identified as an Alfvén wave event if the absolute value of the correlation between δ Bz and δ Vz is larger than 0.8. This criterion for Alfvén waves is consistent with previous studies (Belcher et al. 1969; Tsurutani et al. 1990; Shi et al 2015). We find a total of 2346 samples of events of Alfvén waves encountered by both ACE and THEMIS spacecraft.
For each event of Alfvén waves, we compute the two-point correlation of δ Bz between ACE and THEMIS. The distribution of the two-point correlation is shown in Figure 2(a). We categorize the Alfvén waves into three types: the high two-point correlation (>0.8, orange) type, the medium two-point correlation (0.5 ∼ 0.8, blue) type, and the low two-point correlation (<0.5, black) type. We obtained 577, 1238, and 531 samples for the three types of Alfvén waves, respectively.
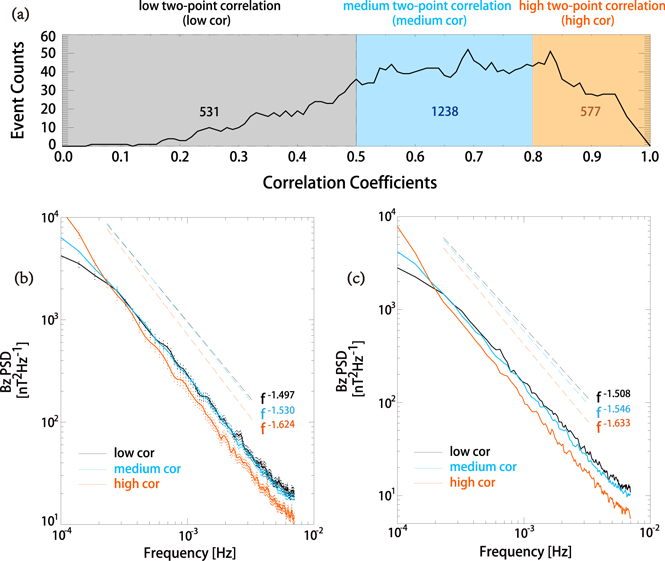
Figure 2. The two-point correlation and the power spectra of Alfvén waves. (a) The distribution of the absolute value of the two-point correlation coefficients of δ Bz between ACE and THEMIS. (b) The average spectra of δ Bz of the Alfvén waves from ACE for the low two-point correlation (black), the medium two-point correlation type (blue), and the high two-point correlation type (orange). The vertical ranges represent the 95% confidence limits. (c) The median spectra of δ Bz of the Alfvén waves from ACE. The power-law fits are shown as dashed lines.
Download figure:
Standard image High-resolution imageFor each event sample, a power spectral density (PSD) is generated by applying the standard fast Fourier transform analysis. Figures 2(b) and (c) present the spectra for each type of Alfvén wave.
The average PSD of the Alfvén waves is shown in Figure 2(b). A power-law fitting is performed in the frequency range of 1.39 × 10⁻⁴ to 3.24 × 10⁻³ Hz (5.1 minutes to 2 hr). The spectral slopes exhibit a variation from −1.624 to −1.497 for the three types. The low two-point correlation (black) Alfvén waves correspond to a spectrum of f−1.497. By contrast, the high two-point correlation (orange) Alfvén waves correspond to a steeper spectrum of f−1.624. The spectrum of the medium-correlation type has an intermediate index close to −1.530. Notice that the low two-point correlation Alfvén waves contain more power as compared with the high-correlation Alfvén waves in the frequency range >3 × 10⁻⁴ Hz.
Figure 2(c) shows the median value of the PSD for each type of Alfvén wave. The spectral slopes of the low-correlation, medium-correlation, and high-correlation types are f−1.508, f−1.546, and f−1.633, respectively. The characteristics of the median spectra are consistent with those of the average spectra, indicating that the statistical results are not dominated by extreme events.
We compute the spectral slope α of each event and show the distribution in Figure 3. This provides an alternative measurement of the spectral index of Alfvén waves. The spectral index for a single event varies in a broad range in the 2346 events. The distribution of spectral indices is distinctly different for the high two-point correlation type and low two-point correlation type. The spectral slopes are steeper for the high two-point correlation type. These results are consistent with the statistical results shown in Figures 2(b) and (c).

Figure 3. The spectral indices α of the low two-point correlation (black), medium two-point correlation (blue), and high two-point correlation (orange) types of Alfvén waves events from ACE. (a) The distribution of the spectral indices associated with Alfvén wave events. (b) The occurrence rate of the spectral indices associated with Alfvén wave events. Mean values are shown with the vertical lines.
Download figure:
Standard image High-resolution imageThe statistical results shown in Figures 2 and 3 indicate a dependence of spectral properties of Alfvén waves on the two-point correlation. One effect that may contribute to this dependence is the evolution and propagation of small-scale Alfvén waves during the convection from ACE to THEMIS. It takes ∼1 hr for the solar wind to convect (∼400 km s−1) over ∼200RE from ACE to THEMIS satellites. During the convection, the Alfvénic fluctuations evolve and propagate in the rest frame of the solar wind (Bruno et al. 2003). For our events, the convection time of ∼1 hr is comparable to or larger than the timescale of small-scale (<1 hr or >3 × 10⁻⁴ Hz) Alfvén waves. Those small-scale fluctuations are expected to evolve significantly and cause de-correlation over the ∼200RE distance. The above scenario is in particular supported by observations of the magnitude of the power spectra at >2 × 10⁻⁴ Hz (<90 minutes) shown in Figures 2(b) and (c). The relative enhancement of power at >2 × 10⁻⁴ Hz (<90 minutes) is likely related to the decrease in the two-point correlation (black and blue curves). By contrast, Alfvén waves that have a high two-point correlation contain less wave power at a timescale of less than 90 minutes.
3.3. Statistical Characteristics during the Alfvén Waves
We present the distribution of the solar wind speed for the three types of Alfvén waves in Figures 4(a)–(c). More than 75% of the high two-point correlation events are in the slow solar wind range (250–450 km s−1). In contrast, the low two-point correlation events are more equally distributed in the high-speed and slow-speed streams (Figure 4(c)). The spectra slope (∼−1.63) of the high two-point correlation Alfvén waves is close to −5/3. This feature is consistent with the suggestion that fluctuations in slow streams represent fully developed turbulence with spectra close to f−5/3 (Tu et al. 1989; Horbury et al. 2005). In the fast solar wind, the spectra may evolve depending on radial distance (Bavassano et al. 1982; Denskat & Neubauer 1982). This effect may contribute to the small deviation from f−5/3 spectra in the low two-point correlation Alfvén waves.
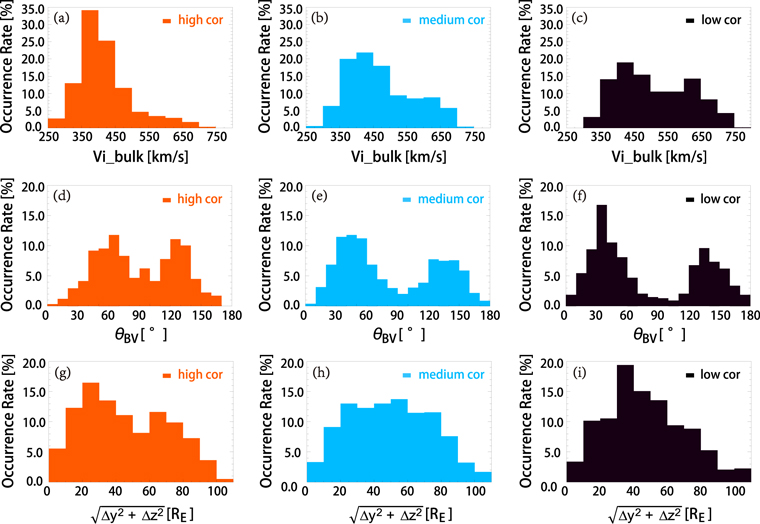
Figure 4. Statistical distributions of the solar wind speed, the θBV between velocity and magnetic field, and spacecraft separations associated with the Alfvén waves. (a)–(c) The occurrence rate of the solar wind speed from ACE associated with the Alfvén waves. (d)–(f) The occurrence rate of the θBV from ACE associated with the Alfvén waves. (g)–(i) The occurrence rate of the deviations  between ACE and THEMIS.
Download figure:
Standard image High-resolution imageIn the solar wind, the power spectra measured by a single spacecraft is a reduced spectrum (Bieber et al. 1996; Horbury et al. 2005). It has been suggested that the reduced spectrum depends on the angle (θBV) between the magnetic field vector and the solar wind flow direction (Bieber et al. 1996; Horbury et al. 2008). Figures 4(d)–(f) display the distribution of θBV associated with Alfvén waves. θBV are more concentrated in the range of 60° ± 20°, 90°–100°, and 110°–140° in the high-correlation Alfvén waves (∼74%). In contrast, the flow direction is more aligned with B for the low two-point correlation type (Figure 4(f)). The θBV effect may also contribute to the difference between the spectra indices.
We present the distribution of  between the two satellites during each event in Figures 4(g)–(i). This spacecraft separation in principle may significantly affect the two-point correlation. For both high two-point correlation and low two-point correlation events, a 10%–15% occurrence rate is nearly equally distributed from 10–80 RE
. No significant difference is found as shown in Figures 4(g)–(i). The observations suggest that the spacecraft separation does not significantly affect the two-point correlation in the statistical study.
between the two satellites during each event in Figures 4(g)–(i). This spacecraft separation in principle may significantly affect the two-point correlation. For both high two-point correlation and low two-point correlation events, a 10%–15% occurrence rate is nearly equally distributed from 10–80 RE
. No significant difference is found as shown in Figures 4(g)–(i). The observations suggest that the spacecraft separation does not significantly affect the two-point correlation in the statistical study.
Figure 5 shows statistical distributions of the southward Bz during the Alfvén waves. The duration of southward Bz is mostly less than 60 minutes. The occurrence rate for the short-duration Bz (less than 35 minutes) is the largest for the low two-point correlation type. This feature is consistent with the results in Figure 2 showing an enhancement of power at <1 hr for the low two-point correlation events. The average amplitude of southward Bz is mostly distributed in the range of −1 to −6 nT, as shown in Figures 5(d)–(f) and Figures 5(g)–(i). The average of the maximum is −3.25 nT for the low two-point correlation events (black) and −3.58 nT for the high two-point correlation events (orange). On average, the distributions of the maximum and average southward Bz are more toward larger values in the high two-point correlation events (orange) as compared to those in the low two-point correlation events (black).
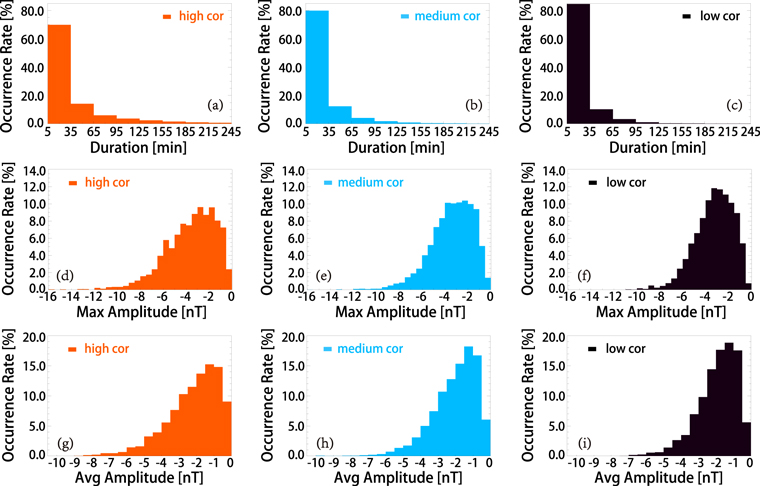
Figure 5. Statistical distributions of the southward Bz during the Alfvén waves. (a)–(c) The occurrence rate of the duration of the IMF southward Bz associated with the Alfvén waves. (d)–(f) The occurrence rate of the maximum southward Bz associated with the Alfvén waves. (g)–(i) The occurrence rate of the average southward Bz associated with the Alfvén waves.
Download figure:
Standard image High-resolution image4. Geomagnetic Responses to Interplanetary Alfvén Waves
In this section, we use the SYM-H, SME, and Kp indices from 2010 October to 2020 October to investigate the geomagnetic responses to interplanetary Alfvén waves.
Using the method in Dai et al. (2015a), we sort Alfvén waves into storm time and quiet (non-storm) time events. Geomagnetic storms are included if SYM-H reaches a minimum of −30 nT in the main phase (Gonzalez et al. 1994). Among the total 2346 events, there are 1315 storm time events and 1031 quiet time events. As shown in Figures 6(a)–(c), ∼63% of the low two-point correlation type Alfvén waves are storm time events. In comparison, only ∼45% of the high two-point correlation type Alfvén waves are during storms.
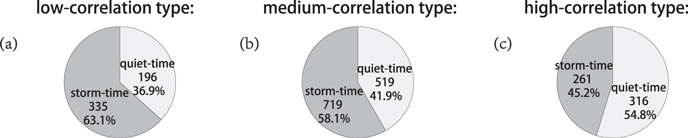
Figure 6. Storm time and non-storm time distribution of the Alfvén waves events from 2010 October to 2020 October. (a) the distribution of Alfvén waves with low two-point correlations. (b) The distribution of Alfvén waves with medium two-point correlations. (c) The distribution of Alfvén waves with high two-point correlations.
Download figure:
Standard image High-resolution imageWe present the analysis of the response of the SYM-H index in Figure 7, the Kp index in Figure 8, and the SME index in Figure 9. The beginning of the 6 hr interval when THB/C observes the Alfvén waves is approximately treated as the arrival time (with an uncertainty of ∼10 minutes) of the Alfvén waves at the magnetopause. For each Alfvén wave event, we expect that the geomagnetic response to Alfvén waves is mostly within 9 hr with respect to the beginning of the event. This is because the interval of Alfvén waves is 6 hr and the response of substorm cycles is most likely within an additional 3 hr.
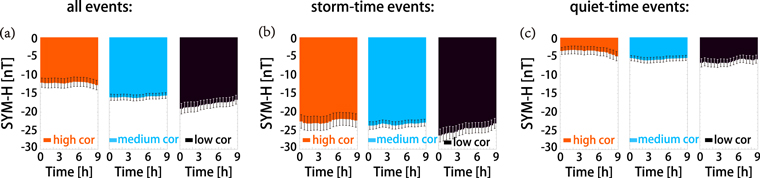
Figure 7. The response of the SYM-H index to Alfvén waves from 2010 October to 2020 October. The average value of the SYM-H index associated with (a) all events, (b) storm time events, and (c) non-storm time events for low two-point correlation (black), medium two-point correlation (blue), and high two-point correlation (orange) type Alfvén waves. Vertical ranges represent the 95% confidence limits.
Download figure:
Standard image High-resolution image
Figure 8. The response of the Kp index associated with Alfvén waves from 2010 October to 2020 October. The average value of the Kp index associated with (a) all events, (b) storm time events, and (c) non-storm time events for low two-point correlation (black), medium two-point correlation (blue), and high two-point correlation (orange) type Alfvén waves. Vertical ranges represent the 95% confidence limits.
Download figure:
Standard image High-resolution image
Figure 9. The response of the SME index associated with Alfvén waves from 2010 October to 2020 October. The average value of the SME index associated with (a) all events, (b) storm time events, and (c) non-storm time events for low two-point correlation (black), medium two-point correlation (blue), and high two-point correlation (orange) type Alfvén waves. Vertical ranges represent the 95% confidence limits.
Download figure:
Standard image High-resolution image
Figure 7 shows the response of the SYM-H index associated with Alfvén waves of different two-point correlations. In general, the SYM-H index is −12 to −19 nT in response to Alfvén waves (Figure 7(a)). The response in SYM-H is mostly contributed by Alfvén waves during the recovery phase of the storms, as indicated by an average of SYM-H of −22 to −26 nT in Figure 7(b). This observation is consistent with previous studies suggesting that Alfvén waves contribute to injections of particles into the ring current and the prolonged recovery phase of small storms (Kamide et al. 1998; Tsurutani et al. 2011; Telloni et al. 2021). During the non-storm time, the response of the SYM-H index is on average on the order of a few nanotesla. The Alfvén waves with low two-point correlations (black) are found to have the strongest response in the SYM-H index.
Figure 8 shows the Kp index in response to Alfvén waves. Kp is an index that monitors sub-auroral geomagnetic disturbances on a global scale. On average, Alfvén waves correspond to a response of 2.0 in Kp (Figure 8(a)). Similar to the observation in the SYM-H index, the response of the Kp index is mostly contributed by the storm time Alfvén waves as large as 2.3–2.6 (Figure 8(b), (e)). The average response of the Kp index in quiet time is less than 1.66. The Alfvén waves with low two-point correlations (black) are found to have the strongest Kp response as large as 2.6–3 during storm time events.
Figure 9 shows the response of the SME index in response to the Alfvén waves. On average, all Alfvén waves correspond to a response in SME of ∼230–300 nT (Figure 9(a)). Similar to the observations of SYM-H, the responses in SME are stronger (∼250–350 nT) in the storm time events. The responses in the non-storm time events are ∼150–200 nT and also non-negligible.
The average response of SME indicates that Alfvén waves have a general relation with moderate AE activities. As shown in the in situ observations in our accompanying Paper I (Dai et al. 2023), the connection between Alfvén waves and AE increases is made possible by dayside magnetopause reconnection. The observations of the SME index suggest that Alfvén waves generally drive enhanced magnetosphere/ionosphere convection through transient magnetopause reconnection. The enhanced convection then causes enhanced current flow in the AEs and an associated growth of the AE index, which is typical in the substorm growth phase (Baumjohann & Treumann 1996; Kamide & Kokubun 1996).
The typical peak values of SME are generally >300 nT during the substorm expansion phase (e.g., Zong et al. 2021). In our observations, the average response of SME is not large compared with this value. One possible reason is that the SME indices are averaged over the growth phase and non-substorm time (e.g., intervals of northward Bz in interplanetary Alfvén waves). Such an average may reduce the average response of the SME. Another possible reason is that Alfvén waves may not have a one-to-one relation to substorms, especially during the non-storm time. First, not all southward Bz of Alfvén waves may drive transient magnetopause reconnection. If the magnetosheath plasma-beta is large, Alfvén waves may need to produce a very large magnetic shear angle across the magnetopause to induce magnetic reconnection (Swisdak et al. 2003; Phan et al. 2013; Koga et al. 2019). Second, magnetopause reconnection induced by Alfvén waves drives enhanced convection and accordingly the increase of the convection electrojets component of SME/AE (Baumjohann & Treumann 1996; Kamide & Kokubun 1996). However, the enhanced convection may not have a one-to-one relation with substorm expansion and the substorm electrojet (Pytte et al. 1978; Baumjohann & Treumann 1996; Kamide & Kokubun1996; Tsurutani et al. 2004). As a result, only a portion of interplanetary Alfvén waves may finally lead to substorm expansion and associated large increases in SME/AE.
Consistent with observations of SYM-H and Kp, Figures 9(a)–(c) indicate that Alfvén waves with low two-point correlations (black) have the strongest response in the SME index. Alfvén waves with low two-point correlations have more wave power at timescales of 30–90 minutes, suggesting that the Alfvénic power in this range may be important for driving SME activity. The Alfvénic power with short periods (<15 minutes) probably have negligible geoeffectiveness (Tsurutani et al. 1990; Guarnieri et al. 2018). On the other hand, long-duration (>2 hr) southward Bz from Alfvén waves only represents a very small portion of all samples (Figure 5). Alfvén waves with Bz duration <2 hr appear to be typical for causing AE activity (Tsurutani et al. 1995a). Notice that the 30–90 minute timescale is comparable to the typical 30–60 minute duration of substorm expansion. This coincidence is worth further in-depth investigations.
We also notice that Alfvén waves with low two-point correlations are not associated with larger Bz as compared with those with high two-point correlations. This suggests that the magnitude of Bz may not be the most important factor for the magnetopause reconnection. For instance, the magnitude of Bz of interplanetary Alfvén waves could be amplified by a factor of ∼3–6 by the transmission through the bow shock as shown in our accompanying Paper I (see also McKenzie & Westphal 1969; Lu et al. 2009).
5. Conclusions and Discussion
Using 10 yr of data from ACE, THEMIS, and geomagnetic indices, we investigate the characteristics of the spectra of Alfvén waves and associated geomagnetic responses. The spectra of the Alfvén waves show a certain degree of dependence on the two-point correlation over ∼200RE between ACE and THEMIS. Alfvén waves with high two-point correlations exhibit a steep spectrum that is associated with a relatively weak wave power above 2 × 10⁻⁴ Hz (∼90 minutes). By contrast, Alfvén waves with low two-point correlations exhibit a flatter spectrum with a relative enhancement of power above 2 × 10⁻⁴ Hz (∼90 minutes). Small-scale Alfvénic fluctuations may contribute to the decrease of the two-point correlations over the convection time (∼1 hr) of ∼200RE .
The spectral index of Alfvén waves is likely affected by the solar wind speed. The high two-point correlation Alfvén waves with a steeper slope (spectra index ∼−1.63) are mostly observed in the low-speed solar wind. This is consistent with the scenario that fluctuations in the slow solar wind are fully developed turbulence with a spectral index close to f−5/3. The flatter spectrum of the slow solar wind may be due to damping out of the higher-frequency waves between the Sun and 1 au. Alfvén waves with low two-point correlations are distributed equally in high-speed and low-speed solar wind streams. The corresponding spectral index is likely affected by those in the fast streams in which the index may evolve depending on the heliocentric distance. In addition, high two-point correlation Alfvén waves with a steeper slope are found to have a larger angle θBV. The θBV effect may also have made a contribution to the spectral index.
We perform a statistical survey on the geomagnetic responses to the interplanetary Alfvén waves. Alfvén waves in general correspond to a moderate response in the SYM-H, Kp, and SME indices. During the storm time, the responses in Kp, and SME are relatively stronger. The geomagnetic responses show a certain degree of dependence on the two-point correlation and spectra shape of the interplanetary Alfvén waves. Alfvén waves with low two-point correlations and flatter spectra appear to have stronger responses in SYM-H, Kp, and SME.
More Alfvénic power in the spectrum of tens of minutes (30–90 minutes) appears to correspond to stronger geomagnetic responses in our observation. This is consistent with the events studied in Tsurutani et al. (1990) showing that AE-correlated Alfvénic Bz exhibits enhanced spectra in the range of 10−3 to 10−4 Hz. Guarnieri et al. (2018) also suggest that 10 minute to 2 hr Alfvén waves cause AE activity and short-scale (<8 minutes) waves are not geoeffective. The 30–90 minute timescale is comparable to the typical 30–60 minute duration of substorm expansion, suggesting a resonance-like relation between Alfvén waves and effective substorm responses (Tsurutani et al. 1990). Longer-period (>90 minutes) Alfvén waves by themselves should be geoeffective. But those long duration (>2 hr) southward Bz from Alfvén waves only represent a very small portion of all the samples (Figure 5). For many intervals of the AE/SME activity, there are probably no signatures of long-duration (>2 hr) southward Bz from Alfvén waves (Tsurutani et al. 1995a). In this statistical sense, the geoeffective importance of the 30–90 minute power spectrum is probably more noticeable.
In our observation, the Fourier transform of sharp changes of large Bz likely contributes to the Alfvénic power spectra in 30–90 minutes and also the higher-frequency band (<10 minutes). Such leakage of power to the higher-frequency band occurs near the sharp changes. In our data, sharp changes in Bz are expected to be common as a result of phase-steepened large-amplitude Alfvén waves, particularly in the high-speed solar wind streams (Tsurutani et al. 1994, 2018).
The average and non-storm time response indicate that Alfvén waves are generally related to moderate SME increases. Through transient magnetopause reconnection, Bz from Alfvén waves constantly drives enhanced magnetosphere/ionosphere convection, causing enhanced current flow in the convection AEs and an associated growth of the SME/AE. However, enhanced convection does not necessarily cause substorm expansion (Kamide & Kokubun 1996; Tsurutani et al. 2004). Substorm expansion is more likely to follow if the enhanced convection sufficiently evolves to a certain degree (Kamide et al. 1977; Kan 1993). This is probably the case for many of the storm time Alfvén wave events, in which the evolution of enhanced convection finally leads to substorm expansion, substorm electrojets, and further increases in the SME/AE. Such substorms shall inject energetic particles into the ring current and extend the recovery phase of geomagnetic storms (Tsurutani et al. 2011; Hajra et al. 2014b; Dai et al. 2015b; Hajra & Tsurutani 2018; Raghav et al. 2018; Telloni et al. 2021; Xiong et al. 2022).
We thank NASA CDA web (https://cdaweb.sci.gsfc.nasa.gov/), the THEMIS web (http://themis.ssl.berkeley.edu/), and the MMS Science Data Center (https://lasp.colorado.edu/mms/sdc/public/) for providing the ACE, THEMIS, and MMS data. We appreciate the OMNI database (https://omniweb.gsfc.nasa.gov/ow.html) and World Data Center (WDC) for Geomagnetism, Kyoto (http://wdc.kugi.kyoto-u.ac.jp) for providing the SYM-H data. We also thank the Johns Hopkins Applied Physics Laboratory for providing the SuperMAG data (https://supermag.jhuapl.edu/) and the GFZ German Research Center for Geosciences for providing the Kp index data (https://www.gfz-potsdam.de/en/kp-index/). The work at NSSC was supported by NNSFC grants (41731070,41874175, 42174207), the Specialized Research Fund for State Key Laboratories of China, and the Strategic Pioneer Program on Space Science II, Chinese Academy of Sciences, grants XDA15350201 and XDA15052500. The work at INPE is supported by funds from the China-Brasil Joint Laboratory for Space Weather.