Abstract
We present the detection of 51 thermonuclear X-ray bursts observed from 4U 1636–536 by the Neutron Star Interior Composition Explorer (NICER) over the course of a 3 yr monitoring campaign. We perform time-resolved spectroscopy for 40 of these bursts and show the existence of a strong soft excess in all the burst spectra. The excess emission can be characterized by the use of a scaling factor (the fa method) to the persistent emission of the source, which is attributed to the increased mass accretion rate onto the neutron star due to Poynting–Robertson drag. The soft excess emission can also be characterized by the use of a model taking into account the reflection of the burst emission off the accretion disk. We also present time-resolved spectral analysis of five X-ray bursts simultaneously observed by NICER and AstroSat, which confirm the main results with even greater precision. Finally, we present evidence for Compton cooling using seven X-ray bursts observed contemporaneously with NuSTAR, by means of a correlated decrease in the hard X-ray lightcurve of 4U 1636–536 as the bursts start.
Export citation and abstract BibTeX RIS

Original content from this work may be used under the terms of the Creative Commons Attribution 4.0 licence. Any further distribution of this work must maintain attribution to the author(s) and the title of the work, journal citation and DOI.
1. Introduction
X-ray bursts observed from low-mass X-ray binaries have long been attributed to thermonuclear burning of accreted material onto the neutron star (see Hansen & van Horn 1975; Lamb & Lamb 1978; Lewin et al. 1993; Strohmayer & Bildsten 2006). Observations of these events have been used to infer the physical properties of neutron stars (see Özel et al. 2016), as well as the accretion environment around these objects (Wijnands et al. 2015; Paul 2017; Degenaar et al. 2018). In particular, observations of bursts showing evidence of photospheric radius expansion have allowed the measurement of the Eddington limit for the neutron stars in these systems (see van Paradijs 1978; van Paradijs & Lewin 1987; Damen et al. 1990; Galloway et al. 2008b; Güver et al. 2012a), which are further used to constrain the masses and radii of neutron stars (Özel 2006; Özel et al. 2009; Güver et al. 2010a, 2010b; Özel et al. 2010; Güver et al. 2012a; Lattimer & Steiner 2014; Özel et al. 2016; Steiner et al. 2016, 2018). Although a variety of possible systematic uncertainties in these measurements have been studied using the available data (see Güver et al. 2012a, 2012b; Kajava et al. 2014; Güver et al. 2016), the complications that may be involved in the physics of the bursts and the accretion geometry have remained open questions (Kajava et al. 2017a; Nättilä et al. 2017).
A significant fraction of the research relating to thermonuclear X-ray bursts has been performed by the Rossi X-ray Timing Explorer (RXTE) Proportional Counter Array (PCA). The energy range where RXTE/PCA had maximum sensitivity (2.5–25.0 keV) matched very well with the typical temperatures of the thermal emission arising from thermonuclear X-ray bursts, which allowed for detailed observations of these events (see Galloway et al. 2008a, 2020). However, apart from a few exceptions (Ballantyne & Strohmayer 2004; Worpel et al. 2013, 2015), the effects of the bursts on the accretion disk and surrounding material have remained mostly unstudied, due to the lack of low-energy sensitivity of RXTE/PCA. Unlike RXTE, the Neutron Star Interior Composition Explorer (NICER) allows for the systematic study of thermonuclear X-ray bursts in the soft X-rays and allows the probing of the effects of the bursts on the surrounding material (see Keek et al.2018a, 2018b; Bult et al. 2019; Buisson et al. 2020; Güver et al. 2022). Recently, we studied all the X-ray bursts from Aql X-1 prior to the end of 2021, using NICER observations, and showed that in approximately 68% of the spectra there is statistical evidence for an excess emission that can be characterized by the application of a scaling factor to the persistent emission of the system (Güver et al. 2022). Supporting earlier findings, this indicates a significant increase in the preburst emission, especially around the peak flux moments of the bursts. This increase is attributed to the increased mass accretion rate onto the neutron star, due to Poynting–Robertson (PR) drag caused by the burst emission, and supported by simulations of accretion disks illuminated by thermonuclear X-ray bursts (Fragile et al. 2018, 2020). Güver et al. (2022) showed that the X-ray spectra can also be fit with models taking into account the reflection of the burst emission off the accretion disk.
Here, we continue the same effort, using NICER observations of the low-mass X-ray binary 4U 1636–536, which frequently shows X-ray bursts. 4U 1636–536 was first observed by Uhuru and Copernicus (Giacconi et al. 1972; Willmore et al.1974), and the first X-ray burst was detected by the 8th Orbiting Solar Observatory (Swank et al. 1976). It has been one of the few low-mass X-ray binaries that frequently display X-ray bursts. Within the MINBAR catalog (Galloway et al. 2020), the mean burst rate is given as 0.26 hr−1, which makes it the fourth most frequent X-ray burster after IGR J17480–2446, GS 1826–24, and 4U 1728–34. A total of 664 bursts from 4U 1636–536 have been cataloged in MINBAR, with 140 of those bursts showing evidence for photospheric radius expansion (Galloway et al. 2020). From 4U 1636–536, various types of X-ray bursts—such as double-peaked X-ray bursts (Bhattacharyya & Strohmayer2006), triple-peaked X-ray bursts (van Paradijs et al. 1986; Zhang et al. 2009; Beri et al. 2019), and short-recurrence bursts (Keek et al. 2010)—have been reported.
The spin frequency of the neutron star, as inferred from burst oscillations, and the orbital period of the system are ∼581 Hz (Zhang et al. 1997; Strohmayer et al. 1998b; Strohmayer & Markwardt 2002) and 3.8 hr (Strohmayer et al. 1998a), respectively. The distance of 4U 1636–536 was calculated to be  kpc, based on Gaia Data Release 2 results (Arnason et al. 2021). The orbital inclination angle of 4U 1636–536 was limited to 36°–74° by Casares et al. (2006). Moreover, Pandel et al. (2008) have set a lower limit of 64° on the disk inclination, utilizing the high signal-to-noise ratio (S/N) of the source spectra. 4U 1636–536 is known to show a broad, asymmetrical iron emission line covering the energy range of 4–9 keV, which is consistent with the relatively extended Fe Kα emission from the inner accretion disk (Pandel et al. 2008; Cackett et al. 2010; Sanna et al. 2013; Lyu et al. 2014; Ludlam et al. 2017; Mondal et al. 2021).
4U 1636–536 was one of the first X-ray binaries where evidence of deviation from pure blackbody emission during the X-ray bursts was reported (Worpel et al. 2013). More recently, Kashyap et al. (2022) reported the detection of such excess near the peaks of the bursts in broadband AstroSat observations. They fit the X-ray spectra extracted from LAXPC and the Soft X-Ray Telescope either with two blackbody functions with a constant background assumption or with a model that includes a scaling factor for the preburst emission and another blackbody model for the burst emission. Although the data presented in Kashyap et al. (2022) were not sensitive enough to differentiate among these models, they statistically demonstrated the requirement of the existence of a second component to describe the burst spectra near the peaks of the bursts. As with other examples, the excess can be interpreted as the reemission/reprocessing of the photons by the accretion disk/corona, the scattering of the photons in the neutron star atmosphere, or enhanced persistent emission due to the PR drag (in't Zand et al. 2013; Degenaar et al. 2013; Worpel et al. 2013; Keek et al. 2017, 2018a).
We here report the detection and present a time-resolved spectral and temporal analysis of the bursts observed from 4U 1636–536 by NICER since 2017 June. In total, we have detected 51 X-ray bursts. We note that some of the bursts reported here have already been presented by Zhao et al. (2022). Although our results are mostly in agreement, we include those bursts as well, for completeness. We find that six of these bursts have been observed simultaneously with NuSTAR, and that another five bursts have also been simultaneously observed with AstroSat. We further present the results of the time-resolved spectral analysis of the bursts observed simultaneously with AstroSat and NICER. Finally, we use some of the bursts detected with NuSTAR to search for evidence for Compton cooling in the system.
2. Observation and Data Analysis
Since the start of its operations, NICER has performed 138 different observations of 4U 1636–536 (covering the OBSIDs 0050080104 to 0050080113, 1050080101 to 1050080207, 2050080201 to 2050080225, and 3050080201 to 3050080206), from 2017 June 26 to 2020 March 30. These observations have led to a total of 518.58 ks of unfiltered exposure time. We analyzed this data using HEASOFT v6.29 c (NASA High Energy Astrophysics Science Archive Research Center, 2014), NICERDAS v8c, and the calibration files distributed as of 2020 July 7. Clean event files were generated using nicerl2 and standard filtering criteria,
16
which resulted in total clean exposure time of 297.559 ks. We barycentered the times of arrival of the events using the source coordinates (J2000) R.A. 16h40m55 51 decl.−53°45'05
 0 and JPLEPH.430 ephemerides (Folkner et al. 2014).
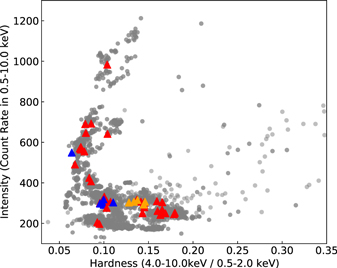
We first generated a hardness–intensity diagram, using all of the NICER observations, to see if there is any state dependence on burst occurrence. For this purpose, we extracted lightcurves using only clean event files with a time resolution of 128 s, in various energy bands, as defined in Bult et al. (2021). We used the 0.5–10.0 keV band for the total intensity, and calculated the hardness using the ratio of observed count rates in the 4.0–10.0 and 0.5–2.0 keV bands. The resulting hardness–intensity diagram is shown in Figure 1, together with the spectral state of the source just prior to the observed X-ray bursts.
Figure 1. Hardness–intensity diagram from all the NICER observations of 4U 1636–536. The hardness ratio is defined as the ratio of the count rate in the 4.0–10.0 and 0.5–2.0 keV bands. The locations of the detected X-ray bursts are indicated by the red triangles. We also show with the blue and orange triangles the locations of the X-ray bursts simultaneously detected with AstroSat and NuSTAR, respectively.
Download figure:
Standard image High-resolution imageWe performed our search for bursts using all of the unfiltered events. In each case, we searched for a 4σ deviation from the 25 s long background level in the 0.5–10.0 keV lightcurves, having 0.25 s time resolutions. We then visually inspected all the candidates for the well-known fast rise exponential decay profile. In total, we identified 51 events as thermonuclear X-ray bursts. Note that 33 of these bursts can be seen in clean events, while we needed unfiltered data for 18 bursts. Some of the basic properties of these bursts are given in Table 1, and lightcurves of some of the bursts are given in the Figure 2. In Table 1, the burst start times are defined as the first moment when the count rate increases by 4σ above the average count rate of the last 100 s. The rise time is defined as the first moment when the count rate reaches 98% of the maximum rate recorded during the burst. Finally, the e-folding time is defined as the time when the count rate decreases by a factor of e after the peak moment.
Table 1. Some Basic Parameters of the Detected Bursts
| BID | MJD | OBSID | Peak Rate a | Preburst Rate | Rise Time | e-folding Time |
|---|---|---|---|---|---|---|
| (TDB) | (counts s−1) | (counts s−1) | (s) | (s) | ||
| 1 e | 57959.158528 | 1050080103 | 1448 ± 59 | 333.0 ± 3.0 | 8.5 | 28.5 |
| 2 | 57975.740335 | 1050080112 | 2568 ± 84 | 980.8 ± 3.6 | 2.0 | 9.0 |
| 3 | 57982.091498 | 1050080119 | 1890 ± 70 | 576.8 ± 2.3 | 6.3 | – b |
| 4 e | 57982.994681 | 1050080119 | 2039 ± 73 | 645.8 ± 2.6 | 3.8 | 12.0 |
| 5 | 57989.366494 | 1050080126 | 5140 ± 107 | 651.3 ± 2.7 | 1.5 | 8.5 |
| 6 | 58028.477201 | 1050080128 | 7741 ± 129 | 590.0 ± 2.7 | 2.0 | 3.0 |
| 7 c | 58029.255800 | 1050080129 | 622 ± 49 | 591.2 ± 2.2 | 3.0 | 12.0 |
| 8 e | 58059.770862 | 1050080133 | 1514 ± 63 | 492.6 ± 2.7 | 3.8 | 7.5 |
| 9 | 58131.664792 | 1050080136 | 1953 ± 66 | 243.8 ± 1.6 | 5.3 | 15.0 |
| 10 e | 58131.669711 | 1050080136 | 661 ± 42 | 250.3 ± 1.6 | 3.3 | 10.5 |
| 11 e | 58132.480698 | 1050080137 | 2041 ± 65 | 106.4 ± 15.1 | 2.5 | 21.0 |
| 12 e | 58132.490322 | 1050080137 | 1678 ± 61 | 226.8 ± 1.6 | 4.5 | 10.5 |
| 13 | 58132.499211 | 1050080137 | 620 ± 40 | 216.7 ± 1.6 | 3.0 | 8.5 |
| 14 | 58150.624493 | 1050080143 | 1977 ± 67 | 316.3 ± 17.7 | 5.8 | 23.0 |
| 15 e | 58236.932412 | 1050080149 | 8715 ± 138 | 805.9 ± 2.7 | 1.5 | 2.0 |
| 16 e | 58237.064383 | 1050080150 | 2207 ± 76 | 690.0 ± 2.7 | 3.75 | 11.0 |
| 17 e | 58237.829134 | 1050080150 | 2026 ± 63 | 10.3 ± 0.1 | 2.8 | 70.5 |
| 18 | 58238.417832 | 1050080151 | 1727 ± 66 | 492.2 ± 2.7 | 4.8 | 12.5 |
| 19 | 58308.311685 | 1050080158 | 1589 ± 62 | 376.4 ± 2.6 | 4.8 | 22.0 |
| 20 | 58312.507264 | 1050080160 | 1849 ± 68 | 495.6 ± 2.6 | 3.5 | 21.5 |
| 21 | 58339.052711 | 1050080173 | 1855 ± 64 | 2559 ± 6.5 | 7.0 | 19.0 |
| 22 c | 58348.422270 | 1050080175 | 1708 ± 63 | 311.1 ± 2.2 | 6.8 | 16.0 |
| 23 c | 58348.562250 | 1050080175 | 1685 ± 63 | 308.3 ± 2.0 | 5.5 | 24.0 |
| 24 | 58348.677453 | 1050080175 | 2076 ± 69 | 344.6 ± 2.2 | 4.0 | 15.5 |
| 25 | 58348.803743 | 1050080175 | 599 ± 41 | 260.0 ± 11.1 | 2.5 | 14.5 |
| 26 | 58348.934944 | 1050080175 | 1634 ± 62 | 313.3 ± 2.11 | 6.8 | 26.0 |
| 27 c | 58350.685725 | 1050080177 | 1893 ± 66 | 326.3 ± 2.1 | 4.8 | 17.5 |
| 28 c | 58350.805694 | 1050080177 | 1765 ± 64 | 306.0 ± 2.0 | 4.5 | 18.5 |
| 29 e | 58383.816006 | 1050080181 | 1556 ± 59 | 236.9 ± 4.5 | 6.0 | 31.0 |
| 30 | 58383.944918 | 1050080181 | 1606 ± 60 | 246.8 ± 2.3 | 7.5 | 18.5 |
| 31 | 58387.921859 | 1050080185 | 1607 ± 61 | 274.4 ± 2.4 | 5.0 | 24.5 |
| 32 | 58389.859359 | 1050080187 | 1487 ± 59 | 254.3 ± 2.3 | 9.0 | 23.5 |
| 33 | 58389.982440 | 1050080187 | 1503 ± 61 | 347.9 ± 6.2 | 4.25 | 21.5 |
| 34 | 58393.914340 | 1050080190 | 1505 ± 59 | 272.3 ± 2.3 | 5.3 | 30.0 |
| 35 | 58554.374787 | 2050080201 | 815 ± 46 | 248.2 ± 2.5 | 6.0 | 16.0 |
| 36 | 58554.891746 | 2050080201 | 1453 ± 58 | 260.1 ± 2.5 | 4.3 | 30.5 |
| 37 e | 58563.592613 | 2050080207 | 1780 ± 60 | 75.3 ± 8.4 | 6.3 | 34.0 |
| 38 | 58596.953820 | 2050080209 | 1544 ± 61 | 318.9 ± 2.4 | 6.5 | 26.5 |
| 39 | 58597.386480 | 2050080210 | 1543 ± 61 | 315.9 ± 2.5 | 9.3 | 25.0 |
| 40 | 58597.391576 | 2050080210 | 499 ± 40 | 320.0 ± 2.6 | 5.5 | 11.5 |
| 41 | 58600.174653 | 2050080211 | 1565 ± 61 | 302.3 ± 2.5 | 5.5 | 26.5 |
| 42 d , e | 58600.732402 | 2050080211 | 1602 ± 61 | 261.3 ± 10.2 | 1.5 | 17.0 |
| 43 d | 58600.740015 | 2050080211 | 331 ± 36 | 320.2 ± 2.5 | 2.75 | 13.5 |
| 44 d , e | 58601.067781 | 2050080212 | 1520 ± 61 | 356.8 ± 2.4 | 9.0 | 16.5 |
| 45 d | 58601.250281 | 2050080212 | 1596 ± 62 | 335.3 ± 2.5 | 8.0 | 19.0 |
| 46 d | 58601.528921 | 2050080212 | 1277 ± 56 | 327.9 ± 2.3 | 3.0 | 12.0 |
| 47 | 58601.836030 | 2050080212 | 1516 ± 60 | 328.9 ± 2.5 | 8.8 | 20.0 |
| 48 e | 58602.029559 | 2050080213 | 1561 ± 61 | 332.3 ± 2.2 | 5.0 | 26.0 |
| 49 e | 58602.034027 | 2050080213 | 1427 ± 59 | 348.2 ± 2.8 | 3.0 | 15.0 |
| 50 d | 58602.151831 | 2050080213 | 1516 ± 60 | 318.9 ± 2.4 | 6.3 | 30.5 |
| 51 | 58602.350552 | 2050080213 | 1503 ± 60 | 322.4 ± 2.2 | 5.8 | 27.5 |
Notes.
a The peak count rates are preburst rate–subtracted. b Data acquisition stopped before the e-folding time. c The bursts were observed simultaneously by AstroSat. d The bursts were observed simultaneously by NuSTAR. e These bursts are detected only within the unfiltered events.Download table as: ASCIITypeset image
During our analysis, we found out that there are AstroSat (OBSID 9000001574 and 9000002316; starting on 2017 February 10 and 2018 August 18, respectively) and NuSTAR (OBSID 30401014002; starting on 2019 April 27) observations that are partly simultaneous with some of the NICER observations. We also include here some of the bursts observed during these observations. For details of the NuSTAR observation, we refer to Roy et al. (2022). For the analysis of the NuSTAR data, we again used HEASOFT v6.29 c, specifically nupipeline and nuproducts, with the latest available calibration files, as of 2021 October 7. The total exposure time of the NuSTAR observation is 92 ks. Within this observation, we identified 15 X-ray bursts. After applying the barycentric correction, we found that six thermonuclear X-ray bursts were observed simultaneously with NICER. These correspond to bursts 42, 43, 44, 45, 46, and 50 in Table 1. In addition to these bursts, we also identified that there are two additional bursts in the unfiltered event file of NuSTAR, but they were filtered out when generating the clean event file, and were also simultaneously observed with NICER. The bursts that are only in the unfiltered event files of NuSTAR are the 48th and 49th bursts in our NICER burst catalog.
We also searched the AstroSat/LAXPC observations of 4U 1636–536 between 2017 June 21 and 2018 August 2, and detected 27 bursts. We use the event analysis mode data, where each photon's arrival times and energies are recorded. The total exposure times of the LAXPC observations are 19.041 ks and 210.982 ks, respectively. To analyze the LAXPC data, process the lightcurves and spectra, and extract background and response files, LaxpcSoft software v3.0 is used (Antia et al. 2017). Due to their low gain, we do not use the LAXPC10 data, and the LAXPC30 data are not useful due to gain instability caused by gas leakage. We use data from LAXPC20 only, as they provide the maximum gain and sensitivity. After the barycentric correction, we identified five bursts that were simultaneously observed with AstroSat and NICER; these bursts are bursts 7, 22, 23, 27, and 28.
2.1. Search for Burst Oscillations
We performed an extensive search for high-frequency oscillations within the entire sample of 51 bursts. We used the  test (that is, the Rayleigh test; Buccheri et al. 1983) in a dynamic manner, as follows. We constructed
  powers using photons in the 1–10 keV energy band in a 2 s time window, starting 5 s prior to the onset of the burst, until 50 s after, with steps of 0.5 s. The frequency interval of our interest ranged from 576 Hz to 586 Hz, centering at the known oscillation frequency of 581 Hz, with a frequency step of 0.5 Hz. Furthermore, we repeated this search procedure using photons in the 3–10 keV band, using a search window size of 4 s, and a sliding step of 1 s. Overall, our searches were performed with all eight combinations of the energy interval, window length, and sliding time step settings.
We find no significant detection for burst oscillations in our search in the 1–10 keV band. On the other hand, in the 3–10 keV band, we identified a potential case (burst 13), as our search within both 2 s and 4 s windows resulted in a brief episode of oscillations at 582 Hz with more than 99% significance, assuming that the  powers are distributed as χ2 with 2 degrees of freedom (dof) and the number of trials are the number of independent powers in each search window. Note, however, that the episode of this oscillation starts about 30 s after the onset of the event, when the burst flux has already significantly declined. Therefore, we claim this as a tentative candidate for burst oscillations.
We also searched for burst oscillations in the entire AstroSat sample of 27 bursts in the entire LAXPC energy range, using the same strategy as described above. We find no evidence for high-frequency oscillations in any of these bursts.
2.2. Time-resolved Spectroscopy
The soft X-ray sensitivity combined with the larger effective area of NICER allow for an effective time-resolved spectral study of thermonuclear X-ray bursts. Following previous studies (see, e.g., Güver et al. 2022), we extracted time-resolved X-ray spectra for each burst, with varying exposure times, which depend on the total observed count rate from the source. To be able to catch the spectral evolution during the rise of the bursts, we used 0.5 s as a fixed exposure time up to the peak moment, and then allowed the exposure time to be longer. We also tested shorter exposure times, like 0.25 s, but that caused the statistical uncertainties of the spectral parameters to be too large. For each observation, we estimated the background using the version 7b of the nibackgen3C50 17 tool (Remillard et al. 2022). We removed the detector IDs 14 and 34 from our analysis, as these two focal plane modules are known to show episodes of high noise rates, and generated response and ancillary response files using the nicerrmf and nicerarf tools for each observation individually. Throughout the analysis, we used ciao (Fruscione et al. 2006), sherpa (Freeman et al. 2001; Doe et al. 2007; Burke et al. 2020), and custom-written python scripts utilizing the Astropy (Astropy Collaboration et al. 2013, 2018), NumPy (van der Walt et al. 2011), Matplotlib (Hunter 2007), and Pandas (McKinney 2010) libraries to perform the spectral analysis. Only in the application of the reflection model did we use XSPEC (Arnaud 1996). We grouped each spectrum as having at least 50 counts in each channel, and we performed the fits in the 0.5–10.0 keV range. The reported unabsorbed bolometric fluxes were calculated with the sample_flux command within sherpa, using 104 simulations around the best-fit parameters within the 0.01–200 keV energy range. For the calculation of the unabsorbed fluxes during the application of the reflection model, we used cflux in XSPEC, and report the 0.5–10.0 keV band. Uncertainties are reported at the 68% confidence level, unless noted otherwise.
We note that, because we search for bursts in the unfiltered data, during some of the cases the overshoot 18 rate showed significant variations just before, during, or after a burst. Overshoot rates are recorded when an energetic charged particle passes through the silicon drift detector. These rates are a good indicator of the non-X-ray background of NICER, and therefore they are recorded and used by the standard filtering. These variations mostly affected the high-energy part of the spectra, and did not allow us to constrain the preburst spectral model reliably, which needed to be well determined and used as a background for the analysis of the bursts. We therefore did not perform time-resolved spectral analysis for these bursts. In some cases, it was possible to use postburst X-ray spectra as our background, and we used these in our analysis. As a result, it was only possible to perform time-resolved spectral analysis of 40 X-ray bursts observed from 4U 1636–536. Before or after each burst, we extracted the X-ray spectra with an exposure time of 100 s and used these to characterize the persistent emission from the system. We first modeled these spectra with absorbed disk blackbody models plus a power law or a blackbody component. However, based on the initial fit results, we decided to use an absorbed disk blackbody plus a power-law model. Note that in some cases, only a power-law model provided good enough fits, and the addition of a disk blackbody component either did not improve the fit or the parameters of this component could not be constrained, and we therefore used only the power-law component for these bursts. These are indicated in Table 2. We assume interstellar abundance along the line of sight to the source, and use the tbabs model (Wilms et al. 2000) to take into account the interstellar extinction in the soft X-rays. Initially, we allowed the hydrogen column density to vary in the different observations. We then calculated the error-weighted average of the resulting values, which resulted in NH =4.4 × 1021 cm−2, with a standard deviation of 0.5 × 1021 cm−2. We used this average value as a fixed parameter for the whole analysis, which agrees with previously reported values (Juett et al. 2006; Güver et al. 2012b). The results of the best-fit models to these spectra are given in Table 2.
Table 2. Best-fit Model Results for Preburst X-Ray Spectra of 4U 1636–536 Using a Single Power-law Model or an Absorbed Disk Blackbody Plus Power-law Model
| BID | Tin | NormDBB | Γ | NormPOW | Flux a | χ2 / dof |
|---|---|---|---|---|---|---|
| (keV) | (R ) ) | |||||
| 2 | 0.98 ± 0.01 | 87 ± 9 | 1.47 ± 0.03 | 0.34 ± 0.01 | 4.32 ± 0.28 | 417.2/454 |
| 3 | 0.72 ± 0.02 | 148 ± 18 | 1.63 ± 0.03 | 0.24 ± 0.01 | 2.33 ± 0.14 | 371.7/352 |
| 5 | 0.90 ± 0.03 | 71 ± 10 | 1.41 ± 0.03 | 0.24 ± 0.01 | 2.98 ± 0.21 | 395.9/401 |
| 6 | 0.72 ± 0.02 | 159 ± 19 | 1.64 ± 0.03 | 0.23 ± 0.01 | 2.34 ± 0.18 | 358.8/348 |
| 7 | 0.71 ± 0.02 | 163 ± 19 | 1.60 ± 0.01 | 0.23 ± 0.01 | 2.40 ± 0.16 | 353.5/356 |
| 9 | 0.39 ± 0.05 | 149 ± 114 | 1.79 ± 0.04 | 0.18 ± 0.01 | 1.12 ± 0.09 | 258.0/258 |
| 11 | 1.84 ± 0.12 | 1.5 ± 0.4 | 2.06 ± 0.03 | 0.16 ± 0.01 | 1.06 ± 0.14 | 259.9/258 |
| 12 | ⋯ b | ⋯ | 1.89 ± 0.01 | 0.19 ± 0.01 | 1.01 ± 0.02 | 323.0/255 |
| 13 | ⋯ | ⋯ | 1.90 ± 0.01 | 0.18 ± 0.02 | 0.96 ± 0.01 | 260.6/246 |
| 14 | 0.64 ± 0.03 | 109 ± 21 | 1.68 ± 0.06 | 0.14 ± 0.01 | 1.24 ± 0.11 | 266.9/266 |
| 15 | 0.81 ± 0.01 | 180 ± 13 | 1.22 ± 0.03 | 0.16 ± 0.01 | 3.22 ± 0.26 | 366.7/400 |
| 16 | 0.85 ± 0.02 | 110 ± 12 | 1.54 ± 0.03 | 0.24 ± 0.01 | 2.81 ± 0.21 | 357.4/385 |
| 18 | 0.65 ± 0.02 | 174 ± 25 | 1.71 ± 0.02 | 0.22 ± 0.01 | 1.95 ± 0.14 | 353.8/321 |
| 19 | ⋯ | ⋯ | 1.72 ± 0.01 | 0.29 ± 0.02 | 1.77 ± 0.02 | 366.6/318 |
| 20 | 0.54 ± 0.02 | 252 ± 50 | 1.70 ± 0.02 | 0.28 ± 0.01 | 2.09 ± 0.13 | 298.0/328 |
| 21 | ⋯ | ⋯ | 1.81 ± 0.01 | 0.20 ± 0.01 | 1.12 ± 0.01 | 335.0/270 |
| 22 | 2.72 ± 0.02 | 0.6 ± 0.2 | 2.10 ± 0.03 | 0.20 ± 0.01 | 1.42 ± 0.24 | 294.1/287 |
| 23 | ⋯ | ⋯ | 1.77 ± 0.01 | 0.24 ± 0.01 | 1.41 ± 0.02 | 373.4/288 |
| 24 | 2.67 ± 0.25 | 0.42 ± 0.22 | 1.96 ± 0.08 | 0.24 ± 0.01 | 1.55 ± 0.25 | 337.2/298 |
| 25 | ⋯ | ⋯ | 1.76 ± 0.02 | 0.20 ± 0.02 | 1.17 ± 0.02 | 195.0/210 |
| 26 | ⋯ | ⋯ | 1.79 ± 0.01 | 0.24 ± 0.01 | 1.42 ± 0.01 | 324.3/290 |
| 27 | ⋯ | ⋯ | 1.77 ± 0.01 | 0.25 ± 0.01 | 1.50 ± 0.02 | 329.2/298 |
| 28 | ⋯ | ⋯ | 1.74 ± 0.01 | 0.23 ± 0.01 | 1.41 ± 0.02 | 331.8/290 |
| 29 | 3.26 ± 0.25 | 0.5 ± 0.2 | 1.86 ± 0.02 | 0.09 ± 0.01 | 1.28 ± 0.39 | 303.5/270 |
| 30 | 3.58 ± 0.30 | 0.3 ± 0.1 | 1.77 ± 0.02 | 0.11 ± 0.01 | 1.36 ± 0.36 | 277.8/291 |
| 32 | 2.81 ± 0.12 | 0.8 ± 0.2 | 1.95 ± 0.18 | 0.09 ± 0.01 | 1.35 ± 0.30 | 292.3/291 |
| 34 | 2.92 ± 0.16 | 0.8 ± 0.2 | 2.10 ± 0.18 | 0.10 ± 0.01 | 1.44 ± 0.30 | 335.1/298 |
| 35 | 3.01 ± 0.25 | 0.5 ± 0.2 | 1.65 ± 0.16 | 0.11 ± 0.01 | 1.36 ± 0.29 | 278.4/288 |
| 36 | 3.09 ± 0.20 | 0.6 ± 0.2 | 1.79 ± 0.14 | 0.11 ± 0.01 | 1.42 ± 0.29 | 258.1/296 |
| 38 | ⋯ | ⋯ | 1.57 ± 0.01 | 0.22 ± 0.01 | 1.63 ± 0.02 | 324.8/314 |
| 39 | ⋯ | ⋯ | 1.53 ± 0.01 | 0.22 ± 0.01 | 1.65 ± 0.02 | 394.9/312 |
| 40 | ⋯ | ⋯ | 1.53 ± 0.01 | 0.22 ± 0.01 | 1.67 ± 0.02 | 397.3/318 |
| 41 | ⋯ | ⋯ | 1.52 ± 0.01 | 0.21 ± 0.01 | 1.58 ± 0.02 | 377.1/305 |
| 42 | 0.19 ± 0.02 | 7055 ± 4320 | 1.41 ± 0.02 | 0.20 ± 0.01 | 1.84 ± 0.40 | 358.4/324 |
| 43 | 0.19 ± 0.02 | 7974 ± 463 | 1.45 ± 0.02 | 0.20 ± 0.01 | 1.73 ± 0.08 | 333.5/313 |
| 45 | ⋯ | ⋯ | 1.59 ± 0.01 | 0.24 ± 0.01 | 1.68 ± 0.02 | 415.4/322 |
| 46 | ⋯ | ⋯ | 1.64 ± 0.01 | 0.24 ± 0.01 | 1.62 ± 0.02 | 330.5/311 |
| 47 | ⋯ | ⋯ | 1.56 ± 0.01 | 0.23 ± 0.01 | 1.68 ± 0.02 | 383.3/319 |
| 50 | ⋯ | ⋯ | 1.58 ± 0.01 | 0.22 ± 0.01 | 1.61 ± 0.02 | 336.2/310 |
| 51 | ⋯ | ⋯ | 1.56 ± 0.01 | 0.22 ± 0.01 | 1.64 ± 0.02 | 400.4/311 |
Notes.
a Unabsorbed 0.5–10 keV flux in units of ×10−9 erg s−1 cm−2. b For these bursts, a disk blackbody component is not required.Download table as: ASCIITypeset image
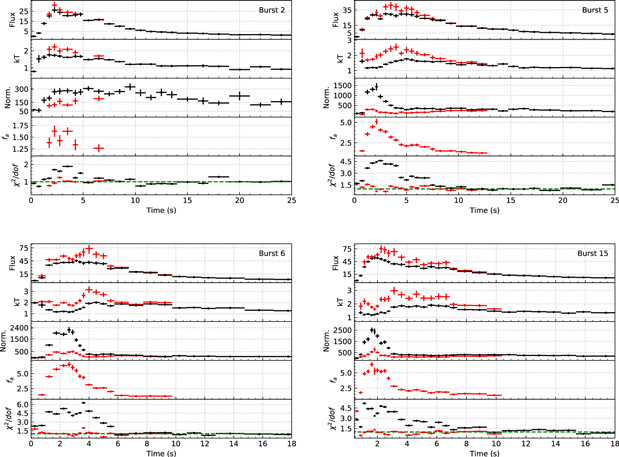
For the time-resolved spectral analysis of the bursts, we followed three different approaches. Initially, we fit the spectra with only the persistent emission model, where the parameters are fixed to the values given in Table 2. When this resulted in bad statistics, obviously due to the burst emission itself, we added a blackbody component to take into account the burst emission. However, similar to previous examples from NICER (see, e.g., Jaisawal et al. 2019; Bult et al. 2021; Dziełak et al. 2021; Güver et al. 2022), such a model was often not sufficient to obtain a statistically acceptable fit, especially around the peak flux moments of the bursts. As a second alternative, we then applied the so-called fa method (Worpel et al. 2013, 2015), where the preburst emission is assumed not to change in shape, but is scaled up to compensate for the observed excess emission beyond the thermal emission from the burst itself. In each case, we allowed the fa parameter to vary from unity; we ran an f-test and only kept that parameter free if the chance probability of a change in the statistic was less than 5%. The effects of the fa parameter on two X-ray spectra (Bursts 6 and 23) are shown in Figure 6. The best-fit values for the scaling factor are fa = 6.54 ± 0.4 for burst 6 and fa = 1.8 ± 0.3 for burst 23. We also show the persistent emission model without the application of the fa parameter in the same figure, for comparison. Figure 3 shows the time evolution of the spectral parameters for some example X-ray bursts.
To account for the soft excess emission during the bursts, instead of using the fa
method, we applied a model where the reflection of the burst emission off the accretion disk is taken into account. For this purpose, we used a specific version of the bbrefl
19
model (Ballantyne 2004; Ballantyne & Strohmayer 2004) in XSPEC (Arnaud 1996), which takes into account the reflection of thermal photons from an accretion disk. We also took into account the general relativistic effects in the inner disk by using a convolution model, relconv (Dauser et al. 2010; García et al. 2022). The bbrefl model depends on the ionization parameter ( ) in the disk, the temperature of the incident blackbody, and the iron abundance component in the accretion disk. Here, the ionization parameter is defined as the ratio of the incident flux to the hydrogen number density in the disk. The relconv
20
model depends on a large number of parameters, like the inner and outer emissivity indices, the dimensionless spin parameter (a), the inner and outer radii of the disk, as well as the orbital inclination. We applied a few reasonable conditions when using bbrefl and relconv. First, we tied the inner emissivity index to the outer emissivity index. Next, we fixed the dimensionless spin parameter (a), in the relconv model, to 0.27 in the fits, assuming typical values for a neutron star (with a mass of 1.4M☉ and a radius of 10 km) and a spin period of 581 Hz, which includes the approximation for converting spin frequency to dimensionless spin (Braje et al. 2000). Also, we fixed the inner and outer radii of the disk at RISCO and 1000.0Rg
, respectively. We also assumed that the orbital inclination of the system was 60° (Casares et al. 2006). Moreover, when using the reflection model, the ionization parameter (ξ) was fixed at 3.4. As a test, we allowed the ionization parameter to vary; however, the fit did not improve in the majority of cases, and the parameter tended to be maximally ionized. While fitting the spectra with this model, we linked the incident temperature in the reflection model to the burst temperature. We fixed the hydrogen column density at 4.4 × 1021 cm−2 for all fits. We note that we only used the reflection model where the use of an fa
parameter greater than 1 was the statistically preferred model and the burst flux was larger than half the peak flux of the burst.
Finally, taking advantage of the hard X-ray sensitivity of AstroSat/LAXPC, we extracted X-ray spectra for the exact time intervals of the NICER spectra for the five simultaneous bursts. This way, it was possible to perform simultaneous soft and hard X-ray spectral fitting for these bursts. We note that adding the 3.0–25 keV data to the 0.5–10 keV data from NICER allowed for a better determination of the high-energy tail of the preburst emission, so the inferred best-fit spectral parameters of the preburst emission show some variations. For this reason, in Table 3, we provide the best-fit parameters for the NICER+LAXPC data that we used to fit to the burst spectra. For the rest of the time-resolved spectroscopy of the NICER and LAXPC data, we followed the exact same methods as we did for only the NICER data.
Table 3. Best-fit Model Results for Preburst X-Ray Spectra of 4U 1636–536 Using an Absorbed Disk Blackbody Plus Power-law Model, when NICER and AstroSat/LAXPC Are Taken into Account
| BID | Tin | NormDBB | Γ | Flux a | Flux b | χ2 / dof |
|---|---|---|---|---|---|---|
| (keV) | (R ) ) | |||||
| 7 c | 0.92 ± 0.01 | 83 ± 5.0 | 2.01 ± 0.02 | 1.17 ± 0.01 | 1.18 ± 0.01 | 353.52/356 |
| 22 | 1.87 ± 0.11 | 1.0 ± 0.2 | 1.90 ± 0.01 | 0.76 ± 0.01 | 1.02 ± 0.02 | 294.10/287 |
| 23 | 2.58 ± 0.20 | 0.26 ± 0.1 | 1.91 ± 0.01 | 0.79 ± 0.01 | 1.04 ± 0.01 | 319.70/286 |
| 27 | 2.13 ± 0.13 | 0.6 ± 0.1 | 1.92 ± 0.01 | 0.83 ± 0.01 | 1.06 ± 0.01 | 280.59/296 |
| 28 | 2.35 ± 0.17 | 0.4 ± 0.1 | 1.92 ± 0.01 | 0.80 ± 0.01 | 1.10 ± 0.02 | 305.76/288 |
Notes. Throughout the analysis, we fixed the neutral hydrogen column density to NH = 4.4 × 1021 cm−2.
a Unabsorbed 0.5–10.0 keV flux in units of ×10−9 erg s−1 cm−2. b Unabsorbed 3.0–25.0 keV flux in units of ×10−9 erg s−1 cm−2. c For this particular burst, a Gaussian line at 6.5 keV was also added.Download table as: ASCIITypeset image
3. Results
3.1. General Characteristics of Detected X-Ray Bursts
Within the 520 ks long observations, we detected roughly one burst per 10 ks, resulting in a burst rate of 0.35 hr−1, which is a little higher, but broadly in agreement with, the burst rate derived from previous missions for 4U 1636–536 (Galloway et al. 2008a, 2020). Lightcurves of a few example bursts are shown in Figure 2. As is evident in Figure 2, burst 4 shows a pronounced double-peaked structure in its lightcurve. Unfortunately, during this burst, the overshoot rate, which is generally caused by charged particle events, showed a continuous increase, which, although it does not change the reality of the bursts, prevented a detailed spectral analysis.
Figure 2. 0.5–10 keV lightcurves of some of the X-ray bursts observed from 4U 1636–536. The bursts shown here are bursts 4, 5, 6, 15, and 26. Bursts 5, 6, and 15 are among the brightest bursts within the NICER sample, while burst 4 is unique in having a double-peaked structure, and finally burst 26 is an example of a more typical X-ray burst.
Download figure:
Standard image High-resolution imageSome of the basic properties of the bursts observed with NICER are given in Table 1. Within the sample, three bursts immediately stand out from the rest, with significantly higher peak count rates. These are the bursts 5, 6, and 15, with 5140 ± 107, 7741 ± 129, and 8715 ± 138 count s−1, respectively, and their lightcurves are shown in Figure 2. These bursts also show evidence for photospheric radius expansion (see Section 3.2). The somewhat low peak flux of burst 5, compared to bursts 6 and 15, suggests that it was bursting in a hydrogen-rich rather than a hydrogen-poor environment (see also Table 4). Besides these brightest bursts, we note that there are seven bursts (bursts 7, 10, 13, 25, 35, 40, and 43) with peak count rates less than 1000 count s−1. Four of these bursts are the secondary or tertiary bursts in short-recurrence burst events. These are bursts 10, 13, 40, and 43. For bursts 25 and 35, our observations do not show evidence for prior bursts within 69 and 170 s, respectively, which is not very constraining, so these bursts may still be the secondary bursts of short-recurrence events that NICER simply missed, given that the typical recurrence time of such events is 720 s (Keek et al. 2010). However, for burst 7, we note that there is no prior burst within 1640 s, implying that this burst may actually be intrinsically dimmer than a typical burst. The remaining bursts have an average peak rate of 1700 count s−1, with a standard deviation of 250 count s−1, and have pretty much similar profiles to each other. An example is shown in Figure 2.
Table 4. Best-fit Spectral Parameters of the Bursts at the Peak Flux Moment
| BID | Peak fa | Peak Flux a | Peak kT | Peak Norm | Fluence b | |||
|---|---|---|---|---|---|---|---|---|
| With fa | Without fa | With fa | Without fa | With fa | Without fa | With fa | ||
| 2 | 1.6 ± 0.1 | 3.1 ± 0.4 | 2.6 ± 0.2 | 2.2 ± 0.2 | 1.7 ± 0.1 | 123 ± 28 | 270 ± 34 | 12.3 ± 0.4 |
| 3 | 1.6 ± 0.1 | 1.5 ± 0.2 | 1.5 ± 0.1 | 1.9 ± 0.2 | 1.5 ± 0.1 | 108 ± 25 | 303 ± 38 | 7.8 ± 0.3 |
| 5 | 3.2 ± 0.2 | 4.1 ± 0.5 | 3.0 ± 0.2 | 2.4 ± 0.2 | 1.4 ± 0.1 | 117 ± 24 | 699 ± 71 | 28.1 ± 0.7 |
| 6 | 3.1 ± 0.2 | 7.3 ± 1.0 | 4.6 ± 0.3 | 3.1 ± 0.3 | 1.3 ± 0.1 | 79 ± 15 | 1422 ± 148 | 37.9 ± 1.0 |
| 7 | ⋯ | 0.4 ± 0.1 | 0.4 ± 0.1 | 1.4 ± 0.2 | 1.4 ± 0.2 | 100 ± 29 | 100 ± 29 | 1.7 ± 0.1 |
| 9 | 2.3 ± 0.3 | 6.3 ± 1.2 | 4.4 ± 0.7 | 3.9 ± 0.6 | 2.8 ± 0.3 | 33 ± 9 | 68 ± 12 | 31.5 ± 1.2 |
| 11 | 2.7 ± 0.2 | 3.8 ± 0.4 | 2.8 ± 0.2 | 2.8 ± 0.2 | 2.1 ± 0.1 | 65 ± 10 | 141 ± 14 | 21.7 ± 1.0 |
| 12 | 2.6 ± 0.3 | 2.46 ± 0.4 | 1.8 ± 0.2 | 2.4 ± 0.3 | 1.8 ± 0.1 | 76 ± 19 | 173 ± 29 | 8.9 ± 0.4 |
| 13 | 1.6 ± 0.3 | 0.5 ± 0.1 | 0.5 ± 0.1 | 1.6 ± 0.2 | 1.4 ± 0.1 | 73 ± 28 | 125 ± 29 | 1.6 ± 0.1 |
| 14 | 2.8 ± 0.2 | 2.2 ± 0.3 | 1.7 ± 0.2 | 2.3 ± 0.2 | 1.6 ± 0.1 | 78 ± 14 | 231 ± 32 | 16.3 ± 0.6 |
| 15 | 5.2 ± 0.3 | 7.6 ± 0.9 | 5.5 ± 0.4 | 2.3 ± 0.2 | 1.2 ± 0.1 | 247 ± 52 | 2374 ± 265 | 25.1 ± 1.1 |
| 16 | 1.5 ± 0.2 | 2.3 ± 0.2 | 2.2 ± 0.2 | 1.9 ± 0.1 | 1.7 ± 0.1 | 176 ± 33 | 270 ± 32 | 15.0 ± 0.4 |
| 18 | 1.5 ± 0.2 | 1.8 ± 0.2 | 1.7 ± 0.2 | 1.9 ± 0.1 | 1.7 ± 0.1 | 128 ± 26 | 190 ± 27 | 8.5 ± 0.3 |
| 19 | 2.0 ± 0.1 | 1.8 ± 0.2 | 1.6 ± 0.2 | 2.3 ± 0.2 | 1.7 ± 0.1 | 63 ± 11 | 177 ± 25 | 16.9 ± 0.7 |
| 20 | 1.8 ± 0.2 | 2.7 ± 0.4 | 2.2 ± 0.2 | 2.4 ± 0.2 | 1.9 ± 0.1 | 85 ± 19 | 165 ± 25 | 17.3 ± 0.6 |
| 21 | 2.4 ± 0.1 | 2.4 ± 0.2 | 1.9 ± 0.1 | 2.3 ± 0.1 | 1.8 ± 0.1 | 76 ± 9 | 158 ± 12 | 19.2 ± 0.7 |
| 22 | 1.8 ± 0.2 | 2.3 ± 0.3 | 2.0 ± 0.2 | 2.3 ± 0.2 | 1.9 ± 0.1 | 83 ± 14 | 147 ± 21 | 16.8 ± 0.7 |
| 23 | 1.9 ± 0.2 | 2.3 ± 0.2 | 2.0 ± 0.2 | 2.3 ± 0.1 | 1.9 ± 0.1 | 82 ± 13 | 139 ± 15 | 18.3 ± 0.7 |
| 24 | 2.7 ± 0.2 | 4.7 ± 0.8 | 3.1 ± 0.4 | 3.3 ± 0.4 | 2.2 ± 0.2 | 437 ± 11 | 120 ± 18 | 25.7 ± 1.1 |
| 25 | ⋯ | 0.4 ± 0.1 | 0.4 ± 0.1 | 1.5 ± 0.1 | 1.5 ± 0.1 | 87 ± 22 | 87 ± 22 | 15.0 ± 0.2 |
| 26 | 2.1 ± 0.2 | 2.6 ± 0.4 | 2.1 ± 0.3 | 2.5 ± 0.2 | 2.0 ± 0.1 | 68 ± 15 | 127 ± 19 | 21.3 ± 0.7 |
| 27 | 2.4 ± 0.2 | 2.9 ± 0.5 | 2.2 ± 0.3 | 2.6 ± 0.3 | 2.0 ± 0.1 | 60 ± 14 | 139 ± 21 | 19.4 ± 0.7 |
| 28 | 2.3 ± 0.2 | 2.3 ± 0.3 | 1.9 ± 0.2 | 2.4 ± 0.2 | 1.9 ± 0.1 | 73 ± 17 | 150 ± 22 | 19.5 ± 0.7 |
| 29 | 2.0 ± 0.3 | 2.3 ± 0.2 | 2.2 ± 0.2 | 2.3 ± 0.1 | 2.0 ± 0.1 | 86 ± 14 | 131 ± 13 | 19.1 ± 0.9 |
| 30 | 2.5 ± 0.3 | 2.5 ± 0.4 | 2.2 ± 0.3 | 2.6 ± 0.3 | 2.1 ± 0.1 | 55 ± 15 | 110 ± 16 | 23.5 ± 0.9 |
| 32 | 2.2 ± 0.3 | 3.2 ± 0.7 | 2.5 ± 0.4 | 3.2 ± 0.5 | 2.4 ± 0.2 | 35 ± 11 | 75 ± 13 | 24.7 ± 1.0 |
| 34 | 2.3 ± 0.2 | 2.0 ± 0.2 | 1.8 ± 0.2 | 2.4 ± 0.2 | 1.9 ± 0.1 | 58 ± 11 | 145 ± 22 | 18.6 ± 0.9 |
| 35 | 2.0 ± 0.3 | 0.9 ± 0.3 | 0.8 ± 0.1 | 2.3 ± 0.1 | 1.7 ± 0.2 | 32 ± 15 | 86 ± 19 | 4.2 ± 0.3 |
| 36 | 2.1 ± 0.2 | 3.1 ± 0.4 | 2.5 ± 0.3 | 2.9 ± 0.3 | 2.3 ± 0.1 | 45 ± 9 | 86 ± 10 | 18.5 ± 1.0 |
| 38 | 2.2 ± 0.2 | 2.7 ± 0.5 | 2.0 ± 0.3 | 2.7 ± 0.3 | 2.0 ± 0.2 | 50 ± 14 | 120 ± 20 | 21.5 ± 0.7 |
| 39 | 2.5 ± 0.3 | 2.3 ± 0.5 | 1.9 ± 0.2 | 2.8 ± 0.4 | 1.9 ± 0.1 | 39 ± 13 | 150 ± 20 | 23.1 ± 0.8 |
| 40 | 1.5 ± 0.1 | 0.4 ± 0.1 | 0.4 ± 0.1 | 1.9 ± 0.2 | 1.5 ± 0.1 | 30 ± 9 | 70 ± 11 | 1.9 ± 0.2 |
| 41 | 1.9 ± 0.3 | 2.3 ± 0.4 | 2.0 ± 0.2 | 2.4 ± 0.3 | 2.0 ± 0.1 | 64 ± 16 | 111 ± 17 | 20.1 ± 0.7 |
| 42 | 2.0 ± 0.2 | 2.1 ± 0.3 | 1.9 ± 0.2 | 2.3 ± 0.2 | 1.9 ± 0.1 | 69 ± 17 | 130 ± 20 | 9.3 ± 0.5 |
| 43 | ⋯ | 0.3 ± 0.1 | 0.3 ± 0.1 | 2.0 ± 0.2 | 2.1 ± 0.2 | 21 ± 10 | 21 ± 10 | 1.9 ± 0.3 |
| 45 | 2.4 ± 0.2 | 2.4 ± 0.4 | 2.0 ± 0.2 | 2.7 ± 0.3 | 2.1 ± 0.1 | 50 ± 14 | 103 ± 16 | 23.7 ± 0.8 |
| 46 | 1.6 ± 0.1 | 1.3 ± 0.1 | 1.2 ± 0.1 | 1.9 ± 0.1 | 1.7 ± 0.1 | 92 ± 11 | 140 ± 11 | 5.5 ± 0.3 |
| 47 | 1.8 ± 0.2 | 1.9 ± 0.2 | 1.7 ± 0.1 | 2.3 ± 0.2 | 1.9 ± 0.1 | 67 ± 12 | 117 ± 13 | 15.3 ± 0.7 |
| 50 | 2.1 ± 0.2 | 3.0 ± 0.5 | 2.4 ± 0.3 | 2.8 ± 0.3 | 2.2 ± 0.2 | 49 ± 12 | 100 ± 16 | 24.8 ± 0.9 |
| 51 | 2.3 ± 0.2 | 2.6 ± 0.3 | 2.0 ± 0.2 | 2.8 ± 0.2 | 2.0 ± 0.1 | 45 ± 9 | 112 ± 13 | 17.9 ± 0.8 |
Notes.
a Unabsorbed bolometric flux in units of ×10−8 erg s−1 cm−2. b Fluences are in units of ×10−8 erg cm−2.Download table as: ASCIITypeset image
Within the sample of 51 bursts, there are a number of short-recurrence events. We discuss these events and show the lightcurves in the Appendix.
In total, we identified 15 X-ray bursts in the NuSTAR observations, which span 195 ks, with 92 ks of on-source exposure time. A detailed analysis of all the bursts is beyond the scope of this study, but we would note that within this sample, we have identified two short-recurrence events with recurrence times of only 230 s and 629 s, as well as one triple-burst event, where the latter two of these three bursts were also observed simultaneously with NICER (see Figure 16). Of the total NuSTAR burst sample, seven bursts (bursts 1, 5, 9, 10, 11, 14, and 15 within these observations) showed very similar profiles in their lightcurves, with a peak count rate of 300 count s−1. We used these bursts to search for evidence for Compton cooling.
3.2. Time-resolved Spectroscopy
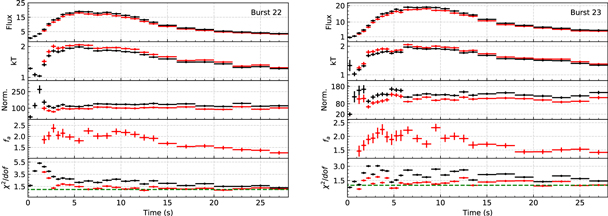
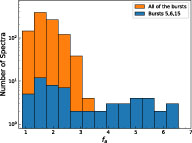
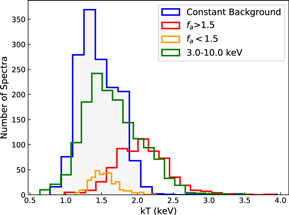
In total, we analyzed 2611 X-ray spectra extracted from 40 thermonuclear X-ray bursts observed with NICER. The time evolutions of the spectral parameters for some of the example bursts observed simultaneously with AstroSat are shown in Figures 3 and 4. Of all 2611 spectra, 1512 instances were above a flux limit of 10−9 erg s−1 cm−2, and of these, in 948 cases, the use of a scaling factor (fa ) greater than 1 is statistically preferred. The flux limit is selected to avoid scatter in the parameters when the burst emission becomes comparable to the persistent state flux. These results indicate that in about 63% of the X-ray spectra, we need a scaling factor to the persistent emission. A histogram of the resulting χ2/dof values using the different approaches is presented in Figure 5, which shows the improvements in the fits. An example of the observed variation in the preburst emission with the addition of the fa parameter is shown in Figure 6, for both a NICER-only case and a NICER + LAXPC case. Histograms of all the fa values are shown in Figure 7. We show bursts 5, 6, and 15 in different colors in the plot, as they show evidence for photospheric radius expansion (following the definitions of Galloway et al. 2008a and Güver et al. 2012a). We note that although it is required to better fit the data, the use of the scaling factor significantly alters the inferred best-fit spectral parameters, which impedes the observation of the expected spectral evolution from a photospheric radius expansion event, especially regarding the expected evolution of the blackbody normalization. As was the case for Aql X-1 (Güver et al. 2022), the largest fa values are seen during the peak flux moments of these bursts. Large fa values also have more significant effects on the inferred spectral parameters for the bursts. The change in the inferred blackbody temperature is shown in Figure 8 for the constant background approach (for the 0.5–10.0 keV and 3–10.0 keV ranges), as well as for different fa values.
Figure 3. The time evolutions of the NICER spectral parameters are shown for bursts 2, 5, 6, and 15. The red symbols show the results of the fa
method and the black symbols show the results for constant background emission. From top to bottom, we show the bolometric flux (in units of 10−9 erg s−1 cm−2), temperature (keV), blackbody normalization ( ), fa
, and, finally, the fit statistics, respectively.
Download figure:
Standard image High-resolution imageFigure 4. The time evolutions of the NICER and AstroSat/LAXPC spectral parameters are shown for bursts 22 and 23. The red symbols show the results of the fa
method and the black symbols show the results for constant background emission. From top to bottom, we show the 0.5–10 keV X-ray flux (in units of 10−9 erg s−1 cm−2), temperature (keV), blackbody normalization ( ), fa
, and, finally, the fit statistics, respectively.
Download figure:
Standard image High-resolution imageFigure 5. Histograms of the χ2/dof values for the 0.5–10.0 keV (blue) and 3.0–10 keV (green) constant background approach fits, as well as the 0.5–10 keV fits, where the scaling factor fa is used for the preburst emission (red).
Download figure:
Standard image High-resolution imageFigure 6. Examples of the best-fit X-ray spectra extracted around the peak flux moments of bursts 6 and 23 are shown in the upper and lower panels, respectively. In both panels, the black and red dots show the observed actual NICER and LAXPC data, respectively. The black lines show the summed best-fit models. The blue and green lines show the individual components of the models, which are the blackbody model for the burst and the persistent emission model multiplied with the fa parameter, respectively. Also, the orange lines in both panels show the model without the application of the fa parameter.
Download figure:
Standard image High-resolution imageFigure 7. A histogram of the best-fit fa values, where the burst flux is greater than 10−9 erg s−1 cm−2, is shown in orange. The blue histogram shows the fa values for bursts 5, 6, and 15 only, which are suspected to show photospheric radius expansion. Note that due to the difference in the sizes of the samples, the number of bins has been kept different.
Download figure:
Standard image High-resolution imageFigure 8. Histograms of the inferred blackbody temperature values obtained using different methods. The use of the fa parameter forces the blackbody temperature to higher values, especially if its value is large. Note that due to the difference in the sizes of the samples, the number of bins has been kept different.
Download figure:
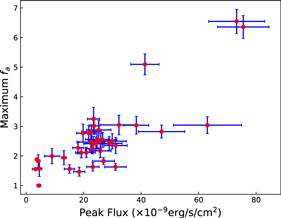
Standard image High-resolution imageWe searched for correlations between several parameters and the value of the scaling factor using a Pearson correlation. The correlation coefficient between the peak flux and the fa value obtained at that moment was 0.80, with a chance probability of 7.81 × 10⁻¹⁰. On the other hand, the correlation coefficient between the peak flux of a burst and the maximum fa value that is reached in that particular burst was 0.827, with a chance probability of 4.68 × 10⁻¹¹, indicating a slightly stronger correlation between the peak flux and maximum fa value. This relation is shown in Figure 9.
Figure 9. The maximum fa value reached during a burst is shown as a function of the peak flux.
Download figure:
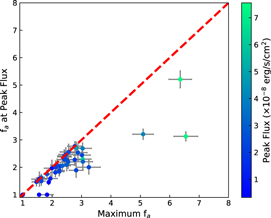
Standard image High-resolution imageAlthough, in general, the fa values obtained at the peak flux moment and the maximum fa value of a burst agree with each other, the correlation between these parameters is not perfect (see Figure 10). The correlation between the maximum fa value and the fa at the peak flux moment is 0.86, with a chance probability of 1.25 × 10⁻¹². The correlation coefficient between persistent flux and the maximum fa value is only 0.2, with a chance probability of 0.20, indicating no significant correlation between these two parameters. Such a lack of correlation allows us to conclude that the increase in the mass accretion rate due to PR drag, which is characterized here by the fa parameter, does not seem to depend on the preburst spectral state of the source.
Figure 10. Comparison of the fa values obtained at the peak flux moment and the maximum fa value reached during a burst.
Download figure:
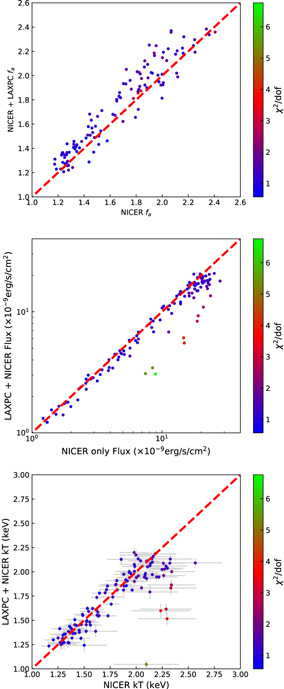
Standard image High-resolution imageThe results of the fits obtained for the five bursts where we had simultaneous data from both NICER and AstroSat/LAXPC were similar to the results obtained when we used only the NICER data. Comparisons of the best-fit fa , blackbody temperature, and bolometric flux values are shown in Figure 11. We find that the addition of the LAXPC data does not significantly alter the best-fit values of the spectral analysis, although it does improve the measurement uncertainties. For example, the uncertainties in the burst temperature values decrease on average by a factor of 3, especially at higher temperatures (see the lower panel of Figure 11). While a few spectra do yield different outcomes in the NICER data alone, as compared to the NICER+LAXPC analysis (as indicated by the offset from the dashed line), those cases always have poor χ2/dof values. We note that simultaneous fits generally result in slightly lower fa values compared to just the NICER results.
Figure 11. Comparison of the best-fit fa , flux, and kT values obtained when using only NICER and when using NICER together with LAXPC. The bottom panel also shows the uncertainties of the best-fit kT values on both axes, to emphasize the decrease in the measurement uncertainty with the addition of the LAXPC data.
Download figure:
Standard image High-resolution image3.3. Application of a Reflection Model
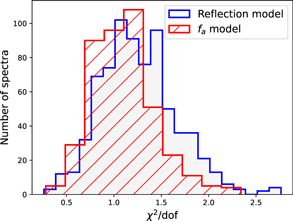
We applied the bbrefl model to all the X-ray spectra where the fa was greater than 1 and the bolometric flux was larger than half the peak flux of a burst. Our results generally agree very well with our previous analysis using NICER observations of bursts from Aql X-1 (Güver et al. 2022). We find that when it is allowed to vary, the ionization parameter reaches the largest tabulated value. We therefore fix this parameter in our analysis. This indicates very high ionization levels during the burst in the accretion disk. As a result, the reflection model provides a similar, but slightly worse, improvement on the fits in comparison to what the fa model provides (see Figure 12) for the same dof.
Figure 12. Comparison of the χ2/dof values obtained when using the fa approach and the reflection model of NICER bursts.
Download figure:
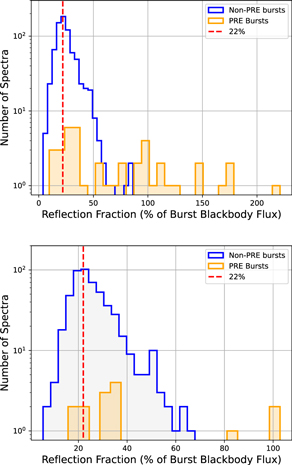
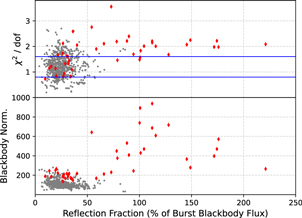
Standard image High-resolution imageWe calculated the fraction of unabsorbed flux for the reflection model in comparison to that of the burst blackbody in the 0.5–10.0 keV range. We find that for the great majority of the bursts, the reflection fraction is about 22% (see Figure 13). Only for the bursts that show photospheric radius expansion can the reflection fraction be larger than the incident photon flux by a factor of 2. When the reflection fraction is plotted against the fit statistics (the upper panel of Figure 14) and against the normalization of the blackbody model (the lower panel of Figure 14), it can be seen that the reflection fraction is very large only when the fit statistics are significantly bad, and these cases are seen when the blackbody normalization is significantly larger, indicating that it is seen when the photosphere expands. Also similar to our results from Aql X-1, we see that especially during the photospheric radius expansion phases of the bursts, the reflection model by itself cannot explain all of the excess emission in the X-ray spectrum. If we take only the results obtained when the χ2/dof is within an acceptable range (0.8 < χ2/dof < 1.6), then the resulting distribution of the reflection fractions again peak at around 22%, with almost no results exceeding the seed photon flux. This tight clustering is expected, and supports the reflection scenario: from burst to burst, the emitting surface area, which would be the full surface of the neutron star and the reflecting surface, which would be the inner accretion disk, can be assumed to be constant.
Figure 13. Histogram of the ratio of the flux of the reflection model and the flux of the corresponding burst blackbody. The upper panel shows the case when all the X-ray spectra are included, while the lower panel shows the results when the fit statistics are acceptable (as defined by the range shown in Figure 14). The results in orange show the bursts that show evidence of photospheric radius expansion (as given in Table 1). In both panels, the vertical red dashed lines show the 22% ratio.
Download figure:
Standard image High-resolution imageFigure 14. Upper panel: the fit statistics as a function of the ratio of the flux of the reflection model and the flux of the corresponding blackbody model. The red diamonds show the results for bursts that show evidence of photospheric radius expansion (as given in Table 1), while the gray dots show the values for the rest of the bursts. The solid blue horizontal lines show the range where the fit is assumed to be statistically acceptable. Lower panel: the blackbody normalization ( ) as a function of the reflection fraction. It can be seen that the reflection fraction tends to be larger when the blackbody normalization is larger.
Download figure:
Standard image High-resolution imageWe also applied the same reflection model to bursts 22, 23, 27, and 28, which were simultaneously observed with NICER and AstroSat. Our simultaneous fit results generally agree very well with the results obtained from bursts with only the NICER data. The distributions of the reflection fractions for these bursts are shown in Figure 15. These bursts are generally dimmer compared to the brighter bursts in the NICER sample, and the inferred reflection fractions from simultaneous fits follow the distributions for those bursts.
Figure 15. Histogram of the ratio of the flux of the reflection model and the flux of the corresponding burst blackbody for the X-ray spectra extracted from bursts 22, 23, 27, and 28, when the NICER and AstroSat/LAXPC data are simultaneously fit. The vertical red dashed line shows the 22% ratio.
Download figure:
Standard image High-resolution image3.4. Search for Evidence of Compton Cooling Using NuSTAR Data
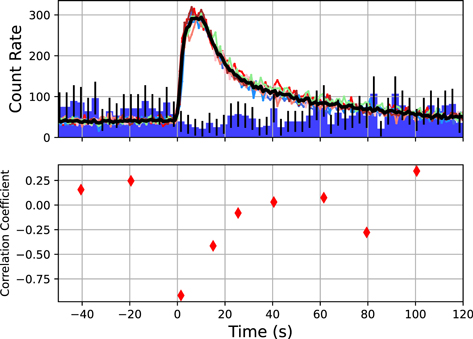
It has been suggested (Lake & Partridge 1977; Sunyaev & Titarchuk 1980; Guilbert et al. 1982) and shown (Guilbert & Fabian 1982; Fabian et al. 1986; White et al. 1988) that a sudden increase in the number of relatively soft photons due to thermonuclear X-ray bursts can cause the corona surrounding the neutron star to cool down via Compton scattering of these photons with energetic electrons. Fiocchi et al. (2006) have shown that there is indeed observational evidence for a decrease in the observed brightness of 4U 1636–536 between the 30 and 79 keV bands during the burst times, by using the data from one burst observed by INTEGRAL/JEM-X. Studying 114 bursts, Ji et al. (2013) also showed evidence for a shortage in hard X-rays, which was attributed to the observational signature of Compton cooling from 4U 1636–536. A similar analysis has recently been performed using Insight/HXMT data by Chen et al. (2018). Having a large data set, we also searched for evidence of Compton cooling in the NuSTAR data of 4U 1636–536. As stated in Section 2, we identified 15 X-ray bursts, six of which were simultaneously observed with NICER, in the NuSTAR observations performed in 2019. As the total detected count rates are relatively lower in the NuSTAR data, we therefore used seven bursts, which have very similar burst profiles, to calculate an average higher-S/N burst profile. Four of these bursts were also simultaneously observed with NICER (bursts 44, 45, 46, and 50). We generated two burst profiles in the 3–30 keV and 30–79 keV bands. These bursts and the average burst profiles are shown in Figure 16. Already, from the upper panel of Figure 16, a slight decrease in intensity in the hard X-ray band, accompanied by the start of the burst, can be seen. Specifically, the average count rate that we measure in the hard X-ray band 50 s before the bursts is 1.44 ± 0.07 count s−1, while the average count rate measured in the first 10 s of the bursts is 0.64 ± 0.07 count s−1. To further investigate whether there is any correlated variation, we calculated a Pearson correlation coefficient between the soft- and hard-band lightcurves, by taking all the data in 5 and 10 s long intervals between −5 and +25 s from the start of the burst, and for the rest, respectively. The resulting correlation coefficients are shown in the lower panel of Figure 16. A strong negative correlation can be seen in the time interval just around the peaks of the bursts, which is not visible at other times within roughly 180 s around these seven bursts. We note that since the count rates are very low in the hard band, we did not try to just subtract the background from both the soft and hard lightcurves.
Figure 16. The upper panel shows the lightcurves of some of the X-ray bursts, as observed by NuSTAR in the 5–30 and 30–79 keV bands. For the soft band, the individual bursts are shown in different colors, where the solid black curve shows the average and the time bin size is 1 s. For the hard X-ray band, only the average burst lightcurve is shown, in blue, with appropriate error bars in black. For the hard X-ray lightcurve, the time bin size is 4 s, and for clarity the number of photons is multiplied by 50. The lower panel shows the evolution of the Pearson correlation coefficient as a function of time, between the two average curves, after being rebinned to 5 and 10 s, between −5 and +25 s from the start of the burst, and for the rest, respectively.
Download figure:
Standard image High-resolution image4. Conclusions
We report the detection of 51 thermonuclear X-ray bursts observed from 4U 1636–536 by NICER since 2017 June. Within this large burst sample, we see two triple- and four double-burst events, with recurrence times as short as ∼400 s. One of the triple-burst events has already been reported by Zhao et al. (2022).
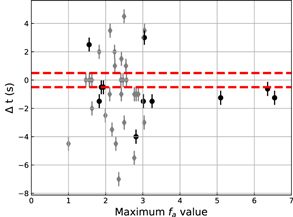
As commonly observed, thanks to NICER's soft X-ray coverage (see, e.g., Keek et al. 2018a, 2018b; Bult et al. 2019; Buisson et al. 2020; Güver et al. 2022), we detect a significant soft excess in the burst emission if the X-ray spectra are modeled assuming a constant background and a thermal radiation from the burst itself. Statistically, a model that involves applying a scaling factor (fa ) to the persistent emission spectrum during the burst is the preferred model in about two-thirds of all the X-ray spectra that we extracted from 4U 1636–536. For 4U 1636–536, we find that the largest fa factors are observed around the peak fluxes of the bursts, and seem to be correlated with the peak flux of the burst. This is similar to the behavior that we found for the bursts from Aql X-1 (Güver et al. 2022). Although the fa factor itself is simply a scaling factor to the persistent emission of the system during the burst, it has been attributed to the increased mass accretion rate during the bursts, due to PR drag caused by the burst photons. Simulations of the interactions of bursts with their environment (Fragile et al. 2018, 2020) show that bursts do indeed cause PR drag, which results in the accretion rate increasing by several factors. However, this increase in the mass accretion rate is not sustainable, since the inner part of the disk is expected to be drained faster than it is refilled by the outer parts, and therefore the mass accretion rate can decrease again, even before the burst peaks. Therefore, a time difference between the maximum fa value obtained at a burst and the peak flux moment can be expected. In Figure 17, we show this time difference. We show the cases for all the bursts in gray, and in black we show the cases where the fa value at the peak is 3σ different than the maximum fa value. In general, we see that there is a tendency for the time difference to be negative. Specifically, in 14 bursts, the fa peaks before the burst reaches its peak flux. While these results support the PR drag scenario, there are bursts where the opposite trend can also be seen.
Figure 17. Time difference between the maximum fa moment and the peak flux of a burst. We show all the bursts in gray, and in black we show the cases where the difference in the fa value when it reaches its maximum and at the peak flux moment is larger than 3.0σ. The horizontal red dashed lines show the 0.5 s time interval, which is the typical exposure time of X-ray spectra around the peak flux moments.
Download figure:
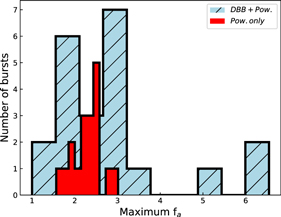
Standard image High-resolution imageSince the fa is related to the mass accretion rate in the inner disk, it may be expected that the maximum fa value obtained during a burst may be related to the persistent emission of the source. Similar to our result for Aql X-1, we found no evidence for a correlation between the persistent flux and the fa parameter. We also checked whether the maximum fa value could be related to the source spectral state. For this purpose, in Figure 18, we show histograms of the maximum fa values found for each burst in cases where a disk blackbody component is significantly detected and not. We find that the maximum fa values attained during these bursts do not show significant variations from each other. The only difference is that in the bursts where a disk blackbody is required, the scatter of the fa values is significantly larger than in the cases where the disk blackbody is statistically not needed.
Figure 18. Maximum fa values reached during the bursts, where the addition of a disk blackbody component is required and not.
Download figure:
Standard image High-resolution imageWe also applied a reflection model to all the X-ray spectra where a scaling factor improved the fit. We took into account the relativistic effects on the reflection spectrum, although we note that not taking into account these effects did not significantly worsen the fits. The data do not require relativistic blurring of the reflection spectra. We also tried to allow the ionization parameters to vary through the bursts, as they are expected to increase during the rise (Speicher et al. 2022). However, the current data often do not allow us to constrain that parameter, and when they do allow it to vary we see that the disk is strongly ionized when it reaches the hard limits of the current models. At later stages of the bursts, the ionization parameter can be limited to lower values than for the hard limits, but the results are not statistically significant.
We saw that similar to the results obtained for Aql X-1, the application of a reflection model improves the fits compared to the constant background approach, and the resulting statistics are comparable to results of the fa approach. We see that around the peak flux moments of the bursts that show photospheric radius expansion, the reflection models do not provide adequate fits, but in bursts where no radius expansion is observed, the reflection fraction compared to the burst emission seems to be around the 22% level.
One similar effect of the burst emission on the system would be the cooling of the corona via Compton scattering of soft burst photons with energetic electrons (see, e.g., Maccarone & Coppi 2003; Degenaar et al. 2018; Sánchez-Fernández et al. 2020; Speicher et al. 2020). Such Compton cooling can be observed by detecting a decline in the hard X-ray lightcurve of the source once a burst starts. Evidence for such Compton cooling of the corona has been presented in Maccarone & Coppi (2003), Chen et al. (2010), Kajava et al. (2017b), Chen et al. (2012, 2013), Ji et al. (2014a, 2014b), and Chen et al. (2018). By stacking the NuSTAR data with very similar profiles from seven bursts, we here show further evidence that indeed the hard X-ray count rates show a decline as the burst starts, and, furthermore, that it shows a negative correlation with the softer energy photons. We note, however, that the hard X-ray count rates are very low, and therefore the results are not definitive.
In all our analysis, we tried to fit the X-ray spectra with either the fa method or the reflection models. However, in a realistic scenario, the effect of an X-ray burst on its environment is expected to cause both a detectable reflection component and an increased accretion rate. Using burst 6, as our brightest burst, and burst 27, which is the brightest burst observed simultaneously by NICER and AstroSat, we tried to fit the X-ray spectra by taking into account both the reflection and a change in the persistent emission of the source (the fa method). However, we see that the soft excess emission can easily be modeled by scaling the persistent emission, leaving no space statistically for an additional reflection model. Once a spectrum is fitted with the fa model, adding a further reflection model does not improve the fit. Furthermore, even if we force the existence of a reflection component, the flux of this component decreases by approximately two orders of magnitude lower compared to only fitting with the reflection component, and becomes almost completely unconstrained. These results suggest that broadband coverage and an even larger effective area will be required to be able to detect the signatures of both processes at the same time in time-resolved spectra of bursts, which will either require further simultaneous observations of notably brighter bursts, with NICER and AstroSat, or larger–effective area broadband observatories, like STROBE-X (Ray et al. 2019) and eXTP (Zhang et al. 2019).
We thank the referee for their very valuable and constructive comments. T.G. has been supported in part by the Scientific and Technological Research Council (TÜBİTAK), 119F082, and the Turkish Republic, Presidency of Strategy and Budget, project 2016K121370. This work was supported by NASA through the NICER mission and the Astrophysics Explorers Program. P.B. acknowledges support from the CRESST II cooperative agreement (80GSFC21M0002). R.M.L. acknowledges the support of NASA through Hubble Fellowship Program grant HST-HF2-51440.001. S.G. acknowledges the support of the CNES. This research has made use of software provided by the High Energy Astrophysics Science Archive Research Center (HEASARC), which is a service of the Astrophysics Science Division at NASA/GSFC and the High Energy Astrophysics Division of the Smithsonian Astrophysical Observatory. This paper includes data publicly available from the AstroSat mission of the Indian Space Research Organisation (ISRO), archived at the Indian Space Science Data Centre (ISSDC). M.C. acknowledges support from ISRO under the AstroSat archival data utilization program (DS 2B-13013(2)/4/2020-Sec.2).
Facility: NICER, AstroSat, NuSTAR - .
Software: HEASoft, XSPEC, Sherpa, CIAO, Astropy.
Appendix A: Short-recurrence Bursts
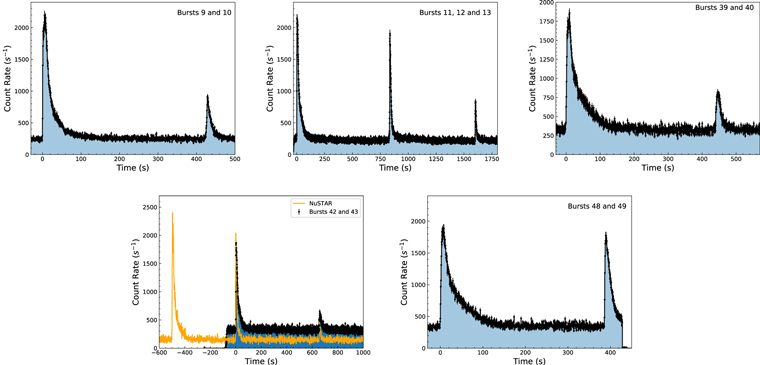
In Figure A1, we show lightcurves of short-recurrence events detected with NICER. Bursts 9 and 10 are only separated by 425 s. Bursts 11, 12, and 13 form a triple-burst event, where the separations are only 831 and 768 s between bursts 12 and 11 and bursts 13 and 12, respectively. These three bursts are separated by roughly a day from bursts 9 and 10, which is another short-recurrence event. Bursts 39 and 40 are only separated by 440 s. Bursts 42 and 43, which occur almost half a day after burst 41, are only separated by 657 s. Note that this double-burst event is actually a triple burst. Thanks to a simultaneous NuSTAR observation, we are able to identify the primary burst of this event occurring roughly 450 s before burst 42 in the NICER sample, which was also shown by Zhao et al. (2022). Finally, bursts 48 and 49 show a very short recurrence time, with a separation of only 385 s. These bursts are also worth noting because the peak count rate of the secondary burst is very comparable to the primary burst. Overall, our sample includes two triple-burst events, one of which has already been reported by Roy et al. (2022), and three double bursts. Such short-recurrence bursts from 4U 1636–536 have already been observed in various forms (Ohashi et al. 1982; Pedersen et al. 1982; Keek et al. 2010; Beri et al. 2019; Roy et al. 2022).
Figure A1. Lightcurves of bursts that show short recurrence. The lower right panel also shows the overlapping NuSTAR observation, where the triple nature of the bursts can be seen. For clarity, 5–30 keV NuSTAR count rates are multiplied by a factor of 5.
Download figure:
Standard image High-resolution imageFootnotes
- 16
- 17
- 18
- 19
- 20


