


Abstract
The helium-tagging technique was employed to record absorption spectra of cold anthracene cations and protonated anthracene. The evaluation of the spectra of the chromophore with a different number of attached He atoms allows getting the precise band positions of the molecular ions in the gas phase. The positions of the two most intense bands of anthracene, suitable for astrophysical detection, were found to be λmax = 3478.9 ± 1.8 Å and λmax = 7068.9 ± 5.7 Å. A considerable shift of the red band position compared to a previous measurement was attributed to a temperature effect. No coincidence of the absorption bands in astrophysical observational spectra was found. This allows estimating the upper limit for the abundance of anthracene cations per H nuclei <10−9 along the HD 183143 line of sight. We discuss possible reasons for such a low abundance of this molecular ion.
Export citation and abstract BibTeX RIS
1. Introduction
Diffuse interstellar bands (DIBs) are absorption features of dense parts of the interstellar medium (ISM) usually observed in the visible and near-infrared ranges against reddened early type stars. They were discovered almost 100 years ago (Heger 1922). For an extended period of time, their origin remained a mystery to astronomers, as none of the carriers of these bands were identified. The bandwidth and the profile of DIBs supported a molecular origin of carriers (Galazutdinov et al. 2002). The intensities of DIBs are clearly correlated with the amount of dust present in the ISM; however, a lack of polarization in the observed DIBs pointed at a gas-phase location of the carriers (Adamson & Whittet 1995; Cox et al. 2011). These observations led to the popular point of view that DIB carriers are carbon-bearing molecules or ions present in the gas phase. Recently, the C60 cation was found to be a carrier of two intense DIBs (Campbell et al. 2015) and lately three other DIBs coinciding with the absorption of C60 + were found in observations (Walker et al. 2015; Campbell et al. 2016a, 2016b).
Polycyclic aromatic hydrocarbons (PAHs) being photostable (Jochims et al. 1994; Salama et al. 1996; Jochims et al. 1999) and abundant in the ISM, (Flagey et al. 2006; Tielens 2008) are considered as very promising candidates for DIB carriers. A large number of spectral studies of PAHs were performed in an attempt to identify the DIBs carriers (Rouillé et al. 2004, 2007; Staicu et al. 2004; Sukhorukov et al. 2004; Krasnokutski et al. 2005; Jäger et al. 2006; Staicu et al. 2006; Salama et al. 2011). Until now, no coincidence between absorption features of PAHs and DIBs has been found; however, most of the studies were performed with neutral PAHs. To date, the only identified DIB carrier is the C60 cation, and no absorption from the neutral C60 molecule was detected in astronomical observations. Therefore, cations seem to be the most promising candidates for the DIB carriers.
The usual trend is that the abundance of the molecules in the ISM decreases exponentially with the number of atoms per molecule (Ohishi et al. 1992). This is in line with a bottom up formation of molecules. For the bottom up formation of PAHs, benzene is expected to be more abundant than any PAH. However, the photostability of molecules in space also plays a huge role. Small molecules do not survive long enough after absorption of a UV photon to emit the absorbed energy. With increasing size, the molecules can store more energy in vibrations and consequently have higher chances to survive after UV photon absorption. Therefore, a large jump in the abundances of the molecules is expected once the molecule reaches the size of photostability. A good example here is the fullerene, being larger than any known molecule present in space, it holds ∼10−4 of all elemental carbon (Berné & Tielens 2012).
Photostability studies (Jochims et al. 1994, 1999) predict that in general only relatively large (>50 C atoms) PAH molecules can survive in the ISM. However, in their later study (Jochims et al. 1999) the authors demonstrated the importance of the structure of the PAHs for their stability. In this study, the anthracene (An) structure was found to be very favorable for its stability. Although it is composed from only 14 C atoms, it was predicted to survive in the H I regions of the ISM. Therefore, if the PAHs are formed by a bottom-up chemistry, An can reach a notable abundance, which makes An and its ions promising candidates for being carriers of DIBs.
For unambiguous assignment of any molecule as a DIB carrier, its high-resolution electronic spectra at low temperatures and without matrix shift have to be measured and compared with observational spectra. In this respect, spectra of An cations and protonated An were measured by the matrix isolation technique (Szczepanski et al. 1993; Garkusha et al. 2011). Although the matrix isolation technique is very useful for providing approximate positions of absorption bands as well as absolute intensities of these bands, it cannot be used for the direct comparison with observational data due to a considerable shift in the spectral band positions. The spectra of An+ in a jet were measured by cavity ring-down spectroscopy (CRDS) in the range of the D2 ← D0 transition (7200–6950 Å). The most intense D2(0) ← D0(0) absorption band was located at 7087.6 ± 1.3 Å, which coincides with the position of a weak DIB. However, the measured width was found to be too broad to match the observed DIB. It should be noted that the width of this band strongly depends on the temperature of the cations and the efficiency of the cooling of An+ formed by the electric discharge remained unknown in these experiments. Therefore, a much higher bandwidth of An+ observed in the experiments could potentially be due to inefficient cooling of An+. Moreover, a new broad DIB at 7088.8 ± 2.0 Å coincident to within the measurement uncertainties with the band of the An+ was later detected in the line of sight Cernis 52 (Iglesias-Groth et al. 2010). The electronic spectrum of An+ was also recorded using a He-tagging technique (Roithová et al. 2019). However, it was only recorded with low resolution for weak bands of An+. Therefore, it is not suitable for the comparison with astrophysical observations.
We measured the An+ spectra in a broad wavelength range using He-tagging spectroscopy. This method ensures a low temperature of the investigated cations as well as the determination of the precise positions of absorption bands. Tagging or messenger spectroscopy was originally developed in the group of Lee (Okumura et al. 1985) and, for the case of He messenger, was later demonstrated to be capable of providing results that can be directly compared with astrophysical observations (Campbell et al. 2015; Kuhn et al. 2016; Spieler et al. 2017). As hydrogen is the most abundant element in the universe, it was also suggested that hydrogenated PAH molecules can be quite abundant in the ISM. They were suggested to be carriers of IR emission bands (Bernstein et al. 1996) and catalysts for the molecular hydrogen formation and different hydrogenation reactions (Andrews et al. 2016; Ferullo et al. 2019). The matrix isolation spectroscopy of protonated An revealed a large number of absorption bands in the 400–550 nm range (Garkusha et al. 2011). AnH or AnH+ could potentially be DIB carriers if protonated PAHs represent a considerable fraction of all PAHs in the ISM.
2. Experimental Methods
Superfluid helium nanodroplets (HNDs) with a temperature of 0.37 K are formed in a supersonic expansion of pressurized He gas (2.9–3.1 MPa, 99.9999% purity) through a precooled nozzle (8.3–8.8 K, 5 μm orifice diameter). These parameters result in HNDs with a mean droplet size of a few million He atoms (Gomez et al. 2011). After passing through a skimmer (0.8 mm diameter) the HNDs are ionized by electron impact (electron energy 65 eV) leading to the formation of multiply charged droplets. The average charge state is estimated to be around +10e (Laimer et al. 2019). The highly charged droplet beam crosses a pick up (PU) chamber where the droplets are doped with An. For the formation of AnH+, this is preceded by adding molecular hydrogen to the ionization chamber. The An powder (Sigma-Aldrich, 99% purity) is sublimated in a heated reservoir connected via a heated line to the PU chamber. Hydrogen gas (Messer, 99.999% purity) is introduced into the ion source chamber from a cylinder passing through a pressure controller (Bronkhorst EL-PRESS). After pickup into a highly charged droplet, the first dopant approaching a charge center gets ionized via charge transfer. The large difference of the ionization energies of the Hen + charge centers and the dopants make this process very exothermic, which can lead to fragmentation of the ionized dopant species. In the case of hydrogen predoping, the reaction of H2 + with additional H2 leads to the formation of H3 +(H2)n clusters. Proton transfer from these cluster ions to An is an exothermic reaction and happens with unity probability. However, unlike in the case of charge transfer from Hen +, the helium matrix completely dissipates the small excess energy and prevents fragmentation of AnH+ (Tiefenthaler et al. 2020). Pickup of multiple dopants leads to the growth of multiple, singly-charged dopant clusters, as the charges in helium droplets are separated and serve as nucleation centers for the growth of dopant clusters. In order to extract the dopant cluster ions from the large helium droplets we collide them with a polished stainless steel surface at normal incidence angle. Most of the charge centers are kicked backwards by reflecting helium or shock fronts. Most ions remain solvated by a small number of helium atoms or H2 molecules, typically small enough to be accessible by mass spectrometry. Weak electrostatic fields are utilized to extract these ions from the collision region and guide them into a time-of-flight mass spectrometer (Tofwerk AG model HTOF), which is mounted orthogonally with respect to the HND beam direction. Mass spectra were obtained with a resolution of approximately 1300 m/Δm (an excerpt is shown in Figures A1 and A2). A tunable pulsed laser (EKSPLA NT242, up to 450 μJ pulse energy, laser bandwidth <3.5 cm−1) is utilized to perform action spectroscopy upon electronic excitation of helium-tagged An+ and H2-tagged AnH+. The laser calibration was performed by a wavelength meter (SHR High-Resolution Wide-Range Wavelength Meter). The mass spectrometer operates at a frequency of 10 kHz, while the laser has a repetition rate of 1 kHz. The synchronization of the laser pulse with every tenth extraction pulse of the TOF allows for a direct comparison of mass spectra with and without laser illumination. Absorption of a photon leads to the evaporation of the weakly bound He or H2 messengers. This can be monitored as a depletion of the corresponding Hen An+ and (H2)n AnH+ ion signals and a concomitant increase of the photoproduct An+ and AnH+ ion signals, respectively. Absorption spectra were recorded in several separate laser scans from 300 to 800 nm where the excitation wavelength was scanned in steps of 0.1, 0.2 or 0.3 nm. All shown absorption spectra have been corrected for differences in photon densities at different laser wavelengths, assuming a direct correlation between laser power and the change in ion signal.
The observational spectra are downloaded from the ESO Science Archive Facility (data files HD 183143 ADP.2020-09-14T20_36_53.612; HD 172028 ADP.2020-09-14T20_33_27.248; HD 183143 2020-06-09T11_08_36.121; HD172028 2018-11-22T14_15_19.851). The obtained spectra were shifted to heliocentric wavelengths by matching positions of narrow absorption bands of interstellar CH and CN molecules with literature values.
Molecular geometries and vibrational frequencies of An+ in the ground and exited states were obtained with DFT and time dependent DFT methods, respectively. We used the B3LYP hybrid functional and the 6-311 + G (d, p) basis set implemented in the Gaussian16 package. To simulate the absorption spectrum, multidimensional FC factors were calculated using Gaussian16. Spectral broadening was simulated by giving each line a Gaussian line shape with a linewidth of 10 cm−1. Boltzmann distributions were used to simulate spectra at specific temperatures.
3. Results and Discussion
3.1. Spectroscopy of An+ and AnH+
Figure 1 displays the spectra of An+ and AnH+ measured from 300 nm up to the infrared range. The upper frame shows the spectrum recorded by monitoring the ion signal increase on the mass of the photoproducts An+ and AnH+, while the lower frame shows the depletion of the sum of ion signals recorded on the masses of several Hen An+ and (H2)n AnH+ complexes summed up. The spectra from the upper frame have a much better signal-to-noise ratio. Unfortunately, they are also characterized by a wider bandwidth and cannot be used for the direct comparison with astronomical observations as the increase in ion signal on the mass of parent molecule occurs due to dissociation of many different complexes. Therefore, they are well suited for fast measurements in the broad wavelength range and are used to get an overall understanding of molecular spectra. When we need to obtain the exact values of the absorption band positions of the species in the gas phase for comparison with astronomical observations, it is necessary to use the depletion spectra, which are mass selective.
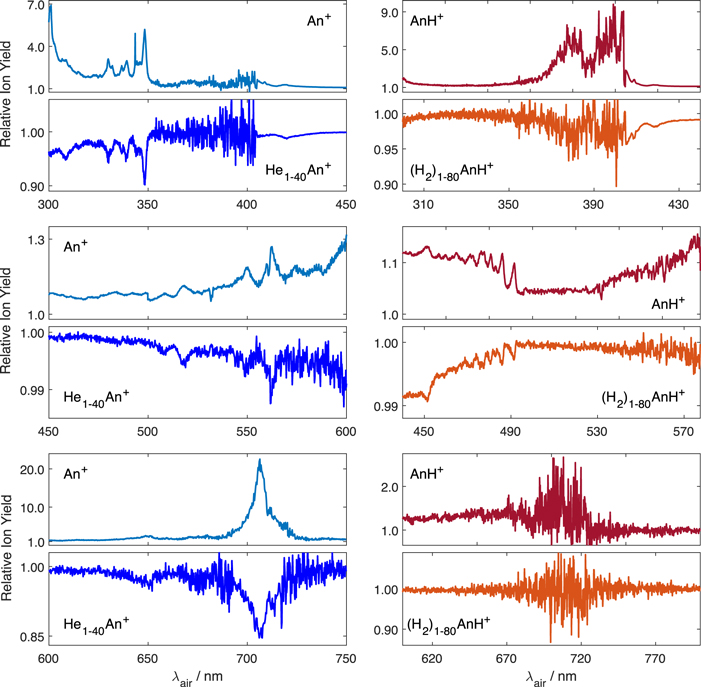
Figure 1. Absorption spectra of An+ and AnH+ recorded by monitoring the increase in ion signal on the mass of bare An+/AnH+ and the decrease in the sum of ion signals recorded on the masses of Hen An+ and (H2)n AnH+ complexes.
Download figure:
Standard image High-resolution imageOur spectrum recorded via monitoring the An+ ion signal is overall similar to the spectrum of An+ isolated in an Ar matrix (Szczepanski et al. 1993). The main difference is a much smaller spectral shift caused by the weaker interaction of An+ with the He atoms compared to the interaction with the Ar matrix. As can be seen, An+ has two intense and relatively narrow absorption bands, best suited for detection in the observational spectra. These are the red D2(0) ← D0(0) absorption band near 708 nm and the UV D6(0) ← D0(0) absorption band near 348 nm. We can confirm that the two bands observed in the matrix measurements at 482.6 and 456.4 nm indeed do not belong to An+, as we did not observe any absorption at these wavelengths. The D5(0) ← D0(0) absorption band near 420 nm is relatively weak compared to the two transitions near 348 and 708 nm and therefore is not very suitable for the astronomical detection. It should be noted that the absolute band intensities were not derived in our measurements. Therefore, to obtain the absolute band intensities, we rely on matrix isolation data. The matrix isolation data shows that the extinction on the maximum of the 352.1 nm peak is about six times higher compared to that on the 722.4 nm peak (17.11/2.9 M−1 cm−1). However, the bandwidth of the red band is about 5 times higher compared to the UV band (460/90 cm−1). Therefore, the oscillator strengths associated with both bands do not differ much. Our measurements show that the red band is actually narrower in the energy units compared to the UV band. This makes these two bands approximately equally well suited for detecting them in observational spectra.
To compare our laboratory measurements with the observational astrophysical spectra the parameters of absorption bands such as peak positions and bandwidths of bare An+ have to be obtained. We recorded the depletion spectra of Hen An+ with n = 1–50 with a longer integration time around the position of the most intense bands. The upper panels of Figure 2 show few such spectra measured for the two most intense absorption bands. The fitting of such spectra with Gaussian function allows obtaining the parameters of absorption bands as a function of the number of attached helium atoms. The bottom panels of Figure 2 show linear fits of the shift of these absorption band positions as a function of the number of attached helium atoms n. The extrapolation of these fits gives the positions of the absorption bands for n = 0. As it can be seen, for small n, the positions of the absorption bands change linearly with the number of attached helium atoms. This allows to obtain the band position (λmax) and the same procedure was used to evaluate the FWHM of the absorption bands. A sharp change in the value of the shift going to small n has been detected for neutral An (Even et al. 2001). In our measurements we observed a notable change in the dependence for both bands after adding the seventh He atom. However, for the UV band, the fit over small n gives the same values as the fit over n = 1–40. For the red band however, a more pronounced change in the dependence is observed. Therefore, we used the values obtained only for the fit over n = 1–6. Due to much lower signal to noise level, the accuracy of the determination of the peak parameters is much lower for this band. We obtained λmax = 3478.9 ± 1.8 Å, FWHM = 28.5(229 cm−1) ± 5.2 Å and λmax = 7068.9 ± 5.7 Å, FWHM = 81.6(164 cm−1) ± 6.7 Å.
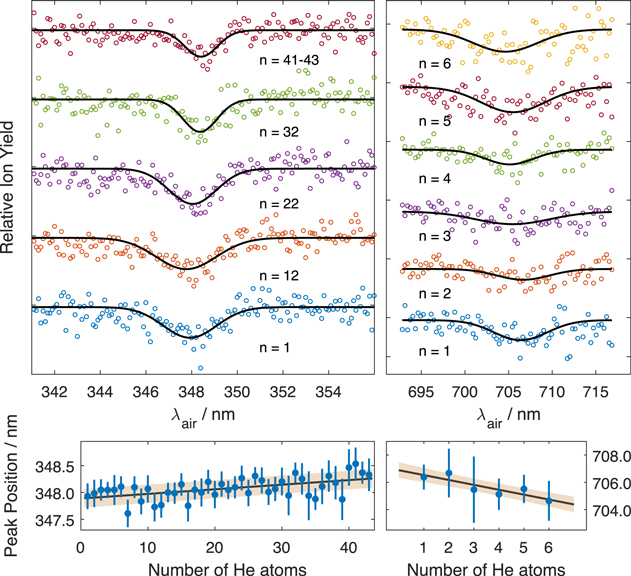
Figure 2. Ion signal depletion as a function of the excitation laser wavelength recorded on the masses of Hen An+ (upper panels). The positions of the two most intense bands of An+ in the recorded spectra as a function of the number of attached helium atoms (bottom panels).
Download figure:
Standard image High-resolution imageUnfortunately, we were unable to perform the same procedure for finding the positions of the strongest bands of the AnH+ due to a much lower S/N for these species. It is explained by a lower intensity of each individual band, because AnH+ has several isomers, which differ in the position of the added proton (Garkusha et al. 2011). Therefore, the total intensity is expected to be shared between several bands. Moreover, the bands of AnH+ are much broader compared to the bands of An+. We found a FWHM of 135.5 and 256.7 Å for the 3768.1 and 4034.9 Å bands, respectively. All these also relate to the possible presence of the hydrogenated An+ in the ISM and likely hamper its optical detection. The weaker optical bands of AnH+ lie in the range of the highest sensitivity of our system. Therefore, we were able to derive the parameters of the most intense optical band, which are λmax = 4903.9 ± 1.7 Å and FWHM = 22.4 ± 2.2 Å. However, the optical bands are about an order of magnitude weaker compared to the UV bands and therefore not very well suited for the observational detection.
As can be seen, the measured λmax of the An+ D2(0) ← D0(0) (7068.9 Å) absorption band differs by ∼19 Å compared to the value of 7087.6 Å obtained by CRDS (Sukhorukov et al. 2004). The shift could be attributed to a different temperature of the An+ produced in the experiments. The shift of the band position to higher energies with reducing the temperature of the species can also be seen in Figure 2 of Sukhorukov et al. (2004). To better understand the nature of this temperature effect, we performed simulations of the spectra of An+ for the transition to the second excited electronic state. The D2(0) ← D0(0) band was calculated to lie at 6795 Å. For a better comparison with the experimental spectrum, the position of the band was shifted to the experimentally derived value of 7068.9 Å. The simulated spectrum in the range of this 0–0 transition is shown in Figure 3. As can be seen in the figure, the increase in the temperature of An+ indeed leads to the appearance of the redshifted peak. The shift is caused by a considerable change in the vibrational frequencies between ground and excited states of An+. An has many low frequency vibrations that can be populated at relatively low temperatures. Therefore, at T = 300 K the population of the ground electronic state is low and the main contribution to the band at the position of the 0–0 transition is caused by the transitions between the same vibrational states. For example, a large contribution to the shoulder appearing on the red side of the main band as seen in Figure 3, is produced by  and
and  transitions (numbering starts from the lowest frequency). The calculated shift is about 19 Å, which is completely consistent with the difference in peak positions found in the CRDS and our experiments (∼19 Å). The intensity of this redshifted shoulder is predicted to be smaller compared with the intensity of the main band. This can be understood considering the well-known problem of quantum chemistry in optimizing the geometry of the excited states and evaluation of the values of low-frequency vibrations (note the large error of 263 Å for the calculation of the D2(0) ← D0(0) band position). Therefore, such computations could be used to get a qualitative understanding, but not precise quantitative values. In this understanding, the match between computation and experiment is rather good. With a further temperature increase from 300 to 500 K, we no longer observe the shift of the band position. Instead, the simulation only shows an enhancement of the lower-energy shoulder. As the vibrational temperature of An+ in previous CRDS measurements is unknown, and could be quite high (Staicu et al. 2004; Sukhorukov et al. 2004), it becomes difficult to give the exact temperature dependence of the band parameters. We can clearly define that for cold media (T < 50 K), the peak maximum should be at 7068.9 Å. The temperature increase should cause band broadening mainly due to the enhancement of the lower-energy shoulder. The exact temperature at which the 7087.6 Å peak becomes dominant cannot be evaluated exactly as the computations likely underestimate its intensity.
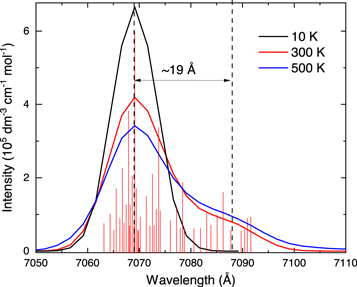
Figure 3. The calculated vibronic spectra of An+ in the range of D2(0) ← D0(0) transition. The simulated temperatures of the An+ are given in the figure. The vertical lines show the individual transitions of the hot molecule. Their intensities are enhanced for better visualization.
Download figure:
Standard image High-resolution imageThis is important for comparing laboratory spectra with astrophysical observations, as the peak position may change depending on the physical conditions along the specific line of sights. For example, a broad 7088.8 ± 2.0 Å DIB is detected in the line of sight of star Cernis 52 (BD+31640), nicely matching with the absorption band of An+ measured by CRDS (Iglesias-Groth et al. 2010) but not with the peak maximum found in the current study. However, if An+ is present not in interstellar but in a hotter circumstellar environment, its temperature could be more similar to the temperature achieved during the CRDS measurements. This can also apply for other PAHs as these molecules have many low-frequency modes associated with out-of-plane bending vibrations, which could be active at relatively low temperatures. Therefore, band profiles or even band positions could considerably vary between different objects depending on the physical conditions.
3.2. Comparison with the Observational Spectra
To test the presence of An+ in the ISM, we checked the observational spectra in the range of the two most intense absorption bands of An+ found in our measurements. For the comparison, we selected the lines of sight toward HD 183143 and HD 172028. The first line of sight is characterized by the presence of a relatively dense (AV = 3.9 mag) interstellar cloud along that light path. The intensities of DIBs were found to correlate with the cloud density and were found to be particularly strong in this direction. Moreover, a number of new DIBs were also found in the observational spectra (Hobbs et al. 2009). However, the spectrum in this line of sight does not show the absorption features from C2 molecules, whose abundances were found to correlate with the intensities of few DIBs, which were referred to as the C2 DIBs. Thus, we also selected HD 172028 as the second line of sight. Although it has a less dense cloud (AV = 2.3 mag), it is characterized by strong absorption bands of C2 molecules (Gredel 1999). Figure 4 shows the comparison of the observational and experimental spectra in the UV and optical ranges. As can be seen in the image, there are no absorption bands in the observational spectra along either line of sight matching the measured laboratory spectrum of cold An+. In the UV range, the peak maximum of the An+ absorption coincides with the broad emission maximum. The broad absorption features can be seen on both sides from the position of An+ absorption along the HD 183143 line of sight, while the spectrum along the HD 172028 line of sight shows a much smaller number of absorption bands. The red part of the observational spectrum along this line of sight has been previously explored by Hobbs et al. (2009) for the identification of DIBs. All DIBs found in this study are marked with an asterisk in the figure. They are much narrower compared to the absorption bands of An+.
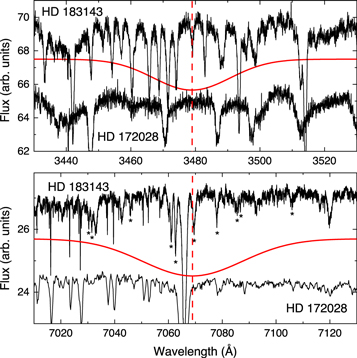
Figure 4. The comparison between observational spectra along two different lines of sight and the profiles of the two most intense bands of An+ measured in the laboratory. The asterisks mark the known DIBs. The vertical dashed line shows the central position of the laboratory absorption bands of An+.
Download figure:
Standard image High-resolution image3.3. Astrophysical Implications
As no absorption of An+ has been detected in observational spectra, we can only give an upper limit of the An+ column density. The upper limit of the equivalent bandwidth of the band that will escape the detection is given by the equation  , where Δλ is the spectral width of a resolution element, M is the number of resolution elements over which the sought absorption band spreads, and S/N is the signal-to-noise ratio near the expected absorption feature (Gredel et al. 2011). Using the derived values of equivalent bandwidth and the oscillator strength from matrix isolation data f = 0.045, we can get the upper limit for the column density of An+ along the observed lines of sight. The optical range provides a slightly better sensitivity for the detection of An+ with values of 3.5 × 10¹² and 1.0 × 1012 cm−2 for HD 172028 and HD 183143, respectively. The detection based on the UV band provides a factor two lower sensitivity with the values of 3.2 × 10¹² and 2.2 × 1012 cm−2 for the same lines of sight. However, it should be noted that there are several narrow absorption bands in the observational spectra at the position of an expected absorption of An+. Therefore, the real upper limits for column densities could be slightly larger than the derived values. It would be reasonable to assume values at least twice as high. Therefore, based on the observational spectra along HD 183143, we define
  = 2.0 × 1012 cm−2.
The obtained values are very similar to the value of 2.8 × 1012 cm−2 found for the upper limit of column densities of neutral An molecules along the HD 183143 line of sight (Gredel et al. 2011). This also means similar limits for the fractional abundance of An+, i.e., N(An+)/N(H) <10−9. The estimation of the intensity of the IR emission bands assigned to PAHs led to the estimation that a few percent of the available interstellar carbon is locked in small PAHs with a minimum abundance of PAHs per H nuclei of about 3 × 10⁻⁸ (Allamandola et al. 1989). As An was found to be one of the smallest PAHs stable against UV irradiation in the neutral ISM and it has a thermodynamically favorable structure, it is expected to have a larger abundance in the ISM compared to other PAHs in the case of the bottom up formation. Therefore, the low upper limits for amounts of An and An+ in translucent molecular clouds can point toward the top-down formation route of the PAHs. Alternative explanations for a low amount of An in space could be its chemical instability. Translucent molecular clouds are characterized by the highest number density of neutral C atoms compared to other astrophysical environments. Small PAHs react barrierlessly with atomic carbon, and therefore should be efficiently destroyed by such reactions in a broad temperature range (Kaiser et al. 1999; Krasnokutski & Huisken 2014; Krasnokutski et al. 2017). The lifetime of small PAHs in most common astrophysical environments was found to be in the order of only a few years (Krasnokutski et al. 2017). The reaction with C atoms would lead to a large diversity of the PAH molecular structures, leading to a very low abundance of each specific PAH. The C atoms also react barrierlessly with fullerenes, which were found in abundance (Krasnokutski et al. 2016). However, in these reactions the fullerene cage remains intact with C atoms bound on top. Therefore, the products of such reactions can be dissociated by UV photons with the release of fullerenes. To test this, it would also be interesting to define the upper limits for the fractional abundance of phenanthrene cations. These were also found to be stable against UV radiation and have an even more thermodynamically favorable structure compared to An.
4. Conclusion
We used the helium-tagging technique to record the spectra of cold An+ and AnH+. A considerable shift (∼19 Å) of the position of the absorption band of An+ was found compared to previous CRDS measurements. This shift is assigned to a much lower temperature of An+ in the current study. The newly derived band position does not match with a broad DIB, which was previously suggested to be caused by An+. However, as the temperatures in this region are not exactly known, it would be interesting to perform an observation along the line of sight of star Cernis 52 in the UV range as well, to confirm or disprove the An+ detection based on the observation of the strong 3478.9 Å band derived from our measurements. The laboratory spectra were compared with astrophysical observations. No coincidence of the absorption bands was found, which allows us to evaluate the upper limit of the fractional abundance of An+ in the ISM. The obtained value is considerably smaller compared to the fractional abundance of PAH molecules predicted based on the intensity of IR emission bands associated with PAHs. Possible explanations of this discrepancy are the top-down formation of PAHs or the chemical instability of PAHs due to the reaction with H or C atoms leading to a large diversity of the formed PAHs.
The work of M.M., P.M., and A.S. was supported by the FWF, projects I4130 and P31149. S.K. is grateful for the support by the Max Plank Institute for Astronomy and by the Deutsche Forschungsgemeinschaft DFG (grant No. KR 3995/4-1).
Appendix
Figures A1 and A2 show two excerpts of the mass spectra recorded during recording (H2)n AnH+ spectra. While the resolution is insufficient to definitely exclude the presence of a small amount of Hen An+ in the mass spectra recorded with H2 predoping, we find no evidence for it either. In Figure A2, the positions of Hem An+ are marked with green dashed lines. We can note that:
- (1)While the first two potential Hem An+ peaks are clearly unresolved from (H2)n An+, the next two peaks (m = 3, 4) are clearly shifted toward higher masses compared to the position of Hem An+, indicating these peaks are rather caused by (H2)n An+. It should be noted that beyond m = 5, the emergence of (H2)n (H2O)An+ starting at m/z = 196 further overlaps with the position of Hem An+ and complicates the analysis.
- (2)One would expect to see some form of odd–even oscillation in the (H2)n An+ series if Hem An+ was present in the H2 predoping mass spectrum, since only every second (H2)n An+ peak overlaps with a potential Hem An+ ion. This is clearly not the case in our mass spectrum. Even if a small amount of Hem An+ was present, the contribution to (H2)n AnH+ due to the 13C-isotope would be very small and is unlikely to cause any absorptions in the recorded (H2)n AnH+ spectra.
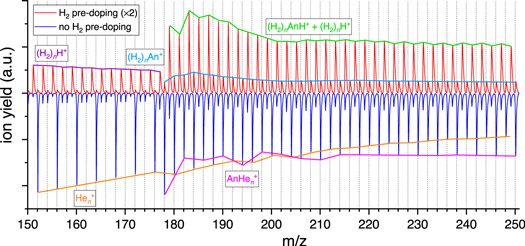
Figure A1. Excerpt of the mass spectra with and without H2 predoping. The dominant ion series are protonated, H2-tagged An and He-tagged An+, respectively, with minor contributions of H2-tagged An+ in the case of H2 predoping. The distribution of (H2)n An+ is very smooth, making it unlikely that He-tagged An+ is present in this mass spectrum. The isotopic contribution (∼15%) to the intensity of the (H2)n AnH+ series would be tiny.
Download figure:
Standard image High-resolution image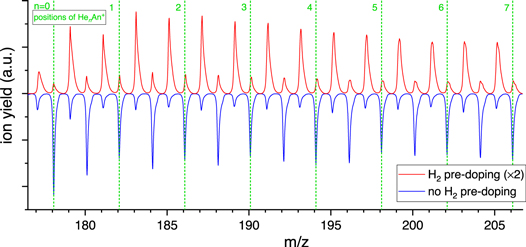
Figure A2. Detailed excerpt of the mass spectra presented in Figure 4. The position of the Hen An+ from n = 0–7 is marked with green dashed lines. While the limited resolution of this mass spectrum prevents the separation of peaks, one can note a shift of the peaks attributed to (H2)n An+ relative to the positions of Hen An+ due to the large mass defect of H. Starting around m/z 196, a second unresolved ion series emerges due to residual H2O. Note there are no pronounced odd–even oscillations in the (H2)n An+ series.
Download figure:
Standard image High-resolution image