


Abstract
We use the physically consistent tilted spatially flat and untilted non-flat ΛCDM inflation models to constrain cosmological parameter values with the Planck 2015 cosmic microwave background (CMB) anisotropy data and recent SNe Ia measurements, baryonic acoustic oscillations (BAO) data, growth rate observations, and Hubble parameter measurements. The most dramatic consequence of including the four non-CMB data sets is the significant strengthening of the evidence for non-flatness in the non-flat ΛCDM model, from 1.8σ for the CMB data alone to 5.1σ for the full data combination. The BAO data is the most powerful of the non-CMB data sets in more tightly constraining model-parameter values and in favoring a spatially closed universe in which spatial curvature contributes about a percent to the current cosmological energy budget. The untilted non-flat ΛCDM model better fits the large-angle CMB temperature anisotropy angular spectrum and is more consistent with the Dark Energy Survey constraints on the current value of the rms amplitude of mass fluctuations (σ8) as a function of the current value of the nonrelativistic matter-density parameter (Ωm) but does not provide as good a fit to the smaller-angle CMB temperature anisotropy data, as does the tilted flat-ΛCDM model. Some measured cosmological parameter values differ significantly between the two models, including the reionization optical depth and the baryonic matter density parameter, both of whose 2σ ranges (in the two models) are disjointed or almost so.
Export citation and abstract BibTeX RIS
1. Introduction
In the standard spatially flat ΛCDM cosmogony (Peebles 1984), the cosmological constant Λ dominates the current energy budget, and cold dark matter (CDM) and baryonic matter are currently the second and third biggest contributors to the cosmological energy budget, followed by small contributions from neutrinos and photons. For reviews of this model, see Ratra & Vogeley (2008), Martin (2012), and Huterer & Shafer (2018). Many different observations are largely consistent with the standard picture, including cosmic microwave background (CMB) anisotropies data (Planck Collaboration et al. 2016), baryonic acoustic oscillations (BAO) distance measurements (Alam et al. 2017), Hubble parameter observations (Farooq et al. 2017), and Type Ia supernova (SN Ia) apparent magnitude data (Betoule et al. 2014). However, there still is room for mild dark-energy dynamics or a bit of spatial curvature, among other possibilities.
The standard model is characterized by six cosmological parameters that are conventionally taken to be: Ωbh2 and Ωch2, the current values of the baryonic and cold dark matter density parameters multiplied by the square of the Hubble constant H0 (in units of 100 km s−1 Mpc−1); θMC, the angular diameter distance as a multiple of the sound horizon at recombination; τ, the reionization optical depth; and As and ns, the amplitude and spectral index of the (assumed) power-law primordial scalar energy density inhomogeneity power spectrum (Planck Collaboration et al. 2016). The standard model assumes a flat spatial geometry (Planck Collaboration et al. 2016).
However, using a physically consistent non-flat inflation model power spectrum of energy density inhomogeneities (Ratra & Peebles 1995; Ratra 2017), Ooba et al. (2018a) recently found that Planck 2015 CMB anisotropy measurements (Planck Collaboration et al. 2016) do not require flat spatial geometry in the six-parameter non-flat ΛCDM model. In the non-flat ΛCDM model, compared to the flat-ΛCDM model, there is no simple tilt option, so ns is no longer a free parameter and is replaced by the current value of the spatial curvature density parameter Ωk.3
In non-flat models non-zero spatial curvature sets the second, new length scale. This is in addition to the Hubble length scale. Inflation provides the only known way to define a physically consistent non-flat model power spectrum. For open spatial geometry the open-bubble inflation model of Gott (1982) is used to compute the non-power-law power spectrum (Ratra & Peebles 1994, 1995).4 For closed spatial geometry, Hawking's prescription for the quantum state of the universe (Hawking 1984; Ratra 1985) can be used to construct a closed inflation model that can be used to compute the non-power-law power spectrum of energy density inhomogeneities (Ratra 2017). Both these open and closed inflation models are slow-roll inflation models (Gott 1982; Hawking 1984; Ratra 1985) so the resulting energy density inhomogeneity power spectra are untilted (Ratra & Peebles 1995; Ratra 2017).
Non-CMB observations, even combinations thereof to date, do not rule out non-flat dark-energy models (see, e.g., Farooq et al. 2015; Cai et al. 2016; Chen et al. 2016; Li et al. 2016; Yu & Wang 2016; Farooq et al. 2017; L'Huillier & Shafieloo 2017; Rana et al. 2017; Wei & Wu 2017; Mitra et al. 2018, 2019; Park & Ratra 2019a; Ryan et al. 2018, 2019; Yu et al. 2018). The most restrictive constraints on spatial curvature come from CMB anisotropy measurements, but, as shown by Ooba et al. (2018a), when the correct non-power-law power spectrum for energy density inhomogeneities is used for the CMB anisotropy analyses, a spatial curvature density parameter contribution of magnitude a percent or two is still allowed, with the CMB anisotropy data (Planck Collaboration et al. 2016) favoring a mildly closed model. Ooba et al. (2018a) also added a few BAO distance measurements to the mix and found that a mildly closed model was still favored. Moreover, the mildly closed model better fits the observed low-ℓ CMB temperature anisotropy multipole number (ℓ) power spectrum Cℓ and was more consistent with rms fractional energy density inhomogeneity averaged over 8h−1 Mpc radius spheres, σ8, and current values determined from weak-lensing observations, although the flat-ΛCDM model better fits the observed higher-ℓ Cℓ's.
In this paper we examine the constraints on the non-flat ΛCDM inflation model that result from a joint analysis of the Planck 2015 CMB anisotropy data (Planck Collaboration et al. 2016), the Joint Light-curve Analysis (JLA) SN Ia apparent magnitude measurements (Betoule et al. 2014), and all reliable BAO distance, growth factor, and Hubble parameter measurements to date. We also perform a similar analysis for the tilted flat-ΛCDM inflation model.
The main purposes of our analyses here are, first, to examine the effect that the inclusion of a significant amount of reliable, recent, non-CMB data has on the finding of Ooba et al. (2018a) that the Planck 2015 CMB anisotropy observations and a handful of BAO distance measurements are not inconsistent with the untilted closed-ΛCDM inflation model, and, second, to use this large new compilation of reliable non-CMB data to examine the consistency between the cosmological constraints of each type of data and to more tightly measure cosmological parameters than has been done to date.
Our main findings here are that our carefully gathered compilation of cosmological observations, the largest to date, does not require flat spatial hypersurfaces, with the untilted non-flat ΛCDM inflation model in which spatial curvature contributes about a percent to the current cosmological energy budget being more than 5σ away from flatness; the untilted non-flat model better fits the low-ℓ CMB temperature anisotropy Cℓ's, as well as the weak lensing constraints in the σ8–Ωm plane, while the tilted flat-ΛCDM model is more consistent with the higher-ℓ Cℓ's; H0 is robustly measured in an almost model-independent manner and the value is consistent with most other measurements; and some measured cosmological parameter values, including those of Ωbh2, τ, and Ωch2, differ significantly between the two models, so care must be exercised when utilizing cosmological measurements of such parameters.
This paper is organized as follows. In Section 2 we describe the cosmological data sets we use in our analyses. In Section 3 we summarize the methods we use for our analyses here. The observational constraints resulting from these data for the tilted flat-ΛCDM and the non-flat ΛCDM inflation models are presented in Section 4. We summarize our results in Section 5.
2. Data
2.1. Planck 2015 CMB Anisotropy Data
We use the Planck 2015 TT + lowP and TT + lowP + lensing CMB anisotropy data (Planck Collaboration et al. 2016). Here, TT represents the low-ℓ (2 ≤ ℓ ≤ 29) and high-ℓ (30 ≤ ℓ ≤ 2508; PlikTT) Planck temperature-only  data and lowP denotes low-ℓ polarization
  ,
,  , and
, and  power spectra measurements at 2 ≤ ℓ ≤ 29. The collection of low-ℓ temperature and polarization measurements is denoted as lowTEB. For CMB lensing data we use the power spectrum of the lensing potential measured by Planck.
2.2. JLA SN Ia Data
We use the JLA compilation of 740 SN Ia apparent magnitude measurements released by the SDSS-II and SNLS collaborations (Betoule et al. 2014). The JLA data set is composed of several low-redshift SN Ia (z < 0.1) and higher-redshift samples from the SDSS-II (0.05 < z < 0.4) and SNLS (0.2 < z < 1).
2.3. BAO Data
The anisotropy of BAO features in the line of sight and the transverse directions enable us to constrain both the Hubble parameter H(z) and the comoving angular diameter distance

where DA is the physical angular diameter distance at redshift z. The radius of the sound horizon at the drag epoch zd is

where cs(z) is the sound speed of the photon-baryon fluid. Because the size of the sound horizon rd depends on the cosmological model and the energy contents, the BAO features in the large-scale structure actually constrain DM(z)/rd and H(z) rd.
We use the recent, more reliable BAO distance measurements from the 6dF Galaxy Survey (6dFGS; Beutler et al. 2011), the Sloan Digital Sky Survey (SDSS) Data Release 7 (DR7) main galaxy sample (MGS; Ross et al. 2015), the Baryon Oscillation Spectroscopic Survey (BOSS) DR12 galaxies (Alam et al. 2017), the eBOSS DR14 QSO's (Ata et al. 2018), and the BOSS DR11 and DR12 Lyα forest (Font-Ribera et al. 2014; Bautista et al. 2017), 15 points in total, which are summarized in Table 1.5 We call this collection of BAO measurements "NewBAO" to distinguish it from the earlier BAO data compilation (which we call "BAO") of 6dFGS (Beutler et al. 2011), BOSS LOWZ and CMASS (Anderson et al. 2014), and SDSS MGS (Ross et al. 2015) BAO distance measurements, used in the analyses of Planck Collaboration et al. (2016) and Ooba et al. (2018a, 2018b, 2018c).
Table 1. BAO Measurements
| Data Set | LSS Tracers | zeff | Observable | Measurement | Reference |
|---|---|---|---|---|---|
| BOSS DR12 | galaxies | 0.38 | DM (rd,fid/rd) [Mpc] | 1518 ± 22 | Alam et al. (2017) |
| 0.51 | DM (rd,fid/rd) [Mpc] | 1977 ± 27 | Alam et al. (2017) | ||
| 0.61 | DM (rd,fid/rd) [Mpc] | 2283 ± 32 | Alam et al. (2017) | ||
| 0.38 | H (rd/rd,fid) [km s−1 Mpc−1] | 81.5 ± 1.9 | Alam et al. (2017) | ||
| 0.51 | H (rd/rd,fid) [km s−1 Mpc−1] | 90.4 ± 1.9 | Alam et al. (2017) | ||
| 0.61 | H (rd/rd,fid) [km s−1 Mpc−1] | 97.3 ± 2.1 | Alam et al. (2017) | ||
| 0.38 | fσ8 | 0.497 ± 0.045 | Alam et al. (2017) | ||
| 0.51 | fσ8 | 0.458 ± 0.038 | Alam et al. (2017) | ||
| 0.61 | fσ8 | 0.436 ± 0.034 | Alam et al. (2017) | ||
| 6dF | galaxies | 0.106 | rd/DV | 0.327 ± 0.015 | Beutler et al. (2011) |
| SDSS DR7 MGS | galaxies | 0.15 | DV (rd,fid/rd) [Mpc] | 664 ± 25 | Ross et al. (2015) |
| eBOSS DR14 | QSOs | 1.52 | DV (rd,fid/rd) [Mpc] | 3855 ± 170 | Ata et al. (2018) |
| BOSS DR12 Lyα forest | Lyα | 2.33 | DH0.7DM0.3/rd | 13.94 ± 0.35 | Bautista et al. (2017) |
| BOSS DR11 Lyα forest | QSO and Lyα | 2.36 | DH/rd | 9.0 ± 0.3 | Font-Ribera et al. (2014) |
| 2.36 | DA/rd | 10.8 ± 0.4 | Font-Ribera et al. (2014) | ||
Note. The sound horizon size of the fiducial model is rd,fid = 147.78 Mpc in Alam et al. (2017) and Ata et al. (2018), and rd,fid = 148.69 Mpc in Ross et al. (2015).
Download table as: ASCIITypeset image
For BAO data provided by Alam et al. (2017), we include the growth rate (fσ8) data in our BAO (and not in our growth rate) analyses here, to be able to properly account for the correlations in the Alam et al. (2017) measurements. For the SDSS DR7 MGS (Ross et al. 2015) and BOSS DR11 Lyα forest (Font-Ribera et al. 2014) measurements, we use the probability distributions of the BAO data points, instead of using the Gaussian approximation constraints. Bautista et al. (2017) provide one BAO parameter  at z = 2.33 measured from BOSS DR12 Lyα forest observations, where DH is defined as

where c is the speed of light. Font-Ribera et al. (2014) provide BAO parameters (DH/rd and DA/rd) measured from the cross-correlation between QSO and Lyα forest data. They actually provide the probability distribution of parameters that describe shifts of the BAO peak position with respect to the fiducial cosmology in perpendicular and parallel directions to the line of sight,

The angle-averaged shift and the ratio of the two α parameters can be converted into the angle-averaged version of the distance scale,

and the Alcock–Paczynski parameter,

For the BAO data of Alam et al. (2017), instead of using DM (rd,fid/rd) and H (rd/rd,fid), we actually transform these into DV/rd and FAP and also use their growth rate fσ8 measurements and account for correlations (data publicly available at the BOSS website).
2.4. Hubble Parameter Data
Hubble parameter measurements can be used to constrain dark-energy parameters, as well as other cosmological parameters, including the spatial curvature of the universe (see, e.g., Farooq et al. 2017).6 Here we adapt and use a recent Hubble parameter measurement compilation to constrain both the tilted flat-ΛCDM inflation model and the non-flat ΛCDM inflation model. Table 2 lists all more reliable recent measurements of the Hubble parameter at various redshifts (with 31 data points in total).7 See Farooq et al. (2017) and Yu et al. (2018) for discussions about how these data were selected.8
Table 2. Hubble Parameter Data
| z | H(z) | σH | Reference |
|---|---|---|---|
| (km s−1 Mpc−1) | (km s−1 Mpc−1) | ||
| 0.070 | 69 | 19.6 | Zhang et al. (2014) |
| 0.090 | 69 | 12 | Simon et al. (2005) |
| 0.120 | 68.6 | 26.2 | Zhang et al. (2014) |
| 0.170 | 83 | 8 | Simon et al. (2005) |
| 0.179 | 75 | 4 | Moresco et al. (2012) |
| 0.199 | 75 | 5 | Moresco et al. (2012) |
| 0.200 | 72.9 | 29.6 | Zhang et al. (2014) |
| 0.270 | 77 | 14 | Simon et al. (2005) |
| 0.280 | 88.8 | 36.6 | Zhang et al. (2014) |
| 0.352 | 83 | 14 | Moresco et al. (2012) |
| 0.3802 | 83 | 13.5 | Moresco et al. (2016) |
| 0.400 | 95 | 17 | Simon et al. (2005) |
| 0.4004 | 77 | 10.2 | Moresco et al. (2016) |
| 0.4247 | 87.1 | 11.2 | Moresco et al. (2016) |
| 0.4497 | 92.8 | 12.9 | Moresco et al. (2016) |
| 0.47 | 89 | 50 | Ratsimbazafy et al. (2017) |
| 0.4783 | 80.9 | 9 | Moresco et al. (2016) |
| 0.480 | 97 | 62 | Stern et al. (2010) |
| 0.593 | 104 | 13 | Moresco et al. (2012) |
| 0.680 | 92 | 8 | Moresco et al. (2012) |
| 0.781 | 105 | 12 | Moresco et al. (2012) |
| 0.875 | 125 | 17 | Moresco et al. (2012) |
| 0.880 | 90 | 40 | Stern et al. (2010) |
| 0.900 | 117 | 23 | Simon et al. (2005) |
| 1.037 | 154 | 20 | Moresco et al. (2012) |
| 1.300 | 168 | 17 | Simon et al. (2005) |
| 1.363 | 160 | 33.6 | Moresco (2015) |
| 1.430 | 177 | 18 | Simon et al. (2005) |
| 1.530 | 140 | 14 | Simon et al. (2005) |
| 1.750 | 202 | 40 | Simon et al. (2005) |
| 1.965 | 186.5 | 50.4 | Moresco (2015) |
Download table as: ASCIITypeset image
2.5. Growth Rate Data
The growth rate is defined as

where a is the scale factor, D(a) is the amplitude of the matter density perturbation, and  for the ΛCDM model. Information on the growth rate is derived from the peculiar velocities of galaxies. The peculiar velocities can be obtained from the redshift space distortion information imprinted in the large-scale structures of galaxy redshift surveys. The growth rate measurement is sometimes given in terms of β = f/b, where b is the bias parameter that relates the galaxy density perturbation to the matter one via δg = bδm. Because the β parameter strongly depends on the bias parameter, the combination f(z)σ8(z) is more widely used to quantify the growth rate of the matter density perturbation. Here, the rms of density fluctuations within a sphere of 8 h−1Mpc radius is represented by σ8 for the mass and σ8,g for the galaxy distributions. These are related through σ8 = σ8,g/b and fσ8 = βσ8,g. The rms mass fluctuation at epoch a is

where the subscript 0 indicates the present epoch. In the following we denote the present value σ8,0 as σ8 for simplicity.
Table 3 lists all more reliable recent measurements of growth rate f(z)σ8(z) at various redshifts, 10 points in total. As already noted, the three growth rate data points of Alam et al. (2017) are included in the collection of BAO data points in order to properly account for correlations between these BAO and growth rate data points.
Table 3. Growth Rate Data
| Data Set | zeff | f(z) σ8(z) | References | Notes |
|---|---|---|---|---|
| SN Ia+IRAS PSCz | 0.02 | 0.398 ± 0.065 | Turnbull et al. (2012); Hudson & Turnbull (2012) | (Ωm, Ωk) = (0.3, 0) |
| 2MASS | 0.02 | 0.32 ± 0.04 | Springob et al. (2016) | (Ωm, Ωk) = (0.308, 0) |
| 6dFGS | 0.067 | 0.423 ± 0.055 | Beutler et al. (2012) | (Ωm, Ωk) = (0.27, 0) |
| SDSS MGS | 0.1 | 0.37 ± 0.13 | Feix et al. (2015) | (Ωm, Ωk) = (0.3, 0) |
| SDSS MGS | 0.15 | 0.49 ± 0.145 | Howlett et al. (2015) | (Ωm, h, σ8,0) = (0.31, 0.67, 0.83) |
| GAMA | 0.18 | 0.29 ± 0.10 | Simpson et al. (2016) | (Ωm, Ωk) = (0.27, 0) |
| GAMA | 0.38 | 0.44 ± 0.06 | Blake et al. (2013) | |
| VIPERS PDR-2 | 0.6 | 0.55 ± 0.12 | Pezzotta et al. (2017) | (Ωm, Ωb) = (0.3, 0.045) |
| VIPERS PDR-2 | 0.86 | 0.40 ± 0.11 | Pezzotta et al. (2017) | |
| FastSound | 1.4 | 0.482 ± 0.116 | Okumura et al. (2016) | (Ωm, Ωk) = (0.27, 0) |
Note. The fiducial models assumed in the analyses are listed in the notes.
Download table as: ASCIITypeset image
3. Methods
3.1. Model Computations
We use the publicly available CAMB/COSMOMC package (version of 2016 November; Challinor & Lasenby 1999; Lewis et al. 2000; Lewis & Bridle 2002) to constrain the tilted flat and the non-flat ΛCDM inflation models with Planck 2015 CMB and other non-CMB data sets. The Boltzmann code CAMB computes the CMB angular power spectra for temperature fluctuations, polarization, and lensing potential, and COSMOMC applies the Markov chain Monte Carlo (MCMC) method to explore and determine model-parameter space that is favored by the data used. We use the COSMOMC settings adopted in the Planck team's analysis (Planck Collaboration et al. 2016). We set the present CMB temperature to T0 = 2.7255 K (Fixsen 2009) and the effective number of neutrino species to Neff = 3.046. We assume the existence of a single species of massive neutrinos with mass mν = 0.06 eV. The primordial helium fraction YHe is set from the big bang nucleosynthesis prediction. In the parameter estimation the lensed CMB power spectra for each model are compared with observations. When the Planck lensing data are included in the analysis, we also need to consider the nonlinear lensing effect that is important in the lensing potential reconstruction (Planck Collaboration et al. 2014). As needed, we turn on the options for CMB lensing and nonlinear lensing in every case, regardless of whether the Planck lensing data are used or not.
The primordial power spectrum in the spatially flat tilted ΛCDM inflation model (Lucchin & Matarrese 1985; Ratra 1992, 1989) is

where k is wavenumber and As is the amplitude at the pivot scale k0 = 0.05 Mpc−1. On the other hand, the primordial power spectrum in the non-flat ΛCDM inflation model (Ratra & Peebles 1995; Ratra 2017) is
which goes over to the ns = 1 spectrum in the spatially flat limit (K = 0). For scalar perturbations,  is the wavenumber where
  is the spatial curvature. For the spatially closed model, with negative Ωk, the normal modes are characterized by the positive integers ν = qK−1/2 = 3, 4, 5, ..., and the eigenvalue of the spatial Laplacian is
  . We use P(q) as the initial power spectrum of perturbations for the non-flat model by normalizing its amplitude at the pivot scale k0 to the value of As.
The Planck 2015 non-flat model analyses (Planck Collaboration et al. 2016) are not based on either of the above power spectra; instead they assume
where in addition to the non-flat space wavenumber q, the wavenumber  is also used to define and tilt the non-flat model PPlanck(q). The
  tilt factor in
  assumes that tilt in non-flat space works somewhat as it does in flat space, which seems unlikely, as spatial curvature sets an additional length scale in non-flat space (i.e., in addition to the Hubble length). It is not known if the power spectrum of Equation (11) can be the consequence of quantum fluctuations during an early epoch of inflation. This power spectrum is physically sensible if K = 0 or if ns = 1, when it reduces to the power spectra in Equations (9) and (10), both of which are consequences of quantum fluctuations during inflation.9
3.2. Constraining Model Parameters
We explore the parameter space of the tilted flat-ΛCDM model with six cosmological parameters (Ωbh2, Ωch2, θMC, τ, As, and ns) and the untilted non-flat ΛCDM model with six parameters (Ωbh2, Ωch2, Ωk, θMC, τ, and As). θMC is the approximate angular size of the sound horizon (r*/DA) at redshift z* for which the optical depth equals unity (Planck Collaboration et al. 2014). Unresolved extragalactic foregrounds due to point sources, cosmic infrared background, and thermal and kinetic Sunyaev–Zeldovich components contribute to the temperature power spectrum. Thus, the foreground model parameters are also constrained as nuisance parameters by the MCMC method. We also compute three derived parameters, H0, Ωm, and σ8.
For each model (and set of six-parameter values), we compare the lensed CMB power spectra obtained from the CAMB Boltzmann code with the Planck 2015 TT + lowP data and TT + lowP + lensing data, excluding and including the power spectrum of the lensing potential, respectively. For BAO, SN Ia, and Hubble parameter data, the prediction determined from the spatially homogeneous background evolution equations solution for each set of model parameters is compared with the observations.10 For growth rate data, the matter density perturbation evolved by the CAMB code is used to compute fσ8 at the needed redshifts.
We set priors for some parameters. The Hubble constant is restricted to the range 20 ≤ H0 ≤ 100, in units of km s−1 Mpc−1. The reionization optical depth is explored only in the range τ > 0.005. The other basic parameters have flat priors that are sufficiently wide such that the final constraints are within the prior ranges. For every model considered here, sufficient MCMC chains are generated in order that the Gelman and Rubin R statistics satisfy the condition R ≲ 0.01.
4. Observational Constraints
We constrain the spatially flat tilted and the untilted non-flat ΛCDM inflation models using the Planck 2015 TT + lowP (excluding and including the CMB lensing) data and other non-CMB data sets.
We first examine how efficient the new BAO data are in constraining parameters, relative to the old BAO data. Figure 1 compares the likelihood distributions of the model parameters for the old ("BAO") and new BAO ("NewBAO") data sets, in conjunction with the CMB observations. The mean and 68.3% confidence limits of model parameters are presented in Table 4. We see that adding CMB lensing data results in a reduction of ln (1010As) and τ in both models and that the NewBAO data improve parameter estimation with slightly narrower parameter constraints (moreso for the cases in which the lensing data are excluded).
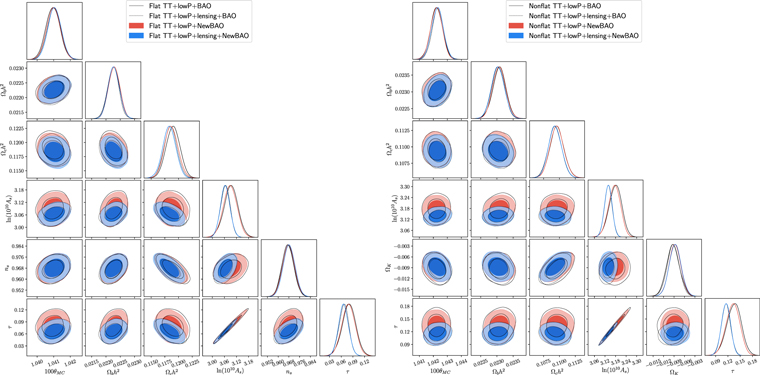
Figure 1. Likelihood distributions of the tilted flat (left) and untilted non-flat (right) ΛCDM model parameters favored by the Planck 2015 CMB TT + lowP (+ lensing) and BAO data. Here the parameter constraints are compared for the old BAO data and the new (NewBAO) data summarized in Table 1. Two-dimensional marginalized likelihood distributions of all possible combinations of model parameters together with one-dimensional likelihoods are shown as solid and dashed black curves for BAO and filled contours and colored curves for NewBAO data.
Download figure:
Standard image High-resolution imageTable 4. Mean and 68.3% Confidence Limits of Tilted Flat and Untilted Non-flat ΛCDM Model Parameters
| Tilted flat-ΛCDM model | ||||
|---|---|---|---|---|
| Parameter | TT+lowP+BAO | TT+lowP+lensing+BAO | TT+lowP+NewBAO | TT+lowP+lensing+NewBAO |
| Ωbh2 | 0.02227 ± 0.00020 | 0.02225 ± 0.00020 | 0.02229 ± 0.00020 | 0.02227 ± 0.00020 |
| Ωch2 | 0.1190 ± 0.0013 | 0.1185 ± 0.0012 | 0.1187 ± 0.0012 | 0.1183 ± 0.0012 |
| 100θMC | 1.04095 ± 0.00042 | 1.04103 ± 0.00041 | 1.04099 ± 0.00041 | 1.04105 ± 0.00040 |
| τ | 0.080 ± 0.018 | 0.067 ± 0.013 | 0.079 ± 0.017 | 0.066 ± 0.013 |
| ln(1010As) | 3.092 ± 0.035 | 3.065 ± 0.024 | 3.088 ± 0.034 | 3.064 ± 0.024 |
| ns | 0.9673 ± 0.0044 | 0.9674 ± 0.0044 | 0.9678 ± 0.0044 | 0.9682 ± 0.0044 |
| H0 [km s−1 Mpc−1] | 67.65 ± 0.57 | 67.81 ± 0.54 | 67.78 ± 0.55 | 67.92 ± 0.54 |
| Ωm | 0.3102 ± 0.0076 | 0.3077 ± 0.0072 | 0.3083 ± 0.0074 | 0.3063 ± 0.0071 |
| σ8 | 0.829 ± 0.014 | 0.8158 ± 0.0089 | 0.826 ± 0.014 | 0.8150 ± 0.0089 |
| Untilted non-flat ΛCDM model | ||||
| Parameter | TT+lowP+BAO | TT+lowP+lensing+BAO | TT+lowP+NewBAO | TT+lowP+lensing+NewBAO |
| Ωbh2 | 0.02307 ± 0.00020 | 0.02304 ± 0.00020 | 0.02307 ± 0.00020 | 0.02303 ± 0.00020 |
| Ωch2 | 0.1096 ± 0.0011 | 0.1093 ± 0.0011 | 0.1096 ± 0.0011 | 0.1093 ± 0.0010 |
| 100θMC | 1.04222 ± 0.00042 | 1.04232 ± 0.00041 | 1.04223 ± 0.00042 | 1.04230 ± 0.00042 |
| τ | 0.135 ± 0.018 | 0.115 ± 0.011 | 0.132 ± 0.017 | 0.115 ± 0.011 |
| ln(1010As) | 3.179 ± 0.036 | 3.138 ± 0.022 | 3.174 ± 0.034 | 3.139 ± 0.022 |
| Ωk | −0.0093 ± 0.0019 | −0.0093 ± 0.0018 | −0.0088 ± 0.0017 | −0.0087 ± 0.0017 |
| H0 [km s−1 Mpc−1] | 67.46 ± 0.72 | 67.56 ± 0.67 | 67.69 ± 0.66 | 67.81 ± 0.66 |
| Ωm | 0.2931 ± 0.0064 | 0.2914 ± 0.0059 | 0.2910 ± 0.0059 | 0.2893 ± 0.0058 |
| σ8 | 0.832 ± 0.016 | 0.814 ± 0.010 | 0.830 ± 0.015 | 0.8148 ± 0.0097 |
Note. BAO versus NewBAO.
Download table as: ASCIITypeset image
The entries in the TT + lowP + BAO and TT + lowP + lensing + BAO columns for the non-flat ΛCDM model in Table 4 agree well with the corresponding entries in Table 2 of Ooba et al. (2018a). Ooba et al. (2018a) used CLASS (Blas et al. 2011) to compute the Cℓ's and Monte Python (Audren et al. 2013) for the MCMC analyses, so it is gratifying and reassuring that our results agree well with those of Ooba et al. (2018a).11
We investigate the effect of including non-CMB data sets, with the Planck 2015 CMB data, on the parameter constraints of the tilted flat and the untilted non-flat ΛCDM models. The results are presented in Figures 2–5 and Tables 5–8. In the triangle plots we omit the likelihood contours for TT + lowP (+ lensing) + JLA + NewBAO data (excluding or including the Planck lensing data) in both the tilted flat and the untilted non-flat ΛCDM models because they are very similar to those for TT + lowP (+ lensing) + NewBAO data.
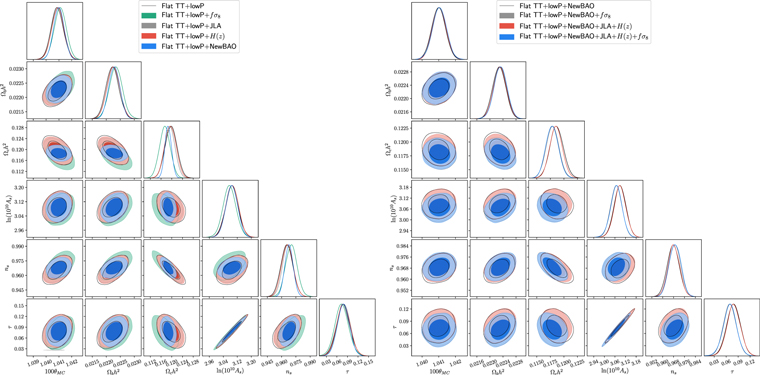
Figure 2. Likelihood distributions of the tilted flat-ΛCDM model parameters constrained by Planck CMB TT + lowP, JLA SN Ia, NewBAO, H(z), and fσ8 data. Two-dimensional marginalized likelihood distributions of all possible combinations of model parameters together with one-dimensional likelihoods are shown for cases when each non-CMB data set is added to the Planck TT + lowP data (left panel) and when the growth rate, JLA SN Ia, Hubble parameter data, and the combination of them, are added to TT + lowP + NewBAO data (right panel). For ease of viewing, the cases of TT + lowP (left) and TT + lowP + NewBAO (right panel) are shown as solid black curves.
Download figure:
Standard image High-resolution image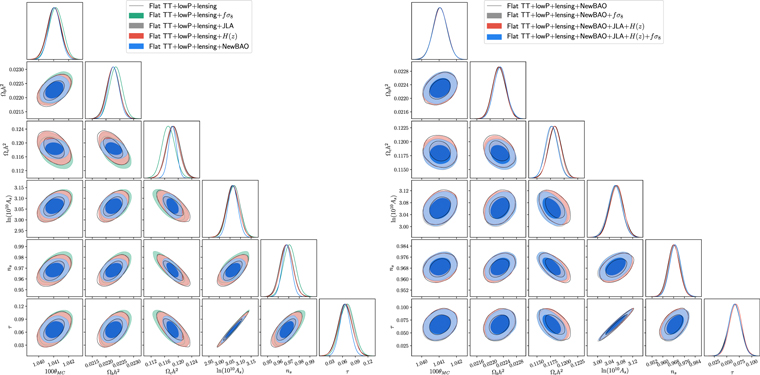
Figure 3. Same as Figure 2 but now including the Planck CMB lensing data.
Download figure:
Standard image High-resolution image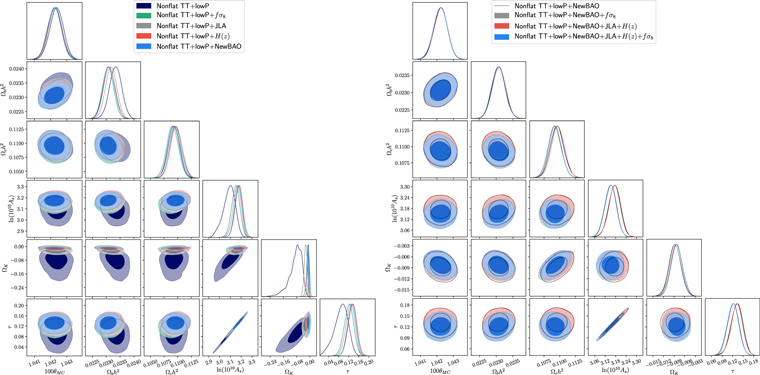
Figure 4. Likelihood distributions of the untilted non-flat ΛCDM model parameters constrained by Planck CMB TT + lowP, JLA SN Ia, NewBAO, H(z), and fσ8 data. Two-dimensional marginalized likelihood distributions of all possible combinations of model parameters, together with one-dimensional likelihoods are shown for cases when each non-CMB data set is added to the Planck TT + lowP data (left panel) and when the growth rate, JLA SN Ia, Hubble parameter data, and the combination of them, are added to TT + lowP + NewBAO data (right panel). For ease of viewing, the result of TT + lowP + NewBAO is shown as solid black curves in the right panel.
Download figure:
Standard image High-resolution image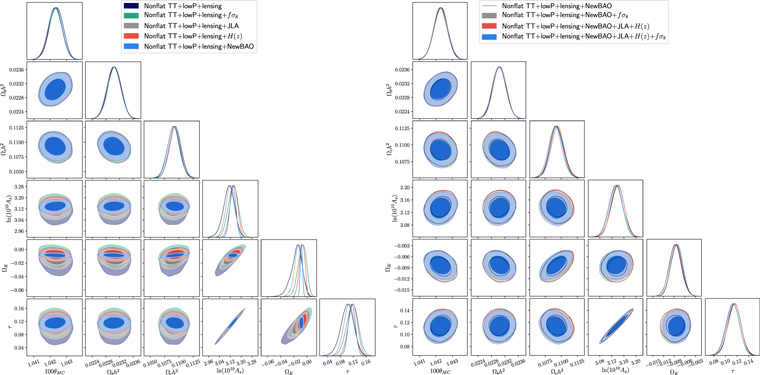
Figure 5. Same as Figure 4 but now including the Planck CMB lensing data.
Download figure:
Standard image High-resolution imageThe entries in the CMB-only TT + lowP column of Table 5 and those in the TT + lowP + lensing column of Table 6 for the tilted flat-ΛCDM model agree well with the corresponding entries in Table 4 of Planck Collaboration et al. (2016). Similarly, the entries in the TT + lowP column of Table 7 and those in the TT + lowP + lensing column of Table 8 for the non-flat ΛCDM model agree well with the corresponding entries in Table 1 of Ooba et al. (2018a).
Table 5. Tilted Flat-ΛCDM Model Parameters Constrained with Planck TT + lowP, JLA SN Ia, NewBAO, H(z), and fσ8 Data (Mean and 68.3% Confidence Limits)
| Parameter | TT+lowP | TT+lowP+JLA | TT+lowP+NewBAO |
|---|---|---|---|
| Ωbh2 | 0.02222 ± 0.00023 | 0.02226 ± 0.00022 | 0.02229 ± 0.00020 |
| Ωch2 | 0.1197 ± 0.0022 | 0.1193 ± 0.0020 | 0.1187 ± 0.0012 |
| 100θMC | 1.04086 ± 0.00048 | 1.04092 ± 0.00047 | 1.04099 ± 0.00041 |
| τ | 0.078 ± 0.019 | 0.080 ± 0.019 | 0.079 ± 0.017 |
| ln(1010As) | 3.089 ± 0.037 | 3.092 ± 0.035 | 3.088 ± 0.034 |
| ns | 0.9655 ± 0.0062 | 0.9666 ± 0.0057 | 0.9678 ± 0.0044 |
| H0 [km s−1 Mpc−1] | 67.32 ± 0.99 | 67.52 ± 0.89 | 67.78 ± 0.55 |
| Ωm | 0.315 ± 0.014 | 0.312 ± 0.012 | 0.3083 ± 0.0074 |
| σ8 | 0.829 ± 0.015 | 0.829 ± 0.014 | 0.826 ± 0.014 |
| Parameter | TT+lowP+H(z) | TT+lowP+JLA+NewBAO | TT+lowP+JLA+NewBAO+H(z) |
| Ωbh2 | 0.02225 ± 0.00022 | 0.02230 ± 0.00019 | 0.02231 ± 0.00020 |
| Ωch2 | 0.1195 ± 0.0021 | 0.1186 ± 0.0012 | 0.1185 ± 0.0012 |
| 100θMC | 1.04091 ± 0.00047 | 1.04101 ± 0.00041 | 1.04103 ± 0.00041 |
| τ | 0.079 ± 0.019 | 0.078 ± 0.017 | 0.079 ± 0.017 |
| ln(1010As) | 3.091 ± 0.036 | 3.088 ± 0.034 | 3.089 ± 0.034 |
| ns | 0.9661 ± 0.0060 | 0.9679 ± 0.0044 | 0.9682 ± 0.0042 |
| H0 [km s−1 Mpc−1] | 67.44 ± 0.94 | 67.82 ± 0.55 | 67.85 ± 0.52 |
| Ωm | 0.313 ± 0.013 | 0.3078 ± 0.0072 | 0.3074 ± 0.0068 |
| σ8 | 0.829 ± 0.014 | 0.826 ± 0.014 | 0.826 ± 0.014 |
| Parameter | TT+lowP+fσ8 | TT+lowP+NewBAO+fσ8 | TT+lowP+JLA+NewBAO+H(z)+fσ8 |
| Ωbh2 | 0.02234 ± 0.00023 | 0.02231 ± 0.00020 | 0.02232 ± 0.00020 |
| Ωch2 | 0.1174 ± 0.0020 | 0.1179 ± 0.0012 | 0.1178 ± 0.0011 |
| 100θMC | 1.04110 ± 0.00046 | 1.04104 ± 0.00041 | 1.04104 ± 0.00042 |
| τ | 0.074 ± 0.020 | 0.069 ± 0.016 | 0.069 ± 0.017 |
| ln(1010As) | 3.076 ± 0.037 | 3.068 ± 0.032 | 3.068 ± 0.033 |
| ns | 0.9702 ± 0.0061 | 0.9689 ± 0.0042 | 0.9690 ± 0.0043 |
| H0 [km s−1 Mpc−1] | 68.31 ± 0.94 | 68.09 ± 0.54 | 68.12 ± 0.52 |
| Ωm | 0.301 ± 0.012 | 0.3040 ± 0.0069 | 0.3035 ± 0.0067 |
| σ8 | 0.817 ± 0.014 | 0.815 ± 0.013 | 0.815 ± 0.013 |
Download table as: ASCIITypeset image
Table 6. Tilted Flat-ΛCDM Model Parameters Constrained with Planck TT + lowP + Lensing, JLA, NewBAO, H(z), and fσ8 Data (Mean and 68.3% Confidence Limits)
| Parameter | TT+lowP+lensing | TT+lowP+lensing+JLA | TT+lowP+lensing+NewBAO |
|---|---|---|---|
| Ωbh2 | 0.02225 ± 0.00023 | 0.02227 ± 0.00022 | 0.02227 ± 0.00020 |
| Ωch2 | 0.1186 ± 0.0020 | 0.1183 ± 0.0019 | 0.1183 ± 0.0012 |
| 100θMC | 1.04102 ± 0.00046 | 1.04105 ± 0.00045 | 1.04105 ± 0.00040 |
| τ | 0.066 ± 0.017 | 0.068 ± 0.016 | 0.066 ± 0.013 |
| ln(1010As) | 3.063 ± 0.030 | 3.066 ± 0.029 | 3.064 ± 0.024 |
| ns | 0.9677 ± 0.0060 | 0.9683 ± 0.0058 | 0.9682 ± 0.0044 |
| H0 [km s−1 Mpc−1] | 67.80 ± 0.92 | 67.93 ± 0.88 | 67.92 ± 0.54 |
| Ωm | 0.308 ± 0.012 | 0.306 ± 0.012 | 0.3063 ± 0.0071 |
| σ8 | 0.8151 ± 0.0095 | 0.8156 ± 0.0093 | 0.8150 ± 0.0089 |
| Parameter | TT+lowP+lensing+H(z) | TT+lowP+lensing+JLA+NewBAO | TT+lowP+lensing+JLA+NewBAO+H(z) |
| Ωbh2 | 0.02226 ± 0.00022 | 0.02227 ± 0.00020 | 0.02228 ± 0.00019 |
| Ωch2 | 0.1184 ± 0.0019 | 0.1182 ± 0.0011 | 0.1182 ± 0.0011 |
| 100θMC | 1.04104 ± 0.00046 | 1.04105 ± 0.00040 | 1.04107 ± 0.00040 |
| τ | 0.066 ± 0.016 | 0.067 ± 0.013 | 0.067 ± 0.012 |
| ln(1010As) | 3.063 ± 0.029 | 3.064 ± 0.024 | 3.064 ± 0.023 |
| ns | 0.9680 ± 0.0058 | 0.9682 ± 0.0043 | 0.9682 ± 0.0043 |
| H0 [km s−1 Mpc−1] | 67.86 ± 0.88 | 67.95 ± 0.52 | 67.95 ± 0.51 |
| Ωm | 0.307 ± 0.012 | 0.3058 ± 0.0068 | 0.3058 ± 0.0067 |
| σ8 | 0.8151 ± 0.0094 | 0.8149 ± 0.0090 | 0.8149 ± 0.0089 |
| Parameter | TT+lowP+lensing+fσ8 | TT+lowP+lensing+NewBAO+fσ8 | TT+lowP+lensing+JLA+NewBAO+H(z)+fσ8 |
| Ωbh2 | 0.02235 ± 0.00023 | 0.02230 ± 0.00020 | 0.02231 ± 0.00019 |
| Ωch2 | 0.1171 ± 0.0019 | 0.1178 ± 0.0011 | 0.1177 ± 0.0011 |
| 100θMC | 1.04115 ± 0.00046 | 1.04104 ± 0.00041 | 1.04106 ± 0.00040 |
| τ | 0.070 ± 0.017 | 0.065 ± 0.013 | 0.066 ± 0.012 |
| ln(1010As) | 3.068 ± 0.030 | 3.059 ± 0.024 | 3.061 ± 0.023 |
| ns | 0.9707 ± 0.0059 | 0.9690 ± 0.0043 | 0.9692 ± 0.0042 |
| H0 [km s−1 Mpc−1] | 68.44 ± 0.89 | 68.13 ± 0.52 | 68.17 ± 0.50 |
| Ωm | 0.299 ± 0.011 | 0.3033 ± 0.0068 | 0.3027 ± 0.0065 |
| σ8 | 0.8130 ± 0.0094 | 0.8113 ± 0.0087 | 0.8116 ± 0.0087 |
Download table as: ASCIITypeset image
Table 7. Untilted Non-flat ΛCDM Model Parameters Constrained with Planck TT + lowP, JLA SN Ia, NewBAO, H(z), and fσ8 Data (Mean and 68.3% Confidence Limits)
| Parameter | TT+lowP | TT+lowP+JLA | TT+lowP+NewBAO |
|---|---|---|---|
| Ωbh2 | 0.02334 ± 0.00022 | 0.02318 ± 0.00020 | 0.02307 ± 0.00020 |
| Ωch2 | 0.1093 ± 0.0011 | 0.1094 ± 0.0011 | 0.1096 ± 0.0011 |
| 100θMC | 1.04237 ± 0.00042 | 1.04231 ± 0.00042 | 1.04223 ± 0.00042 |
| τ | 0.089 ± 0.028 | 0.126 ± 0.018 | 0.132 ± 0.017 |
| ln(1010As) | 3.088 ± 0.055 | 3.162 ± 0.036 | 3.174 ± 0.034 |
| Ωk | −0.088 ± 0.040 | −0.0257 ± 0.0091 | −0.0088 ± 0.0017 |
| H0 [km s−1 Mpc−1] | 49.1 ± 5.4 | 61.5 ± 2.9 | 67.69 ± 0.66 |
| Ωm | 0.58 ± 0.14 | 0.355 ± 0.033 | 0.2910 ± 0.0059 |
| σ8 | 0.755 ± 0.038 | 0.815 ± 0.018 | 0.830 ± 0.015 |
| Parameter | TT+lowP+H(z) | TT+lowP+JLA+NewBAO | TT+lowP+JLA+NewBAO+H(z) |
| Ωbh2 | 0.02311 ± 0.00020 | 0.02307 ± 0.00020 | 0.02308 ± 0.00020 |
| Ωch2 | 0.1097 ± 0.0011 | 0.1096 ± 0.0011 | 0.1097 ± 0.0011 |
| 100θMC | 1.04225 ± 0.00041 | 1.04223 ± 0.00040 | 1.04222 ± 0.00042 |
| τ | 0.134 ± 0.018 | 0.132 ± 0.016 | 0.132 ± 0.017 |
| ln(1010As) | 3.179 ± 0.036 | 3.173 ± 0.032 | 3.172 ± 0.034 |
| Ωk | −0.0113 ± 0.0051 | −0.0087 ± 0.0016 | −0.0084 ± 0.0017 |
| H0 [km s−1 Mpc−1] | 66.7 ± 2.2 | 67.69 ± 0.63 | 67.85 ± 0.65 |
| Ωm | 0.302 ± 0.020 | 0.2910 ± 0.0057 | 0.2899 ± 0.0058 |
| σ8 | 0.831 ± 0.016 | 0.830 ± 0.014 | 0.830 ± 0.015 |
| Parameter | TT+lowP+fσ8 | TT+lowP+NewBAO+fσ8 | TT+lowP+JLA+NewBAO+H(z)+fσ8 |
| Ωbh2 | 0.02310 ± 0.00021 | 0.02307 ± 0.00019 | 0.02307 ± 0.00020 |
| Ωch2 | 0.1090 ± 0.0011 | 0.1092 ± 0.0010 | 0.1093 ± 0.0010 |
| 100θMC | 1.04225 ± 0.00042 | 1.04224 ± 0.00040 | 1.04222 ± 0.00042 |
| τ | 0.121 ± 0.019 | 0.121 ± 0.016 | 0.121 ± 0.017 |
| ln(1010As) | 3.150 ± 0.038 | 3.151 ± 0.032 | 3.151 ± 0.033 |
| Ωk | −0.0120 ± 0.0085 | −0.0087 ± 0.0017 | −0.0082 ± 0.0016 |
| H0 [km s−1 Mpc−1] | 66.8 ± 3.6 | 67.87 ± 0.64 | 68.04 ± 0.62 |
| Ωm | 0.301 ± 0.032 | 0.2886 ± 0.0057 | 0.2874 ± 0.0055 |
| σ8 | 0.816 ± 0.019 | 0.819 ± 0.014 | 0.820 ± 0.014 |
Download table as: ASCIITypeset image
Table 8. Untilted Non-flat ΛCDM Model Parameters Constrained with Planck TT + lowP + Lensing, JLA, NewBAO, H(z), and fσ8 Data (Mean and 68.3% Confidence Limits)
| Parameter | TT+lowP+lensing | TT+lowP+lensing+JLA | TT+lowP+lensing+NewBAO |
|---|---|---|---|
| Ωbh2 | 0.02305 ± 0.00020 | 0.02304 ± 0.00020 | 0.02303 ± 0.00020 |
| Ωch2 | 0.1091 ± 0.0010 | 0.1091 ± 0.0011 | 0.1093 ± 0.0010 |
| 100θMC | 1.04237 ± 0.00042 | 1.04233 ± 0.00041 | 1.04230 ± 0.00042 |
| τ | 0.101 ± 0.021 | 0.107 ± 0.017 | 0.115 ± 0.011 |
| ln(1010As) | 3.110 ± 0.041 | 3.120 ± 0.034 | 3.139 ± 0.022 |
| Ωk | −0.0160 ± 0.0087 | −0.0133 ± 0.0063 | −0.0087 ± 0.0017 |
| H0 [km s−1 Mpc−1] | 65.1 ± 3.3 | 66.0 ± 2.5 | 67.81 ± 0.66 |
| Ωm | 0.316 ± 0.033 | 0.306 ± 0.023 | 0.2893 ± 0.0057 |
| σ8 | 0.799 ± 0.021 | 0.805 ± 0.017 | 0.8148 ± 0.0097 |
| Parameter | TT+lowP+lensing+H(z) | TT+lowP+lensing+JLA+NewBAO | TT+lowP+lensing+JLA+NewBAO+H(z) |
| Ωbh2 | 0.02304 ± 0.00020 | 0.02302 ± 0.00020 | 0.02303 ± 0.00019 |
| Ωch2 | 0.1094 ± 0.0010 | 0.1094 ± 0.0010 | 0.1094 ± 0.0010 |
| 100θMC | 1.04231 ± 0.00041 | 1.04228 ± 0.00042 | 1.04229 ± 0.00041 |
| τ | 0.119 ± 0.015 | 0.115 ± 0.011 | 0.115 ± 0.011 |
| ln(1010As) | 3.145 ± 0.029 | 3.138 ± 0.022 | 3.139 ± 0.022 |
| Ωk | −0.0075 ± 0.0042 | −0.0086 ± 0.0017 | −0.0083 ± 0.0016 |
| H0 [km s−1 Mpc−1] | 68.4 ± 1.9 | 67.82 ± 0.66 | 67.93 ± 0.63 |
| Ωm | 0.285 ± 0.016 | 0.2893 ± 0.0058 | 0.2885 ± 0.0055 |
| σ8 | 0.818 ± 0.014 | 0.8148 ± 0.0098 | 0.8156 ± 0.0098 |
| Parameter | TT+lowP+lensing+fσ8 | TT+lowP+lensing+NewBAO+fσ8 | TT+lowP+lensing+JLA+NewBAO+H(z)+fσ8 |
| Ωbh2 | 0.02305 ± 0.00020 | 0.02303 ± 0.00020 | 0.02305 ± 0.00020 |
| Ωch2 | 0.1090 ± 0.0011 | 0.1091 ± 0.0011 | 0.1092 ± 0.0010 |
| 100θMC | 1.04229 ± 0.00041 | 1.04229 ± 0.00041 | 1.04226 ± 0.00041 |
| τ | 0.117 ± 0.019 | 0.112 ± 0.011 | 0.113 ± 0.011 |
| ln(1010As) | 3.141 ± 0.037 | 3.132 ± 0.022 | 3.134 ± 0.022 |
| Ωk | −0.0076 ± 0.0064 | −0.0086 ± 0.0017 | −0.0082 ± 0.0016 |
| H0 [km s−1 Mpc−1] | 68.7 ± 3.0 | 67.93 ± 0.67 | 68.07 ± 0.63 |
| Ωm | 0.283 ± 0.024 | 0.2877 ± 0.0058 | 0.2868 ± 0.0055 |
| σ8 | 0.815 ± 0.019 | 0.8111 ± 0.0098 | 0.8124 ± 0.0095 |
Download table as: ASCIITypeset image
From Tables 5 and 6 we see that, when added to the Planck 2015 CMB anisotropy data, for the tilted flat-ΛCDM model, the NewBAO measurements prove more restrictive than either the H(z), fσ8, or SN Ia observations. We note, however, that our NewBAO compilation includes radial BAO H(z) measurements as well as the fσ8 measurements of Alam et al. (2017). It is likely that even if these are moved to the H(z) and fσ8 data sets, BAO constraints will still be the most restrictive, for the tilted flat-ΛCDM model, but probably closely followed by H(z) and fσ8 constraints, with SN Ia being the least effective.
The situation in the untilted non-flat ΛCDM case is more interesting. When CMB lensing data are excluded, Table 7, adding NewBAO, or JLA SN Ia, or H(z), or fσ8 data to the CMB data results in roughly similarly restrictive constraints on Ωbh2, Ωch2, θMC, τ, ln (1010As), and σ8, while CMB + NewBAO data provide the tightest constraints on Ωk, H0, and Ωm. When the CMB lensing data are included (Table 8), CMB data with either JLA SN Ia, or NewBAO, or H(z), or fσ8 data, provide roughly similarly restrictive constraints on Ωbh2, Ωch2, and θMC, while CMB + NewBAO data provide the tightest constraints on τ, ln (1010As), Ωk, H0, Ωm, and σ8.
If we focus on CMB TT + lowP + lensing data, Figures 3 and 5 and Tables 6 and 8, we see that adding only one of the four non-CMB data sets at a time to the CMB measurements (left triangle plots in the two figures) results in four sets of contours that are quite consistent with each other, as well as with the original CMB alone contours, for both the tilted flat-ΛCDM case and for the untilted non-flat ΛCDM model. The same holds true for the tilted flat-ΛCDM model when the CMB lensing data are excluded (left triangle plot of Figure 2). However, in the untilted non-flat ΛCDM case without the lensing data when any of the four non-CMB data sets are added to the CMB data (left triangle plot of Figure 4), they each pull the results toward a smaller  (closer to the flat model) and slightly larger τ and ln(1010As) and smaller Ωbh2 than is favored by the CMB data alone, although all five sets of constraint contours are largely mutually consistent. It is reassuring that the four non-CMB data sets do not pull the CMB constraints in significantly different directions.
As noted above, adding the NewBAO data to the CMB data typically makes the biggest difference, but the other three non-CMB data sets also contribute. Focusing on the TT + lowP + lensing data, we see from Table 6 for the tilted flat-ΛCDM case that the NewBAO data tightly constrains model parameters, particularly Ωch2, while the growth rate (fσ8) data shifts Ωbh2 and ns to larger values and Ωch2 to a smaller value. In this case Ωm is the quantity whose error bar is reduced the most by the full combination of data relative to the CMB and NewBAO compilation, followed by the H0 error bar reduction. For the untilted non-flat ΛCDM model, from Table 8, Ωch2 and τ error bars from the CMB and NewBAO data are not reduced by including the H(z), fσ8, and JLA SN Ia measurements in the mix. In all cases, adding JLA SN Ia or growth rate (fσ8) data to the combination of CMB + NewBAO data does not much improve the observational constraints.12
Again concentrating on the TT + lowP + lensing data, Tables 6 and 8, we see that for the tilted flat-ΛCDM model, adding the four non-CMB data sets to the mix most affects Ωch2 and Ωm, with both central values moving down about 0.5σ of the CMB data alone error bars. The situation in the untilted non-flat ΛCDM case is a little more dramatic, with Ωk moving closer to flatness by about 1σ, H0 and Ωm also moving by about 1σ, and the σ8, ln (1010As), and τ central values moving by about 0.5σ.
Perhaps the biggest consequence of including the four non-CMB data sets in the analyses is the significant strengthening of the evidence for non-flatness in the untilted non-flat ΛCDM case, with it increasing from 1.8σ away from flatness for the CMB alone case, to 5.1σ away from flatness for the full data combination in Table 8,13 where the NewBAO data plays the most important role among the four non-CMB data sets. This is consistent with, but stronger than, the Ooba et al. (2018a) results. The same situation is also seen when the lensing data are excluded, as shown in Table 7. We also note that combining CMB data with either JLA SN Ia, H(z), or growth rate data do not strongly support non-flatness. When combined with CMB data with lensing, SN Ia, H(z), and fσ8 data result in Ωk being 2.1σ, 1.8σ, and 1.2σ away from flatness, while CMB and NewBAO data favor Ωk being 5.1σ away from flatness (Table 8). In the untilted non-flat ΛCDM case, the effect of growth rate data on the model constraints differs from that of the NewBAO data. The results for the untilted non-flat ΛCDM model from TT + lowP + fσ8 observations excluding (including) the lensing data show that the growth rate measurements favor Ωk moving closer to spatial flatness with a deviation of only 1.4σ (1.2σ) from zero spatial curvature. Adding fσ8 data to TT + lowP (+ lensing) + NewBAO measurements—that favor the closed model by 5.2σ (5.1σ)—gives a negative Ωk deviating from flatness by 5.1σ (5.1σ). Thus, the negativeness of the curvature parameter persists for the combination of BAO and growth rate data, which also implies that the BAO data most tightly constrains the curvature parameter compared to the other non-CMB data.
For the full data combination, H0 measured in the two models (with lensing data) in Tables 6 and 8, 68.17 ± 0.50 and 68.07 ± 0.63 km s−1 Mpc−1, are very consistent with each other, agreeing to within 0.12σ (of the quadrature sum of the two error bars).14 These values are consistent with the most recent median statistics estimate H0 = 68 ± 2.8 km s−1 Mpc−1 (Chen & Ratra 2011a), which is consistent with earlier median statistics estimates (Gott et al. 2001; Chen et al. 2003). Many recent estimates of H0 are also quite consistent with these measurements (Calabrese et al. 2012; Hinshaw et al. 2013; Sievers et al. 2013; Aubourg et al. 2015; Luković et al. 2016; Planck Collaboration et al. 2016; Chen et al. 2017; DES Collaboration et al. 2018b; L'Huillier & Shafieloo 2017; Lin & Ishak 2017; Wang et al. 2017; Haridasu et al. 2018; Yu et al. 2018), but, as is well known, they are lower than the local measurement of H0 = 73.06 ± 1.74 km s−1 Mpc−1 (Anderson & Riess 2018).15
In our analyses here, H0 and σ8 (discussed below) are the only cosmological parameters that are determined in a cosmological model (spatial curvature and tilt) independent manner. For instance, Ωm determined using the tilted flat-ΛCDM model differs from that measured in the untilted non-flat ΛCDM model by about 1.9σ (of the quadrature sum of the error bars); however, both estimates are consistent with many other determinations (see, e.g., Chen & Ratra 2003).
Like Ωm, measurements of θMC, Ωbh2, ln(1010As), and τ are more model-dependent, differing by 2.1σ, 2.3σ, 2.7σ, and 2.9σ between the two models. The measurements of Ωch2 differ by 5.7σ, so the cosmological model dependence of this measurement is much more important than the statistical errors determined using a given cosmological model. It is important to account for such model dependence when comparing a cosmologically estimated value to that estimated using a different technique. This model dependence can have very striking consequences. For instance, as discussed in Mitra et al. (2018, 2019), the much larger value of τ in the untilted non-flat case significantly alters the cosmological reionization scenario, although we note that using the more extensive non-CMB data compilation, here we find a 0.6σ reduction in τ compared to the larger value found in Ooba et al. (2018a), thus somewhat alleviating the potential tension discovered in Mitra et al. (2018, 2019) for the higher τ value. From Tables 6 and 8, for the full data compilation including CMB lensing observations, we find in the tilted flat-ΛCDM (non-flat ΛCDM) model 0.02193 ≤ Ωbh2 ≤ 0.02269 (0.02265 ≤ Ωbh2 ≤ 0.02345) at 2σ, which are almost disjointed.16 Clearly, it is not possible to robustly measure Ωbh2 (and some other cosmological parameters) in a model-independent way from cosmological data and care must be taken when comparing a value measured in a cosmological model to a value determined using some other technique (see, e.g., Cooke et al. 2018).
For the full data combination, σ8's measured in the two models (with CMB lensing data), Tables 6 and 8, agree to 0.062σ (of the quadrature sum of the two error bars). Figures 6 and 7 show the marginalized two-dimensional likelihood distribution of Ωm and σ8 for the tilted flat and untilted non-flat ΛCDM models constrained by the Planck CMB and the non-CMB data sets. For comparison, in each panel we present the ΛCDM constraints obtained from a combined analysis of galaxy clustering and weak gravitational lensing based on the first-year result of the Dark Energy Survey (DES Y1 All; DES Collaboration et al. 2018a), whose 68.3% confidence limits are  and
and  . The likelihood distributions in the Ωm–σ8 plane obtained by adding each non-CMB data set to the Planck CMB data are consistent with each other. As expected, the NewBAO data or the NewBAO data combined with other non-CMB data sets give tighter constraints in all cases. As shown in Figures 6 and 7, there is tension between both ΛCDM models constrained by Planck TT + lowP data (dotted and dashed curves in the top panels) and the DES constraints. This tension disappears when the CMB lensing data are included (bottom panels).
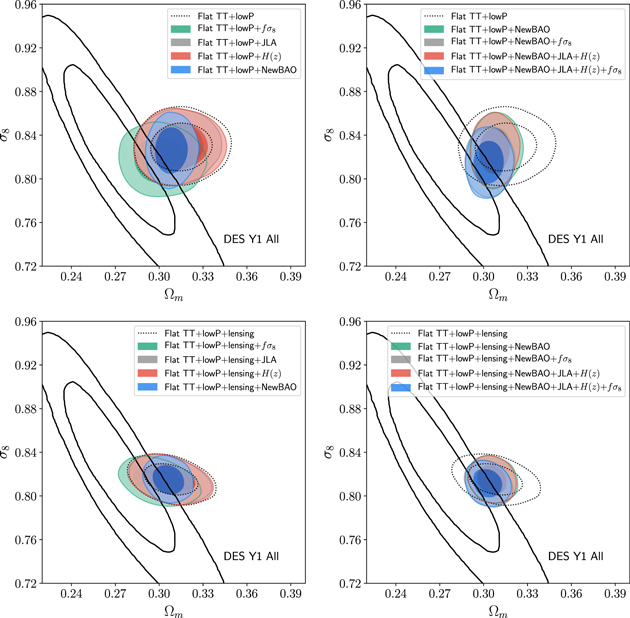
Figure 6. Likelihood distributions in the Ωm–σ8 plane for the tilted flat-ΛCDM model constrained by Planck CMB TT + lowP (+lensing), JLA SN Ia, NewBAO, H(z), and fσ8 data. In each panel the ΛCDM constraints (68.3% and 95.4% confidence limits) obtained from the first-year Dark Energy Survey (DES Y1 All; DES Collaboration et al. 2018a) are shown as thick solid curves for comparison.
Download figure:
Standard image High-resolution image
Figure 7. Same as Figure 6 but for the untilted non-flat ΛCDM model.
Download figure:
Standard image High-resolution imageAlthough our σ8 constraints from the flat and non-flat models (excluding and including CMB lensing data) are similar to the DES Y1 All result, our Ωm constraints favor a larger value by over 1σ for the flat-ΛCDM model. Including the CMB lensing data reduces the tension to 1.2σ. We note that the best-fit point for the non-flat ΛCDM model constrained by the Planck CMB data (including lensing) combined with all non-CMB data enters well into the 1σ region of the DES Y1 All constraint contour (Figure 7 lower right panel), unlike the case for the tilted flat-ΛCDM model (Figure 6 lower right panel).
Table 9 lists the individual and total χ2 values for the best-fit tilted flat and untilted non-flat ΛCDM models. The best-fit position in the parameter space is found with the COSMOMC built-in routine that obtains the minimum χ2 using Powell's minimization method. This method searches for the local minimum by differentiating the likelihood distribution and is efficient at finding an accurate location of the minimum χ2.17
We present the individual contribution of each data set used to constrain the model parameters. The total χ2 is the sum of those from the high-ℓ CMB TT likelihood ( ), the low-ℓ CMB power spectra (
 ), lensing (
 ), JLA SN Ia (
 ), NewBAO (
 ), H(z) (
 ), fσ8 data (
 ), and the contribution from the foreground nuisance parameters (
 ). The nonstandard normalization of the Planck 2015 CMB data likelihoods means that only the difference of χ2 of one model relative to the other is meaningful for the Planck CMB data. In Table 9, for the untilted non-flatΛCDM model, we list Δχ2, the excess χ2 over the value of the tilted flat-ΛCDM model constrained with the same combination of data sets. For the non-CMB data sets, the numbers of degrees of freedom are 735, 15, 31, 10 for JLA SN Ia, NewBAO, H(z), fσ8 data sets, respectively, for a total of 791 degrees of freedom. The reduced χ2's for the individual non-CMB data sets are χ2/ν ≲ 1. There are 189 points in the TT + lowP Planck 2015 data (binned angular power spectrum) and 197 when the CMB lensing observations are included.
Table 9. Individual and Total χ2 Values for the Best-fit Tilted Flat and Untilted Non-flat ΛCDM Inflation Models
| Data Sets |

|

|

|

|

|

|

|

|
Total χ2 | Δχ2 | ln B |
|---|---|---|---|---|---|---|---|---|---|---|---|
| Tilted flat-ΛCDM model | |||||||||||
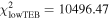
| TT+lowP | 763.57 | 10496.41 | 1.96 | 11261.93 | |||||||
| +JLA | 763.60 | 10496.48 | 695.32 | 1.92 | 11957.32 | ||||||
| +NewBAO | 762.50 | 10497.73 | 13.46 | 2.36 | 11276.05 | ||||||
| +H(z) | 763.98 | 10496.36 | 14.89 | 1.70 | 11276.93 | ||||||
| +fσ8 | 766.83 | 10494.95 | 12.15 | 1.87 | 11275.80 | ||||||
| +NewBAO+fσ8 | 766.47 | 10494.93 | 12.63 | 12.45 | 2.02 | 11288.50 | |||||
| +JLA+NewBAO | 764.11 | 10496.10 | 695.17 | 12.91 | 2.21 | 11970.51 | |||||
| +JLA+NewBAO+H(z) | 764.30 | 10496.06 | 695.19 | 12.94 | 14.81 | 1.95 | 11985.25 | ||||
| +JLA+NewBAO+H(z)+fσ8 | 766.81 | 10494.80 | 695.12 | 12.73 | 14.79 | 12.15 | 2.05 | 11998.43 | |||
| TT+lowP+lensing | 766.20 | 10494.93 | 9.30 | 2.00 | 11272.44 | ||||||
| +JLA | 767.15 | 10494.77 | 8.98 | 695.07 | 2.18 | 11968.15 | |||||
| +NewBAO | 766.37 | 10494.86 | 9.12 | 12.59 | 2.11 | 11285.06 | |||||
| +H(z) | 766.20 | 10494.92 | 9.27 | 14.83 | 2.04 | 11287.27 | |||||
| +fσ8 | 768.26 | 10494.43 | 8.67 | 11.31 | 1.94 | 11284.62 | |||||
| +NewBAO+fσ8 | 767.47 | 10494.57 | 8.73 | 12.66 | 11.80 | 2.11 | 11297.33 | ||||
| +JLA+NewBAO | 766.42 | 10494.85 | 9.16 | 695.19 | 12.61 | 2.01 | 11980.24 | ||||
| +JLA+NewBAO+H(z) | 766.57 | 10494.76 | 9.04 | 695.16 | 12.59 | 14.81 | 2.15 | 11995.08 | |||
| +JLA+NewBAO+H(z)+fσ8 | 767.50 | 10494.56 | 8.74 | 695.12 | 12.65 | 14.79 | 11.79 | 2.07 | 12007.21 | ||
| Untilted non-flat ΛCDM model | |||||||||||
| TT+lowP | 774.34 | 10495.42 | 2.33 | 11272.10 | 10.17 | −5.63 | |||||
| +JLA | 771.82 | 10503.02 | 696.54 | 2.40 | 11973.80 | 16.48 | −7.09 | ||||
| +NewBAO | 779.37 | 10499.98 | 14.25 | 1.95 | 11295.55 | 19.50 | −11.2 | ||||
| +H(z) | 777.14 | 10500.93 | 17.11 | 1.96 | 11297.15 | 20.22 | −11.1 | ||||
| +fσ8 | 783.38 | 10497.49 | 11.51 | 2.41 | 11294.79 | 18.99 | −9.72 | ||||
| +NewBAO+fσ8 | 781.01 | 10500.07 | 14.32 | 11.25 | 1.97 | 11308.62 | 20.12 | −10.1 | |||
| +JLA+NewBAO | 784.80 | 10496.68 | 695.18 | 13.95 | 2.29 | 11992.90 | 22.39 | −9.42 | |||
| +JLA+NewBAO+H(z) | 779.51 | 10500.26 | 695.17 | 14.18 | 16.08 | 1.98 | 12007.20 | 21.95 | −11.9 | ||
| +JLA+NewBAO+H(z)+fσ8 | 784.11 | 10497.49 | 695.20 | 13.95 | 16.36 | 10.61 | 1.82 | 12019.53 | 21.10 | −10.8 | |
| TT+lowP+lensing | 786.87 | 10493.86 | 9.77 | 1.79 | 11292.29 | 19.85 | −10.5 | ||||
| +JLA | 786.10 | 10494.47 | 9.87 | 695.22 | 2.07 | 11987.73 | 19.58 | −8.99 | |||
| +NewBAO | 784.85 | 10496.56 | 9.42 | 13.81 | 1.87 | 11306.51 | 21.45 | −9.89 | |||
| +H(z) | 786.87 | 10496.02 | 8.66 | 16.36 | 2.19 | 11310.10 | 22.83 | −11.4 | |||
| +fσ8 | 786.41 | 10496.00 | 8.75 | 9.79 | 1.99 | 11302.93 | 18.31 | −9.60 | |||
| +NewBAO+fσ8 | 786.11 | 10495.99 | 8.86 | 13.80 | 9.96 | 1.84 | 11316.56 | 19.23 | −10.3 | ||
| +JLA+NewBAO | 786.53 | 10495.26 | 8.83 | 695.17 | 13.67 | 1.93 | 12001.40 | 21.16 | −11.3 | ||
| +JLA+NewBAO+H(z) | 787.20 | 10495.41 | 8.56 | 695.19 | 13.78 | 16.36 | 1.85 | 12018.35 | 23.27 | −12.0 | |
| +JLA+NewBAO+H(z)+fσ8 | 786.97 | 10495.48 | 8.71 | 695.20 | 13.74 | 16.29 | 9.87 | 1.92 | 12028.17 | 20.96 | −11.0 |
Note. Δχ2 and ln B of a non-flat ΛCDM model estimated for a combination of data sets represent the excess χ2 value and ratio of Bayesian evidence, respectively, relative to the tilted flat model for the same combination of data sets.
Download table as: ASCIITypeset image
Let us first focus on how the model fits the individual data sets. Compared to the tilted flat-ΛCDM model, the untilted non-flat ΛCDM model constrained with the Planck CMB data alone (excluding and including CMB lensing data) does worse at fitting the Planck high-ℓ Cℓ's, while it fits the low-ℓ ones a bit better. Inclusion of the non-CMB data with the CMB data also results in the best-fit untilted non-flat model providing a poorer fit to the high-ℓ TT measurements, both with and without the lensing data, compared to the tilted flat-ΛCDM case. Adding JLA SN Ia or NewBAO data to the Planck TT + lowP + lensing data improves the untilted non-flat model fit to the Planck low-ℓ TEB data. There is a tendency for the non-flat models to more poorly fit the NewBAO and H(z) data (with larger values of  and
and  ) than the flat models do, while the opposite is true for the case of the growth rate (fσ8) measurements.
Comparing results for the TT + lowP + lensing analyses, Δχ2 = 21 for the full data compilation, for the non-flat ΛCDM case relative to the flat-ΛCDM model (the second from the last column in the last row of Table 9). Unfortunately, it is unclear how to turn this into a quantitative relative probability, as the two six-parameter models are not nested (and the number of degrees of freedom of the Planck CMB anisotropy data is not available). Rather, the best-fit versions of each six-parameter model provide distinct local likelihood maxima in a larger seven-parameter model space.18 However, it is clear that the untilted non-flat ΛCDM model does not do as good a job of fitting the higher-ℓ Cℓ's as it does of fitting the lower-ℓ ones. In this context it might be relevant to note that there has been some discussion about systematic differences between constraints derived using the higher-ℓ and the lower-ℓ Planck 2015 CMB data (Addison et al. 2016; Planck Collaboration et al. 2017). Additionally, in the flat-ΛCDM model, there appear to be inconsistencies between the higher-ℓ Planck 2015 CMB anisotropy data and the South Pole Telescope CMB anisotropy data (Aylor et al. 2017).
To compare the untilted non-flat ΛCDM model with the tilted flat one, we may also use the Bayes factor B = E[nonflat]/E[flat] that is defined as a ratio of Bayesian evidence of the non-flat model relative to the flat one for the same combination of data sets. The Bayesian evidence of a model M is given by

where x indicates a data set, θ is a vector containing parameters of the model M, and π(θ is the prior on the parameters. We calculate the Bayesian evidence using the algorithm developed by Heavens et al. (2017) in which the posterior for the Bayesian evidence is obtained with the nearest-neighbor distances in parameter space. In Table 9 we list the logarithm of Bayes factor ln B for each untilted non-flat ΛCDM model relative to the tilted flat one. In all cases, we find that ln B < −5, which indicates very strong evidence that the untilted non-flat ΛCDM model is less favored than the tilted flat one (Trotta 2008). However, we again take note of possible systematic differences in the CMB data mentioned at the end of the previous paragraph (Addison et al. 2016; Aylor et al. 2017; Planck Collaboration et al. 2017) which, if real, could alter the Bayesian evidence in either direction. In addition, the Bayesian evidence we have computed here does not account for the fact that the best-fit untilted non-flat model has a lower
  than the best-fit tilted flat model (when both are fit to the cosmological data compilation we have used in our analyses here), so it is in better agreement with the lower
  determined from weak-lensing measurements.
Figures 8 and 9 show the CMB high-ℓ TT, and the low-ℓ TT, TE, EE power spectra of the best-fit tilted flat and untilted non-flat ΛCDM models, excluding and including the lensing data, respectively. The non-flat ΛCDM model constrained by adding each non-CMB data set to the Planck 2015 CMB anisotropy observations generally gives a poorer fit to the low-l EE power spectrum while it better fits the low-ℓ TT power spectrum (see the bottom left panel of Figures 8 and 9). The shape of the best-fit Cℓ power spectra of various models relative to the Planck CMB data points are consistent with the χ2 values listed in Table 9.

Figure 8. Best-fit power spectra of (a) tilted flat (top five panels) and (b) untilted non-flat ΛCDM models (bottom five panels) constrained by the Planck CMB TT + lowP data (excluding the lensing data) together with JLA SN Ia, NewBAO, H(z), and fσ8 data.
Download figure:
Standard image High-resolution image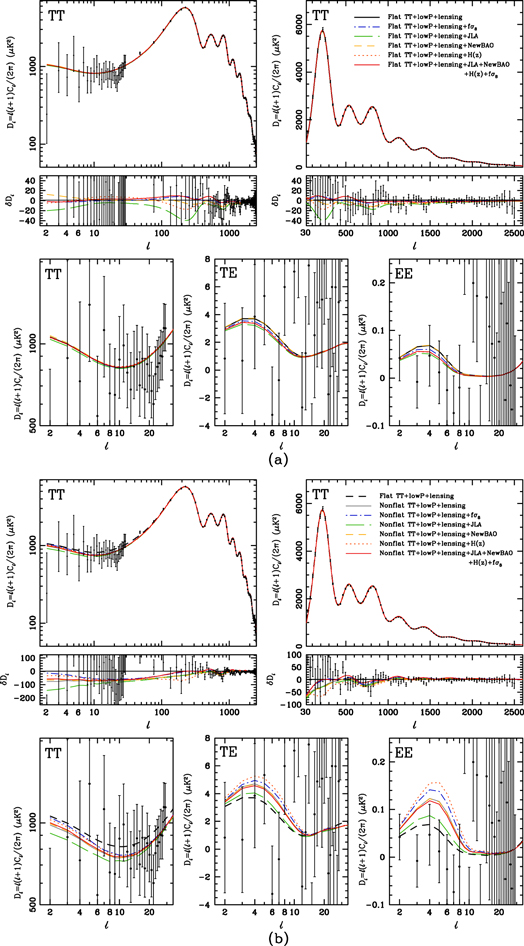
Figure 9. Same as Figure 8 but now including the lensing data.
Download figure:
Standard image High-resolution imageFigure 10 shows the best-fit initial power spectra of scalar-type fractional energy density perturbations for the non-flat ΛCDM model constrained by the Planck TT + lowP (left) and TT + lowP + lensing (right panel) data together with other non-CMB data sets. The reduction in power at low q in the best-fit closed-ΛCDM inflation model power spectra shown in Figure 10 is partially responsible for the low-ℓ TT power reduction of the best-fit untilted closed model Cℓ's (shown in the lower panels of Figures 8 and 9) relative to the best-fit tilted flat model Cℓ's. Other effects, including the usual and integrated Sachs–Wolfe effects, also play a role in affecting the shape of the low-ℓ Cℓ's. For a detailed discussion of how the interplay among these effects influence the low-ℓ shape of the Cℓ's in the open inflation case, see Górski et al. (1998).
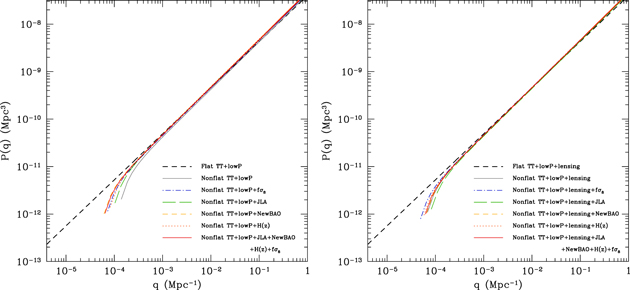
Figure 10. Power spectra of primordial scalar-type perturbations constrained by Planck TT + lowP data (left panel) and TT + lowP + lensing data (right panel). In both panels the primordial power spectrum of the best-fit tilted flat-ΛCDM model is shown as dashed curves. Note that the power spectrum of each untilted non-flat model has discrete points of normal modes with positive integers ν = qK−1/2 = 3, 4, 5, ⋯, where  and K is the spatial curvature. The power spectrum is normalized to P(q) = As at the pivot scale k0 = 0.05 Mpc−1.
Download figure:
Standard image High-resolution image5. Conclusion
We use the tilted flat-ΛCDM and the untilted non-flat ΛCDM inflation models to measure cosmological parameters from a carefully gathered compilation of observational data, the largest such collection utilized to date.
Our main results, in summary, are:
- 1.Using a consistent power spectrum for energy density inhomogeneities in the untilted non-flat model, we confirm, with greater significance, the Ooba et al. (2018a) result that cosmological data does not demand spatially flat hypersurfaces. These data (including CMB lensing measurements) favor a closed universe at more than 5σ significance, with spatial curvature contributing about a percent to the current cosmological energy budget.
- 2.The best-fit untilted non-flat ΛCDM model provides a better fit to the low-ℓ temperature anisotropy Cℓ's and better agrees with the σ8–Ωm DES constraints, but does worse than the best-fit tilted flat-ΛCDM model in fitting the higher-ℓ temperature anisotropy Cℓ's.19
- 3.H0 measured in both models are almost identical, and consistent with most other measurements of H0. However, as is well known, an estimate of the local expansion rate (Anderson & Riess 2018) is 2.7σ larger.
- 4.σ8 measured in both models are identical and consistent with the recent DES measurement (DES Collaboration et al. 2018a).
- 5.The measured Ωm is more model-dependent than the measured σ8 and the Ωm value measured using the non-flat ΛCDM model is more consistent with the recent DES measurement (DES Collaboration et al. 2018a).
- 6.Ωbh2, τ, Ωch2, and some of the other measured cosmological parameter values are quite model-dependent. For such parameters, caution is called for when comparing a value measured in a cosmological model to a value determined using another technique.
Overall, the tilted flat-ΛCDM model has a lower χ2 than the untilted non-flat ΛCDM case and thus is more favored. On the other hand, the untilted non-flat ΛCDM model has other advantages, including having a lower Ωm. It is possible that a more complete understanding of systematic differences between constraints derived using the lower-ℓ and higher-ℓ Planck CMB anisotropy data, as well as a more complete understanding of the differences between the Planck and South Pole Telescope CMB anisotropy data, might have some bearing on these issues.
We acknowledge valuable discussions with J. Ooba. C.-G.P. was supported by the Basic Science Research Program through the National Research Foundation of Korea (NRF) funded by the Ministry of Education (No. 2017R1D1A1B03028384). B.R. was supported in part by DOE grant DE-SC0019038.
Footnotes
- 3
The CMB anisotropy data also do not require flat spatial geometry in the seven-parameter non-flat XCDM inflation model (Ooba et al. 2018b; Park & Ratra 2019b). Here, the equation of state relating the pressure and energy density of the dark-energy fluid is pX = w0ρX and w0 is the additional, seventh parameter. XCDM is often used to model dynamical dark energy but is not a physically consistent model, as it cannot describe the evolution of energy density inhomogeneities. Also, XCDM does not accurately model ϕCDM (Peebles & Ratra 1988; Ratra & Peebles 1988) dark-energy dynamics (Podariu & Ratra 2001). In the simplest, physically consistent, seven-parameter, non-flat ϕCDM inflation model (Pavlov et al. 2013)—in which a scalar field ϕ with potential energy density V(ϕ) ∝ ϕ−α is the dynamical dark energy and α > 0 is the seventh parameter that governs dark-energy evolution—Ooba et al. (2018c) again found that CMB anisotropy data do not require flat spatial hypersurfaces (also see Park & Ratra 2018). (In both the non-flat XCDM and ϕCDM cases, ns is again replaced by Ωk.).
- 4
- 5
- 6
Early developments include Samushia & Ratra (2006), Samushia et al. (2007), and Chen & Ratra (2011b); recent work includes Tripathi et al. (2017), Lonappan et al. (2017), Rezaei et al. (2017), Magana et al. (2018), Anagnostopoulos & Basilakos (2018), Yu et al. (2018), and Cao et al. (2018). We note that there are many different H(z) compilations discussed in the literature. Unfortunately, a significant fraction of these include non-independent or unreliable measurements.
- 7
- 8
The redshift range over which the Hubble parameter has been measured encompasses the redshift of the cosmological deceleration-acceleration transition in the standard cosmological model. This transition is between the earlier nonrelativistic-matter-powered decelerating cosmological expansion and the more recent dark-energy-driven accelerating cosmological expansion. This transition redshift has recently been measured and is at roughly the value expected in the standard ΛCDM and other dark-energy models (Farooq & Ratra 2013; Moresco et al. 2016; Farooq et al. 2017).
- 9
Using this expression for the power spectrum (in the seven-parameter non-flat ΛCDM model) in analyses of the Planck 2015 data, Planck Collaboration et al. (2016) finds ns = 0.9717 ± 0.0066 in the TT + lowP case (Planck Collaboration 2015, Table 19.1); because ns
 1 it is unclear what significance this result has.
 - 10
For parameter estimation using the JLA SN Ia data set we need to consider hidden nuisance parameters, αJLA and βJLA, related to the stretch and color correction of the SN Ia light curves, B-band absolute magnitude MB, and the offset of the absolute magnitude due to the environment (host stellar mass) ΔM. Thus, the number of degrees of freedom for the JLA data is less than the total number of SN Ia (N = 740). For example, for the flat-ΛCDM model that fits the matter density parameter Ωm, αJLA, βJLA, MB, and ΔM, the number of degrees of freedom becomes 735 (=740–5). In our analysis, we assume flat priors for these parameters (0.01 ≤ αJLA ≤ 2 and 0.9 ≤ βJLA ≤ 4.6) during parameter estimation.
- 11
Note that Ooba et al. (2018a) use CLASS θ, which is defined as the ratio of comoving sound horizon to the angular diameter distance at decoupling, while here we use CAMB θMC, which is an approximate version of θ.
- 12
We did not check what happens when just H(z) data are added to the CMB and NewBAO combination, but suspect a similar conclusion holds for this case also.
- 13
It is possible to assume that all one-dimensional likelihoods are close to Gaussian, except for Ωk estimated using the TT + lowP, TT + lowP + H(z), and TT + lowP + fσ8 data.
- 14
- 15
This local measurement is 2.7σ (of the quadrature sum of the two error bars) higher than H0 measured in both models. We note that some other local expansion rate measurements find a slightly lower H0 with larger error bars (Rigault et al. 2015; Zhang et al. 2017; Dhawan et al. 2018; Fernández Arenas et al. 2018).
- 16
A compilation of measured primordial deuterium abundances mildly favors the flat case (Penton et al. 2018).
- 17
Our minimum χ2 values are very similar to those supplied by the Planck team. For the tilted flat-ΛCDM model constrained with TT + lowP data, the Planck team provides χ2 estimated from Powell's minimization method:
, , , with total χ2 = 11261.9. - 18
The energy density inhomogeneity power spectrum for this seven-parameter tilted non-flat ΛCDM model is not known.
- 19


