


Abstract
Following the discovery of the T8 subdwarf WISE J200520.38+542433.9 (Wolf 1130C), which has a proper motion in common with a binary (Wolf 1130AB) consisting of an M subdwarf and a white dwarf, we set out to learn more about the old binary in the system. We find that the A and B components of Wolf 1130 are tidally locked, which is revealed by the coherence of more than a year of V-band photometry phase-folded to the derived orbital period of 0.4967 days. Forty new high-resolution, near-infrared spectra obtained with the Immersion Grating Infrared Spectrometer provide radial velocities and a projected rotational velocity (v sin i) of 14.7 ± 0.7  for the M subdwarf. In tandem with a Gaia parallax-derived radius and verified tidal locking, we calculate an inclination of i = 29° ± 2°. From the single-lined orbital solution and the inclination we derive an absolute mass for the unseen primary (
 M⊙). Its non-detection between 0.2 and 2.5 μm implies that it is an old (>3.7 Gyr) and cool (Teff < 7000 K) ONe white dwarf. This is the first ultramassive white dwarf within 25 pc. The evolution of Wolf 1130AB into a cataclysmic variable is inevitable, making it a potential SN Ia progenitor. The formation of a triple system with a primary mass >100 times the tertiary mass and the survival of the system through the common-envelope phase, where ∼80% of the system mass was lost, is remarkable. Our analysis of Wolf 1130 allows us to infer its formation and evolutionary history, which has unique implications for understanding low-mass star and brown dwarf formation around intermediate-mass stars.
Export citation and abstract BibTeX RIS
1. Introduction
Extreme mass-ratio systems with brown dwarf companions test our understanding of star formation and evolution (Bate et al. 2003; Bate 2009) because they are rare (Parker & Reggiani 2013; De Rosa et al. 2014). While most intermediate-mass stars are binaries or multiples (Preibisch et al. 1999; García & Mermilliod 2001), stars more massive than the Sun dominate star-forming regions and quench nearby core fragmentation and accretion (Zinnecker & Yorke 2007), which then impacts brown dwarf formation. The most likely formation path for massive brown dwarfs is core-collapse, just like stars above the hydrogen-burning limit (Bate et al. 2002). Yet, brown dwarfs may also form through fragmentation of massive circumstellar disks (Bonnell & Bate 1994; Kratter & Matzner 2006; Stamatellos & Whitworth 2011). The characterization of brown dwarfs in multiple systems, with extreme mass ratios and unique orbital parameters, is required to identify the bounds of stellar formation models (Bate 2009).
The greatest limitation to discovering low-mass companions to high-mass stars is the luminosity contrast. Faint brown dwarfs are easily hidden from observation since the mass–luminosity relation for main-sequence stars scales with luminosity approximately as the mass to the fourth power. Hence, a mass ratio >100 results in a luminosity ratio >108. T-type brown dwarfs in multiple systems are also rare, with only 5 examples out of >550 known T dwarfs (DwarfArchives.org7 ; Mace et al. 2013a; Mace 2014; Deacon et al. 2017), while theoretical calculations hint at an overall multiplicity rate of ∼10% (Bate 2009). Imaging (De Rosa et al. 2014) and spectroscopic studies (Gullikson et al. 2016) of intermediate-mass stars have recently added to the sample of high-contrast binaries, but most observable companions are not substellar. The detectability of low-mass companions is improved once the more massive star becomes a white dwarf, the system mass is reduced (Burleigh et al. 2011), and the orbital separation increases while the flux contrast decreases.
Wolf 1130 (Gl 781, LHS 482, HIP 98906) is a nearby (16.7 ±0.2 pc, Gaia Collaboration et al. 2016a, 2016b) M subdwarf (Wolf 1130A) and white dwarf (Wolf 1130B) binary with a 0.4967-day orbital period (Gizis 1998). It is also classified as a flare star with the designation V1513 Cyg. Wolf 1130C is a ∼800 K subdwarf brown dwarf with a common proper motion to Wolf 1130AB and a projected separation of ∼3150 au (Mace et al. 2013b). The now abundant sample of late-type T dwarfs has similar surface temperatures to Wolf 1130C but they are not direct counterparts (Logsdon et al. submitted). De Rosa et al. (2014) seem to have found a young version to Wolf 1130C as a mid-type L dwarf with a mass of ∼0.050 M⊙ around an intermediate-mass star. Yet, Wolf 1130C is unique to the sample of benchmark T dwarfs because it is the oldest of the five higher-order multiple systems (Deacon et al. 2017) and is distinctly on the edge of model parameter space, with the lowest metallicity, a small radius, high mass, and large surface gravity (Mace et al. 2013b). This triple system is useful for understanding the evolution of intermediate-mass stars, close binaries, red dwarfs, and brown dwarfs.
White dwarf and M dwarf eclipsing binaries in the literature have similar 0.5–1.5-day orbital periods to Wolf 1130AB and mass ratios near unity (Maxted et al. 2004; Muirhead et al. 2013). V471 Tau is similar to Wolf 1130, both systems containing a low-mass star orbiting a white dwarf in a ∼0.5-day period with a companion near the substellar boundary (Vaccaro et al. 2015), but Wolf 1130 is old and V471 Tau is a member of the Hyades (∼800 Myr, Brandt & Huang 2015). The younger age and hotter temperature of the V471 Tau components drive significant starspots (Kundra & Hric 2011), which likely exist on Wolf 1130A at much smaller scales. Wolf 1130 is not eclipsing, but by estimating the M subdwarf radius and measuring v sin i we can determine the inclination and derive the absolute mass for the unseen white dwarf. We find that Wolf 1130AB is an evolved, pre-cataclysmic version of the intermediate-mass star and M dwarf binaries that Gullikson et al. (2016) characterized. Additionally, this is the nearest ultramassive white dwarf (Cummings et al. 2016), and a potential SN Ia progenitor.
2. Observations
2.1. Optical Photometry
We obtained V-band CCD photometry of Wolf 1130AB using the Lowell 31 inch (0.7 m effective aperture) telescope in robotic mode on 61 nights between UT dates 2014 July 19 and 2015 November 03. Usually, several visits were made each night with the field above 2.5 airmasses, but on several occasions continuous observations were obtained in hopes of resolving the period alias near one day. A total of 1170 observations were obtained. The data were reduced via aperture photometry using four comparison stars in the 15' × 15' field and the magnitude zero-point was adjusted approximately to standard V.
A periodogram of the photometry constructed using the NASA Exoplanet Archive Periodogram Tool8 and the Plavchan et al. (2008) algorithms reveals two major photometric periods. The primary peak in the periodogram is at 0.9885 ± 0.0003 days. However, this ∼1 day period clusters most photometry at phases between 0.4 and 0.9.9 The second peak in the periodogram is similar in power to the primary peak and provides a period of 0.4966 ± 0.0001 days, which is consistent with the orbital period. Figure 1 shows the Wolf 1130AB V-band photometry, listed in Table 1, phase-folded to the orbital period of the system. The average relative uncertainty in the photometry is 0.003 mag and the binned photometry has errors on the order of the symbol size (0.0003 mag.). The coherence of the photometry when phase-folded to the orbital period and corrected for orbital effects is consistent with Wolf 1130AB being tidally locked, which we discuss more in Section 4.1.

Figure 1. V-band photometric measurements of Wolf 1130AB phase-folded to the orbital period of 0.4967 days. The average relative uncertainty, 0.003 magnitudes, is shown in the upper corner. Binned photometry is shown for every 0.05 phase with bin widths of 0.1 phase (red circles). The horizontal line marks the average magnitude. We see no outbursts or eclipses in our V-band observations across 472 days of observation.
Download figure:
Standard image High-resolution imageTable 1. V-band Photometry of Wolf 1130AB
| MJD | V-band | σV | Relative Phasea |
|---|---|---|---|
| (mag.) | (mag.) | ||
| 56857.16630 | 11.849 | 0.003 | 0.951 |
| 56857.16745 | 11.851 | 0.003 | 0.953 |
| 56857.16860 | 11.851 | 0.003 | 0.955 |
| 56857.16976 | 11.852 | 0.003 | 0.958 |
| 56857.17091 | 11.850 | 0.003 | 0.960 |
| 56857.17206 | 11.850 | 0.003 | 0.962 |
| 56857.17322 | 11.849 | 0.003 | 0.965 |
| 56857.17438 | 11.854 | 0.003 | 0.967 |
| 56857.17553 | 11.849 | 0.003 | 0.969 |
| 56857.17668 | 11.851 | 0.003 | 0.971 |
| 56857.17783 | 11.852 | 0.003 | 0.974 |
| 56857.17899 | 11.849 | 0.003 | 0.976 |
| 56857.18813 | 11.852 | 0.003 | 0.995 |
| 56857.18928 | 11.852 | 0.003 | 0.997 |
| 56857.19044 | 11.856 | 0.003 | 0.999 |
| 56857.19159 | 11.856 | 0.003 | 0.002 |
| 56857.19274 | 11.858 | 0.003 | 0.004 |
| 56857.19714 | 11.858 | 0.003 | 0.013 |
| 56857.19829 | 11.854 | 0.003 | 0.015 |
| 56857.19945 | 11.852 | 0.003 | 0.017 |
Note. This is an abbreviated table—the full table has 1170 entries.
aIn this work phase = 0 at inferior conjunction.Only a portion of this table is shown here to demonstrate its form and content. A machine-readable version of the full table is available.
Download table as: DataTypeset image
More than 750 observations of Wolf 1130 are included in the ASAS-SN database (Shappee et al. 2014; Kochanek et al. 2017).10
The real-time aperture extraction operates at fixed, user-provided coordinates and the photometry of Wolf 1130 decreases with time (∼0.4 mag over ∼3.5 years). However, this decrease could be due to variability in the star or the changing position (∼1 5 per year) of Wolf 1130 relative to the fixed aperture. Some of the ASAS-SN photometric measurements are significantly higher than the baseline, supporting the flare star designation for Wolf 1130, although we see no outbursts or eclipses in our V-band observations over 472 days. We do not consider the ASAS-SN photometry further in our analysis since the uncertainties are more than twice the amplitude of variation shown in Figure 1.
2.2. Optical Spectroscopy
Wolf 1130AB was observed on 2003 August 10 UT (JD 2452861.81501511 ) with the Space Telescope Imaging Spectrograph (STIS) on the Hubble Space Telescope (HST) as part of the Next Generation Spectral Library program (Gregg et al. 2006) and is publicly available on The Mikulski Archive for Space Telescopes (MAST). The STIS spectrum covers wavelengths between 1675 and 10196 Å with a spectral resolution of ∼4 Å. Another optical spectrum of Wolf 1130AB from the Mark III spectrograph at MDM Observatory was taken on 2011 May 08 UT (JD 2455689.995729). The spectrum was originally part of the catalog of low-mass stars characterized by Gaidos et al. (2014) and covers between 6200 and 8300 Å at a resolution of 5.4 Å. A third optical spectrum was acquired with DoubleSpec at Palomar Observatory on 2014 June 25 UT (JD 2456833.884028). The DoubleSpec blue channel covers 4100–7100 Å at a resolution of 3.5 Å and we do not use the red channel data in this work because of telluric contamination and poor flux normalization. Figure 2 shows the HST/STIS spectrum, which has the highest signal-to-noise ratio and broadest spectral coverage out of the three optical spectra. The prominent emission features observed in each optical spectrum are highlighted in Figure 3. Gizis (1998) found no correlation of the Hα emission with orbital phase.

Figure 2. The HST/STIS spectrum of Wolf 1130AB where signal-to-noise is >5. Mg ii and Hα emission are marked. The inclusion of the best-fit BT-SETTL model (Allard 2014) with Teff = 3500 K, log g = 4.83, and [Fe/H] = −1.3 illustrates the absence of flux from the more massive companion. Scaled Planck functions for 7000, 10,000, 15,000, and 20,000 K blackbodies are included for comparison. As discussed in Section 4.2, we find the temperature of the massive companion to be ≤7000 K when we assume a white dwarf radius of 0.005 R⊙.
Download figure:
Standard image High-resolution image
Figure 3. Emission lines in the Wolf 1130AB spectra observed with HST/STIS (solid line), Palomar/DoubleSpec (dashed line), and MDM (red line). Each panel is 10 nm wide and the flux scale on the right is for the Hα panel only. Although variable, Gizis (1998) found no correlation of the emission with orbital phase.
Download figure:
Standard image High-resolution image2.3. Infrared Spectroscopy
A near-infrared spectrum of Wolf 1130AB was obtained using the SpeX spectrograph (Rayner et al. 2003) on the NASA Infrared Telescope Facility (IRTF) on 2013 May 15 UT. Employing the short cross-dispersed mode and the 03 × 15'' slit, we obtained simultaneous coverage from 0.7 to 2.5 μm at R ≃ 2000. The target was observed at two positions along the slit for sky background subtraction. Six pairs were taken in total. The spectrum was flat-fielded, extracted, wavelength-calibrated, and stacked using the SpeXTool package (Cushing et al. 2004), which provided a final S/N > 150 per resolution element in the H-band. An A0V-type star was observed immediately after the target and was used for telluric correction using the xtellcor package (Vacca et al. 2003).
Wolf 1130AB was observed with Immersion Grating Infrared Spectrometer (IGRINS) 40 times between 2014 July 11 and 2015 August 05 UT at McDonald Observatory. A log of the observations is provided in Table 2. IGRINS is unique in its ability to observe the entire H- and K-bands (1.45–2.5 μm) in a single exposure at R ≈ 45,000 (Yuk et al. 2010; Park et al. 2014; Mace et al. 2016b). Each resolution element is ∼7  and there are more than 20,000 resolution elements in a single IGRINS spectrum. At the heart of IGRINS is a silicon immersion grating (Marsh et al. 2007; Gully-Santiago et al. 2012), which amplifies the dispersion by the index of refraction (n ≈ 3.4 for silicon at 130K, Frey et al. 2006). The IGRINS data reduction pipeline (Lee & Gullikson 2016)12
employs flat lamps from the IGRINS calibration unit to derive pixel variance, night-sky OH emission and telluric absorption lines for wavelength calibration, and the optimal extraction methods of Horne (1986) to produce 1D spectra. The final pipeline output consists of 44 spectral orders (23 in H and 21 in K), with ∼10% spectral overlap between orders. Telluric absorption relies on division by an A0V star observed at a similar airmass to each observation and multiplied by the Kurucz (1979, 2011)13
Vega model.
and there are more than 20,000 resolution elements in a single IGRINS spectrum. At the heart of IGRINS is a silicon immersion grating (Marsh et al. 2007; Gully-Santiago et al. 2012), which amplifies the dispersion by the index of refraction (n ≈ 3.4 for silicon at 130K, Frey et al. 2006). The IGRINS data reduction pipeline (Lee & Gullikson 2016)12
employs flat lamps from the IGRINS calibration unit to derive pixel variance, night-sky OH emission and telluric absorption lines for wavelength calibration, and the optimal extraction methods of Horne (1986) to produce 1D spectra. The final pipeline output consists of 44 spectral orders (23 in H and 21 in K), with ∼10% spectral overlap between orders. Telluric absorption relies on division by an A0V star observed at a similar airmass to each observation and multiplied by the Kurucz (1979, 2011)13
Vega model.
Table 2. IGRINS Derived Radial Velocities of Wolf 1130A
| UT Date | MJD | v1 | σv1 | Relative Phasea |
|---|---|---|---|---|
| YYYYMMDD | (km s−1) | (km s−1) | ||
| 2014 Jul 11 | 56849.3578 | 84.08 | 0.18 | 0.230 |
| 2014 Sep 24 | 56924.0988 | −151.07 | 0.16 | 0.704 |
| 2014 Oct 10 | 56940.0670 | −130.21 | 0.16 | 0.852 |
| 2014 Oct 10 | 56940.1324 | −44.61 | 0.16 | 0.984 |
| 2014 Oct 10 | 56940.2080 | 58.04 | 0.16 | 0.136 |
| 2014 Oct 11 | 56941.0636 | −127.31 | 0.16 | 0.859 |
| 2014 Oct 18 | 56948.2753 | 49.26 | 0.17 | 0.378 |
| 2014 Nov 25 | 56986.1621 | −132.98 | 0.16 | 0.654 |
| 2014 Nov 25 | 56986.1758 | −144.01 | 0.16 | 0.682 |
| 2014 Nov 25 | 56986.1908 | −150.39 | 0.16 | 0.712 |
| 2014 Nov 26 | 56987.0405 | 25.71 | 0.16 | 0.423 |
| 2014 Nov 26 | 56987.0554 | 2.68 | 0.16 | 0.452 |
| 2014 Nov 26 | 56987.0864 | −43.64 | 0.16 | 0.515 |
| 2014 Nov 26 | 56987.1020 | −66.29 | 0.16 | 0.546 |
| 2014 Nov 26 | 56987.1123 | −87.21 | 0.16 | 0.567 |
| 2014 Nov 26 | 56987.1471 | −129.06 | 0.16 | 0.637 |
| 2014 Nov 26 | 56987.1643 | −140.73 | 0.16 | 0.672 |
| 2014 Nov 26 | 56987.1781 | −148.86 | 0.16 | 0.700 |
| 2015 Jun 11 | 57184.3367 | −123.18 | 0.16 | 0.633 |
| 2015 Jun 11 | 57184.3931 | −154.80 | 0.16 | 0.747 |
| 2015 Jun 11 | 57184.4322 | −141.43 | 0.16 | 0.825 |
| 2015 Jun 12 | 57185.3596 | −146.87 | 0.16 | 0.693 |
| 2015 Jul 01 | 57204.3627 | −70.09 | 0.16 | 0.951 |
| 2015 Jul 01 | 57204.3847 | −38.69 | 0.16 | 0.995 |
| 2015 Jul 02 | 57205.3419 | −89.56 | 0.16 | 0.922 |
| 2015 Jul 02 | 57205.3614 | −61.59 | 0.16 | 0.962 |
| 2015 Jul 03 | 57206.2948 | −135.68 | 0.16 | 0.841 |
| 2015 Jul 03 | 57206.3429 | −79.37 | 0.16 | 0.938 |
| 2015 Jul 03 | 57206.4369 | 54.24 | 0.16 | 0.127 |
| 2015 Jul 03 | 57206.4610 | 74.78 | 0.16 | 0.175 |
| 2015 Aug 04 | 57238.2906 | 87.69 | 0.16 | 0.257 |
| 2015 Aug 04 | 57238.3074 | 82.75 | 0.16 | 0.291 |
| 2015 Aug 05 | 57239.2435 | 76.18 | 0.16 | 0.175 |
| 2015 Aug 05 | 57239.2697 | 87.09 | 0.16 | 0.228 |
| 2015 Aug 05 | 57239.2834 | 87.46 | 0.16 | 0.256 |
| 2015 Aug 05 | 57239.2974 | 84.98 | 0.16 | 0.284 |
| 2015 Aug 05 | 57239.3299 | 64.13 | 0.16 | 0.349 |
| 2015 Aug 05 | 57239.3445 | 49.53 | 0.16 | 0.379 |
| 2015 Aug 05 | 57239.3584 | 32.43 | 0.16 | 0.407 |
| 2015 Aug 05 | 57239.3894 | −10.38 | 0.17 | 0.469 |
Note.
aIn this work phase = 0 at inferior conjunction.Download table as: ASCIITypeset image
All 40 IGRINS spectra have been combined into a single spectrum by shifting to a common wavelength and then re-binning the flux in 0.00001 μm bins while removing 3σ outliers. The uncertainty in the combined spectrum is the standard deviation of the mean of all flux measurements in a bin. The resultant spectrum has an average uncertainty of ∼0.15% (signal-to-noise ∼650). In Figure 4 we compare Wolf 1130AB to the field star Gl 494 (Teff = 3570 K, v sin i = 10  , [Fe/H] ∼ +0.2 dex, log g = 4.5 dex; Jenkins et al. (2009), Lépine et al. (2013), Neves et al. (2013)), which was observed with IGRINS on 2015 April 02 UT. Wolf 1130A and Gl 494 are essentially the same temperature and have similar v sin i, but differences in metallicity and surface gravity produce contrasting line depths. The entire combined IGRINS spectrum of Wolf 1130AB is presented in Figure 5 with lines identified using the Arcturus atlas of Hinkle et al. (1995) and molecular line lists from HITRANonline (Rothman et al. 2013). Most unmarked lines are H2O and too numerous to label. We do not measure any variation in the line profiles or depths between epochs. The remaining uncertainties in the combined spectrum are primarily a result of variance in the telluric absorption between epochs of observation.
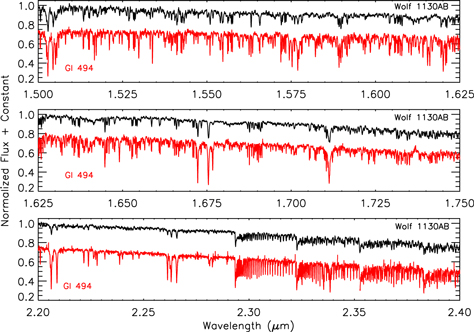
Figure 4. IGRINS spectra of Wolf 1130AB and Gl 494 shifted to a common wavelength. Both have spectral types of ∼M2 and comparable rotational velocities, but Gl 494 has super-solar metallicity, while Wolf 1130A is a subdwarf.
Download figure:
Standard image High-resolution image
Download figure:
Standard image High-resolution image
Download figure:
Standard image High-resolution image
Download figure:
Standard image High-resolution image
Download figure:
Standard image High-resolution image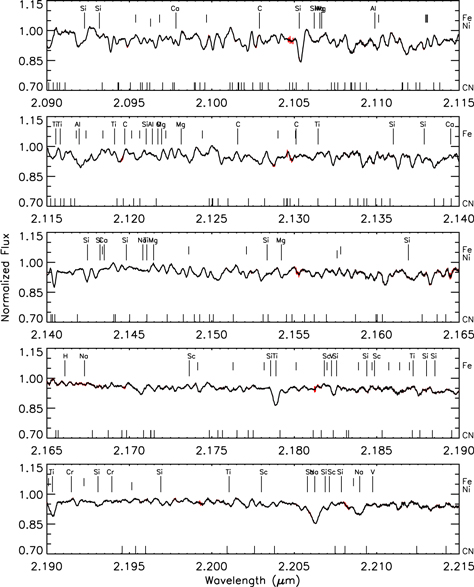
Download figure:
Standard image High-resolution image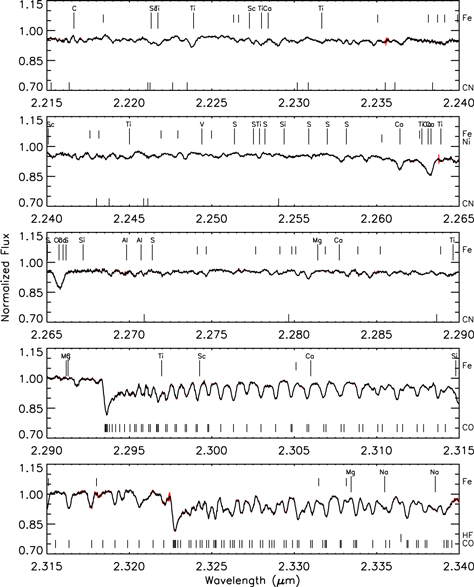
Download figure:
Standard image High-resolution image
Figure 5. Combined IGRINS spectrum of Wolf 1130AB (black line) with 1σ uncertainties (red region). By velocity-shifting and median-combining 40 epochs, a signal-to-noise ∼650 spectrum is produced that spans the entire H and K atmospheric windows. Line identifications from the Arcturus atlas (Hinkle et al. 1995) and HITRANonline (Rothman et al. 2013) are labeled on the plot. Atomic lines that are too abundant to label above the spectrum (Fe and Ni) are labeled on the right margin with marks above the spectrum. Molecular lines (OH, CO, and CN) are also labeled in the right margin, but with identification marks below the spectrum.
Download figure:
Standard image High-resolution image2.4. Parallax Measurements
There are a number of parallax measurements in the literature for Wolf 1130 that place it between 14.9 and 17.5 pc from the Sun (Harrington & Dahn 1980; van Altena et al. 1995; van Leeuwen 2007). Gaia Data Release 1 (DR1, Gaia Collaboration et al. 2016a, 2016b; Lindegren et al. 2016) adds a new parallax to the sample, π = 59.91 ± 0.55 mas, which is consistent with, and more precise than, previous measurements. The distance to Wolf 1130 from the Gaia DR1 parallax is 16.7 ± 0.2 pc, which we adopt for all our analyses.
3. Orbital Properties
3.1. Radial Velocity Determination
Gizis (1998) derived 27 radial velocities for Wolf 1130A by cross-correlating 0.3 Å resolution visible-light spectra (4700 to 9600 Å). Most of the observations from Gizis (1998) were obtained on two adjacent nights in 1996 August and have typical uncertainties of ±2  . The combination of those observations with 40 IGRINS epochs produces a baseline of almost 20 years.
IGRINS radial velocities were derived using the method summarized in Mace et al. (2016a). For each of the 40 epochs of observation, the 44 orders of IGRINS spectra were cross-correlated against the other epochs and 185 other M dwarfs observed with IGRINS. The relative velocities were converted to absolute velocities by determining the zero-point offset relative to radial velocities in the literature (Nidever et al. 2002; Maldonado et al. 2010; Chubak et al. 2012; Shkolnik et al. 2012; Naud et al. 2014) for 103 of the other M dwarfs. This method provides radial velocities that are precise to σ = 160 m s−1, with the uncertainty primarily set by the zero-point uncertainty in the literature for the M dwarf sample. Table 2 lists the radial velocities for each IGRINS observation of Wolf 1130AB.
3.2. Orbital Solution
The orbital parameters in Table 3 were determined by fitting the visible-light and infrared radial velocities separately and also as a combined set. We used the Systemic Console 2 software package (Meschiari et al. 2009; Meschiari & Laughlin 2010) to find the orbital solution and its uncertainties with the constant assumption that Wolf 1130A has a mass of 0.3 M⊙ (this assumption is motivated in Section 4.1). The best fit we find to the 27 radial velocities in Gizis (1998) is most similar to solution C in Table 3 of that paper. The most notable aspect of the fit to the visible-light radial velocities is the non-zero eccentricity, which is surprising given the systems old age and short orbital period.
Table 3. Orbital Elements and Derived Properties
| Individual Fit | Combined Fit | ||||
|---|---|---|---|---|---|
| Element/Property | Visible Light | Infrared | Free-parameter | Fixed e = 0 | Fixed e = 0, i = 29 |
| P (days) | 0.4967013 ± 0.0000006 | 0.4967040 ± 0.0000007 | 0.49670419 ± 0.00000004 | 0.49670418 ± 0.00000005 | 0.49670418 ± 0.00000005 |
γ ( ) ) |
−34.1 | −33.5 | −33.2 | −33.2 | −33.2 |
| e | 0.011 ± 0.003 | 0.002 ± 0.002 | 0.002 ± 0.002 | 0a | 0a |
| ω (degrees) | 210 ± 19 | 160 ± 73 | 164 ± 62 | 163 ± 24 | 164 ± 18 |
| T (MJD) | 49559.04 ± 0.03 | 56849.09 ± 0.10 | 56849.10 ± 0.09 | 56849.10 ± 0.03 | 56848.942 ± 0.03 |
| MA (M⊙) | 0.30a | 0.30a | 0.30a | 0.30a | 0.30a |
| MB sin i (M⊙) | 0.341 ± 0.002 | 0.332 ± 0.001 | 0.332 ± 0.001 | 0.332 ± 0.001 | 1.242 ± 0.005b |
| a sin i (au) | 0.01058 ± 0.00001 | 0.010537 ± 0.000005 | 0.010537 ± 0.000005 | 0.010537 ± 0.000005 | 0.014183 ± 0.000015c |
K ( ) ) |
123.3 ± 0.5 | 121.3 ± 0.2 | 121.3 ± 0.2 | 121.3 ± 0.2 | 121.3 ± 0.2 |
| χreduced2 | 0.38 | 70.52 | 40.61 | 41.54 | 42.25 |
| N | 27 | 40 | 67 | 67 | 67 |
Notes.
aThis is a fixed parameter. bi = 29 and this is MB, the mass of the white dwarf. ci = 29 and this is a, the orbital separation.Download table as: ASCIITypeset image
A similar fit to the 40 infrared radial velocities alone produces a couple of notable differences relative to the visible-light fit. One difference is that the reduced chi-squared value for the fit is much larger because of the order of magnitude smaller uncertainties on the IGRINS residual radial velocities. Next, the eccentricity is consistent with zero in the infrared-only fit. The implication of an eccentricity of zero in the infrared and non-zero in the visible-light data is consistent with the V-band variations we observe, which are discussed in the next section on radial velocity residuals. Changes in the other orbital parameters are within the uncertainties and consistent with the larger reduced chi-square of the infrared-only fit.
Combining the visible-light and infrared radial velocities improves the precision on the orbital period by an order of magnitude. The larger number of infrared radial velocities, in combination with their smaller uncertainties, causes the combined fit to be most consistent with the infrared-only solution. The combined visible light and infrared orbital solution for Wolf 1130AB, where only the mass of Wolf 1130A is fixed and all other parameters are determined, is shown in Figure 6.
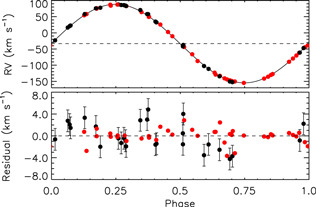
Figure 6. Top: phase-folded radial velocities for the M subdwarf, Wolf 1130A, and the derived radial velocity curve for the combined visible-light and infrared observations. Our preferred orbital solution combines 67 radial velocities, fixed values for eccentricity (0) and inclination (29°), and is provided in Table 3. Visible-light radial velocities are from Gizis (1998, black points) and infrared radial velocities are from this work (red points). Bottom: combined velocity residuals for the visible-light (black) and infrared (red) observations with eccentricity fixed at zero. The standard deviations of the velocity residuals are σ = 2.5  for the visible-light data and σ = 1.3
  in the infrared.
Download figure:
Standard image High-resolution image3.3. Radial Velocity Residuals
As an active star, measurements of Wolf 1130A are expected to behave like a young star and show radial velocity jitter on the order of a few 100 m s−1 at infrared wavelengths, but as high as 2  in visible-light spectra (Mahmud et al. 2011). Velocity residuals for the combined orbital solution of Wolf 1130, with e = 0, are shown in Figure 6 and are larger in the visible-light data (σ = 2.5
  ) than the infrared (σ = 1.3
  ). Differences in the amplitude of variation implies that temperature variations are present on the stellar surface (Prato et al. 2008) at a 2:1 ratio that is similar to T Tauri stars (Crockett et al. 2012). Figure 7 compares the binned photometry to the velocity residual at the same phases and reveals a trend. Overall, the visible-light radial velocities are blueshifted when the M subdwarf is brighter and redshifted when it is fainter. This pattern holds true over the ∼20-year baseline between spectroscopic observations and for the V-band photometry presented here. Though smaller than the visible-light residuals, the IGRINS infrared radial velocity residuals are non-zero and show amplitude variations as a function of time, which would require long-lived, phase-dependent sources of variation. As we discuss in Section 4.1, surface temperature gradients, tidal elongation of the M dwarf, and Doppler beaming effects cause variability that are fixed with phase. These effects can also produce an offset photocenter, which explains part of the V-band variability and the non-zero eccentricity derived from the visible-light data.

Figure 7. Binned photometry plotted against the combined orbital solution radial velocity residuals for the same phases. Visible-light (black) and infrared (red) observations both show variation, but with differing amplitudes. The trend for the visible-light radial velocity residuals show a blueshift when the M subdwarf is brighter and a redshift when the M dwarf is fainter.
Download figure:
Standard image High-resolution image4. Physical Parameters
Mace et al. (2013b) presented the discovery of Wolf 1130C and infrared magnitudes of the Wolf 1130AB system can be found in Table 1 of that paper. Newly determined parameters for Wolf 1130 are listed in Table 4 of this work.
Table 4. Physical Parameters for Wolf 1130A
| Element/Property | Measurement |
|---|---|
| Gaia Parallax (mas) | 59.91 ± 0.55 |
| Distance (pc) | 16.69 ± 0.15 |
| Parallax Radiusa (R⊙) | 0.302 ± 0.009 |
| Model Radiusb (R⊙) | 0.289 ± 0.011 |
| Parallax Massc (M⊙) | 0.308 ± 0.016 |
| Model Massb (M⊙) | 0.297 ± 0.011 |
| i (°) | 29 ± 2 |
v sin i ( ) ) |
14.7 ± 0.7 |
| Teff d (K) | 3530 ± 60 |
| log gd (dex) | 4.9 |
| B-field (kG) | <3 |
| Age (Gyr) | >10 |
| [M/H] (dex) | −0.45 ± 0.12e |
| [Fe/H] (dex) | −0.70 ± 0.12, −0.64 ± 0.17e, −0.62 ± 0.10f |
| [Ti/H] (dex) | −0.22 ± 0.09f |
| [O/H] (dex) | −0.5 ± 0.1, −0.45 ± 0.11g |
| [Ca/H] (dex) | −0.20 ± 0.05 |
Notes.
aMK–Radius–[Fe/H] relationship from Mann et al. (2015). bDartmouth Stellar Evolution Models (Dotter et al. 2008). cMK–Mass relationship from Benedict et al. (2016). dWeighted average determined from fits to MDM and STIS spectra. eRojas-Ayala et al. (2012). fWoolf & Wallerstein (2006). gSchmidt et al. (2009).Download table as: ASCIITypeset image
4.1. Wolf 1130A—M Subdwarf
The radial velocity variability of Wolf 1130A was first identified by Joy (1947). Standard practice is to define the brightest component of a system as the A component (Hartkopf & Mason 2004), however, in a mass donor scenario like a cataclysmic variable, mass is transferred from the secondary to the more massive primary (Ritter & Kolb 1998). In the Wolf 1130 system the most massive component is the white dwarf, but it remains undetected and we call it Wolf 1130B. Wolf 1130A is the M subdwarf that will become the mass donor of the system and is the most luminous component.
- 1.Tidal Locking. There are three primary components of light curve modulation created by the influence of a close companion (Shporer 2017). The phase dependence of each of these are shown in Figure 8. We determine the ellipsoidal variability ((1.5 ± 0.7) × 10−3 mag) using Equation (7) of Zucker et al. (2007), with gravity- and limb-darkening coefficients taken from Claret & Bloemen (2011) for the V-band assuming Teff = 3500 K, log g = 5 dex, Z = −0.5 dex. The beaming effect is caused by Doppler shifts in the spectrum and is determined by integrating the spectrum within a photometric bandpass (Bloemen et al. 2011). We derive the beaming variability ((8 ± 3) × 10−4 magnitudes) by integrating the HST/STIS spectrum inside the V-band passband (551 ± 88 nm) at both ends of the radial velocity amplitude shown in Figure 6 (240 km s−1). The reflected and thermal components are negligible for Wolf 1130 since the white dwarf is cool and the separation is still relatively large (∼3 R⊙). The middle panel of Figure 8 shows the combined amplitude of variation for the calculated ellipsoidal and beaming effects. The residual variation in the light curve, right panel of Figure 8, is not caused by the orbit and is likely caused by long-lived starspots. The coherence of the residual photometry, when phase-folded to the orbital period, validates the tidal locking assumption.
- 2.Rotation. Mann et al. (2016) outlined the method used to determine rotational velocities in IGRINS spectra. The highest signal-to-noise spectrum of Wolf 1130 was matched to a BT-SETTL (Allard et al. 2012; Allard 2014) model with similar parameters to the one shown in Figure 2 (Teff = 3500 K, log g = 4.83, [Fe/H] = −1.3). The synthetic spectrum was then artificially broadened with the IDL code lsf_rotate (Gray 1992; Hubeny & Lanz 2011) and convolved with a Gaussian estimate of the instrumental broadening, which was determined from a simultaneous fit to telluric lines. Values of v sin i between 0 and 50
 were used to determine the best-fit model via chi-squared minimization. The measured v sin i and uncertainties were taken to be the median and standard deviation across all 44 IGRINS orders. For Wolf 1130A we measured v sin i =14.7 ± 0.7 . This is consistent with Stauffer & Hartmann (1986a), who measured v sin i = 15 , and is similar to v sin i = 12.7 derived by Houdebine (2010). However, Gizis (1998) estimated v sin i =30 ± 5 and this resulted in a different interpretation of how Wolf 1130B evolved. For comparison, we also determined v sin i for Gl 494 (Ross 458) from the IGRINS spectrum shown in Figure 4. Our measurement of 10.5 ± 0.6 is in good agreement with Houdebine (2010), who measured v sin i = 9.75 . Additional comparison to the models in Figure 9 supports our v sin i ∼ 15 measurement for Wolf 1130A. The v sin i we measure is high for M dwarfs as old as Wolf 1130A (Newton et al. 2016) and the typical rotation period for an old and inactive M dwarf is >10 days (Newton et al. 2017).
 - 3.Temperature and Gravity. From the MDM and STIS optical spectra of Wolf 1130A we derived an effective temperature of 3530 ± 60 K using the weighted mean from the model fit method described by Mann et al. (2013b). The best-fit model was found using the BT-SETTL model grid (Allard 2014), where 100,000 linear combinations of three synthetic spectra were used to find the best-fit linear combination. The final parameters of the best-fit model to the MDM spectrum were Teff = 3595K, log g = 4.9 dex, and [Fe/H] = −1.1 dex. For the STIS spectrum, we found Teff = 3500 K, log g = 4.83 dex, and [Fe/H] = −1.3 dex. We trust that the temperature and gravity measurements from the model fit to the broad optical spectra because the method is well-calibrated throughout the subdwarf sequence (Lépine et al. 2007).
- 4.Metallicity. We calculated [Fe/H] for Wolf 1130A using the IRTF/SpeX spectrum and following the techniques outlined by Mann et al. (2013a). That paper presented empirical relations between strong atomic lines in near-infrared M dwarf spectra and overall metallicity. These relations were calibrated using wide binaries containing an FGK primary and an M dwarf companion under the assumption of identical metallicities between binary components. In this work we adopt the mean of the H- and K-band relations [Fe/H] = −0.70 ± 0.12 as the metallicity for Wolf 1130A. Uncertainties account for Poisson errors in the spectrum as well as the scatter in the Mann et al. (2013a) calibrations.The metallicity values in the literature have a large scatter but are all significantly subsolar. As shown by Neves et al. (2012), most methods for determining metallicity diverge below −0.6 dex. Rojas-Ayala et al. (2012) derive [M/H] = −0.45 ± 0.12 and [Fe/H] =−0.64 ± 0.17 from K-band indices. Other [Fe/H] calculations include −0.80 dex (Woolf et al. 2009), −0.87 dex (Stauffer & Hartmann 1986b), −0.89 dex (Bonfils et al. 2005), and −1.02 dex (Schlaufman & Laughlin 2010). Schmidt et al. (2009) compiled [Fe/H]= −0.62 ± 0.10 and [Ti/H] = −0.22 ± 0.09 abundances for Wolf 1130A from Woolf & Wallerstein (2006), who used the MOOG spectral synthesis software (Sneden 1973). Additionally, Schmidt et al. (2009) derived [O/H] = −0.45 ± 0.11 from TiO lines in R ∼ 30,000 optical spectra. Overall, our methods are most similar to those of Rojas-Ayala et al. (2012) and Schmidt et al. (2009) and we include their measurements in Table 4.Employing the current version of the MOOG synthesis software with a Python wrapper,14 we measured abundances in the IGRINS infrared spectrum. For this synthesis we used the parameters already identified above (Teff = 3600 K, log g = 5, [M/H] = −1, and microturbulence = 1.0) to select similar atmosphere models. Our synthetic spectra employed Kurucz (1979, 2011) models that were broadened to the instrument resolution and v sin i = 15.0 and then modulated for different atomic abundances. Figure 9 shows the K-band Ca i triplet along with synthetic abundances of [Ca/H] = −0.2 ± 0.1 dex. The 10% depths of the Ca lines, relative to the continuum, are some of the deeper lines in the infrared spectrum of Wolf 1130A. H2O lines throughout the H- and K-bands, weak metal lines, and a relatively large v sin i ∼ 15 complicate a detailed abundance analysis of all the species identified in Figure 5 and prohibit our own determination of [Fe/H] from the IGRINS spectrum. For strong OH and Ca lines in the IGRINS spectrum we measure [Ca/H] = −0.20 ± 0.05 and [O/H]= −0.5 ± 0.1, consistent with Schmidt et al. (2009). The abundance ratios relative to Fe from the literature ([Ti/Fe] = 0.48 ± 0.15, [O/Fe] = 0.15 ± 0.16, [Ca/Fe] =0.5 ± 0.13) are all consistent with the alpha-element enhancements of the thick-disk population (e.g., Reddy et al. 2006; Bensby et al. 2014).
- 5.Magnetic Field. The activity–age–rotation relation predicts that M dwarfs spin down as they age and become less active (Douglas et al. 2014; Newton et al. 2016), but Wolf 1130A's rotation and activity is maintained by the tidal effects of its massive companion. With a rotation period of ∼12 hr, Wolf 1130A has an active chromosphere and we identify numerous emission lines (Figure 3). Since rotation and activity are presumed to be linked by the stellar magnetic field (Birkby et al. 2012; Newton et al. 2017), activity implies that strong fields could be present on Wolf 1130A.In order to measure the magnetic field we employed a modified version of the MOOG spectral synthesis code, called MOOGStokes15 (Deen 2013), which accounts for the Zeeman broadening of spectral lines. Using the temperature, metallicity, v sin i, and surface gravity derived in the previous sections, we synthesized Zeeman broadened spectra from MARCS atmosphere models (Gustafsson et al. 2008). Strong Na and Ti lines in the K-band are sensitive to magnetic field strength (Doppmann & Jaffe 2003; Sokal et al. 2018) and we measure an upper limit on the magnetic field of 3 kG. The limitations to this measurement are the relatively high v sin i and log g of Wolf 1130A, which broaden and weaken the lines. Above 3 kG the model Na and Ti lines are distinctly split, which is not seen in our high signal-to-noise IGRINS spectrum. Numerous active M dwarfs have 2–4 kG magnetic fields (Johns-Krull & Valenti 1996, 2000; Shulyak et al. 2014) and Wolf 1130A does not have an exceptionally strong field.
- 6.Radius. Using the Gaia DR1 parallax, we converted the 2MASS Ks magnitude for Wolf 1130A to MK =7.00 ± 0.04 mag, and along with the SpeX-derived [Fe/H], applied the empirical MK–radius–[Fe/H] relationship from Mann et al. (2015) to determine a radius of 0.302 ± 0.009 R⊙. For comparison, the Dartmouth Stellar Evolution Models (Dotter et al. 2008) produce a radius of 0.289 ± 0.011 R⊙. As noted by Boyajian et al. (2012), interior models are not fully calibrated and are generally ∼10% smaller than definitive radii from interferometric observations.
- 7.Mass. The absolute K-band magnitude also allows the application of the MK-Mass relationship from Benedict et al. (2016) to determine the mass of Wolf 1130A (0.308 ± 0.016 M⊙). The Dartmouth Stellar Evolution Models find a similar mass of 0.297 ± 0.011 M⊙. In our analysis we have chosen to fix the M subdwarf mass at 0.3 M⊙.
- 8.Rotational Inclination. Using the derived radius above and a rotation period equal to the orbital period (0.4967 days), we calculate an equatorial velocity of 30.3 ± 1.5 and the rotation axis inclination of 29° ± 2°. As we discuss in Section 5, tidal locking ensures spin–orbit alignment on short timescales, so the orbital inclination can be assumed to equal the rotational inclination.
- 9.Age. Ages of field M dwarfs from metallicity measurements are not precise (Reddy et al. 2006; Newton et al. 2014). Age–activity–rotation relations for M dwarfs (Douglas et al. 2014; Newton et al. 2017) break down in close binaries that artificially maintain high v sin i. As discussed in Mace et al. (2013b), the UVW velocities of Wolf 1130 are consistent with old disk-halo membership requirements from Leggett (1992). The old, subdwarf nature of the M star Wolf 1130A is also supported by the TiO and CaH indices from optical spectra (Reid et al. 1995; Lépine et al. 2013; Gizis et al. 2016). For a sample of F and G stars with thick-disk classifications, based on UVW velocities and metallicity like Wolf 1130A, Reddy et al. (2006) determine an age of more than 10 Gyr. We consider these kinematic properties to be the most reliable age limits for the Wolf 1130 system.


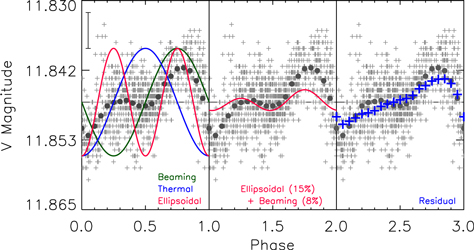
Figure 8. Wolf 1130 V-band light curve from Figure 1 with models of orbit-induced variations. Left: phase dependence of tidal elongation (ellipsoidal), thermal (day/night), and Doppler beaming variations are unique, but none are good individual matches to the data. Middle: combination of calculated ellipsoidal and beaming amplitudes accounting for ∼20% of the observed variability. Right: the coherence of the photometry after removing orbit-induced changes implies long-lived starspots and solidifies the assertion that Wolf 1130B is tidally locked.
Download figure:
Standard image High-resolution image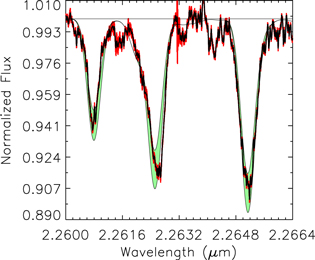
Figure 9. The 40-epoch combined K-band spectrum of the Ca i triplet in Wolf 1130A (black) with uncertainties (red). The Ca abundance is derived using the MOOG spectral synthesis software and Kurucz (1979, 2011) atmosphere models with Teff = 3600 K, log g = 5, [M/H] = −1, and microturbulence = 1.0  . The green shaded area is for an abundance of [Ca/H] = −0.2 ± 0.1 dex. The offset of the middle line is due to line location and strength deficiencies in the models. Additionally, this figure shows the agreement between our measured v sin i = 14.7 ± 0.7
  and the 15
  broadening of the model spectrum.
Download figure:
Standard image High-resolution image
4.2. Wolf 1130B—White Dwarf
The combined visible-light and infrared orbital solution produces a minimum mass for Wolf 1130B (WD 2003+542) of 0.341 M⊙. This mass is in agreement with what Gizis (1998) derived by assuming tidal locking and a model derived radius for Wolf 1130A of 0.28 R⊙ (Baraffe et al. 1997; Gizis 1997). However, the v sin i (30 ± 5  ) measured by Gizis (1998) implies a nearly edge-on orbit and results in a low-mass (M ∼ 0.35M⊙) He core white dwarf. However, we determine a mass for the primary of
  M⊙ when we make the same assumptions as Gizis (1998), with the exception of the smaller v sin i = 14.7 ± 0.7
  .
.
A model fit to the the STIS spectrum of Wolf 1130AB (Figure 2) shows that there is no excess flux above the M dwarf continuum. The H i absorption lines typical of white dwarf spectra (Wesemael et al. 1993) are not identified within the deep molecular absorption bands and H i emission of Wolf 1130A. Figure 2 includes curves for 7000, 10,000, 15,000, and 20,000 K blackbodies that are at the same distance as Wolf 1130 and have a radius of 0.005 R⊙. Blueward of 3200 Å, a Planck curve with a temperature greater than 7000 K would be measurable. Additionally, Wolf 1130 was detected by the Galaxy Evolution Explorer (Martin et al. 2005) in the near-ultraviolet (NUV, 1800–2750 Å), and its absolute NUV magnitude is consistent with early-type M dwarfs in the compilation by Lépine & Gaidos (2011).
Based on our analysis of the M subdwarf in the previous section and the lack of flux from Wolf 1130B, we posit that the primary is most likely a massive white dwarf that has cooled to <7000 K. However, a neutron star at any temperature would remain unseen since its radius would be two orders of magnitude smaller than the assumed white dwarf radius. A white dwarf that is  M⊙ may have formed from a single progenitor, or from a merger of two white dwarfs. If it formed from the merger of two ∼0.6 M⊙ CO white dwarfs, then it would be composed of CO despite its high mass. It is convenient that 0.6 M⊙ white dwarfs are the most abundant (Reid 1996; Kepler et al. 2016). However, the stability of the close M subdwarf through the post-main-sequence evolution and merger of two white dwarfs would be difficult, if not impossible, to sustain. Additionally, there is a non-zero probability that this system is not primordial and formed through dynamical interactions in a cluster environment (Kouwenhoven et al. 2010).
The most likely pathway of evolution for Wolf 1130B was with a single progenitor, which would have required an initial mass between 6 and 8 M⊙ and result in an ONe white dwarf (Catalán et al. 2008; Cummings et al. 2016). This single progenitor would have spent 50–100 Myr on the main sequence (Wood 1992; Monteiro et al. 2006). The white dwarf cooling age for Wolf 1130B depends on its composition and its temperature. An ONe white dwarf with Teff < 7000 K and a mass of 1.24+0.19−0.15 M⊙ is at least ∼3.4 Gyr old (Althaus et al. 2007). If the progenitor was 6–8 M⊙, then its main-sequence lifetime is negligible and the lower age limit for Wolf 1130B is essentially just the 3.4 Gyr cooling age (Gil-Pons & García-Berro 2001). Without directly detecting the massive primary and determining its temperature or composition, we cannot employ it to place significant bounds on the age of the Wolf 1130 system.
4.3. Wolf 1130C—T8 Subdwarf Brown Dwarf
The T8 subdwarf brown dwarf discovered by Mace et al. (2013b) has a unique spectral morphology indicative of low metallicity and high surface gravity (Logsdon et al. submitted). For an age of 10 Gyr, Baraffe et al. (2003) estimated the mass of an 800 K brown dwarf to be 0.050 M⊙ and Wolf 1130C may be older and more massive than this. These evolutionary tracks show that Wolf 1130C would have formed as a ∼2800 K late-type M dwarf. Combining evolutionary tracks with spectral type and temperature relationships (Filippazzo et al. 2015) reveals that Wolf 1130 would have become an L dwarf after ∼300 Myr and then a T dwarf after an additional 1.5 Gyr.
The new distance to Wolf 1130 derived from the Gaia DR1 parallax is ∼5% farther than what was determined from the Hipparcos parallax and changes the calculated separation of Wolf 1130C to 3150 ± 40 au. Absolute magnitudes are also slightly brighter, MH = 18.46 ± 0.10 and MW2 = 13.85 ± 0.08, but within the uncertainties presented by Mace et al. (2013b). These new absolute magnitudes maintain the subdwarf classification for Wolf 1130C, which sits below the trend line set by the rest of the T dwarf population.
Table 5 lists the T dwarfs in multiple systems tabulated by Deacon et al. (2017). Each of the five known systems is unique. Gl 570D (Burgasser et al. 2000) is the closest multiple to Earth with a wide-separation T dwarf, making it a relatively bright benchmark. Ross 458C (Burgasser et al. 2010; Goldman et al. 2010; Scholz 2010) is the youngest and Wolf 1130C (Mace et al. 2013b) is the oldest, but they have similar spectral types and effective temperatures (∼800 K). ξ UMa E (Wright et al. 2013) is at the widest separation from the hierarchical binaries at the center of the system. 2MASS J0213+3648 C (Deacon et al. 2017) stands out as the most distant, smallest separation, and is the warmest T dwarf companion in a multiple system.
Table 5. T Dwarf Multiple System Characteristics
| Object Name | Discovery Reference | SpT | Age (Gyr) | Separation (au) | System Components | Distance (pc) |
|---|---|---|---|---|---|---|
| Gl 570D | Burgasser et al. (2000) | T7.5 | 2–10 | 1450a | K4+(M1.5+M3) | 5.8b |
| Ross 458C | Goldman et al. (2010), Burgasser et al. (2010), Scholz (2010) | T8.5 | <1 | 1100 | M0.5+M7 | 11.7b |
| ξ UMa E | Wright et al. (2013) | T8.5 | 2–8 | 4100 | F8.5+G2c | 8.8b |
| Wolf 1130C | Mace et al. (2013b) | T8 | >10d | 3150 | M3+WD | 16.7 |
| 2MASS J0213+3648 C | Deacon et al. (2017) | T3 | 1–10 | 360 | M4.5+M6.5 | 22 |
Notes.
aThe separation for Gl 570D is the average of the A–D and BC–D separations reported by Burgasser et al. (2000). bDistance from the updated 20 pc sample in Table 8 of Kirkpatrick et al. (2012). cBoth listed components of ξ Uma are spectroscopic binaries. dAge based on M dwarf metallicity and kinematics. The non-detection of the white dwarf in this system produces an age bound >3.4 Gyr.Download table as: ASCIITypeset image
There are a number of possible trends to note in the small sample of T dwarfs in multiple systems. First, the surveys that enabled these T dwarf discoveries (primarily 2MASS (Skrutskie et al. 2006), UKIDSS (Lawrence et al. 2007), and WISE (Wright et al. 2010)) have probed successively farther from the Sun. Next, the separation between the T dwarf and the primary of the system may go up as a function of the primary star mass. Wolf 1130 is the second most massive system after ξUMa, consistent with the second largest separation. However, when Wolf 1130B was a 6–8 M⊙ star it would have outweighed all of the other systems, and as discussed by Day-Jones et al. (2011) the separation would have been a factor of ∼8 smaller (MMS/MWD ∼ 8; Jeans 1924; Zuckerman & Becklin 1987), ∼400 au. Bate (2009) shows that formation models of multiples preferentially form extreme mass-ratio systems with separations between 50 and 1200 au. Given the mass-loss history of Wolf 1130B, it is likely that Wolf 1130C formed at a more typical separation before moving out to its current orbit of ∼3150 au. However, formation and cluster interactions may have been a less orderly process that resulted in the hardened inner binary and distant tertiary we see today (Reipurth & Mikkola 2012). Additionally, we cannot rule out the capture of Wolf 1130C by Wolf 1130AB in the period of star-forming cluster dissolution (Kouwenhoven et al. 2010). In all these scenarios, the system is coeval to within a few Myr and we can safely assume that the properties of Wolf 1130C match Wolf 1130AB.
5. Discussion
5.1. Assumptions
The single largest assumption we have made is that the system is tidally locked, which directly impacts the inclination we have determined. The timescales for synchronization and circularization are strongly dependent on the orbital period of the binary (Zahn 1975, 1977; Zahn & Bouchet 1989). For the short ∼12 hr period of Wolf 1130AB the circularization timescale is <50,000 yr and the synchronization timescale is an order of magnitude smaller (Hilditch 2001). Because synchronization occurs more rapidly than circularization (Claret et al. 1995), the zero eccentricity of the combined orbital solution implies spin–orbit alignment in the system. Additionally, the coherence of the phase-folded V-band photometry and the residual flux in Figure 8 provides strong evidence for tidal locking.
The radius and mass of Wolf 1130A derived from empirical relationships (Mann et al. 2015; Benedict et al. 2016) are assumed to be the most reliable we have. Increasing the radius by 10%, perhaps to account for interior magnetic effects induced by tidal locking (Feiden & Chaboyer 2012), would decrease the inclination by 10% (to 26°) and would increase the mass of the white dwarf to well above the Chandrasekhar limit (∼1.55 M⊙). Since we do not measure a strong magnetic field, and the spot modulation is small-amplitude, a substantially inflated radius for Wolf 1130A is unlikely.
In this work we have combined parameter calibrations from BT-SETTL (Allard et al. 2012; Mann et al. 2013b, 2016; Allard 2014), Kurucz (Sneden 1973; Kurucz 1979, 2011), MARCS (Gustafsson et al. 2008; Deen 2013), and the Dartmouth Stellar Evolution Models (Dotter et al. 2008). This is partly because no single model grid covers the parameter space that we require, partly because empirical relationships have been calibrated against specific models, and partly to show that the parameters derived from different methods are consistent in describing Wolf 1130.
At the youngest age we estimate for Wolf 1130B (3.4 Gyr, Section 4.2), the ONe white dwarf would be just below our detection limits. The M subdwarf (Wolf 1130A) metallicity and UVW velocities imply an age >10 Gyr (Reddy et al. 2006). Additionally, Rojas-Ayala et al. (2012) and Muirhead et al. (2013) identified a metallicity enrichment of up to +0.4 dex in post-common-envelope M dwarfs relative to typical field M dwarfs (Muirhead et al. 2012). Adjusting the metallicity-based age estimate of Wolf 1130A to account for contamination has the potential of adding Gyr to the system age. We consider the >10 Gyr kinematic age to be the most reliable for the Wolf 1130 system.
5.2. Applications
The best use of Wolf 1130, and other multiples containing T dwarfs, will be to measure the intersection of various stellar and substellar populations in model parameter space. The typical separation of brown dwarfs in binaries is small (around 3 au, Burgasser et al. 2007; Bardalez Gagliuffi et al. 2014; Prato et al. 2015) and in multiple-body systems the likelihood of breakup through dynamic evolution is high (Reipurth & Mikkola 2015). It is possible that Wolf 1130C has been excluded from the common envelope and escaped contamination, preserving the primordial metallicity of the entire system. Determining the metallicity of the T dwarf directly will be difficult since it is faint (J = 19.6 mag) and subsolar metallicity atmosphere models are not calibrated for T dwarfs (Martin et al. 2017, Logsdon et al. submitted). Instruments like the Giant Magellan Telescope Near-Infrared Spectrograph (Jaffe et al. 2016), in concert with atmospheric retrieval methods that maximize the utility of model grids (Line et al. 2017), may facilitate the eventual characterization of Wolf 1130C. For now, the abundances determined from Wolf 1130A provide limits on the metallicities of Wolf 1130C and motivate lower-metallicity model development (Logsdon et al. submitted).
While theoretical calculations hint at an overall multiplicity rate for the star formation process of ∼10% (Bate 2009), the number of known T dwarfs in multiples is only ∼1%. This implies that a unique evolutionary path is required in order to keep substellar companions bound to stellar binaries after formation and cluster dissolution. Brown dwarfs that form through the fragmentation of massive circumstellar disks (Bonnell & Bate 1994; Kratter & Matzner 2006; Stamatellos & Whitworth 2011) would reside in high-mass-ratio systems (Bate et al. 2003; Bate 2009). Yet, the formation of multiple systems through cloud fragmentation (Reipurth & Mikkola 2012) and subsequent capture (Kouwenhoven et al. 2010) will allow for more random system properties, which are testable by observation. The direct application of formation models to reproduce the wide-separation T dwarfs in Table 5, discovering a larger sample of T dwarfs in multiple systems at intermediate separations, and the identification and characterization of field subdwarf brown dwarfs like Wolf 1130C and the subdwarf T6 discovered by Burningham et al. (2014), would each improve our understanding of the small occurrence rate of T dwarfs in multiple systems.
A white dwarf as massive as Wolf 1130B is rare (Kepler et al. 2016) and exotic system evolution scenarios are plausible. The upper limit of the mass we determine for Wolf 1130B is 1.43 M⊙ and a neutron star primary in this system could have formed through the merger of a massive white dwarf and an M dwarf in the common-envelope phase of the system. Any earlier merger activity would have increased the angular momentum and slowed tidal locking, requiring that the system be old enough to relax again. Additionally, Wolf 1130 could be the result of a dynamical capture between an M and T dwarf binary and massive white dwarf or its progenitor. Yet, strong interactions with other stars that would harden the inner binary are unlikely (Bonnell & Bate 2002) and in situ formation and evolution (Bate 2009) is the most probable origin of Wolf 1130.
5.3. What Happens to a Cataclysm Deferred?
Wolf 1130A does not fill its Roche lobe (0.82 R⊙) and it can only achieve this by moving closer to Wolf 1130B or by increasing its radius. The main-sequence lifetime of a 0.3M⊙ star is ∼200 Gyr, which is the longest timescale we should consider for this system's evolution. The decreased separation of Wolf 1130AB through angular momentum loss will reduce the Roche lobe radius (see reviews on cataclysmic variables by Warner 1995; Hellier 2001) until mass transfer commences. At that point, Wolf 1130AB will become a cataclysmic variable and the separation will only be ∼1.1R⊙ (assuming no tidal elongation, which would actually be ∼30% of the M dwarf radius once the separation is this small (Fitzpatrick 2012)). The primary mechanism for angular momentum loss in a cataclysmic variable is magnetic braking when orbital periods are longer than a few hours, and gravitational radiation (waves) at the shortest periods (Iben & Tutukov 1985; Iben & Livio 1993; Hellier 2001; Schreiber & Gänsicke 2003).
Magnetic braking is not a rapid process because it relies on the stellar wind and magnetic field interactions to slowly sap the angular momentum. Employing the equations for magnetic wind braking (Sills et al. 2000; Andronov et al. 2003) from Muirhead et al. (2013; who assumes efficient spin–orbit coupling) we find that Roche lobe overflow will start ∼6.2 Gyr from today. Uncertainties in this age estimate are likely on the order of Gyr because the magnetic pole alignment of the M and white dwarfs creates complicated fields that directly impact the rate of angular momentum loss (Wu & Wickramasinghe 1993; Wheeler 2012).
Once mass transfer is initiated, magnetic braking will gain strength as material crosses magnetic field lines to form an accretion disk around the white dwarf (Hellier 2001). Since Wolf 1130A will be only ∼1.1 R⊙ from Wolf 1130B, the magnetic braking and gravitational radiation timescales will be about the same order of magnitude and the cataclysmic variable phase will last <500 Myr (Kolb & Stehle 1996). Tidal locking and alignment of the magnetic fields between the white dwarf and subdwarf may result in a sufficiently high mass transfer rate to lead to a SN Ia (Wheeler 2012), even if the white dwarf is ONe rather than CO (Marquardt et al. 2015), or below the Chandrasekhar limit (Dessart et al. 2014; Scalzo et al. 2014). The low range of the combined Wolf 1130AB system mass (1.39 M⊙) is significantly above the mass of sub-luminous, SN 1991bg-like Type Ia events (Filippenko et al. 1992; Ruiz-Lapuente et al. 1993; Blondin et al. 2017). The age (≳3.5 Gyr) and inspiral time (∼6 Gyr) of this system are consistent with the class of long-delay SNe Ia (Maoz et al. 2010). This is the first ultramassive white dwarf within 25 pc (Holberg et al. 2016; Toonen et al. 2017) and the proximity of this system makes it an ideal candidate for follow-up studies and modeling of potential Type Ia progenitors.
6. Summary
Wolf 1130AB is a nearby (16.7 ± 0.2 pc) and old (>10 Gyr) pre-cataclysmic variable with a 0.4967-day orbital period. The combination of archival data with new optical and infrared observations between 0.2 and 2.5 μm produces properties for each component in the system. The M subdwarf (Wolf 1130A) is the dominant flux source in the system but not the most massive (MA ∼ 0.3 M⊙). Wolf 1130A is tidally locked, metal-poor ([Fe/H] = −0.7 ± 0.12 dex), and shows low-level photospheric variability indicative of spots. The ultramassive ( ) ONe white dwarf component in the system (Wolf 1130B) remains unseen. Without a direct detection of the massive component in this system, we cannot precisely establish its age and future observations at UV and X-ray wavelengths may reveal its nature. This is the first known system containing a potential Type Ia progenitor, with a mass near or above the Chandrasekhar limit, within 25 pc (Holberg et al. 2016; Toonen et al. 2017).
A distant (∼3150 au) T subdwarf component of the system (Wolf 1130C) shows a spectral morphology consistent with old age and high mass (Mace et al. 2013b). Wolf 1130C is distinctly on the edge of model parameter space, with the lowest metallicity, a small radius, high mass, and large surface gravity (Mace et al. (2013b), Logsdon et al. submitted) and is the oldest of only five known T dwarfs in multiple systems (Deacon et al. 2017). The faintness of the T dwarf and white dwarf in this system limit their utility in determining system parameters, but this can be overcome with future instrumentation (GMTNIRS, Jaffe et al. 2016) and atmospheric retrieval methods (Line et al. 2017). The photometric precision of the Transiting Exoplanet Survey Satellite will be <0.1% for Wolf 1130 (Ricker et al. 2014; Stassun et al. 2017) and a fit to the light curve may yield more precise system parameters. The dynamical evolution and initial mass ratio of Wolf 1130 need to be considered when modeling stellar interactions in the epoch of star formation and post-main-sequence evolution (Bate 2009; Gosnell et al. 2015). The Wolf 1130 system is a unique test case for modeling star formation, dynamical evolution, post-main-sequence evolution, and white dwarf and brown dwarf cooling models.
We appreciate the comments and recommendations of the anonymous referee, Sarah Logsdon, Emily Martin, Fabiola Campos, Kimberly Sokal, Casey Deen, Julie Skinner Manegold, Edward Robinson, Mike Montgomery, and Craig Wheeler. Thank you to Kevin Gullikson, Kyle Kaplan, and Jacob McLane for exchanging observing time for this project.
This paper includes data taken at the McDonald Observatory of the University of Texas at Austin and we thank the Observer Support for their constant watch over the facility. Support was provided in part by the US National Science Foundation under grant AST-1616040 to C. Sneden.
This work used the Immersion Grating Infrared Spectrometer (IGRINS) that was developed under a collaboration between the University of Texas at Austin and the Korea Astronomy and Space Science Institute (KASI) with the financial support of the US National Science Foundation under grant AST-1229522, of the University of Texas at Austin, and of the Korean GMT Project of KASI.
This work has made use of data from the European Space Agency (ESA) mission Gaia (https://www.cosmos.esa.int/gaia), processed by the Gaia Data Processing and Analysis Consortium (DPAC, https://www.cosmos.esa.int/web/gaia/dpac/consortium). Funding for the DPAC has been provided by national institutions, in particular the institutions participating in the Gaia Multilateral Agreement.
Footnotes
- 7
- 8
- 9
In this work phase = 0 at inferior conjunction (M subdwarf between the observer and the white dwarf).
- 10
- 11
JD and MJD in this work are standard, and not heliocentric corrected.
- 12
- 13
- 14
https://bitbucket.org/madamow/pymoogi.git, written by Monika Adamow.
- 15