


Abstract
The impact of the photodissociation of HCN and HNC isomers is analyzed in different astrophysical environments. For this purpose, the individual photodissociation cross sections of HCN and HNC isomers have been calculated in the 7–13.6 eV photon energy range for a temperature of 10 K. These calculations are based on the ab initio calculation of three-dimensional adiabatic potential energy surfaces of the 21 lower electronic states. The cross sections are then obtained using a quantum wave packet calculation of the rotational transitions needed to simulate a rotational temperature of 10 K. The cross section calculated for HCN shows significant differences with respect to the experimental one, and this is attributed to the need to consider non-adiabatic transitions. Ratios between the photodissociation rates of HCN and HNC under different ultraviolet radiation fields have been computed by renormalizing the rates to the experimental value. It is found that HNC is photodissociated faster than HCN by a factor of 2.2 for the local interstellar radiation field and 9.2 for the solar radiation field, at 1 au. We conclude that to properly describe the HNC/HCN abundance ratio in astronomical environments illuminated by an intense ultraviolet radiation field, it is necessary to use different photodissociation rates for each of the two isomers, which are obtained by integrating the product of the photodissociation cross sections and ultraviolet radiation field over the relevant wavelength range.
Export citation and abstract BibTeX RIS
1. Introduction
The two isomeric forms of HCN and HNC exist in many different astronomical environments such as diffuse interstellar clouds (Turner et al. 1997; Liszt & Lucas 2001), dense interstellar clouds (Pratap et al. 1997; Hirota et al. 1998; Hily-Blant et al. 2010), star-forming regions (Schilke et al. 1992; Jin et al. 2015), protoplanetary disks (Graninger et al. 2015), comets (Lis et al. 2008; Agúndez et al. 2014), atmospheres of planets (Moreno et al. 2011), the ejecta of evolved stars (Bujarrabal et al. 1994; Cernicharo et al. 2013), the circumnuclear disk of the Galactic center (Harada et al. 2015), and external galaxies (Gao & Solomon 2004; Guélin et al. 2007; Aalto et al. 2012).
The relative abundance of HNC and HCN varies significantly among different astrophysical environments. In cold and dense interstellar clouds, where the gas is largely shielded from external ultraviolet radiation, the HNC/HCN abundance ratio is ≈1 (Sarrasin et al. 2010), while in regions illuminated by ultraviolet photons, HCN becomes more abundant than HNC by a factor of ≈5 in both diffuse interstellar clouds (Liszt & Lucas 2001; Godard et al. 2010) and in photon-dominated regions such as the Orion Bar (Hogerheijde et al. 1995; S. Cuadrado 2016, private communication). To understand the underlying causes of these variations, it is of paramount importance to determine the rates of all processes, formation, excitation, and destruction, of the two isomers.
The reactive collisional rates involving HCN and HNC have been revisited recently (Loison et al. 2014), and the rates of rotational excitation through inelastic collisions with H2 and He have been also investigated (Sarrasin et al. 2010; Dumouchel et al. 2011; Abdallah et al. 2012). Concerning photodissociation processes, there are several experimental works on individual electronic bands of the HCN isomer. Herzberg & Hines (1957) studied the weak absorption bands associated to the 11A'' and 21A' electronic states. These bands are formed by narrow peaks, decaying by either electronic predissociation to the ground state or through tunneling across potential barriers due to avoided crossing with higher electronic states. These processes have been studied in detail by either experimental techniques (Herzberg & Hines 1957; Hsu et al. 1984; Meenakshi & Innes 1986; Eng et al. 1987; Jonas et al. 1990) or theoretical simulations (Peric et al. 1988; Xu et al. 2001, 2002a, 2002b, 2003). The band associated to 31A' state was measured by Mcpherson & Simons (1978) and the peaks were assigned (Mcpherson & Simons 1978; Chuljian et al. 1984; Peric et al. 1987). Also, the photodissociation cross section for HCN has been studied experimentally over a wide wavelength interval, from 90 to 150 nm, by several authors (Lee 1980; Nagata et al. 1981; Nuth & Glicker 1982).
All the experimental photodissociation studies performed to date refer to the HCN isomer. Only recently, Chenel et al. (2016) studied theoretically the photodissociation spectra of the HNC isomer and compared it with that of HCN. It was found that the absorption cross section of HNC is significantly higher than that of HCN due to the increase of the transition dipole moments for some electronic transitions. This study however covered only the 7–10 eV energy range.
In order to analyze the impact of the photodissociation of HCN and HNC isomers in different astronomical environments, it is important to study the photodissociation over the entire energy range of the astronomical UV radiation fields, which in the case of interstellar clouds extends up to 13.6 eV, the ionization energy of hydrogen atoms. The objective of this work is to extend such a study to the 7–13.6 eV range and use the results to evaluate the impact in the HNC/HCN abundance ratio in different astrophysical environments.
The paper is organized as follows. In Section 2, the molecular calculations performed to calculate the photodissociation cross sections of HCN and HNC are described, providing more detailed information in the Appendix. In Section 3, we evaluate the impact of these results on the HNC/HCN abundance ratio in different astronomical environments. Finally, Section 4 is devoted to extracting some conclusions.
2. Molecular Calculations
2.1. Ab Initio Potential Energy Surfaces
In our previous work (Chenel et al. 2016) four 1A' and three 1A'' potential energy surfaces of HCN were calculated at ic-MRCI-F12 level. In those calculations the correlation consistent F12 triple zeta atomic basis set (Peterson & Werner 2008), VTZ-F12, was used and the molecular orbitals and reference configurations were obtained from a full valence state-averaged complete active space MCSCF calculation (SA-CASSCF) with the frozen core approximation. The calculation of higher electronic states requires, however, an increased active space in the SA-CASSCF making the calculation intractable.
For this reason, in the present calculations the basis set was reduced to a double zeta basis, VDZ-F12, which yielded results in rather good agreement with the previous results for the lower electronic states. With this atomic basis, it was possible to increase the active space to 17 orbitals (13 a' and 4 a'') for 14 electrons. The molecular orbitals were obtained by optimizing the averaged energy of 12 1A' and 9 1A'' electronic states. The calculations are done at geometries defined in Jacobi coordinates,  and
and  , the CN internuclear vector and the vector joining CN center of mass to H, respectively, with γ being the angle between them. In order to ensure a continuous convergence, for each r, R couple the calculations were performed sequentially from γ = 0 to π, every 10°. Using as reference the SA-CASSCF configurations having a weight of at least 5%, ic-MRCI-F12 calculations are performed to obtain the energies of 21 states (12 of 1A' and 9 of 1A'' symmetry).
The ab initio points calculated here are used to generate the PESs for the 4–12 1 A' and the 4–9 1A'' states using a three-dimensional spline interpolation. The ab initio calculations were performed in the same grid as defined previously (Chenel et al. 2016), but restricted to R < 3 Å. The reason for this reduction is that all these states are bound and do not require us to describe the dissociation (Chenel et al. 2016). For the ground electronic state, we use the PES of Varandas & Rodrigues (2006). For the dissociative 2 1A', 3 1A' and 1 1A'' and the bound 2 1A'' and 3 1A'' states the previously developed PESs are used (Chenel et al. 2016), which were obtained with a three-dimensional spline interpolation of a grid of ab initio points.
The Minimum Energy Paths (MEPs) for the isomerization, from HCN to HNC, were calculated (see Figure 1). The ground electronic state MEP shows a rather high barrier (of ≈2 eV) between the HCN and HNC isomers. This barrier disappears in the lower 21A', 31A', and 11A'', which are dissociative (yielding adiabatically to CN(A2Π), and CN(B2Σ+)) and present wells at different configurations, some of them at bent geometries, as described previously (Chenel et al. 2016).

Figure 1. Middle panel: minimum energy path for the HCN/HNC isomerization for the first 12 1A' (red) and 9 1A'' (blue) electronic states of HCN obtained using the PESs as described in the text. In black are the MEPs for the HCN+/HNC+ corresponding to the first 2A' and 2A'' electronic states of the cation. The points correspond to PESs calculated previously. The left and right panels show the molecular orbital amplitudes of HCN (left panel) and HNC (right panel). Note that the molecular orbitals are ordered by the occupation number, not their energy.
Download figure:
Standard image High-resolution imageThe remaining states are all bound presenting a high dissociation limit (toward CN(D2Π,...)) and most of them present two wells, at HCN/HNC linear configurations. At these higher energies there is a higher density of states giving rise to many avoided crossings, which are responsible for the complex undulations seen in the MEPs. These states are Rydberg states, formed by a HCN+ core surrounded by an outer electron. Thus the two linear wells of the Rydberg states are associated to the structure of the HCN+/HNC+. This is confirmed by the MEPs of 2A' and 2A'' ground states of HCN+ (in black in Figure 1), whose PESs have also been calculated in this work.
The main electronic configurations of all these electronic states change with γ due to the crossings. In the Appendix, the main electronic configurations for each electronic state are listed for γ = 180° (HCN) and γ = 0° (HNC) in terms of the frontier orbitals (also displayed in the left and right panels of Figure 1). The coefficient of the electronic configurations and the molecular orbitals changes with γ, showing sharp variations at the crossings, clear evidence that non-adiabatic transitions should play an important role.
The transition dipole moments from the ground to all excited electronic states have also been calculated. These quantities present artificial changes of sign corresponding to different phases for different states and geometries. This has been corrected by calculating the overlap between the electronic wavefunctions calculated at different calculations. Once corrected, the resulting points, for two or one non-zero components, were interpolated using two- and three-dimensional splines, as described previously (Chenel et al. 2016).
2.2. Initial Bound States and Photoionization Thresholds
The initial bound states on the ground electronic PES of Varandas & Rodrigues (2006) were calculated using the method of Paniagua et al. (1998), using numerical radial functions for r and R, and angular basis functions in a body-fixed representation to describe the orientation of  and
and  Jacobi vectors. For non-zero total angular momentum, J, the
  rotational sublevels are split, and the lower one is that with the maximum component on Ω = 0, Ω being the projection of
  on the body-fixed z-axis. The sublevels for
  are always at higher energy, because the function behaves as
  as
as  or 0, the equilibrium configurations of HCN and HNC, respectively. The energy splitting of the excited rotational sublevels, with
  , are relatively high in energy. For example, the HCN isomer with J = 1 level and Ω = 0 (
 ) has an energy of 2.96 cm−1 above the ground rovibrational level (
 ), while the excited ones (
 and
and  ) have energies of 714.48 and 714.50 cm−1. For temperatures below 100 K, these excited rotational sublevels are not populated, and only the photodissociation from the level
  of HCN or HNC isomers will be considered below.
The vibrational states of the HCN+ cation have been calculated on the 12A' and 12A'' surfaces. As shown in Figure 1, the 12A' state has the deeper minimum of the HNC isomer (12.537 eV above the HCN(X 1A') well), while the 1 2A'' state has the deeper well for the HCN isomer (at 13.460 eV). In the two cases there is a high isomerization barrier, larger than for the neutral, and the the first bound states are located in either one of the two wells. The first HNC/HCN bound states on the 12A' are at 3305.17 and 10451.56 cm−1, respectively. For the 12A'', the energies are 3180.79 and 9578.83 cm−1 for the HCN+ and HNC+ isomers, respectively.
Taking the first bound state on each isomer of the cation, we can then estimate the ionization energies, including zero point energy, as 13.425 and 11.872 eV for HCN and HNC isomers, respectively. The experimental values (Lide 2009), 13.60 eV for HCN and 12.5 eV for HNC, both larger than our theoretical estimation but showing the same trend. Apart from possible inaccuracies in the potential energy surfaces, the difference may be attributed to Frank–Condon factors, which may yield larger vibrational excitation of the cation and could be especially significant for HNC+, where the disagreement is more pronounced. The ionization energy of atomic hydrogen is 13.606 eV, and H atoms absorb UV photons of higher energy in interstellar clouds. HCN ionization nearly does not take place in interstellar clouds, while HNC can be ionized by UV photons with energies above 11.872–12.5 eV.
2.3. Photodissociation
For a particular initial total angular momentum, Ji, individual  rotational transitions are calculated from the ground vibrational level of HCN and HNC isomers, denoted as HCN(Ji) and HNC(Ji), respectively, and each of the 20 adiabatic and independent excited electronic states described above. An initial wave packet is built for each transition by applying the transition dipole operator to the initial bound state and projecting it into a given
  state (summing over the Ωf components) and a particular excited electronic state, as described previously (Chenel et al. 2016). This initial wave packet is then propagated in time with a quantum method described previously (Roncero et al. 1997; Paniagua et al. 1999; Aguado et al. 2003) using the MADWAVE3 code (González-Lezana et al. 2005; Zanchet et al. 2009). The total absorption spectrum is calculated from the autocorrelation function, as described in detail by Chenel et al. (2016).
We have considered the transitions from  for the ground rovibrational state of HCN(Ji) and HNC(Ji) isomers, described in further detail in the Appendix. The spectra for each Ji (summing over Jf) are pretty similar, which is attributed to the small contribution of Coriolis coupling at these relatively low angular momenta at colinear configurations. The energies of the initial rovibrational levels can be described in the rigid rotor approach, Be Ji(Ji + 1), with very similar rotational constants of Be = 1.48 cm−1, as also found by other authors (Bowman et al. 1993; Varandas & Rodrigues 1997; van Mourki et al. 2001; Varandas & Rodrigues 2006). For a temperature of 10 K, the weight of Ji > 4 is less than 3%, and thus we have renormalized the Boltzmann distribution obtained for Ji ≤ 3. The total absorption cross sections have been calculated for the two isomers in the 7–13.6 eV photon energy range, and are shown in Figure 2.

Figure 2. Spectra of HCN (bottom panel) and HNC (top panel) obtained with the quantum wave packet method at 10 K. In the bottom panel, the experimental spectrum of the HCN isomer (Nuth & Glicker 1982) is also shown for comparison. Note that the maximum intensity of the simulated spectra is out of the range considered.
Download figure:
Standard image High-resolution imageThe simulated spectra show that the photodissociation cross section of HNC is larger than that of HCN, especially at photon energies below 10 eV. This is due to the change of the Σ, Π, or Δ character of the electronic wave function when changing from HCN to HNC linear geometries, which has an enormous impact on the amplitudes of the transition dipole moments, as explained before (Chenel et al. 2016). This leads to different photodissociation rates, depending on the radiation field existing in different regions which will be discussed below. The simulated spectra shown are completely ab initio and no empirical data have been introduced.
In the bottom panel of Figure 2, the spectrum of HCN is compared to the experimental one of Nuth & Glicker (1982). This experimental spectrum is similar to others obtained for this isomer (Lee 1980). Differences in the intensity between experimental spectra can be attributed to different photon fluxes and widths of the pulses used. For HNC there is no experimental result so far probably because of the difficulty of forming isolated HNC.
In spite of some similarities for some transitions, there is a significant difference in the simulated and observed spectra, especially in the overall intensity and density of transitions. These differences are for three main reasons. First, the simulated spectra do not take into account the experimental width of the excitation pulse. For a better comparison, the simulated values have to be convoluted with the experimental width, which is expected to change with the excitation wavelength. Since we do not know it, this is not done here.
Second, the experimental spectrum is obtained at room temperature while the present results are obtained at 10 K. Increasing the temperatures give access to larger Jf, in which the Coriolis terms are more effective at coupling levels with different Ω, thus sharing the oscillator strength among a much larger density of states. Also, higher rovibrational states have larger amplitudes at bent geometries and the transition dipole moments for many excited states increase significantly as the angle γ varies from collinear geometries, as discussed before (Chenel et al. 2016). This may significantly increase the intensity of some transitions, and hence the congestion of the spectra. These two aspects are further discussed in the
The third reason, and the most important, is the lack of non-adiabatic transitions among the different electronic states. As mentioned above, the adiabatic electronic PESs cross many times, and at the conical intersections and/or avoided crossings, the non-adiabatic couplings become important. The inclusion of such terms will increase the width of the bound levels belonging to the bound Rydberg states, and share the oscillators' strength. This work is now in progress, and once done, more rovibrational transitions will be studied to increase the temperature of the simulations.
The spectra obtained for the two isomers are subject to the same problems. The procedure used below consists in calculating the photodissociation flux ratio of HCN and HNC isomers for different radiation fields using the simulated spectra. Then the two are renormalized to the flux obtained using the experimental value for HCN.
3. Astrophysical Implications
There are various types of astronomical environments where the molecules HCN and HNC are present and their abundances are regulated by photochemical processes. To evaluate the astrophysical implications of the calculated photodissociation cross sections on the HNC/HCN abundance ratio, we have calculated photodissociation rates under different ultraviolet radiation fields (see Table 1). There are significant differences between the cross section of HCN calculated here and that measured in the laboratory (see bottom panel in Figure 2). We have therefore computed, on the one hand, the photodissociation rate of HCN using the experimental cross section of Nuth & Glicker (1982) and, on the other, the photodissociation rates of HCN and HNC using the theoretical cross sections calculated in this work. To take into account the discrepancy between theoretical and experimental cross sections, we have scaled the theoretical photodissociation rate of HNC using the experimental-to-theoretical photodissociation rate ratio found for HCN. We find that the HNC isomer is photodissociated 2.2 times faster than the more stable isomer HCN under the local ultraviolet interstellar radiation field (ISRF) of Draine (1978), which illuminates diffuse interstellar clouds and external regions of dense clouds and circumstellar envelopes. For ultraviolet radiation fields arising from stars, the enhancement in the photodissociation rate of HNC with respect to that of HCN becomes more marked as the effective temperature of the star decreases. The reason is that the cooler the star, the higher the contribution of photons with energies below 10 eV, which selectively favor the photodissociation of the HNC isomer over HCN due to the much higher cross section in this energy range. Thus, HNC is photodissociated 1.6 times faster than HCN under the radiation field of a 40,000 K blackbody (typical of a star of O type), 5.7 times faster if illuminated by a 10,000 K blackbody (typical of a late B star), and 9.2 times faster if exposed to radiation from the Sun, whose effective temperature is ∼5770 K. These numbers have to be taken into account when interpreting the HNC/HCN abundance ratio observed in regions illuminated by ultraviolet radiation fields with different spectral shapes.
Table 1. Photodissociation Rates in s−1
| Radiation Field | HCN | HNC | HNC/HCN | HCN | HNC |
|---|---|---|---|---|---|
| Theoretical | Theoretical | Theoretical | Experimental | Scaled to Experimental | |
| ISRFa | 4.2 × 10⁻¹⁰ | 9.4 × 10⁻¹⁰ | 2.2 | 1.9 × 10⁻⁹ | 4.2 × 10⁻⁹ |
| O star (40,000 K blackbody)b | 6.8 × 10⁻¹⁰ | 1.1 × 10⁻⁹ | 1.6 | 2.8 × 10⁻⁹ | 4.5 × 10⁻⁹ |
| B star (10,000 K blackbody)b | 4.4 × 10⁻¹¹ | 2.5 × 10⁻¹⁰ | 5.7 | 1.7 × 10⁻¹⁰ | 1.0 × 10⁻⁹ |
| Sunc | 1.2 × 10⁻⁶ | 1.1 × 10⁻⁵ | 9.2 | 9.3 × 10⁻⁶ | 8.6 × 10⁻⁵ |
Notes.
aInterstellar radiation field of Draine (1978). bRadiation field scaled to the same integrated flux of the field of Draine (1978) between 91.2 and 240 nm. cRadiation field at 1 au from the Sun, adopting the mean spectrum between minimum and maximum activity from Thuillier et al. (2004). Since the intensity of the radiation field from the Sun varies as R−2, the photodissociation rates vary in the same way, and can be directly obtained at other distances by multiplying by R−2. As a consequence, the HNC/HCN photodissociation rate ratio does not change with R.Download table as: ASCIITypeset image
In diffuse interstellar media, the HNC/HCN abundance ratio has been found to be remarkably uniform, 0.21 ± 0.5, from observations of diffuse clouds toward different lines of sight (Liszt & Lucas 2001). Further observations by Godard et al. (2010) have confirmed that the same uniform HNC/HCN abundance ratio holds for diffuse media in lines of sight toward the Galactic center.4 However, PhotoDissociation Region (PDR) models predict that HCN and HCN should have similar abundances in diffuse clouds (e.g., Godard et al. 2010), something that arises from the fact that in PDR models the formation and destruction routes are nearly identical for both isomers. The fact that HNC is observed to be ∼5 times less abundant than HCN in diffuse clouds implies that there must be a chemical differentiation between both isomers, with HNC having either a lower formation rate or a higher destruction rate than HCN. Our finding that HNC is photodissociated faster than HCN arises as a possible explanation for the underabundance of HNC with respect to HCN in diffuse clouds. To quantitatively evaluate this effect, we have used the Meudon PDR code (Le Petit et al. 2006) to model the chemistry of a diffuse cloud. We consider a plane-parallel cloud with a total visual extinction of AV = 1 magnitude illuminated at both sides by the ISRF of Draine (1978), i.e., χ = 1 (we also explore models with AV = 0.5 and χ = 3), and consider a range of densities of H nuclei of nH = 102–104 cm−3. The rest of the parameters, such as the elemental abundances, are similar to those adopted in Agúndez et al. (2010) to model the diffuse cloud ζ Oph. The resulting HNC/HCN column density ratio is shown as a function of nH in Figure 3. It is seen that when HNC is assumed to be photodissociated at the same rate as HCN, as usually assumed in PDR models, the HNC/HCN ratio is close to unity. When we take into account the results found here, i.e., that HNC is photodissociated 2.2 times faster than HCN under the ISRF, the HNC/HCN ratio becomes lower than 1, in the range 0.5–0.8, in better agreement with observations although still above the observed value of 0.21. The underabundance of HNC with respect to HCN is more marked at low densities, where the destruction of both HCN and HNC is dominated by photodissociation. At high densities, the destruction of both isomers through the reaction with C+, which is assumed to occur equally fast for HCN and HNC, becomes increasingly important, reducing the impact of the different photodissociation rates of each isomer. We note that the PDR models have a serious failure in that they produce too little HCN and HNC, resulting in CN/HCN ratios one or two orders of magnitude above the observed value of 6.8 ± 1.0 (Liszt & Lucas 2001; see also Godard et al. 2010). Models in which the dissipation of turbulent energy activates chemical reactions with moderately high activation barriers in the relatively cold (<100 K) diffuse gas better reproduce the observed CN/HNC ratios (Godard et al. 2010). Whatever the relative roles of ultraviolet photons and turbulence dissipation in controlling the HNC/HCN abundance ratio, it is clear that the differentiation produced by the distinct photodissociation cross sections of HCN and HNC is partially, if not completely, at the heart of the HNC/HCN ratio observed in diffuse clouds.
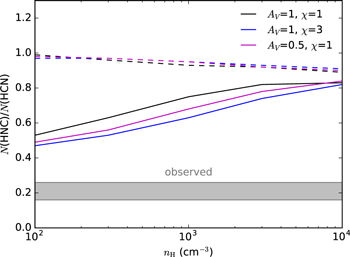
Figure 3. HNC/HCN column density ratio calculated with the PDR model for a diffuse cloud as a function of the density of H nuclei. Dashed lines correspond to models where the photodissociation rate of HNC is assumed to be equal to that of HCN, while solid lines correspond to models where HNC is photodissociated 2.2 times faster than HCN. The range of HNC/HCN ratios observed by Liszt & Lucas (2001), 0.21 ± 0.05, is also shown.
Download figure:
Standard image High-resolution imageThe results obtained here on the photodissociation of HCN and HNC are also useful to guide the interpretation of the underabundance of HNC with respect to HCN observed in other astronomical environments illuminated by ultraviolet photons, such as dense PDRs (Hogerheijde et al. 1995), protoplanetary disks (Graninger et al. 2015), circumstellar envelopes around evolved stars (Daniel et al. 2012; Cernicharo et al. 2013), atmospheres of planets and solar system bodies such as Titan (Moreno et al. 2011; Hébrard et al. 2012), and cometary comae (Lis et al. 2008; Agúndez et al. 2014). Detailed models are however required to provide a quantitative evaluation of the role of the different photodissociation rates of HCN and HNC on the HNC/HCN abundance ratio in each of these astronomical regions.
Our theoretical calculations have been done for a temperature of 10 K, which is significantly lower than the gas kinetic temperature of diffuse clouds and photodissociation regions. However, the rotational levels of HCN and HNC are expected to be subthermally excited in these regions, with rotational temperatures of the order of 10 K. Consequently, the computed rates could be used with confidence to compute the photodestruction of both species in most astrophysical environments. In particular, in the case of comets, the rotational temperature, which determines the rotational populations, is well below the kinetic temperature at cometary atmospheres at long distances from the nucleus. Thus, our estimate of 10 K is expected to be valid for a large range of volume densities and applicable to comets as well. We note that in the case of cometary comae, it is well known that the HNC/HCN abundance ratio varies with the heliocentric distance (Lis et al. 2008; Agúndez et al. 2014). This observational finding cannot be explained in terms of the different photodissociation rates of the two isomers because both rates vary in the same way with heliocentric distance.
4. Conclusions
In this work, we have calculated the photoabsorption cross section for the HCN and HNC isomers in the 7–13.6 eV energy range using the lower 21 adiabatic electronic states. For HCN, the calculated cross section has been compared to the available experimental data, and the differences are attributed to the non-adiabatic transitions, which are absent in the present calculations. The effect of non-adiabatic transitions is expected to be similar for both isomers. In any case, the construction of a diabatic model to account for non-adiabatic transition is now in progress to asses this assumption.
The present calculated photoabsorption cross sections are used to obtain the ratio of photodissociation rates between HCN and HNC for different UV fields, and the absolute value calculated for HNC is renormalized on the basis of the experimental rate of HCN. We find that HNC is photodissociated faster than HCN by factors between ≈2 and ≈10, depending on the spectral shape of the UV radiation field. In the case of diffuse interstellar clouds, where HNC is found to be photodissociated 2.2 times faster than HCN, the calculated HNC/HCN abundance ratio is below 1, in the range 0.5–0.8. The enhanced photodissociation rate of HNC with respect to HCN arises as a possible explanation for the underabundance of HNC compared to HCN in many other astronomical environments.
We thank Prof. J.A.C. Varandas for providing us with the fortran code of their PES for the ground electronic state. The research leading to these results has received funding from the European Research Council under the European Union's Seventh Framework Programme (FP/2007-2013)/ERC Grant Agreement no. 610256 (NANOCOSMOS). We also acknowledge support by the Ministerio de Economía e Innovación under grants Nos. CSD2009-00038, AYA2012-32032, AYA2016-75066-C2-1-P and FIS2014-52172-C2. M.A. thanks funding support from the Ramón y Cajal programme of Spanish MINECO (RyC-2014-16277). The calculations have been performed in the CCC-UAM and trueno-CSIC computing centers.
Appendix A: Electronic Configurations and Assignment
In Table 2 we show the electronic configurations with a weight larger than 25% for each electronic state, for the HCN and HNC geometries. Most of the states have a single dominant configuration, and those that have more can be grouped in couples with two configurations with similar weights. This allows us to assign each excited electronic state to the one electron excitation from one occupied orbital to a valence or Rydberg state. The orbitals and the electronic configurations vary from HCN to HNC, as shown in Table 2.
Table 2. Electronic Configurations of Higher Contribution for Each of the Electronic States Calculated for HCN and HNC Geometries
| State | HCN | HNC | ||||
|---|---|---|---|---|---|---|
| Symmetry | Configurations | Symmetry | Configurations | |||
| 11A' | 1Σ+ | ⋯5a'26a'2 | 1a''2 | 1Σ+ | ⋯5a'26a'2 | 1a''2 |
| 21A' | 1Δ | ⋯5a'26a'2 | 1a''2a'' | 1Σ+ | ⋯5a'26a' 8a' | 1a''2 |
| ⋯5a'26a'7a' | 1a''2 | |||||
| 31A' | 1Π | ⋯5a'26a' 8a' | 1a''2 | 1Π | ⋯5a'6a'2 8a' | 1a''2 |
| ⋯5a'6a'27a' | 1a''2 | |||||
| 41A' | 1Π | ⋯5a'26a' 8a' | 1a''2 | 1Σ+ | ⋯5a'26a' 9a' | 1a''2 |
| ⋯5a'6a'27a' | 1a''2 | |||||
| 51A' | 1Π | ⋯5a'26a' 9a' | 1a''2 | 1Δ | ⋯5a'6a'2 7a' | 1a''2 |
| ⋯5a'26a'2 | 1a''2a'' | |||||
| 61A' | 1Σ+ | ⋯5a'6a'2 8a' | 1a''2 | 1Σ+ | ⋯5a'26a' 10a' | 1a''2 |
| 71A' | 1Σ+ | ⋯5a'6a'2 9a' | 1a''2 | 1Π | ⋯5a'26a'7a' | 1a''2 |
| 81A' | 1Δ | ⋯5a'26a' 10a' | 1a''2 | 1Π | ⋯5a'6a'2 9a' | 1a''2 |
| ⋯5a'26a'2 | 1a'' 3a'' | |||||
| 91A' | 1Σ+ | ⋯5a'26a' 10a' | 1a''2 | 1Δ | ⋯5a'26a'2 | 1a'' 3a'' |
| ⋯5a'26a'2 | 1a'' 3a'' | |||||
| 101A' | 1Π | ⋯5a'6a'2 10a' | 1a''2 | 1Σ+ | ⋯5a'26a' 11a' | 1a''2 |
| 111A' | 1Σ+ | ⋯5a'26a'7a' | 1a''2 | 1Π | ⋯5a'6a'2 10a' | 1a''2 |
| ⋯5a'26a'2 | 1a''2a'' | |||||
| 121A' | 1Σ+ | ⋯5a'26a'7a' | 1a''2a'' | 1Π | ⋯5a'6a'2 11a' | 1a''2 |
| 11A'' | 1Σ− | ⋯5a'26a' | 1a''22a'' | 1Π | ⋯5a'26a'2 8a' | 1a'' |
| ⋯5a'26a'27a' | 1a'' | ⋯5a'26a' | 1a''2 2a'' | |||
| ⋯5a'26a' | 1a''2 3a'' | |||||
| 21A'' | 1Δ | ⋯5a'26a' | 1a''22a'' | 1Π | ⋯5a'26a'2 8a' | 1a'' |
| ⋯5a'26a'27a' | 1a'' | ⋯5a'26a' | 1a''2 2a'' | |||
| ⋯5a'26a' | 1a''2 3a'' | |||||
| 31A'' | 1Π | ⋯5a'6a'2 | 1a''22a'' | 1Σ− | ⋯5a'6a'2 | 1a''2 2a'' |
| ⋯5a'26a'2 8a' | 1a'' | |||||
| 41A'' | 1Π | ⋯5a'6a'2 | 1a''22a'' | 1Δ | ⋯5a'26a'27a' | 1a'' |
| ⋯5a'26a'2 8a' | 1a'' | |||||
| 51A'' | 1Π | ⋯5a'26a'2 9a' | 1a'' | 1Π | ⋯5a'26a' | 1a''22a'' |
| ⋯5a'26a' | 1a''2 3a'' | |||||
| 61A'' | 1Δ | ⋯5a'26a'2 10a' | 1a'' | 1Π | ⋯5a'26a'2 9a' | 1a'' |
| ⋯5a'26a' | 1a''2 3a'' | |||||
| 71A'' | 1Σ− | ⋯5a'26a'2 10a' | 1a'' | 1Δ | ⋯5a'6a'2 | 1a''2 3a'' |
| ⋯5a'26a' | 1a''2 3a'' | |||||
| 81A'' | 1Π | ⋯5a'6a'2 | 1a''2 3a'' | 1Π | ⋯5a'26a'2 10a' | 1a'' |
| 91A'' | 1Π | ⋯4a'5a'26a'2 | 1a''22a'' | 1Π | ⋯5a'26a'2 11a' | 1a'' |
Download table as: ASCIITypeset image
The molecular orbitals obtained for HCN and HNC are shown in the left and right panels of Figure 1, respectively, and allow a tentative assignment of the excitation. The 8a', 9a', 10a', and 3a'' orbitals of HCN and the 9a', 10a', and 3a'' orbitals of HNC are more diffuse than the others covering a considerably larger region, and are considered as Rydberg orbitals. Their energy position changes with the angular configuration from HCN to HNC. Those states that have a main configuration with a Rydberg orbital for any angular configuration can be associated to a Rydberg state. Thus, only the first two states of 1A' and 1A'' can be considered as valence states, and the 31A' is mixed case. The rest are essentially Rydberg states, and all of them have the two wells at HCN and HNC linear configurations that are also present in the cation.
The electronic configurations of many adiabatic states change considerably from HCN to HNC, and thus the symmetry does too, as listed in Table 2. For example, the 21A' corresponds to a 1Δ symmetry for HCN while it is a 1Π state for HNC. While the C2v is only valid at colinear geometries, it introduces important propensity rules for the absorption strength, and for the 21A' state, the transition dipole moment is very small for HCN while it is considerably high for HNC (Chenel et al. 2016).
Appendix B: Individual Electronic and Rotational Absorption Bands
In Figures 4 and 5 we show the absorption spectra comparing the calculated  individual rotational transitions to a particular excited electronic state for HCN and HNC, respectively. All the initial bound states considered correspond to the parity
  , containing the Ω = 0 projection, and they are located around the collinear HCN or HNC angular configurations. "Q" transitions, with Jf = Ji, imply a change of parity meaning that the excited wave packet, with Jf = Ji and parity
  , does not contain the projection of Ω. This explains why some peaks for
  are absent and present a lower intensity in many cases, especially for those final electronic states correlating to a Σ state at collinear geometries, for which the dx or dy are approximately zero. The "P" (ΔJ = −1) and "R" (ΔJ = +1) branches present very similar patterns and the differences in the intensities are mainly due to geometric factors, included by the Clebsh–Jordan coefficients.
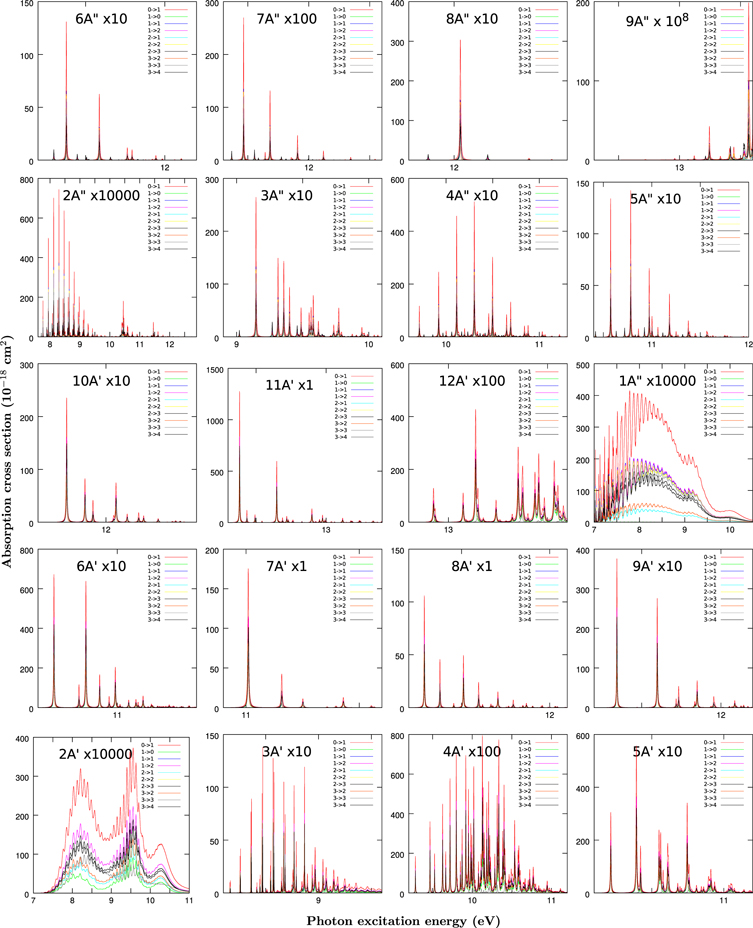
Figure 4. Absorption spectra from HCN ground state and Ji toward the final electronic state indicated in each panel and  and Ji + 1. The spectra are multiplied by a factor also indicated in each panel.
Download figure:
Standard image High-resolution image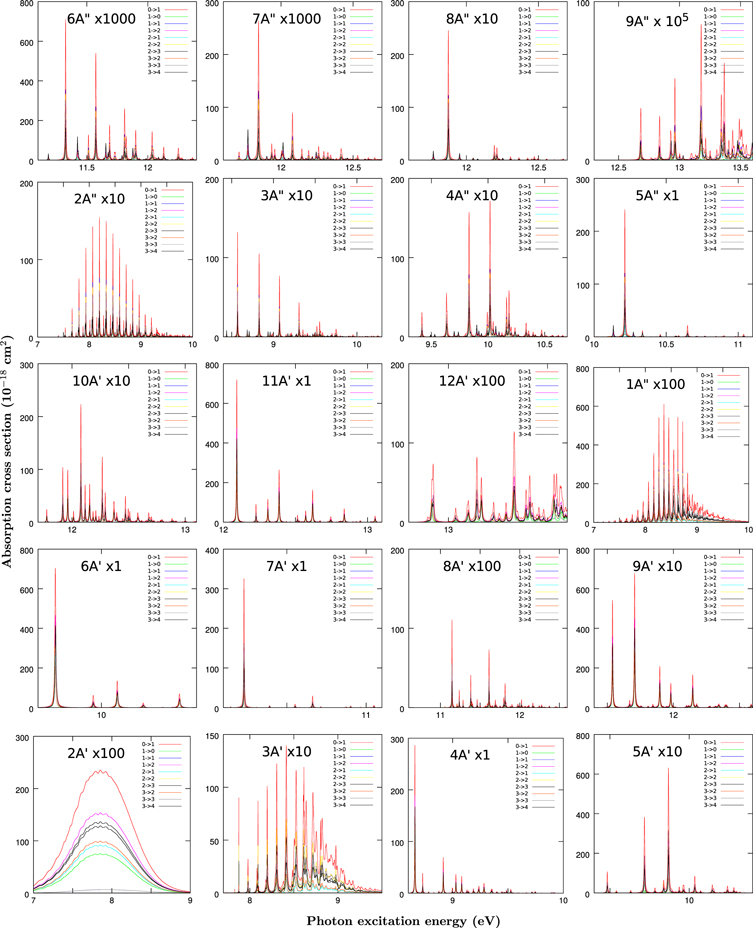
Figure 5. Same as Figure 4 but for the HNC isomer.
Download figure:
Standard image High-resolution imageThe shape of the spectra varies with the final electronic state. The 21A' and 11A'' states are dissociative in the Franck–Condon region dealing with very broad structures. In the case of HCN these two states correlate to 1Δ and 1Σ− symmetry, both forbidden, which explains their low intensity (Chenel et al. 2016). For HNC configuration, however, these two states correlate to 1Σ+ and 1Π symmetry, both allowed and showing a much larger intensity. This explains why the photodissociation absorption cross section is considerably larger for HNC than for HCN in the 7–10 eV excitation energy range (Chenel et al. 2016).
The Franck–Condon factors for the 31A' state lie in the bound and dissociative regions, for both HCN and HNC, and are composed by peaks which get broader with excitation energy, since they correspond to resonances which dissociate through a barrier originated by an avoided crossing; these have been analyzed in detail (Herzberg & Hines 1957; Hsu et al. 1984; Meenakshi & Innes 1986; Eng et al. 1987; Jonas et al. 1990; Xu et al. 2001, 2002a, 2002b, 2003; Chenel et al. 2016).
The remaining states, Rydberg states, present a double well structure similar to the ground state and those present in the cation. Their spectra are formed by narrow peaks (broadened in the simulations by introducing a time window in the Fourier transform to get the spetra from the autocorrelation function). In the 81A'' case the Franck–Condon factor to a single rovibrational state dominates. This indicates that the vibrational functions in the ground and excited state are very similar. For this reason, the larger intensity very often correspond to the ground vibrational state on each Rydberg state.
The contributions of each excited electronic state to the total absorption spectra are mixed in energy, especially for photon energies above 10 eV, but an assignment can be done by comparing Figures 2 with 4 and 5. All the rotational transitions in Figures 4 and 5 are very similar, since the rotational constants for the ground and excited electronic states are quite close. Also, for these low Ji ≤ 3, the Coriolis coupling does not seem to be strong enough to give rise to new lines, thus increasing the congestion of the spectra approaching the experimental one at 10 K.
In order to check the effect of rotational temperature, the results obtained for the HCN( ) transitions are compared with those of HCN(
 ) for the absorptions to 51A' and 41A'' in Figures 6 and 7. For the 51A' state the transitions do not appreciably shift and there is no more lines. The differences in the intensity are simply due to the
  geometric factor in Equation (4) of Chenel et al. (2016) due to the sum over Mi projections for linearly polarized light. On the contrary, for the 41A'' new transitions appear giving rise to a significantly more congested spectrum. Ji = 10 has a contribution of ≈4% for a temperature of 100 K, increasing to 7% for 300 K.
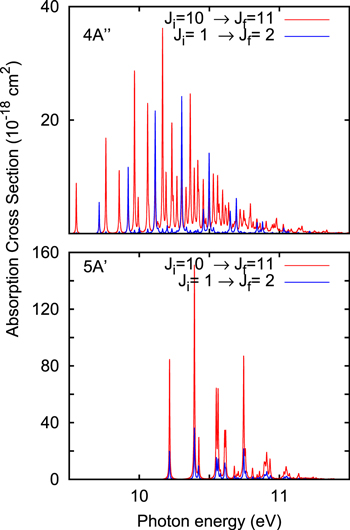
Figure 6. Absorption spectra for the  and
and  for the 51A' (bottom panel) and 41A'' (top panel) states for the HCN isomer.
Download figure:
Standard image High-resolution image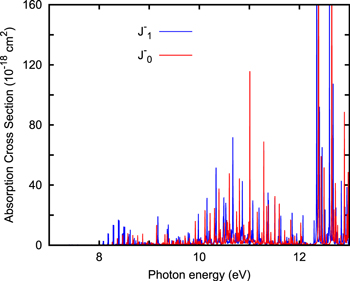
Figure 7. Absorption spectra (summed over all excited electronic states) obtained for the HCN( ) rotational transition from two different initial states,
  and
and  (this one at 712 cm−1 above
  the ground level for Ji = 1).
Download figure:
Standard image High-resolution image
For larger temperatures, rotational sublevels with Ωi > 0 may occur (in modes including bending). For these cases, in addition to the rotational congestion there is an important variation (typically an increase) of the intensity because the transition dipole moments vary sharply with the angle γ (Chenel et al. 2016). In order to check this effect, the HCN( ) transitions from the ground (
 , ν = (0, 0, 0) J = 1) and first excited rotational sublevel (
 , ν = (0, 1−, 0) J = 1) have been studied, which correspond to those with maximum components in Ω = 0 and 1, respectively. Clearly, the absorption from HCN(
 ) is more intense than from the ground HCN(
 ), and new peaks are observed. The increase of the intensity below 10 eV with the bending is due to the sharp increase of the transition dipole moment for the 21A', 11A'', and 21A'', as described above (Chenel et al. 2016). The apparition of new lines seems to indicate that the angular region explored by the HCN(
 ) state is also larger. Thus, the Franck–Condon factors become appreciable to allow excitation of higher bending levels. All of these factors indicate that the photodissociation spectra of HCN and HNC depend strongly on temperature.
Footnotes
- 4
We note that the studies of Liszt & Lucas (2001) and Godard et al. (2010) assume that the excitation temperature of the N = 1–0 transition is similar for HCN and HNC, which does not take into account the fact that the collisional rate coefficient of this transition is significantly higher for HNC than for HCN (Sarrasin et al. 2010), which, depending on the density, could result in a more or less marked upward revision of the HNC/HCN abundance ratios.