


Abstract
To investigate the responses of Earth's radiation belt electrons during magnetic storms and their correlations with magnetospheric chorus and plasmaspheric hiss waves, a statistical analysis is conducted using high-quality Van Allen Probes measurements during 68 isolated geomagnetic storms from 2012 September to 2017 December. The variations of radiation belt electron fluxes exhibit high dependence on electron kinetic energy, L-shell, and geomagnetic storm magnitude. It is found that the Increase-type events increase considerably with L-shell at L ∼ 3.0–5.0, the Decrease-type events tend to occur more frequently at L = 3.7–4.7 for <1 MeV electrons during weak storms and at L = 3.5–6 for >1 MeV electrons during moderate storms, and the No-change-type storm events are relatively dominant for extremely high-energy (>5.2 MeV) electrons. Superposed epoch analyses for the three types of storm events indicate that compared to relativistic (604 keV) electrons, ultrarelativistic (3.4 MeV) electron flux enhancements are more likely in association with elevated solar wind pressure during the storm initial phase, enhanced southward initial mass function Bz during the storm main phase, and prolonged high solar wind speed during the storm recovery phase. It is also shown that the dynamic variations of relativistic (604 keV) electron fluxes are closely connected to the activity level of chorus waves, but the three variation categories of ultrarelativistic (3.4 MeV) electrons have basically comparable intensities of chorus waves possibly due to the loss mechanisms becoming more dominate for their No-change-type or Decrease-type events. From a statistically observational perspective, chorus waves act as a critical candidate for relativistic electron acceleration and plasmaspheric hiss as a viable cause for relativistic electron loss.
Export citation and abstract BibTeX RIS
1. Introduction
The Earth is surrounded by two donut-shaped radiation belts, which form the intense particle radiation environment in geospace that can pose potential danger to both satellites and astronauts. While the inner belt is relatively stable (Xiang et al. 2020), the outer radiation belt is highly dynamic during geomagnetic storms (Reeves et al. 2003; Tu et al. 2009). During storm main phases, ∼10s–100 keV electron fluxes generally experience increases, but the electron fluxes of higher energies up to a few MeV either increase or remain unchanged or decrease followed by several days of recovery (Reeves et al. 2013; Thorne et al. 2013a, 2013b; Turner et al. 2013; Ni et al. 2015, 2016).
Electron flux dynamics in the outer radiation belt depend highly on electron energy, L-shell, and the level of geomagnetic disturbance. Using POLAR and LANL satellite data, Reeves et al. (2003) analyzed the responses of ∼1–3 MeV electrons during 276 moderate and intense geomagnetic storms that spanned the 11 yr from 1989 through 2000. They found that 53% of storms increased the radiation belt relativistic electron fluxes, 28% produced little or no effect on the fluxes, and 19% decreased the fluxes. Using SAMPEX and POES satellite data, Xiong et al. (2015) showed that 0.3–2.5 MeV electron fluxes increase in 87% of 84 isolated magnetic storm events, whereas 2.5–14 MeV electron fluxes increase in only 35% of the storms. Using data from the Magnetic Electron and Ion Spectrometers (MagEIS) instrument on board Van Allen Probes, Turner et al. (2015) examined the storm-time responses of tens of keV to 2 MeV electrons at L = 2.5–6.0 and found that hundreds of keV electrons increase during over two thirds (and up to 87%) of storm recovery phases at L = 3.1–4.6. Using Relativistic Electron Proton Telescope (REPT) measurements on board Van Allen Probes, Moya et al. (2017) established similar statistics about 1.8–6.3 MeV electrons, and concluded that the number of enhancement events decreases with increasing energy and decreasing L-shell. Furthermore, both Moya et al. (2017) and Turner et al. (2019) suggested that >MeV electrons prefer to decrease in the heart of the outer radiation belt.
There are also a number of studies concerning the complexity of electron responses with respect to varying intensities and drivers of geomagnetic storms. Anderson et al. (2015) collected 342 small storms with disturbance storm time (Dst) > −50 nT from 1989 to 2000, and found that, compared to storms studied by Reeves et al. (2003), weak storms are 10% less likely to result in the flux enhancements at the geostationary orbit and 10% more likely to result in the flux depletions. Kim et al. (2015) concluded that geomagnetic storms are not directly relevant to the electron flux enhancements by examining 65 storm-associated and 17 non-storm-associated relativistic electron enhancement events at the geostationary orbit. Kilpua et al. (2015) founded that for >2 MeV electron responses at the geostationary orbit, coronal mass ejection (CME) sheath and CME ejecta-driven storms tend to produce the electron depletion, while CMEs and corotating interaction region driven storms are more effective to produce electron acceleration. Reeves et al. (2011) proposed a triangle-shaped distribution between the solar wind speed and electron fluxes. Li et al. (2015) concluded that the southward initial mass function (IMF) Bz, high solar wind speed, and low dynamic pressure are crucial for >1 MeV electron acceleration in the heart of the outer radiation belt. Using the normalized superposed epoch analysis, Ni et al. (2016) reported that radiation belt electron fluxes exhibit significant depletions during periods of solar wind dynamic pressure pulse under southward IMF Bz conditions.
Wave−particle interactions play important roles in dynamics of radiation belt electrons. Inward radial diffusion due to interact with ultralow frequency waves and energy diffusion produced by chorus and magnetosonic waves (Horne et al. 2007; Thorne et al. 2013b; Fu et al. 2019a) can lead to electron acceleration. In contrast, electron loss mechanisms include magnetopause shadowing, outward radial diffusion and pitch angle diffusion induced by waves including plasmaspheric hiss, EMIC waves and lightning-generated whistlers (Turner et al. 2013; Cao et al. 2017a, 2017b; Xiang et al. 2017; Fu et al. 2018, 2019b; Ni et al. 2018; Zhao et al. 2019). Moreover, hiss waves have been well established as a loss mechanism to produce persistent slow decay of energetic electron fluxes following substorm injections, even during quiet times (e.g., Summers et al. 2007; Ni et al. 2013, 2014). It was also confirmed that energy diffusion by chorus waves are viable for local electron flux enhancements on timescales of days or less during the storm recovery phase (e.g., Horne et al. 2005; Thorne et al. 2013b).
In this study, we use high-quality radiation belt electron flux observations from Van Allen Probes to extract the statistical features of outer radiation belt electron dynamics with respect to electron energy and L-shell values during isolated geomagnetic storms with varying intensities. Through superposed epoch analysis, the relationships between radiation belt electrons dynamics and solar wind parameters, plasmapause location and magnetospheric waves (i.e., chorus and hiss) are investigated.
2. Data and Methodology
First, we identify geomagnetic storm events using 1 minute SYM-H values from the OMNI database (fttp://spdf.gsfc.nasa.gov/pub/data/omni/). A geomagnetic storm in our study is identified when the SYM-H index is lower than −30 nT and no other geomagnetic storm occurs during the period of 3 days before and 5 days after the time when SYM-H reaches the minimum value, namely only isolated storms are investigated to ensure clear responses of radiation belt electrons. Based on this selection criterion, 68 geomagnetic storms are identified during the period from 2012 September to 2017 December (the details of these storms are shown in Table 1, including 15 strong storms (SYM-H ≤ −100 nT), 28 moderate storms (−100 nT < SYM-H ≤ −50 nT) and 25 weak storms (−50 nT < SYM-H ≤−30 nT; Gonzalez et al. 1994).
Table 1. List of Isolated Geomagnetic Storms During the Period from 2012 September to 2017 December for Examination in this Study
| Start Date/Time | (SYM-H) min Date/Time | End Date/Time | (SYM-H) min (nT) | |
|---|---|---|---|---|
| 1 | 2014 Mar 25/13:50 | 2014 Mar 26/08:18 | 2014 Mar 26/23:08 | −30 |
| 2 | 2013 Sep 18/10:56 | 2013 Sep 19/04:58 | 2013 Sep 20/01:57 | −31 |
| 3 | 2017 Dec 25/08:19 | 2017 Dec 25/23:33 | 2017 Dec 26/16:38 | −31 |
| 4 | 2015 Apr 27/01:36 | 2015 Apr 28/00:37 | 2015 Apr 28/19:16 | −32 |
| 5 | 2016 Aug 17/12:41 | 2016 Aug 18/08:16 | 2016 Aug 19/07:38 | −32 |
| 6 | 2014 Jan 25/03:42 | 2014 Jan 26/06:36 | 2014 Jan 27/01:25 | −33 |
| 7 | 2015 Apr 01/20:43 | 2015 Apr 02/21:40 | 2015 Apr 03/02:04 | −33 |
| 8 | 2016 Jan 10/22:11 | 2016 Jan 12/00:45 | 2016 Jan 12/15:04 | −33 |
| 9 | 2013 Feb 06/23:30 | 2013 Feb 07/09:44 | 2013 Feb 07/16:04 | −34 |
| 10 | 2016 Jun 14/09:52 | 2016 Jun 15/01:00 | 2016 Jun 15/13:42 | −34 |
| 11 | 2017 Feb 23/06:43 | 2017 Feb 24/05:09 | 2017 Feb 24/21:31 | −34 |
| 12 | 2017 Dec 16/15:20 | 2017 Dec 17/20:30 | 2017 Dec 18/03:06 | −34 |
| 13 | 2013 Sep 24/01:19 | 2013 Sep 24/12:34 | 2013 Sep 24/13:52 | −35 |
| 14 | 2017 Aug 03/22:36 | 2017 Aug 04/14:44 | 2017 Aug 05/03:21 | −35 |
| 15 | 2014 Apr 20/06:23 | 2014 Apr 21/02:55 | 2014 Apr 21/08:12 | −36 |
| 16 | 2017 Apr 08/16:47 | 2017 Apr 09/04:10 | 2017 Apr 10/00:13 | −36 |
| 17 | 2017 Jul 09/02:18 | 2017 Jul 10/03:13 | 2017 Jul 10/16:28 | −37 |
| 18 | 2017 Jun 24/18:08 | 2017 Jun 25/06:56 | 2017 Jun 25/10:01 | −39 |
| 19 | 2017 Feb 16/19:26 | 2017 Feb 17/23:57 | 2017 Feb 18/21:05 | −41 |
| 20 | 2012 Sep 18/15:53 | 2012 Sep 19/22:41 | 2012 Sep 20/06:26 | −42 |
| 21 | 2013 Nov 15/12:50 | 2013 Nov 16/00:58 | 2013 Nov 16/21:10 | −42 |
| 22 | 2014 Mar 12/08:15 | 2014 Mar 13/03:52 | 2014 Mar 13/17:38 | −42 |
| 23 | 2014 May 22/20:39 | 2014 May 23/21:21 | 2014 May 23/22:32 | −42 |
| 24 | 2014 May 30/04:04 | 2014 May 30/19:24 | 2014 May 31/04:28 | −43 |
| 25 | 2013 Dec 24/21:58 | 2013 Dec 25/13:49 | 2013 Dec 26/09:27 | −45 |
| 26 | 2014 Oct 08/02:04 | 2014 Oct 09/06:20 | 2014 Oct 11/18:03 | −50 |
| 27 | 2013 Apr 23/11:45 | 2013 Apr 24/18:11 | 2013 Apr 28/07:48 | −52 |
| 28 | 2013 Oct 14/06:36 | 2013 Oct 15/03:18 | 2013 Oct 18/20:00 | −52 |
| 29 | 2016 Jun 05/03:50 | 2016 Jun 06/06:47 | 2016 Jun 10/03:20 | −55 |
| 30 | 2016 Nov 09/13:15 | 2016 Nov 10/15:21 | 2016 Nov 11/21:09 | −55 |
| 31 | 2013 Aug 03/22:38 | 2013 Aug 05/02:20 | 2013 Aug 08/20:57 | −56 |
| 32 | 2016 May 01/07:12 | 2016 May 02/03:19 | 2016 May 05/03:10 | −56 |
| 33 | 2013 Oct 30/02:58 | 2013 Oct 30/23:20 | 2013 Oct 31/17:04 | −57 |
| 34 | 2017 Nov 20/09:29 | 2017 Nov 21/06:50 | 2017 Nov 24/16:28 | −60 |
| 35 | 2013 Jan 25/16:19 | 2013 Jan 26/22:19 | 2013 Jan 27/20:08 | −62 |
| 36 | 2014 Nov 10/01:31 | 2014 Nov 10/17:07 | 2014 Nov 11/14:26 | −63 |
| 37 | 2016 Aug 02/17:17 | 2016 Aug 03/06:49 | 2016 Aug 06/19:29 | −63 |
| 38 | 2015 May 18/01:06 | 2015 May 19/02:55 | 2015 May 22/11:50 | −64 |
| 39 | 2017 Aug 30/22:54 | 2017 Aug 31/11:48 | 2017 Sep 01/04:24 | −64 |
| 40 | 2016 Apr 02/06:40 | 2016 Apr 02/22:49 | 2016 Apr 04/17:40 | −66 |
| 41 | 2016 Apr 07/09:14 | 2016 Apr 08/00:27 | 2016 Apr 10/10:36 | −67 |
| 42 | 2012 Oct 31/14:12 | 2012 Nov 01/20:01 | 2012 Nov 05/03:33 | −68 |
| 43 | 2015 Feb 16/23:53 | 2015 Feb 17/23:55 | 2015 Feb 21/21:57 | −70 |
| 44 | 2013 Dec 07/14:41 | 2013 Dec 08/08:30 | 2013 Dec 12/05:03 | −72 |
| 45 | 2014 Jun 07/23:32 | 2014 Jun 08/06:50 | 2014 Jun 08/07:34 | −72 |
| 46 | 2013 Feb 28/14:14 | 2013 Mar 01/10:12 | 2013 Mar 05/10:01 | −76 |
| 47 | 2015 Jul 22/06:37 | 2015 Jul 23/07:28 | 2015 Jul 26/21:09 | −83 |
| 48 | 2016 Aug 23/04:40 | 2016 Aug 23/21:13 | 2016 Aug 26/08:22 | −83 |
| 49 | 2015 Jul 04/12:50 | 2015 Jul 05/04:52 | 2015 Jul 08/21:04 | −87 |
| 50 | 2017 Nov 06/23:20 | 2017 Nov 08/04:04 | 2017 Nov 11/19:16 | −89 |
| 51 | 2013 Oct 01/23:23 | 2013 Oct 02/06:19 | 2013 Oct 06/05:44 | −90 |
| 52 | 2016 Jan 19/22:59 | 2016 Jan 20/16:42 | 2016 Jan 24/12:03 | −95 |
| 53 | 2014 Sep 11/16:38 | 2014 Sep 12/23:03 | 2014 Sep 15/17:19 | −97 |
| 54 | 2015 Aug 27/03:02 | 2015 Aug 27/20:32 | 2015 Aug 30/23:10 | −101 |
| 55 | 2015 Jun 07/07:36 | 2015 Jun 08/07:45 | 2015 Jun 12/07:39 | −105 |
| 56 | 2016 May 07/17:01 | 2016 May 08/08:15 | 2016 May 11/15:53 | −105 |
| 57 | 2016 Mar 05/23:15 | 2016 Mar 06/21:20 | 2016 Mar 10/15:56 | −110 |
| 58 | 2013 Jun 28/04:28 | 2013 Jun 29/06:34 | 2013 Jul 02/17:44 | −111 |
| 59 | 2016 Oct 12/19:27 | 2016 Oct 13/23:45 | 2016 Oct 16/08:32 | −114 |
| 60 | 2015 Dec 30/19:28 | 2016 Jan 01/01:07 | 2016 Jan 04/10:55 | −117 |
| 61 | 2012 Nov 13/02:28 | 2012 Nov 14/07:27 | 2012 Nov 17/07:54 | −118 |
| 62 | 2013 May 31/23:34 | 2013 Jun 01/07:48 | 2013 Jun 04/23:13 | −137 |
| 63 | 2012 Sep 30/08:41 | 2012 Oct 01/03:52 | 2012 Oct 05/00:50 | −138 |
| 64 | 2017 May 27/13:37 | 2017 May 28/07:13 | 2017 May 29/09:37 | −142 |
| 65 | 2017 Sep 06/18:05 | 2017 Sep 08/01:08 | 2017 Sep 12/00:35 | −146 |
| 66 | 2015 Dec 19/16:08 | 2015 Dec 20/22:49 | 2015 Dec 24/10:54 | −170 |
| 67 | 2015 Jun 22/16:15 | 2015 Jun 23/04:24 | 2015 Jun 25/05:38 | −208 |
| 68 | 2015 Mar 17/03:19 | 2015 Mar 17/22:47 | 2015 Mar 21/07:54 | −234 |
Van Allen Probes, launched into a geostationary transfer orbit in 2012 August, provide unprecedented high-quality particle and wave measurements (Mauk et al. 2013). In this study, electron fluxes measured by MagEIS (Blake et al. 2013; 54–1728 keV) and REPT (Baker et al. 2012; 2.1–7.7 MeV) are used to investigate the dynamic responses of radiation belt electrons during geomagnetic storms. The Electric and Magnetic Field Instrument Suite and Integrated Science (EMFISIS; Kletzing et al. 2013) measures both wave electric and magnetic fields, which are used to get the wave amplitude information of chorus and hiss during geomagnetic storms.
To distinguish different types (Increase, No-change, Decrease) of electron flux variations in response to geomagnetic storms, we perform bin-averaging of radiation belt electron fluxes at 90° pitch angles for each energy channel at L = 2.5–6.0 with the L-shell bin ΔL = 0.1 and time interval bin Δt = 4 hr. For ≥250 keV electrons, we define the prestorm peak flux as the maximum of electron fluxes during 0.5–3 days before the time epoch corresponding to the minimum SYM-H of the storm, while for lower energy electrons, the prestorm peak flux is the average electron flux during 0.5–3 days before the time epoch of the minimum SYM-H. The poststorm peak flux is defined as the electron flux maximum during 0.5–5 days after the minimum SYM-H. Note that different treatments are performed for ≥250 keV and <250 keV electrons, since the lower energy electrons can be replenished by substorm injections (Xiang et al. 2018) and frequently undergo less loss during storm main phases. By evaluating the ratio between the poststorm and prestorm peak electron fluxes, we classify the geomagnetic storms into three types with the definition similar to that in Reeves et al. (2003): "Increase-type storms" with the ratios >2, "Decrease-type storms" with the ratios <0.5, and "No-change-type storms" with the ratios in between.
3. Statistics of Storm-time Radiation Belt Electron Flux Variations
Figure 1(a) displays the number of three-type storm events and (b) the ratios between poststorm to prestorm peak fluxes corresponding to each of 68 isolated geomagnetic storms for the indicated electron energy channels ranging from 132 keV to 7.7 MeV. The storms are numbered from #1 to #68 on the horizontal axes according to the decrease of minimum SYM-H value. Figure 1(a) indicates that the number of Increase-type storm events decreases as electron energy increases, while the number of No-change-type storm events increases with electron energy. Meanwhile, the number of Decrease-type storm events increases with electron energy ≥4.2 MeV and then drops gradually at higher energies. A detailed check further tells that only five storms (#50, #55, #58, #65, #68) are the Increase-type for electron fluxes at all considered energies and only in four storms (#6, #7, #9, #36) are the No-change type for all considered energies. In addition, no storm event experiences electron flux decrease at all considered energies.

Figure 1. Overview of radiation belt energetic electron flux responses for 68 isolated geomagnetic storms from 2012 September to 2017 December. (a) Numbers of Increase-type, No-change-type, and Decrease-type storm events for electron energy channels ranging from 132 keV to 7.7 MeV. (b) The ratios between poststorm to prestorm peak fluxes as a function of geomagnetic storm event for the indicated eight electron energy channels. The red star points, black circles, and blue crosses indicate the Increase-type storm, No-change-type storm, and Decrease-type storm events, respectively. The storms are numbered from #1 to #68 on the horizontal axes according to the decrease of minimum SYM-H, with the weak, moderate, and strong geomagnetic storms bounded by the vertical green lines. The horizontal red and black lines indicate the ratio values of 2 and 0.5, respectively, which help distinguish the three types of storm-time radiation belt electron flux variations.
Download figure:
Standard image High-resolution imageBesides the strong energy dependence of storm-time radiation belt electron flux variations, there exists an evident dependence upon the intensity of the geomagnetic storm, as shown in Figure 1(b). For 25 weak storms (#1–#25, upper bounded by the left vertical green lines), the electron fluxes follow the Increase-type or No-change type for 132 and 354 keV. The Decrease-type events start to occur for 604 and 1066 keV. As electron energy continues to increase (i.e., ultrarelativistic), the electron fluxes behave either in a no-change or decrease manner and finally fall into the No-change-type at 7.7 MeV. For 28 moderate storms (#26–#53, bounded by the two vertical green lines), the Increase-type events are dominant for 132–604 keV and show an overall trend of higher poststorm-to-prestorm electron flux ratio with increasing storm intensity (i.e., minimum SYM-H). For ∼1.0–3.4 MeV electrons, their fluxes are highly dynamic, featured by the presence of all three types of flux variations and the dominance of either flux increase or decrease for the moderate storms with smaller values of minimum SYM-H. As electron energy increases to 5.2 and 7.7 MeV, there is an obvious transition of the electron flux profiles from considerable variations (either increase or decrease) to dominantly no change and finally to entirely no change between the prestorm and poststorm levels. For 15 strong storms (#54–#68, lower bounded by the right vertical green lines), <2 MeV electron fluxes mostly show the Increase-type. For 2.1–7.7 MeV, their fluxes dominantly exhibit the enhancements during the strong geomagnetic storms. Meanwhile, the Decrease-type events occur for 2.1, 3.4 and 5.2 MeV electrons except for 7.7 MeV electrons. In general, as the magnitude of geomagnetic storms increase, the electron fluxes are more likely to increase, especially for relativistic and ultra-relativistic electrons. For instance, the flux enhancement of 7.7 MeV electrons only occurs during the events of strong geomagnetic storms, in contrast to their almost no-change profiles at other periods. In addition, 2.1–5.2 MeV electron fluxes prefer to decrease during the periods of moderate geomagnetic storms, while 604–1066 keV electron fluxes are more likely to drop during weak geomagnetic storms.
The occurrence percentages of different response types of radiation belt electron fluxes (i.e., Increase, Decrease, and No-change) during the isolated geomagnetic storms are displayed in Figure 2 as a function of L-shell and electron kinetic energy. For all 68 isolated geomagnetic storms (Figure 2(a)), the Increase-type behaviors of <500 keV electrons at L = 3–6 are dominant, with the percentages >60%. For ∼500 keV–5 MeV electrons, the occurrence rates of Increase-type are between 30% and 60% at L > 4.0. The Decrease-type events are most likely to occur for ∼1–5 MeV electrons at L > 4.0 with the percentages ∼40%. In contrast, the No-change-type variations prefer to exist for extremely high-energy (>5.2 MeV) electrons at all considered L-shells or for >∼600 keV electrons at L < ∼3.5, with the rates reaching up to ∼100%.
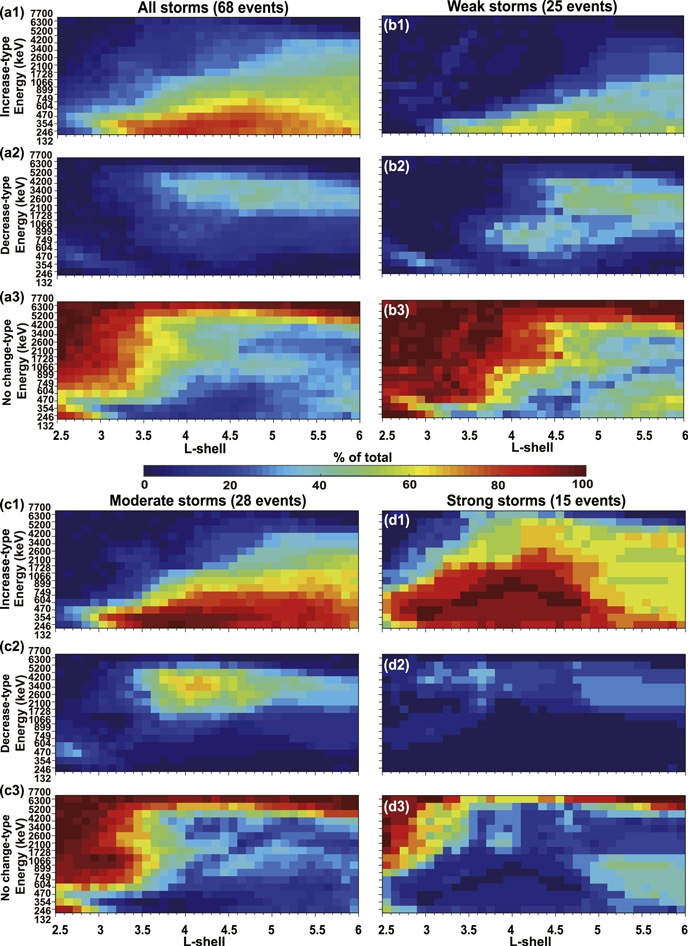
Figure 2. Occurrence percentages of different response types of radiation belt electron fluxes during geomagnetic storms as a function of L-shell (L = 2.5–6.0) and electron kinetic energy (132 keV–7.7 MeV). (a1)–(a3) for all 68 isolated geomagnetic storms, (b1)–(b3) for 25 weak storms (−50 nT < SYM-H < −30 nT), (c1)–(c3) for 28 moderate storms (−100 nT < SYM-H ≤ −50 nT), and (d1)–(d3) for 15 strong storms (SYM-H ≤ −100 nT).
Download figure:
Standard image High-resolution imageTo obtain more details and underlying correlations, the established database of isolated storms is divided into three storm intensity levels (weak, moderate, and strong storm events), as shown in Figures 2(b)–(d), respectively. Overall, weak storms have more No-change-type events while more Increase-type events occur in moderate storms and strong storms. Radiation belt electron flux variations during strong geomagnetic storms (Figure 2(d1)) are apparently dominated by the Increase-type events that cover the widest L-shell and electron energy ranges with the highest occurrence rates. Interestingly, during the periods of strong storms, the electron flux enhancements not only occur for relativistic and ultra-relativistic (i.e., 0.5–5 MeV) electrons at L > ∼3.0 but also for extremely high-energy electrons (i.e., >6 MeV) around the heart of the outer radiation belt with the percentages of ∼40%. For the Decrease-type variations of radiation belt energetic electrons, they are more likely to occur at energies of ∼0.5–5 MeV with the percentages ∼40%–70% under the conditions of weak (Figure 2(b2)) and moderate (Figure 2(c2)) geomagnetic storms and become infrequent with the percentages <30% at energies of ∼1–6 MeV during strong storms. Obviously, the dynamic variations of radiation belt electron fluxes during geomagnetic storms are highly sensitive to the storm intensity, electron kinetic energy and spatial location, which undoubtedly adds considerable complexity to exploration of underlying physical mechanisms.
Figure 3 shows the color-coded L-values corresponding to the poststorm peak fluxes (Lpspf) within 0.5–5 days as a function of electron energy and geomagnetic storm event sorted by the minimum of SYM-H (i.e., events numbered from #1 to #68). There are a number of interesting features to point out: (1) for < ∼250 keV electrons, the L-values of peak fluxes are predominantly located at L ≤ 3.0 for most storms; (2) for 250 keV−2 MeV electrons, the L-shells of peak fluxes generally penetrate to lower values as the geomagnetic storm magnitudes increase. The value of Lpspf is at L ∼ 5.0–6.0 for the weak storms (#1–#25), at L ∼ 4.0–5.0 for the moderate storms (# 26–#53), and below L ∼ 4.0 for the strong storms (#54–#68) which can even reach L < 3.0 for extremely strong storms with (SYM-H)min < −200 nT; (3) for electrons > ∼ 2 MeV, the L-shells of peak fluxes are mainly located at L ∼ 3.2–4.2 for the weak and moderate storms but move outwards within L ∼ 4.2–5.0 for the strong storms. Generally, while weak and moderate storms tend to produce the peak fluxes of <∼2 MeV electrons at L ∼ 5.0–5.5, strong storms are very likely to result in the electron fluxes at a broad energy range from hundreds of keV to up to ∼ 10 MeV peaking at L < ∼4.5. Such a variation trend of Lpspf with electron energy and geomagnetic storm intensity indicates that different physical processes operate for different ranges of electron energies under the impact of geomagnetic storms with different levels of magnitude.

Figure 3. Color-coded L-values corresponding to the poststorm peak fluxes (Lpspf) as a function of electron energy and geomagnetic storm event sorted by the decrease of SYM-H minimum (i.e., events numbered from #1 to #68).
Download figure:
Standard image High-resolution image4. Correlations Between Storm-time Radiation Belt Electron Dynamics and Wave Activities
As shown in Section 3, the variations of radiation belt electron fluxes are highly dynamic and complex and exhibit strong energy and L-shell dependence during geomagnetic storms. While some dynamic features can be explained by the energy-dependent substorm injections and the Dst effect (Kim & Chan 1997) associated with the geomagnetic field fluctuations, there are many more complex behaviors of storm-time radiation belt electron fluxes that cannot be simply attributed to the geomagnetic storms themselves, for example, the electron acceleration to ultra-relativistic energies, the preference of poststorm flux peak in the heart of outer zone, and the dominant losses of relativistic electrons during periods of weak and moderate storms.
It is generally agreed that interactions of magnetospheric waves with energetic electrons are of significant importance to improve our understanding of the storm-time radiation belt electron dynamics (Thorne 2010). There are two important wave modes in the inner magnetosphere that can drive effective wave–particle interactions: whistler-mode chorus waves outside the plasmasphere and plasmaspheric hiss mostly inside the plasmasphere. While playing a dual role in both the loss and local acceleration of radiation belt electrons, chorus waves have been found to be a viable mechanism driving the storm-time net flux enhancements of >∼MeV electrons over timescales of a few days or less than a day depending on the intensity of a geomagnetic storm (Thorne et al. 2013b). In contrast, hiss-induced electron scattering is a slower process and has been established to account for the long-term losses of energetic and relativistic electrons in the plasmasphere with different loss timescales following storm-time injections (e.g., Ni et al. 2013, 2019).
In order to investigate the correlation between the radiation belt electron flux variations and magnetospheric chorus and hiss activities for the identified 68 isolated geomagnetic storms, we perform a detailed superposed epoch analysis of the solar wind speed, the solar wind dynamic pressure, IMF Bz, SYM-H index, plasmapause location (based on the model of Liu et al. 2015), electron flux and average wave amplitude (binned over ΔL = 0.1 and Δt = 4 hr). By defining the zero epoch time as the time stamp of the minimum SYM-H index, we obtain the epoch analysis results shown in Figures 4 and 5 for two specific radiation belt electron energies, i.e., 604 keV (relativistic) and 3.4 MeV (ultra-relativistic). To minimize the pre-conditioning effect on the analysis of distinct responses of storm-time radiation belt electrons, we consider concentrating on the storms that have the similar level of prestorm electron fluxes. Specifically, for 604 keV electrons, we select 21 Increase-type storms, 12 No-change-type storms and 6 Decrease-type storms for further investigation. For 3.4 MeV electrons, we select 12 Increase-type storms, 15 No-change-type storms and 12 Decrease-type storms for subsequent analysis. We note that panel (e) presents the minimum plasmapause location over all MLTs, based on the model of Liu et al. (2015).

Figure 4. Superposed epoch analysis of 21 Increase-type storms, 12 No-change-type storms and 6 Decrease-type storms for radiation belt electrons at a relativistic energy of 604 keV. The panels, from top to bottom, show the results of solar wind speed, solar wind dynamic pressure, IMF Bz, SYM-H, the minimum plasmapause position over all MLTs, electron differential flux at 90° pitch angles, and the average wave amplitudes of chorus and hiss waves. The zero epoch time is defined as the time stamp of the minimum SYM-H, and the minimum plasmapause position (Lpp)min is computed based on the model of Liu et al. (2015).
Download figure:
Standard image High-resolution imageFor both 604 keV and 3.4 MeV electrons, the Increase-type events (red curves) generally have higher solar wind speed, stronger solar wind dynamic pressure, larger southward IMF Bz, smaller SYM-H minimum, and lower plasmapause location. By comparison, the solar wind and geomagnetic conditions for both No-change-type and Decrease-type events are mainly similar, especially for 3.4 MeV electrons, while the solar wind speed is much smaller and the minimum plasmapause location is further outwards for the Decrease-type events of 604 keV electrons. In addition, compared to the case of 604 keV electrons, the flux increase of 3.4 MeV electrons is more likely related to elevated solar wind pressure during the storm initial phase, enhanced southward IMF Bz during the storm main phase, and prolonged high solar wind speed during the storm recovery phase.
Correspondingly, panels (f)–(h) of Figures 4 and 5 show superposed epoch analysis results of differential electron fluxes at 90° pitch angles and of the wave amplitudes of chorus and hiss as a function of L-shell and epoch time for the two cases of 604 keV and 3.4 MeV electrons. The red curve in each panel shows the minimum plasmapause position, which clearly defines the spatial boundary between chorus and plasmaspheric hiss. For 604 keV electrons (Figure 4), there exists a pronounced difference in chorus wave amplitude profile for the three types of geomagnetic storms. The Increase-type events have stronger chorus wave amplitudes and associate broader L-shell range than the other two types. Specifically, the average chorus wave activity is at the level of a few to tens of pT during the entire course of the storm for the Increase-type events but is very weak or even disappears for the Decrease-type events, indicating that the presence of chorus waves is essential to the acceleration of 604 keV electrons during geomagnetic storms. In contrast, the hiss wave variations for the three-type events are smaller but still considerable. It is shown that while the hiss wave activity is consistently strong, at the level of tens of pT, inside the plasmapause location, it can extend outwards to higher L-shells for the No-change-type and Decrease-type events, thereby causing electron pitch angle scattering losses over a wider spatial region especially during the main and recovery phases of the storm. We also find that the variations of 604 keV electron fluxes present higher correlation with the chorus wave amplitudes compared to the hiss wave amplitudes, which implies that the variations of radiation belt relativistic electrons during geomagnetic storms can be more sensitive to chorus-driven acceleration processes.

Figure 5. Same as in Figure 4, except for the superposed epoch analysis results of 12 Increase-type storms, 15 No-change-type storms, and 12 Decrease-type storms for ultra-relativistic radiation belt electrons at 3.4 MeV.
Download figure:
Standard image High-resolution image
For such an ultrarelativistic energy of 3.4 MeV (Figure 5), the average profiles of chorus and hiss waves are quite different. The chorus wave amplitudes become comparable for all three categories of events during the storm main phases. Similar to 604 keV electrons, prolonged chorus wave activities with much larger amplitude during the recovery phase facilitate the acceleration of 3.4 MeV electrons. Interestingly, the corresponding hiss wave activities exhibit a tendency of enhancement for the Decrease-type events, featured by the wave amplitude level of >∼20 pT after the zero epoch time. The hiss wave amplitude is generally smaller for the Increase-type and No-change-type events so much that the waves can extend to a wider spatial extent for the latter. In contrast to 604 keV electrons, the differences between the chorus wave amplitude levels for the three types of events are much smaller, which strongly suggests that the controlling factor to affect the ultra-relativistic electron flux variations is not the amount of chorus-driven acceleration but possibly the loss mechanisms that become more dominant for the No-change-type or Decrease-type events of 3.4 MeV electrons.
A combined check of the average dynamics of electron flux and wave activity for electrons at these two high energies (Figures 4 and 5) yields the complexity of radiation belt relativistic electron variations in response to geomagnetic storm phases and the diverse contributions of different magnetospheric wave modes in operation. Overall, it is demonstrated from the observational perspective that both whistler-mode chorus and plasmaspheric hiss play an important role in modulating the dynamic responses of radiation belt electron fluxes to geomagnetic storms, in a definitive manner supporting that chorus waves act as a critical candidate for relativistic electron acceleration and plasmaspheric hiss as a viable cause for relativistic electron loss.
5. Conclusions
In the present study we have investigated the statistical responses of Earth's radiation belt electrons and their correlation with the chorus and hiss wave activities during 68 isolated geomagnetic storms, using Van Allen Probes observations from 2012 September to 2017 December. Considering the electron energies between 132 keV and 7.7 MeV, the spatial location range of L = 2.5–6.0, and the strength of geomagnetic storm in three levels (i.e., weak, moderate, and strong), we have identified three distinct types of radiation belt electron flux variations between the prestorm and poststorm periods. Furthermore, we have performed superposed epoch analysis for two representative relativistic and ultrarelativistic energy channels (i.e., 604 keV and 3.4 MeV) to look into the underlying relationship between the radiation belt energetic electron dynamics and two important magnetospheric waves (i.e., chorus and hiss) during geomagnetic storms.
The major conclusions are summarized as follows:
- 1.The variations of radiation belt electron fluxes exhibit high dependence on electron kinetic energy, L-shell, and geomagnetic storm magnitude. The Increase-type events decrease with increasing electron energy and increase considerably with L-shell at L ∼ 3.0–5.0. The Decrease-type events tend to occur more frequently at L = 3.7–4.7 for <1 MeV electrons during weak storms and at L = 3.5–6 for >1 MeV electrons during moderate storms. The No-change-type storm events are relatively dominant for extremely high-energy (>5.2 MeV) electrons.
- 2.The L-shell of poststorm peak flux (Lpspf) shows strong correlation with the geomagnetic storm strength. While weak and moderate storms tend to produce the peak fluxes of <∼2 MeV electrons at L ∼ 5.0–5.5, strong storms are likely to result in the location of electron flux peak at L < ∼4.5 for a broad energy range from hundreds of keV to ∼10 MeV, suggesting that different physical processes operate for different electron energies under the impact of geomagnetic storms with different levels of intensity.
- 3.The solar wind and geomagnetic conditions for both No-change-type and Decrease-type events are mainly similar to those for the Increase-type events, especially for 3.4 MeV electrons. Compared to relativistic (i.e., 604 keV) electrons, ultra-relativistic (i.e., 3.4 MeV) electron flux enhancements are more likely in association with elevated solar wind pressure during the storm initial phase, enhanced southward IMF Bz during the storm main phase and prolonged high solar wind speed during the storm recovery phase.
- 4.The dynamic variations of relativistic (604 keV) electron fluxes are closely connected to the activity level of chorus waves, but the three variation categories of ultra-relativistic (3.4 MeV) electrons have basically comparable intensities of chorus waves possibly due to the loss mechanisms becoming more dominate for their No-change-type or Decrease-type events. From the observational perspective, chorus waves act as a critical candidate for relativistic electron acceleration and plasmaspheric hiss as a viable cause for relativistic electron loss.
It is worthwhile to point out that the present study has only explored the related contributions of whistler-mode chorus and plasmaspheric hiss. There are some other magnetospheric wave modes, including magnetosonic waves and electromagnetic ion cyclotron waves, which can also pose their impacts upon the dynamics of radiation belt electron dynamics, which is left to future work.
This work was supported by the NSFC grants 41674163, 41974186, 41474141, 41574160, 41704162, 41904144, and 41904143, the Hubei Province Natural Science Excellent Youth Foundation (2016CFA044), the B-type Strategic Priority Program of the Chinese Academy of Sciences (Grant No. XDB41000000), the preresearch projects on Civil Aerospace Technologies No. D020303, D020308, and D020104 funded by China National Space Administration, and the National Postdoctoral Program for Innovative Talents (BX20190252). We thank the Van Allen Probes Science Team for providing the data. The electron fluxes data are available at the ECT Science Operations and Data Center (https://www.rbsp-ect.lanl.gov/data_pub/). The wave observations are obtained from the EMFISIS website (https://emfisis.physics.uiowa.edu/data/index), and the solar wind parameters and geomagnetic activity indices from the online OMNIWeb (http://cdaweb.gsfc.nasa.gov).