


Abstract
We have analyzed spectral properties and abundances of ∼0.02–3.0 MeV nucleon−1 suprathermal (ST) H–Fe ions in 41 stream interaction regions (SIRs) near 1 au observed by Wind and ACE spacecraft from 1995 January through 2008 December. We find that, (i) the event-averaged spectral index is γ ∼ 2.44, with a standard deviation (σ) of 0.67, (ii) γ's are poorly correlated with the magnetic compression ratios, and 17% of the events group around γ ∼ 1.5, (iii) γ's for both O and Fe at ∼0.02–0.09 MeV nucleon−1 and 0.09–0.3 MeV nucleon−1 are correlated, but do not exhibit any systematic steepening or flattening as a function of energy, (iv) the ST heavy ion abundance ratios remain constant with increasing energy, implying that the spectral rollovers, defined by the e-folding energy E0, are independent of the ion's mass per charge (M/Q), and (v) SIR ST abundances are similar to the corresponding solar wind values, and do not exhibit any systematic behavior when plotted versus the ion's M/Q or first ionization potential. The above results pose challenges for (1) particle acceleration models that invoke either a corotating interaction region or SIR shocks between ∼3 and 5 au, (2) particle transport models that predict M/Q-dependent spectral rollovers due to interplanetary turbulence effects, and (3) the notion that SIR ST ions originate directly from the bulk solar wind. Instead, we suggest that the SIR ST ions are accelerated out of a pool of material that includes particles accelerated in solar energetic particle events and processed or heated solar wind ions.
Export citation and abstract BibTeX RIS
1. Introduction
Corotating interaction regions (CIRs) occur when fast solar wind overtakes slow solar wind streams, and have long been known to be efficient particle accelerators, particularly during solar minimum (McDonald et al. 1976; Van Hollebeke et al. 1978; Richardson et al. 1993). This interaction leads to increased turbulence, magnetic compression, particle acceleration, and eventual shock formation. At 1 au, shocks are observed approximately 30% of the time and may bound the leading and trailing edges of the CIR (Jian et al. 2006). Energetic particle enhancements are observed in association with CIRs irrespective of whether a shock is concurrently observed (Hundhausen & Gosling 1976; Palmer & Gosling 1978). Numerous theories, along with many observational studies over the past decade have laid the groundwork for a basic understanding of CIRs (see Richardson 2018 for a recent review of the structure, and evolution of both plasma and energetic particle populations in CIRs).
In the traditional interpretation, CIR-associated particle enhancements near Earth orbit occur when particles accelerated further out in the heliosphere (∼3–5 au) propagate along interplanetary magnetic field (IMF) lines back to 1 au (e.g., Fisk & Lee 1980). As particles propagate sunward they exhibit sunward anisotropies, which have been observed in situ (e.g., Marshall & Stone 1978; Richardson 1985; Ebert et al. 2012a), although antisunward flows (e.g., Richardson & Zwickl 1984; Ebert et al. 2012a) and cross-field particle transport (Dwyer et al. 1997) have also been observed. However, reasonable choices for various model parameters such as solar wind speed and shock connection distance have produced simulated spectra that are inconsistent with in situ observations. For instance, the Fisk & Lee (1980) model predicts reduced particle intensities and lower energies (below ∼1 MeV nucleon−1) as a result of adiabatic deceleration as particles stream into the inner heliosphere away from the shock. To date, this phenomena has not been observed (Mason et al. 1997, 2008; Desai et al. 1999; Ebert et al. 2012b).
Recent observational studies have pointed to a local source near 1 au for CIR-related suprathermal (ST) ions below ∼1 MeV nucleon−1 (e.g., Mason et al. 2008; Ebert et al. 2012a, Filwett et al. 2017). Chotoo et al. (2000) found that the <0.5 MeV nucleon−1 H+, He+, and He++ intensities peaked between the CIR stream interface and the compression region trailing edge. Ebert et al. (2012b) used 73 CIR ST He intensity enhancements and observed that the peaks in the <0.8 MeV nucleon−1 He intensity enhancements coincided well with the arrival of the compression region trailing edges. These and other studies (e.g., Mason et al. 1997, 2008; Bučík et al. 2009; Ebert et al. 2012a) suggest that sub-MeV nucleon−1 particles associated with CIRs at 1 au may be accelerated locally. Finally, using the same events as this study, Filwett et al. (2017) used the average solar wind speed in the compression region and the time of maximum correlation between the upstream solar wind heavy ion abundances and the ST heavy ion abundances to estimate the travel distance along the IMF for <3.2 MeV nucleon−1 ions; these results suggested that such lower energy particles are probably accelerated within 1.0 au upstream of the compression region.
In this study we fit the ∼0.02–3.0 MeV nucleon−1 H–Fe spectra in 41 compression regions that were previously discussed in Filwett et al. (2017) and Broiles et al. (2012). Hereafter, we refer to these 41 events as stream interaction regions (SIRs). Filwett et al. (2017) used the CNO, NeS, and Fe abundances from Wind/EPACT/STEP to identify the source populations and acceleration locations of ST ions in these SIRs. We expand our earlier work by including the 0.09–3.0 MeV nucleon−1 H–Fe data from ACE/ULEIS, which extends the previous results in terms of both energy range and ion species. We fit the H–Fe energy spectra in each event with a power-law modified by an exponential rollover (Ellison & Ramaty 1985). We compare the fit parameters obtained using two different fitting methodologies. Furthermore, we report trends in SIR spectral indices and compression ratios, and discuss these in context of past and current theoretical models. We also compare our results with those from previous studies (i.e., Reames 1995; Mason et al. 1997, 2008; Bucik et al. 2012). We discuss specific limitations of the fits and the event-to-event variations in order to provide constraints for current acceleration and transport models.
2. Instrumentation and Methodology
The 41 events used in this study (See Table 1) were first identified by Broiles et al. (2012). Filwett et al. (2017) used these events to study heavy ion ST abundances in SIRs at 1 au between 1995 January and 2008 December. These 41 SIRs were selected after removing compression region intervals and times that had contributions from solar energetic particles (SEPs), upstream events, or other unrelated particle sources. Table 1 gives key properties of SIRs used in this study: Columns 2 and 3 show the start and stop intervals for each event, which was discussed by Filwett et al. (2017) Column 4 shows the ∼0.3–0.4 MeV nucleon−1 Fe/O ratio, Column 5 provides the species-averaged spectral index obtained using only energies ≤0.3 MeV nucleon−1 (see Sections 3 and 3.1), and Column 6 provides the magnetic compression ratio (see Section 3.2 for details).
Table 1. Properties of Stream Interaction Regions Studied Here
| Event Number | Start Date | End Date | Fe/O ratio 0.3–0.4 MeV nuc−1 | Mean Spectral Index | Compression Ratio |
|---|---|---|---|---|---|
| (1) | (2) | (3) | (4) | (5) | (6) |
| 1 | 1995 Jan 28 17:54 | Jan 31 3:36 | ⋯ | 3.02 ± 0.06 | 3.02 ± 0.40 |
| 2 | 1995 Apr 6 12:15 | Apr 8 19:12 | ⋯ | 2.55 ± 0.02 | 1.87 ± 0.09 |
| 3 | 1995 Apr 26 12:54 | Apr 28 0:00 | ⋯ | 1.50 ± 0.08 | 1.95 ± 0.10 |
| 4 | 1995 May 1 20:51 | May 4 10:48 | ⋯ | 3.30 ± 0.08 | 2.36 ± 0.10 |
| 5 | 1995 May 23 14:26 | May 26 14:24 | ⋯ | 2.52 ± 0.09 | 2.43 ± 0.16 |
| 6 | 1995 May 29 7:12 | Jun 1 7:12 | ⋯ | 2.39 ± 0.01 | 1.51 ± 0.11 |
| 7 | 1995 Jun 18 21:23 | Jun 21 0:00 | ⋯ | 2.83 ± 0.08 | 1.39 ± 0.06 |
| 8 | 1995 Jul 16 9:04 | Jul 17 14:24 | ⋯ | 1.81 ± 0.06 | 3.20 ± 0.44 |
| 9 | 1995 Aug 7 9:11 | Aug 10 2:24 | ⋯ | 3.29 ± 0.03 | 1.98 ± 0.06 |
| 10 | 1995 Dec 24 5:49 | Dec 26 7:12 | ⋯ | 3.40 ± 0.03 | 1.88 ± 0.22 |
| 11 | 1998 Jul 15 16:23 | Jul 20 23:48 | 0.030 ± 0.013 | 2.82 ± 0.09 | 2.27 ± 0.20 |
| 12 | 1999 Dec 2 23:16 | Dec 6 6:00 | 0.186 ± 0.010 | 1.63 ± 0.05 | 0.73 ± 0.02 |
| 13 | 2000 Feb 5 14:49 | Feb 7 18:00 | 0.186 ± 0.011 | 3.05 ± 0.06 | 2.46 ± 0.26 |
| 14 | 2000 Mar 22 10:55 | Mar 26 18:21 | 0.138 ± 0.005 | 1.72 ± 0.08 | 1.36 ± 0.08 |
| 15 | 2002 Mar 3 13:38 | Mar 11 6:37 | 0.169 ± 0.008 | 1.58 ± 0.09 | 1.01 ± 0.04 |
| 16 | 2002 Nov 20 10:16 | Nov 22 12:00 | 0.184 ± 0.013 | 2.66 ± 0.12 | 1.55 ± 0.08 |
| 17 | 2002 Dec 14 2:28 | Dec 17 0:31 | 0.168 ± 0.010 | 1.08 ± 0.06 | 1.65 ± 0.03 |
| 18 | 2004 Nov 20 7:12 | Nov 21 18:43 | 0.081 ± 0.019 | 3.49 ± 0.17 | 0.88 ± 0.04 |
| 19 | 2005 Jan 11 7:12 | Jan 13 0:00 | 0.043 ± 0.020 | 3.09 ± 0.13 | 1.27 ± 0.06 |
| 20 | 2005 Apr 3 15:43 | Apr 6 3:51 | 0.154 ± 0.041 | 2.38 ± 0.18 | 1.51 ± 0.07 |
| 21 | 2005 Jun 4 10:07 | Jun 10 12:08 | 0.095 ± 0.008 | 1.57 ± 0.06 | 1.44 ± 0.05 |
| 22 | 2005 Jun 23 1:56 | Jun 27 8:08 | 0.281 ± 0.118 | 2.30 ± 0.27 | 1.56 ± 0.11 |
| 23 | 2005 Oct 7 0:00 | Oct 8 19:12 | 0.072 ± 0.007 | 2.24 ± 0.06 | 2.92 ± 0.36 |
| 24 | 2005 Dec 18 20:19 | Dec 22 10:10 | 0.082 ± 0.042 | 3.27 ± 0.15 | 0.81 ± 0.03 |
| 25 | 2006 Jun 6 3:56 | Jun 7 15:36 | ⋯ | 3.73 ± 0.24 | 2.05 ± 0.19 |
| 26 | 2006 Jul 30 22:30 | Aug 4 11:38 | 0.032 ± 0.014 | 2.42 ± 0.13 | 2.35 ± 0.15 |
| 27 | 2006 Aug 6 23:12 | Aug 9 0:00 | 0.049 ± 0.017 | 2.53 ± 0.12 | 2.94 ± 0.32 |
| 28 | 2006 Aug 26 23:58 | Aug 28 2:24 | 0.053 ± 0.022 | 2.81 ± 0.13 | 1.98 ± 0.11 |
| 29 | 2006 Sep 23 11:38 | Sep 25 12:00 | 0.044 ± 0.007 | 2.78 ± 0.14 | 3.73 ± 0.49 |
| 30 | 2006 Oct 19 23:18 | Oct 24 14:24 | 0.076 ± 0.013 | 2.29 ± 0.15 | 3.81 ± 3.98 |
| 31 | 2006 Nov 9 11:49 | Nov 15 0:00 | 0.079 ± 0.007 | 1.93 ± 0.05 | 1.41 ± 0.03 |
| 32 | 2007 Jan 27 21:36 | Jan 20 9:36 | 0.061 ± 0.008 | 2.32 ± 0.13 | 1.93 ± 0.13 |
| 33 | 2007 Feb 27 0:57 | Mar 2 11:06 | 0.056 ± 0.011 | 1.64 ± 0.10 | 1.17 ± 0.06 |
| 34 | 2007 May 7 7:23 | May 11 2:32 | 0.051 ± 0.007 | 1.67 ± 0.07 | 3.45 ± 0.41 |
| 35 | 2007 May 17 20:25 | May 21 6:00 | 0.049 ± 0.016 | 1.56 ± 0.14 | 1.76 ± 0.08 |
| 36 | 2007 Sep 27 10:55 | Sep 30 0:00 | 0.109 ± 0.034 | 2.16 ± 0.22 | 2.66 ± 0.16 |
| 37 | 2007 Dec 16 12:00 | Dec 18 16:48 | 0.035 ± 0.012 | 2.80 ± 0.10 | 2.51 ± 0.25 |
| 38 | 2008 Feb 9 17:35 | Feb 11 18:28 | 0.086 ± 0.010 | 2.33 ± 0.06 | 2.06 ± 0.20 |
| 39 | 2008 Mar 26 2:15 | Mar 28 0:00 | 0.061 ± 0.028 | 1.79 ± 0.22 | 1.04 ± 0.08 |
| 40 | 2008 Aug 8 19:48 | Aug 11 14:24 | 0.028 ± 0.006 | 2.97 ± 0.06 | 2.32 ± 0.31 |
| 41 | 2008 Nov 23 22:33 | Nov 29 10:03 | 0.036 ± 0.010 | 2.94 ± 0.10 | 2.55 ± 0.45 |
Download table as: ASCIITypeset image
Figure 1 shows Event #26 as an example of an SIR. The figure shows particle, plasma, and magnetic field signatures that are typical of previously reported SIRs observed at 1 au (e.g., Jian et al. 2006). We note that the peaks in the magnetic field strength and plasma density that define the compression region are seen on 2006 July 30 22:30 UT, i.e., prior to the increase in solar wind speed. The arrival of the high-speed stream also corresponds to the peak in particle intensities, as reported in previous CIR studies (Mason et al. 1997).
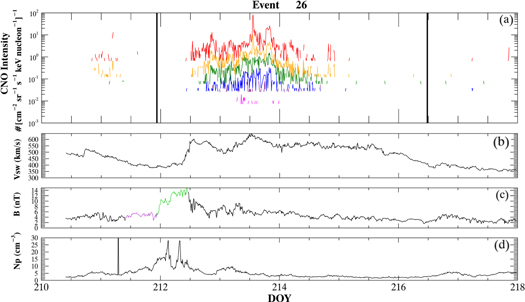
Figure 1. Energetic ion intensities, solar wind proton speed and density, and IMF strength for event 26 listed in Table 1, as observed on 2006 July 29–August 6. (a) CNO intensity from Wind at ∼20–40, ∼40–80, ∼80–160, and ∼160–320, ∼320–640 keV nucleon−1. Vertical black lines indicate the start and stop times for the event. Panels (b), (c), and (d) show the associated solar wind speed, interplanetary magnetic field strength, and solar wind proton density, respectively. Green and purple traces on the magnetic field magnitude indicate the downstream and upstream time intervals that were used to calculate the magnetic compression ratio (see the text for details).
Download figure:
Standard image High-resolution imageWe use ∼0.03–0.8 MeV nucleon−1 He–Fe from Wind/EPACT/STEP (von Rosenvinge et al. 1995) and ∼0.1–3.0 MeV nucleon−1 H–Fe from ACE/ULEIS (Mason et al. 1998); both Wind and ACE orbit around the L1 Lagrange point between the Earth and Sun. Additionally, solar wind proton speed and IMF magnitude were obtained from Wind/SWE and Wind/MFI, respectively. The maximum energy of the time-integrated energy spectra for each SIR was determined by visual inspection to exclude unrelated events.
We fit the energy spectrum for each species using the nonlinear least-squares Levenberg–Marquardt technique to minimize the χ2 distribution; all spectral fits were inspected both visually and statistically. We obtained the 1σ uncertainty in each parameter from the diagonal terms of the covariance matrix (e.g., Markwardt 2009). We fit each ion spectra with a single power law modulated by an exponential of the form

The three parameters of this fit are the normalization constant jo, the spectral index γ, and the spectral e-folding energy Eo. Previous work by Desai et al. (1999) and Mason et al. (2008) discussed the lack of orthogonality of Equation (1), demonstrating the need to fit the spectral index and e-folding energy independently. We first fit Equation (1) with all three parameters (jo, γ, E.0) simultaneously; this is referred to as Method I. In order to investigate how γ and Eo influence each other, we fit the spectrum below <0.3 MeV nucleon−1 to obtain γII, and then keep γII fixed in Equation (1) to obtain the other two free parameters (j0, E0); this is referred to as Method II. Both methods were independently applied to each species in each event. These two methods are illustrated using an arbitrary spectrum in Figure 2. For all species except H, He, and Ne we obtain γII using the energy spectra below ∼0.3 MeV nucleon−1; for these species we use the energy spectra below ∼0.55 MeV nucleon−1, this modified energy range was necessary due to the limits of the mass resolution for Wind/STEP and the reliability of data cross comparison between the Wind and ACE spacecraft.

Figure 2. Arbitrary spectrum illustrating the two different spectral fitting methods used in this study. The red fit shows a three free-parameter fit referred to as Method I. The blue spectrum is first fit for the spectral index, which is then held fixed in order to determine an independent value for the e-folding energy. This two-step fitting process is referred to as Method II.
Download figure:
Standard image High-resolution imageThe magnetic compression ratio was calculated by finding the mean magnetic field strength inside the identified SIR from the start time (forward boundary) to the stream interface, as identified by Broiles et al. (2012) this region is shown in green in Figure 1(c). We then averaged over an equal time interval immediately upstream of the compression region (purple in Figure 1(c)). Table 1 column 6 gives the calculated compression ratio of each event and the uncertainty quoted is the propagated standard error of the mean. We tried other methods for calculating the compression ratio in each event, such as calculating the ratio of the maximum magnetic field magnitude in the SIR to that measured immediately upstream. Each method had unique limitations, and we believe the method used here provides a reasonable estimate for the magnetic compression ratio for all events.
2.1. Comparison of Fitting Methods
Figure 3 compares the results of the two fitting methods using 11 heavy ion species in 41 SIRs. The figure shows that both the average spectral index and e-folding energy are larger when the parameters are fit independently (Method II). The mean for γII = 2.40 ± 0.11, with a standard deviation (σ) of 0.67, compared with Method I γI, which has a mean value of γI = 2.21 ± 0.20, with a σ of 0.93, as seen in Figure 3(a). Similarly, the e-folding energy, shown in Figure 3(b), is sensitive to the fitting method used; the average difference in e-folding energies found using Method I and Method II is 0.60 MeV nucleon−1.

Figure 3. Comparison of the spectral index γ described in Section 2, and the e-folding energy Eo using the two different fitting methods. The values plotted on the x-axis in each figure are obtained using Method I, as demonstrated in Figure 2. The y-axis in both (a) and (b) gives the parameters obtained from fits to the spectra using Method II.
Download figure:
Standard image High-resolution image3. Results
Figure 4 shows the event-integrated energy spectra of ∼0.09–3.0 MeV nucleon−1 H–Fe from Wind/STEP and ACE/ULEIS, for events 15 and 29, as defined in Table 1. The spectra in Figure 4 were fit using Method II, as discussed in Section 2. Figure 4(b) is an example of an event in which the majority of the species had an e-folding energy beyond the maximum energy range of the observable data considered in this study. For Figure 4(b), only Fe has an e-folding energy within the energy range considered for this event. For Figure 4(a), Event 15, we exclude the proton spectra because the fit failed to converge. The spectrum for each species is scaled by an arbitrary multiplication factor for visualization purposes.

Figure 4. H–Fe energy spectra in two SIRs. (a) Event 15 is an example in which most of the species exhibit a spectral rollover within the energy range studied here. (b) Event 29 is an example of an event where only one species (Fe) exhibits a rollover within the energy range studied here. The spectra are scaled by the arbitrary factors that are shown in the species label to allow better visualization.
Download figure:
Standard image High-resolution imageFigure 5 shows the deviation of the spectral index for each species from the mean spectral index for that event, the figure shows this value calculated for all events. The mean deviation for γII, shown in Figure 5 exhibits a tightly peaked Gaussian distribution, whereas γI shows a much broader Gaussian distribution with distinct outliers. This indicates that the spectral indices calculated using Method 1 vary more within the same event for different ion species, compared with those obtained using Method II. Likewise, for the same event, most of the species-associated changes are probably driven by differences in the e-folding values, as shown in Figure 3.
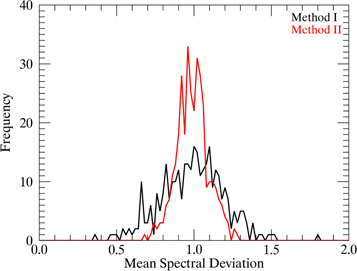
Figure 5. Deviation of H–Fe spectral indices from the mean spectral index, for all events in this study. The spectral indices are calculated using Method I (black) and Method II (red).
Download figure:
Standard image High-resolution image3.1. Event-to-event Variations
Figure 6 examines the event-to-event variations in the spectral index and e-folding energies. Figures 6(a) and (b) show the spectral indices (red dots) for all heavy ion species considered in this study, and the mean value for γ is indicated by the solid black line (averaged over all species within each event). The dashed line denotes the species and event-averaged mean (from Figure 5(b)), and the dotted lines are the ±1σ and ±2σ. Figure 6(a) shows 15 events with species-averaged means outside 1σ, and one event with a mean outside 2σ. Events 1–10 have only four spectral indices because the heavy ion species from Wind/STEP are grouped into He, CNO, NeS, and Fe. Figures 6(a) and (b) show that the event-averaged spectral indices are 2.29 ± 0.11 (Method I) and 2.44 ± 0.10 (Method II). Figures 6(d) and (e) show histograms of the spectral indices for all events and all species, the distribution is Gaussian, with a secondary peak near ∼1.6. We note that the mean values for all calculated spectral indices in Figures 6(d) and (e) are and −2.21 ± 0.20 (Method I) and −2.40 ± 0.11 (Method II), with a σ 0.76 and 0.67, respectively. Figure 6(c) shows the e-folding energy for all species for which the value was within ∼3.0 MeV nucleon−1. The majority of the events are observed to have more than one species with a rollover energy within the energy range used here. This allows us to further explore potential relationships between ion species and e-folding energy.
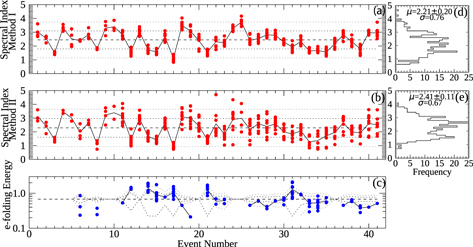
Figure 6. Event-to-event variations in the spectral index using the two methods described in Section 2 are shown in (a) and (b). Fitted spectral indices for all heavy ion species that rollover within the energy range used here. (c) The e-folding energy from Method II. In (a), (b), and (c) the species-average value within each event is shown as a solid black line, the dashed line indicates the values obtained by averaging over all species and events, and the dotted lines show the 1σ and 2σ from the mean. Panels (d) and (e) show the distribution of spectral indices for all events and all species, using Method I and Method II, respectively.
Download figure:
Standard image High-resolution imageFigure 7 compares the spectral indices (γII) in 29 events at 0.02–0.09 MeV nucleon−1 and 0.09–0.3 MeV nucleon−1 for Fe and O (CNO). Figure 7 compares 29 events because the spectral indices at 0.09–0.3 MeV nucleon−1 rely on the availability of ACE data (31 events), and an additional 2 events were excluded because of contributions from upstream events at ∼0.02–0.09 MeV nucleon−1. Figures 7(a) and (b) give the correlation coefficients (r) and the probabilities (p) that these values of r can be exceeded by an uncorrelated pair of parameters. With a correlation coefficient of r = 0.66 and p = 0.0001, the spectral indices for O at the lowest energies are well correlated with those obtained in the higher energy range. The spectral indices for Fe at 0.02–0.09 MeV nucleon−1 and 0.09–3.0 MeV nucleon−1 have a correlation coefficient of r = 0.35 with p = 0.07, which is not as statistically significant. In summary, the O and Fe spectral indices at 0.02–0.09 MeV nucleon−1 and 0.09–0.3 MeV nucleon−1 are reasonably similar to each other and exhibit no systematic steepening or flattening at higher energies.

Figure 7. Spectral indices of ∼0.02–0.09 MeV nucleon−1 CNO and Fe as measured by Wind/STEP compared to that of ∼0.09–0.3 MeV nucleon−1measured with Method II. The number of events, along with the correlation coefficient r, and statistical significance p, are given. Vertical and horizontal lines are drawn at γ = 1.5. An outlier for Fe is shown in black as it was not used to calculate the correlation coefficient.
Download figure:
Standard image High-resolution image3.2. Relationship between Spectral Index and Compression Ratio
Figure 8 shows the species-averaged spectral index in each event, plotted versus the magnetic compression ratio, H; where H = 1/β, with β being the inverse of the compression ratio described in Fisk & Lee (1980). We note here that the β discussed in Fisk & Lee (1980) is given by:
Here, V and B are the solar wind speed and magnetic field strength, respectively, and V' and B' refer to conditions downstream. The angular velocity of the Sun is given by Ω, and rs is the shock location. We do not account for the ratio of the downstream to upstream solar wind speed and distance to the shock, implying the values for H shown in Figure 8 are analogous to the β of Fisk & Lee (1980) within the first order. Figure 8 shows no clear trend between γII and H, and γII does not follow the expected theoretical trend described by Fisk & Lee (1980). Furthermore, Fisk & Lee (1980) derive β from a distribution function, f, in phase space whereas this study was done using differential intensity, j, but this relationship is well known and given by j = 2Ef /m2, where E and m are the ion's energy and mass.

Figure 8. Average spectral index vs. magnetic compression ratio in each SIR. The theoretical relationship between γ and H predicted by the Fisk & Lee (1980) model is also shown, along with a line showing the spectral index (γ = 1.5) predicted by Fisk & Gloeckler (2006). Filled symbols denote SIRs observed with shocks at 1 au (https://www.cfa.harvard.edu/shocks/wi_data/).
Download figure:
Standard image High-resolution imageFigure 8 groups the 41 SIR events further to investigate whether events with or without shocks at 1 au have different behavior. Filled symbols show SIR events with shocks at Wind. There is no indication that SIR events with shocks display any trend between H and γII. There are seven events with a species-averaged spectral index (considering their errors) of ∼1.5 ± 0.1, or about 17% of the events in this study, as can be seen in Figure 6(e).
3.3. Comparison of the Fitted e-folding Values to Abundance Ratio Trends
To investigate the species dependence of Eo within SIRs we plot the abundance ratio verses energy, along with the abundance ratios calculated from the spectral fit parameters using Method II. (see Mason et al. 2008). Figure 9 shows eight events, four of which (Events 14, 15, 31, and 34) have statistically significant values for the e-folding energy for the majority of the species. The other four events (Events 16, 22, 24, and 35) have two or fewer species with energy spectra that have finite e-folding energies. Overall, the abundance ratios show very little variation with energy and these trends are consistent with the behavior of the ratios of the spectral fits, shown as lines. In general, the abundance ratios remain fairly constant with energy, with some events exhibiting more variation than others. For example, in Event 31 the e-folding values for five species change by more than a factor of 2, and for two species the abundances ratios increase by a factor of ∼4. Fe is observed to rollover most frequently. On average, the abundance ratios remain constant with energy within a factor of ∼1.3.
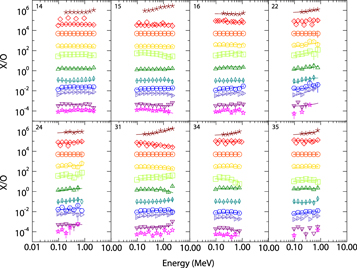
Figure 9. Abundance ratios relative to oxygen plotted vs. energy in eight SIR events. The lines show the abundance ratios for the same species as calculated from the ratios of the spectral fits using Method II. The event number is given in the top left corner of each panel.
Download figure:
Standard image High-resolution image3.4. Event-averaged Abundances
Table 2 gives the mean heavy ion abundances obtained by dividing the total fluence measured for each species by the O fluence in the 0.32–0.45 MeV nucleon−1 energy range during the corresponding sampling time interval and then averaged over 31 of the 41 SIR events. We refer to this energy range as the ∼0.38 MeV nucleon−1. Table 1 also lists the Fe/O ratio for individual events. We report only 31 events because ACE was launched in 1997 August and did not observe the 10 events seen at Wind. We choose to use ACE/ULEIS rather than Wind/STEP because the higher mass resolution for ULEIS yields abundances of 11 species.
Table 2. Mean Heavy Ion Abundance for Solar and Interplanetary Events
| Element | SIRsa | Slow SWb,c | Fast SWb,c | CIRsd | IP Shockse | Gradual SEPsf | Impulsive SEPsg | LSEPsh | Coronaj | |
|---|---|---|---|---|---|---|---|---|---|---|
| (∼0.38 MeV nucleon−1) | (∼1 keV nucleon−1) | (∼2 keV nucleon−1) | (∼1 MeV nucleon−1) | (∼0.75 MeV nucleon−1) | (5–12 MeV nucleon−1) | (0.385 MeV nucleon−1) | (∼0.38 MeV nucleon−1) | Photospherei | (∼1.4 × 10⁶ K) | |
| (1) | (2) | (3) | (4) | (5) | (6) | (7) | (8) | (9) | (10) | (11) |
| He | ⋯ | 95.9 ± 28.8 | 72.7 ± 21.8 | 211 ± 17 | 44.4 ± 14.4 | 57 ± 3 | 57 ± 3 | 75.0 ± 23.6 | 162 ± 14 | 126 ± 11 |
| C | 0.724 ± 0.078 | 0.670 ± 0.067 | 0.683 ± 0.068 | 0.94 ± 0.07 | 0.368 ± 0.004 | 0.465 ± 0.009 | 0.465 ± 0.009 | 0.361 ± 0.012 | 0.501 ± 0.058 | 0.490 ± 0.056 |
| N | 0.137 ± 0.026 | 0.069 ± 0.021 | 0.111 ± 0.033 | 0.15 ± 0.04 | 0.142 ± 0.002 | 0.124 ± 0.003 | 0.124 ± 0.003 | 0.119 ± 0.003 | 0.138 ± 0.022 | 0.123 ± 0.020 |
| O | ≡1 | ≡1 | ≡1 | ≡1 | ≡1 | ≡1 | ≡1 | ≡1 | ≡1 | ≡1 |
| Ne | 0.192 ± 0.032 | 0.091 ± 0.027 | 0.082 ± 0.025 | 0.17 ± 0.02 | 0.172 ± 0.003 | 0.152 ± 0.004 | 0.152 ± 0.004 | 0.152 ± 0.005 | 0.151 ± 0.021 | 0.191 ± 0.026 |
| Mg | 0.159 ± 0.027 | 0.147 ± 0.030 | 0.105 ± 0.021 | 0.10 ± 0.02 | 0.243 ± 0.004 | 0.196 ± 0.004 | 0.196 ± 0.004 | 0.229 ± 0.007 | 0.072 ± 0.009 | 0.224 ± 0.026 |
| Si | 0.110 ± 0.022 | 0.167 ± 0.034 | 0.115 ± 0.023 | 0.08 ± 0.01 | 0.213 ± 0.003 | 0.152 ± 0.004 | 0.152 ± 0.004 | 0.235 ± 0.011 | 0.071 ± 0.007 | 0.214 ± 0.022 |
| S | 0.026 ± 0.009 | 0.049 ± 0.010 | 0.056 ± 0.011 | 0.03 ± 0.01 | 0.050 ± 0.001 | 0.032 ± 0.001 | 0.032 ± 0.001 | 0.059 ± 0.004 | 0.032 ± 0.008 | 0.032 ± 0.008 |
| Ca | 0.008 ± 0.005 | 0.017 ± 0.003 | 0.0053 ± 0.0014 | ⋯ | 0.022 ± 0.002 | 0.011 ± 0.001 | 0.011 ± 0.001 | 0.022 ± 0.002 | 0.005 ± 0.0001 | 0.013 ± 0.0002 |
| Fe | 0.088 ± 0.018 | 0.120 ± 0.024 | 0.092 ± 0.018 | 0.10 ± 0.01 | 0.236 ± 0.010 | 0.134 ± 0.004 | 0.134 ± 0.004 | 0.404 ± 0.047 | 0.061 ± 0.006 | 0.186 ± 0.017 |
Notes.
aThis study, based on the 31 events observed by ACE/ULEIS. bvon Steiger et al. (2000). cCa/O in the Slow and Fast solar wind were obtained from Wurz et al. (2003). dMason et al. (1997). eDesai et al. (2003). fReames (1995). gMason et al. (2004). hDesai et al. (2006). iLodders (2003). jFeldman & Widing (2003).Download table as: ASCIITypeset image
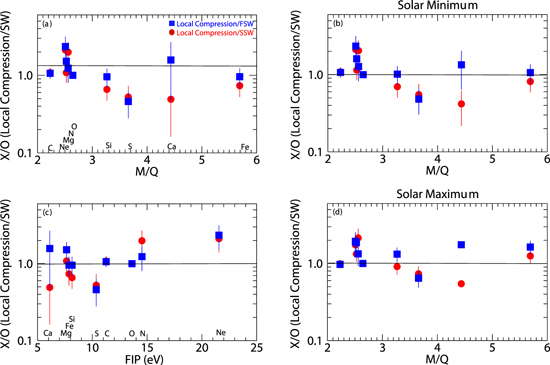
Figure 10(a) shows the ∼0.38 MeV nucleon−1 event-averaged abundances in 31 SIRs normalized to those in the slow and fast solar wind, plotted versus the ion's mass-to-charge ratio (M/Q) (amu e−1). The charge states are from the slow solar wind as reported by von Steiger et al. (2000). These are C5.38+, N5.47+, O6.05+, Ne7.97+, Mg9.5+, Si8.57+, S8.75+, Ca9.02+, and Fe9.84+. Figure 10 shows that the ST heavy ion abundances in these SIRs are similar to corresponding solar wind values. However, overall the SIR ST abundances are not well organized with respect to solar wind values when plotted versus M/Q. For instance, C, N, O, Ne, and Mg have similar M/Q values but N and Ne show enhancements relative to both the fast and slow solar wind. Similarly, S shows a relative depletion compared to the solar wind. Figures 10(b) and (d) show the ST heavy ion abundances in events that occurred during solar minimum and solar maximum conditions, respectively. Solar maximum years are defined to have a monthly average sunspot number of ≥75; only six events occurred during solar maximum. Figure 10(b) shows that the average ST abundance ratios for SIRs during solar minimum are similar to the solar wind values shown in Figure 10(a). The abundances in SIR events that occurred during solar maximum have slightly elevated values compared with the fast and slow solar wind, but still exhibit no clear trend with M/Q. Figure 10(c), compares the event-averaged abundances in 31 SIRs, normalized to the average slow and fast solar wind abundances (von Steiger et al. 2000; Wurz et al. 2003), versus the element's first ionization potential (FIP). In summary, the ST abundances in SIRs are not well organized with respect to solar wind values when plotted versus FIP or the ion's M/Q ratio.
Figure 10. Average ST heavy ion abundances in SIRs relative to those measured in the slow (red circles) and fast solar wind (blue squares), plotted vs. the ion's M/Q ratio for (a) all events, (b) events during solar minimum, and (d) and events during solar maximum as defined by monthly sunspot number (see Filwett et al. 2017). (c) Average heavy ion abundances relative to the slow and fast solar wind plotted vs. the element's first ionization potential (FIP).
Download figure:
Standard image High-resolution image
4. Summary and Discussion
We have examined the spectral properties of H–Fe in 41 SIRs, in the energy range of ∼0.02–3.0 MeV nucleon−1, as observed by both Wind and ACE, between 1995 January and 2008 December. We fit the heavy ion energy spectra and obtain the spectral index and e-folding energy for each species. Our key observations are:
- 1.The spectral index and the e-folding values are on average larger, with mean values of γ = 2.40 versus 2.21 and Eo = 1.18 versus 0.78, when obtained with independent fit parameters compared to a three-parameter fit. Furthermore, the spectral indices obtained using only energies ≤0.3 MeV nucleon−1 (Method II- two parameter fits) have a smaller mean deviation for each event, when compared with those obtained using the entire energy range (Method I three-parameter fits).
- 2.The event-averaged spectral index is 2.44, with a standard deviation (σ = 0.65). Fifteen events have species-averaged mean values outside of 1σ of the mean.
- 3.The low (≤0.09 MeV nucleon−1) versus high 0.09–0.3 MeV nucleon−1 spectral indices are correlated for oxygen (r = 0.66 p = 0.0001) and have similar values for Fe; but the correlation is not as statistically significant (r = 0.35 p = 0.07). There is also no systematic steepening or flattening with increasing energy.
- 4.The majority of events had one or more ion species with spectra that had rollovers with a finite E0 within the energy range considered here; but the abundance ratios within each event remained constant with energy within about a factor of ∼1.3.
- 5.Abundances in SIRs are similar to SW values but are not well organized with respect to both fast and slow solar wind abundances when plotted versus the ion's M/Q or FIP.
- 6.The average spectral index is poorly correlated with the magnetic compression ratio; events with shocks (N = 12) also exhibit no clear relation between species-averaged index and H; 17% of the events have events have a species averaged γ of ∼1.5.
4.1. Spectral Indices and Their Implications for CIR Acceleration Theories
It is well understood that CIR-associated shocks can accelerate particles to MeV energies (Barnes & Simpson 1976; Fisk & Lee 1980) and that diffusive shock acceleration is generally thought to be responsible (Lee & Fisk 1982; Scholer 1999). At lower energies, however (i.e., <500 keV nucleon−1), adiabatic deceleration makes it much more difficult for ions that are accelerated between ∼3 and 5 au to propagate back long distances upstream against the outflowing solar wind into the inner heliosphere (Fisk & Lee 1980). This is expected to create a spectral turnover below ∼500 keV nucleon−1 near 1 au. However, such deficits in the low-energy ion intensities have not been observed by Mason et al. (1997), Ebert et al. (2012b), or this study of SIRs.
Figure 8 shows the relationship between the spectral index and the compression ratio, H. The majority of events fall above the curve predicted by the Fisk & Lee (1980) model, implying that the observed spectra are steeper than those predicted by the model. There seems to be no preference for higher or lower spectral index values with increasing compression ratio. Spectral indices in SIRs do not follow the theoretical relationship, γ = (H+2)/2(H–1), proposed by Fisk & Lee (1980). Desai et al. (1999) examined the forward and reverse shocks of CIRs as measured by Ulysses and, similar to this study, also found that the spectral indices were steeper and departed substantially from the theoretical relationship predicted by the Fisk & Lee (1980) model.
Giacalone et al. (2002) proposed that gradual compressions near 1 au could accelerate particles up to ∼10 MeV without a shock and produce energy spectra similar to recent observations. We compared the species-averaged spectral index (given in Table 2) to the radial thickness of the SIRs in this study, calculated by Broiles et al. (2012), and found a correlation coefficient of r = 0.16 and p = 0.35. If we consider the events with (N = 12) or without (N = 29) shocks the results are still statistically insignificant, with r = 0.24, p = 0.46, and r = 0.15, p = 0.43, respectively. Similarly, Bučík et al. (2009) compared the peak He intensities in simple and compound CIRs, both with and without shocks to the compression region width. Bučík et al. (2009) found a statistically significant result between peak ion intensities and compression region widths for simple CIRs with reverse shocks, but found that the correlations for CIRs without shocks was statistically insignificant, similar to the results discussed here.
More recently, Fisk & Gloeckler (2006) proposed a "pump mechanism" for accelerating low-energy particles through stochastic acceleration in compressional turbulence in the solar wind. The pump mechanism predicts that once the system reaches an isentropic dynamic equilibrium, the ST ion differential energy spectrum should exhibit a universal spectrum with index of 1.5, and a rollover at some undetermined higher energy. We investigate whether this mechanism can be applied to the SIRs studied here. We first note that the spectral indices in the 41 SIRs were generally steeper than 1.5. Figure 6(a) indicates that the spectral indices varied significantly on an event-to-event basis. Only one event had a species-averaged index significantly less than 1.5, and 17% of the events have values ∼1.5 as indicated by the clustering of spectral indices near 1.5 in the histogram in Figure 6(e). Mason et al. (2008) found very similar results, with insignificant clustering near, and only one or two cases below, a spectral index of 1.5. The predictions of the pump mechanism are relevant if the system has come to equilibrium or reached steady-state. Thus, the presence of steeper spectral indices could indicate that either the system has not yet reached equilibrium or that the energy range considered in this study is higher than the purported universal power-law portion of the spectrum. We rule out the latter using Figure 7 because a comparison between the spectral indices at 0.02–0.09 MeV nucleon−1 and 0.09–0.3 MeV nucleon−1 does not show a systematic steepening at higher energies, and our results actually show rollovers in many of these events above ∼0.5 MeV nucleon−1. We note that Fisk & Gloeckler (2006) reported universal power-law spectra between ∼1.5–10 Vsw and our study overlaps with their energy range corresponding to ∼4.4–19 Vsw. Thus, regardless of whether the pump mechanism has reached equilibrium or not, if it is responsible for accelerating the ST heavy ions in the SIRs studied here, then the universal power-law spectral index of 1.5 must occur in a very narrow energy range that corresponds to ∼1.5–4.4 Vsw.
4.2. Abundance Ratios and Transport Effects
Previous work by Mason et al. (2008) examined the abundance ratios of heavy ion species versus energy and found they were constant within a factor of ∼2. In our study, the average abundance ratios remain constant with energy within a factor of ∼1.3, although some species can exhibit a much larger change, such as those in Event 31 shown in Figure 9. The energy spectra in many of the events in this study were observed to rollover between 0.7 and 2.3 MeV nucleon−1 which is consistent with observations of spectral rollovers near ∼1 MeV nucleon−1 (e.g., Mason et al. 1997).
The model discussed by Fisk & Gloeckler (2008) also predicts that the high-energy cutoff, ε0, should be linearly dependent on the ion's M/Q ratio, but they note that if diffusion due to field line random walk is important then the M/Q dependence could be weakened. In contrast, our study shows that the e-folding energy in SIRs did not exhibit a M/Q dependence as the ST heavy ion abundance ratios remain fairly constant with increasing energy, consistent with the results of Mason et al. (2008).
In stark contrast to SEP events (e.g., Mewaldt et al. 2005), the heavy ion spectra in SIRs did not show evidence of species-dependence in the rollover energy. Filwett et al. (2017) studied these same 41 events and found source locations with ∼1 au upstream of the SIRs. Li & Lee (2015) and Zhao et al. (2016, 2017) discussed how interplanetary transport mechanisms may be responsible for the M/Q dependence observed in heavy ion spectra in SEP events. If scatter-dominated interplanetary transport is responsible for the M/Q dependence of rollovers in SEP events, then there should also be a M/Q dependence in the spectral rollover energies in the SIRs studied here. This is because like SEPs, SIR ST ions should also encounter interplanetary turbulence as they propagate from ∼2 to 1 au; the only difference is that SEPs travel from <0.1 to 1 au. However, our results indicate that interplanetary turbulence does not affect the heavy ion spectral features observed in SIRs at 1 au. This indicates that either the interplanetary turbulence and transport associated conditions that affect SEP spectra are remarkably different inside of 1 au or that the SEP spectral breaks occur due to acceleration processes at near-Sun CME shocks, as alternatively proposed by Desai et al. (2016), Schwadron et al. (2015), and Li et al. (2009).
4.3. Average SIR ST Abundances and Source Population
Our survey of the ∼0.02–3.0 MeV nucleon−1 heavy ion spectral properties in SIRs shows that spectral indices vary from event-to-event with no systematic M/Q dependence in the spectral rollover energy. Additionally, the SIR ST abundances at ∼0.38 MeV nucleon−1 are similar to but not well organized when compared to the fast and slow solar wind abundance ratios when plotted versus the ion's M/Q or FIP. We note that using the average abundances has limitations; for instance, Table 1 shows that the Fe/O ratio varies significantly from event to event. Similarly, Filwett et al. (2017) showed that the Fe/CNO ratio varied from event-to-event and with solar activity cycle, with higher Fe/CNO SEP-like ratios during solar maximum and lower Fe/CNO solar-wind-like during solar minimum. This led to the conclusion that, similar to the quiet-time ST heavy ion population, SIRs also draw their source material from a suprathermal pool of material originating in prior solar and interplanetary activity (e.g., Dayeh et al. 2017).
Finally, if the SIR ST ions originate primarily from the bulk solar wind, then this should also be reflected in the heavy ion abundance ratios when compared to solar wind values. However, Figure 10 shows that although the abundances are very similar, the SIR abundances are not well-organized with respect to the fast and slow solar wind values when plotted verses either M/Q or FIP. Specifically, ions with similar M/Q ratios show no obvious trends in their depletion or enhancement with respect to solar wind values. Separating the SIRs into those observed during solar minimum or solar maximum also does not organize the ST abundances with respect to the fast or slow solar wind abundances as a function of M/Q. Similarly, there is no correlation between the SIR abundance ratios when compared to the solar wind values as a function of FIP. Filwett et al. (2017) also found no correlations between the Fe/CNO ratio with the upstream solar wind Fe/O ratio. This indicates that if SIR ST ions originate from the solar wind, then some portion of the heated solar wind must undergo processing via as yet poorly understood mechanisms prior to being injected into the SIRs for acceleration up to the ST energies studied here.
We are thankful to many people who have worked on the both the Wind/EPACT and ACE/ULEIS teams at University of Maryland, Johns Hopkins Applied Physics Laboratory (JHU/APL), and at Goddard Space Flight Center. The work at Southwest Research Institute and University of Texas at San Antonio is partially supported by NSF SHINE grant AGS-1460118 and NASA grants NNX17AI17G and NNX14AP396G.