


Abstract
We present a full data analysis of the pure-parallel Hubble Space Telescope (HST) imaging observations in the Brightest of Reionizing Galaxies Survey (BoRG[z9]) in Cycle 22. The medium-deep exposures with five HST/WFC3IR+UVIS filter bands from 79 independent sightlines (∼370 arcmin2) provide the least biased determination of number density for z ≳ 9 bright galaxies against cosmic variance. After a strict two-step selection for candidate galaxies, including dropout color and photometric redshift analyses, and revision of previous BoRG candidates, we identify one source at z ∼ 10 and two sources at z ∼ 9. The z ∼ 10 candidate shows evidence of line-of-sight lens magnification (μ ∼ 1.5), yet it appears surprisingly luminous ( mag), making it one of the brightest candidates at
  known (∼0.3 mag brighter than the z = 8.68 galaxy EGSY8p7, spectroscopically confirmed by Zitrin and collaborators). For z ∼ 9 candidates, we include previous data points at fainter magnitudes and find that the data are well fitted by a Schechter luminosity function with
  ,
,  mag, and
  Mpc−3 mag−1, for the first time without fixing any parameters. The inferred cosmic star formation rate density is consistent with unaccelerated evolution from lower redshift.
Export citation and abstract BibTeX RIS
1. Introduction
Cosmic reionization is one of the frontiers of modern astronomy (Planck Collaboration et al. 2014; see also Robertson et al. 2010). Of particular interest is which class of astrophysical objects is primarily responsible for this phenomenon, which is likely to happen at z ∼ 6–9 (e.g., Fan et al. 2000; Totani et al. 2006; Shull et al. 2012; Treu et al. 2013; Konno et al. 2014; Schmidt et al. 2014; Mason et al. 2018b, 2018a). Determining luminosity functions (LFs) at such an early epoch is therefore a fundamental step in estimating the net contribution from luminous sources, including active galactic nuclei (AGNs) (Fan et al. 2006; Trenti et al. 2012b; Treu et al. 2012; Madau & Dickinson 2014; Bouwens et al. 2015a).
After a decade of effort, it seems likely that galaxies at the faint end of the LF (are the key driver in the reionization epoch (Ellis et al. 2013; McLure et al. 2013; Oesch et al. 2013, 2018; Ono et al. 2013; Schenker et al. 2013; Atek et al. 2015; Ishigaki et al. 2015, 2018; Livermore et al. 2017), though with a non-negligible impact from uncertainties, in particular from lens modeling (e.g., Atek et al. 2018).
On the other hand, quantifying the number density and properties of the brightest galaxies in the early universe still remains an open yet important field, because these objects constrain the overall shape of the LF (Bouwens et al. 2015b; Ono et al. 2018). Furthermore, these massive objects encode information on in situ star formation at even earlier times and probe their building blocks (e.g., Stiavelli 2009), which are the key to understanding the objects at  (e.g., Ouchi et al. 2010; Sobral et al. 2015).
The shape of LFs in the high-z/high-luminosity regime is yet poorly sampled and its whole shape is undetermined, partly suffering from low-z interlopers (e.g., Livermore et al. 2018, J. S. Bridge 2018, in preparation). In particular, current observations with the Hubble Space Telescope (HST) do not resolve the debate on whether the LF should remain Schechter-like, as it is at lower redshift (e.g., Trenti et al. 2010; Jaacks et al. 2012; Finkelstein et al. 2015; Mason et al. 2015b), or become a (double) power law with enhancement at the bright end, due to the differential impact of dust attenuation (e.g., Clay et al. 2015; Finkelstein et al. 2015), AGN feedback (Finlator et al. 2011), and/or mass quenching (Birnboim & Dekel 2003; Peng et al. 2010; Woo et al. 2013).
Legacy field investigations with HST have covered a substantial area (≳800 arcmin2 down to ∼27 mag; Grogin et al. 2011; Koekemoer et al. 2011), and the latest samples are approaching ∼1000 sources (e.g., Bouwens et al. 2015b). However, at the bright end one concern in addition to the paucity of candidates is the strong clustering of these sources, with bias factor  (Barone-Nugent et al. 2014). This in turn implies that contiguous fields can be significantly affected by cosmic variance (Trenti & Stiavelli 2008).
The Brightest of the Reionizing Galaxies (BoRG) HST survey (Bradley et al. 2012; Trenti et al. 2012a) has been designed specifically to contribute towards an unbiased measurement of the number density of the brightest and most clustered sources at  , by taking advantage of pure-parallel (random pointing) opportunities to cover a wide area with medium-deep optical and IR imaging (5σ limiting magnitude
  ), over more than 100 independent sightlines so far.
The initial BoRG survey aimed at the bright end of the LF at  , using four filters on WFC3 (Trenti et al. 2011, 2012a; Bradley et al. 2012; Bernard et al. 2016). Schmidt et al. (2014) explored 350 arcmin2 and found 38 Y-band dropout candidates with
  , providing one of the strongest constraints on the shape of the
  LF. A continuation of the survey, BoRG[z9] (GO13767, PI. M. Trenti), which we present in this study, is optimized for galaxies at higher redshift (
 ) with an updated set of five WFC3IR/UVIS filters. Preliminary results from this survey were presented in Calvi et al. (2016, hereafter C16) by using
  of the full data, demonstrating the strength of the new strategy.
In this paper, we present the full data set of BoRG[z9]—a collection of 79 independent sightlines (∼370 arcmin2) down to ∼27 mag—which is the least biased survey in the early universe in terms of cosmic variance.11 We base our analysis on the well-studied color selection method presented in C16. We then further constrain the color-selected candidates with additional criteria, which include photometric redshift priors based on a theoretical model as well as follow-up Spitzer photometry. Our new selection also updates the candidates found in C16, providing a final set of one candidate at z ∼ 10 and two at z ∼ 9 from all BoRG[z9] fields. Finally, taking into account simulations of source recovery and completeness, and with the inclusion of data for faint galaxies from the literature, we determine the LF at z ∼ 9 for the first time without fixing any parameters.
Throughout the paper, magnitudes are quoted in the AB system (Oke & Gunn 1983). We assume  ,
,  ,
,  . We refer to the WFC3 filters F350LP, F105W, F125W, F140W, and F160W as
  (optical),
  ,
,  ,
,  , and
, and  , respectively.
2. Data and Sample Selection
In the present study, we use the full data set of BoRG[z9], which consists of 79 independent fields of view (FoVs) (∼370 arcmin2). These data have been made publicly available as Version 3 of the BoRG survey as fully calibrated and aligned science images.12 This analysis includes the data previously studied in C16, which consist of 28 initial FoVs (∼130 arcmin2). Inclusion of the previous data set allows us to check the consistency and to see whether updates made in the present analysis affect the final results.13
2.1. Survey Design
BoRG[z9] is a pure-parallel HST imaging survey with five broadband filters spanning from the near-UV/optical band of WFC3/UVIS ( ) to near-IR (
 /
/ /
/ /
/ ) of WFC3/IR. Its medium-deep exposures (∼2–5 ks) in random sightlines optimize for detecting bright galaxies, and reach typical limiting magnitudes of
  mag measured in an aperture of 0
 32 radius (see Appendix A).
The major update in BoRG[z9] from our previous studies (HST Cycles 17 and 19; Trenti et al. 2011, 2012a; Bradley et al. 2012; Schmidt et al. 2014) is the use of a long-pass filter in the optical wavelength range.  covers ∼0.3 μm to 1.0 μm, while many other studies use a single or multiple broadband filters in the optical range. The choice optimizes rejection of contaminants for the selection of
  sources.
For our primary science goal, the collection of  and
and  dropout sources, persistence is of particular concern because of the possibility of introducing an artificial coherent signal into the near-IR bands. In each visit of this program, we therefore arranged the sequence of WFC3/IR filters to minimize the impact. As detector persistence decays over time, with approximate power-law behavior, any saturated target observed in a previous visit most affects the initial part of the pure-parallel orbit. The general strategy therefore is to observe in the dropout filter as early as possible in the orbit, ideally placing the
  band first. However, doing so would result in increased time-varying backgrounds from scattered-light Earth glow from helium in the upper atmosphere (caused by a He 10830 Å line; Brammer et al. 2014). Because the intensity of the scattered Earth glow decreases with increasing target angles above the bright Earth limb, we opted to place the
  observations as the second filter after
  (or sometimes third when the orbit begins with
  ) in an orbit. Whenever possible, observations in
  and
and  follow those filters. With this strategy, persistence features are essentially prevented from contaminating the
  and
and  dropout selections.
To ensure good sampling of the IR exposures, we opted for reading every 50 s (SPARS50). While the majority of cosmic rays are rejected by the calibration pipeline, owing to the multiple non-destructive readouts of the WFC3IR detector, a small fraction may survive in the calibrated image. We thus split the total integration in each IR filter into at least two individual exposures.  exposures obtained with the UVIS CCD are split into more than two sequences (each 450–900 s) for optimal cosmic-ray rejection. Our design choices are aimed at maximizing the data quality, though a small price is paid in signal-to-noise ratio (S/N) by increasing the number of individual exposures.
2.2. Data Reduction
We reduced the raw imaging data by using the HST pipeline in the standard manner. In addition to running calwf3, processing of  included a correction for the charge-transfer efficiency effect (CTE19; Noeske et al. 2012; Anderson 2014). For all filters, we also performed a customized extra step to remove residual cosmic rays and/or detector artifacts, such as unflagged hot pixels, by using a Laplacian edge filtering algorithm (LACOSMIC; van Dokkum et al. 2001) that was used for the previous BoRG data reduction (Bradley et al. 2012; Schmidt et al. 2014, see also C16).
The pixel scale is set to 0.08 arcsec/pixel with pixfrac to 0.75, as in C16. Since most of our images are taken without dithering, we use a slightly larger pixel scale than typical non-parallel observations (∼0.06 arcsec/pixel). The only change from C16 is made in one of the parameters of cosmic-ray detection, where we set cr_threshold to 3σ and 1.5σ (compare 3.9σ and 5σ in C16) for UVIS and IR detectors, respectively, in the LACOSMIC Python package.14 This significantly reduces the residual cosmic rays compared to the previous data products.
This reduction process generates science and rms maps for the five filter bands, in addition to a combined  +
+  map for the use of detection images (see below). It is noted that the rms maps generated by the pipeline have arbitrary infinity values for, e.g., dead pixels and/or those with a cosmic-ray flag. Such an artificial value in fact affected the previous sample selection in C16 (see Section 3.1.1). We replace those values with 0, so that a detection algorithm (i.e., SExtractor; Bertin & Arnouts 1996) ignores them; otherwise it would falsely return infinity values for fluxes in such regions.
The rms map of each filter band generated by the pipeline is then scaled so that it represents the true uncertainty, including correlated noise (Casertano et al. 2000). To account for this, we follow the scaling method presented by Trenti et al. (2011). Briefly, we measure the median sky in the empty region in each mosaic image by using SExtractor (Bertin & Arnouts 1996) with the same setup parameters as the source detection. Each rms map is then scaled so that the dispersion in flux of the sky region (faper, in an aperture of  ) and its estimated error (eaper) are consistent. The median values of the scale factor are 1.174, 1.195, 1.209, 1.233, and 1.708 for
  ,
,  ,
,  ,
,  , and
, and  , respectively, which are consistent with C16. This process also returns limiting magnitudes (i.e., median of faper in each field), which are used for upper limits of non-detection.
Ten out of the 89 original survey fields are discarded from our final analysis, because they failed in the acquisition of a guide star or are dominated by a number of bright stars. The list of fields is summarized in Appendix A.
The point-spread functions (PSFs) of different filter images are not matched in this study, because it is challenging to accurately measure the PSF in each of our data with relatively shallow exposures. However, as the apparent size of our target galaxies is typically small, in addition to the use of optimized photometry (i.e., isophotal flux; see Section 2.3), the effect is minimal (see also Oesch et al. 2007; Trenti et al. 2012a; Holwerda et al. 2014).
2.3. Detection and Color Selection of Dropout Galaxies
We first detect galaxies using SExtractor in the  +
+  stacked image. The detection parameters are set as in C16—DETECT_MINAREA = 9, NTHRESH = 0.7σ, DEBLEND_NTHRESH = 32, DEBLEND_MINCONT = 0.01. The exception is the convolution size (FWHM of Gaussian) for detection in SExtractor, which is changed from 2 pixels to 5 pixels. This reduces false detection of, e.g., discrete noise at the edge of the detector and residual cosmic rays. The photometry is performed in the dual-imaging mode, based on the
  +
+  detection. With this setup, we detect 73,374 objects from all BoRG fields in this study.
We then select those with  for robust detection, and with CLASS_STAR < 0.95 to avoid stars. Signal-to-noise ratios are calculated from the measurement and error of the isophotal flux of SExtractor. Compared to other schemes of photometry, the choice flexibly corresponds to source morphology. For example, fixed-aperture photometry tends to underestimate S/N in
  , which would mistakenly select low-z galaxies as the dropout candidates.
To minimize contamination by low-z interlopers, we also limit half-light radius along the major axis of SExtractor to 03 (or ∼1.7 kpc at  ), the observed upper limit for
  galaxies at the present magnitude limit (e.g., Oesch et al. 2010; Holwerda et al. 2015; Shibuya et al. 2015; Kawamata et al. 2018).
We then follow the color-cut criteria proposed by C16 for the selection of z ∼ 10 and z ∼ 9 candidates, whose 95% confidence regions correspond to  (with a peak at
  ) and
) and  , respectively;
- 1.z ∼ 10 candidates (
 dropouts):
 - 2.z ∼ 9 candidates ( dropouts):


Colors are calculated after correcting for Galactic dust extinction, where E(B − V) is retrieved from the NASA/IPAC infrared archive (Schlegel et al. 1998; Schlafly & Finkbeiner 2011).15 We assume the canonical Milky Way dust law (Cardelli et al. 1989) to calculate the extinction in each filter.
The observed flux is scaled by  for the following analysis, where
  and
and  are the AUTO (i.e., total) flux and isophotal flux of SExtractor measured in
  , so as to correct the flux missed in the isophotal flux. The scale factor of individual objects is applied to the other four bands to uniformly scale the fluxes.
The selected sources are shown in Figure 1. There are 15 and 19 sources selected with the color criteria for z ∼ 10 and z ∼ 9 candidates, respectively, up to  mag. The color near the Lyman break (
 and
and  ) is calculated with the 1σ limiting magnitude of each image when the magnitude at the shorter wavelength has
  , and shown as a lower limit in Figure 1.

Figure 1. Color–magnitude diagram for the 79 BoRG[z9] fields. Out of 73,374 detected sources (gray points), 15 and 19 objects are selected as initial z ∼ 10 (left) and z ∼ 9 (right) candidates, respectively (orange circles for those with measured color and triangles for those with a lower limit). The criterion for the Lyman-break color cut is shown with a dashed line. We apply visual inspection (Section 2.4), photometric redshift selection (Section 2.5), and Spitzer photometric selection (Section 2.6) to the initial candidates in order to select the final candidates (large red symbols).
Download figure:
Standard image High-resolution imageWhile our color selection mostly excludes sources with optical detection, we found in the visual inspection (Section 2.4) that some candidates show tiny blobs in  , despite satisfying
  in the isophotal magnitude. Given its bright/extended appearance in longer wavelength filters, we consider this as sub-galactic scale/patchy star formation from dusty galaxies at lower redshifts (see Section 2.5). We therefore exclude those with
  in addition to the criteria above, where
  is a signal-to-noise ratio measured in a small aperture (radius of 2 pixels, or 016). The aperture photometry maximizes S/N inside objects for this case, while isophotal flux is typically measured in a larger aperture from detection images (
 +
+  band in this study) and could lower
  at shorter wavelength. This excludes one of the z ∼ 9 candidates selected with the default criteria, while there are no such objects in z ∼ 10 candidates. The remaining candidates are taken through the following selection process.
2.4. Visual Inspection
Four of the authors (T.M., M.T., M.S., and R.C.L.) visually checked the color-selected candidates, because we are not able to exclude artificial objects, such as PSF spikes and residual cosmic rays with only the color criteria. We exclude five objects selected as z ∼ 10 candidates and five selected as z ∼ 9 candidates. Those are stellar spikes, cosmic rays, or inappropriately deblended fragmentation of large galaxies.
We also check the persistence among candidates by inspecting the individual fields.16 We conclude that none of the remaining candidates is affected by persistence.
2.5. Photometric Redshift Selection
2.5.1. A Flat Prior
While the color selection is known as a standard method to efficiently select high-z candidates with minimum filter requirements, the result is binary (i.e., yes or no). In other words, the color selection by itself does not tell us how reliable those selected candidates are. To quantify the candidate selection, we use photometric redshifts as additional information. While their accuracy strongly depends on the number of filters and their depth, photometric redshifts allow us to investigate the consistency of the color selection, quantify the robustness, and eliminate unlikely candidates, if any.
We use EAzY (Brammer et al. 2008, version of 2015 April 20) to derive photometric redshifts for our candidates selected in Section 2.3. The default template set (v1.3) is used with a minor but key modification that imposes the template age to be lower than the age of the universe at the redshift derived. The choice of the template set is based on the test by Brinchmann et al. (2017), where they tested all template sets in EAzY and found that the least biased template for high-redshift galaxies is the v1.3 template. This template is based on the original EAzY template that was developed from synthetic galaxy photometry using semi-analytical models, but also includes several additional spectral energy distributions (SEDs) (Bruzual & Charlot 2003; Maraston 2005; Erb et al. 2010) and emission lines (Ilbert et al. 2009). We also add young star-forming galaxy templates with dust attenuation up to AV = 4.5 mag, because those at  resemble SEDs of high-z galaxies (Salmon et al. 2018).
While there are several choices of priors for low-z galaxies (e.g., as a function of apparent magnitude/color), we start with a flat prior (but see also below). We adopt the redshift at the peak probability distribution as the best-fit redshift (za).
With this setup, we found an excellent agreement for all z ∼ 10 candidates with the target redshift of the color selection, while this decreases to ∼60% for z ∼ 9 candidates. Those with inconsistent photometric redshifts show widely extended probability distributions. This is partly because the color near the Lyman break is not as strong for those galaxies as for other candidates with consistent redshifts. The color of the Lyman break for the strongest candidates is ≳2 mag, while ∼50% of the rejected sources have a bluer color. That is, they are located near the boundary of the selection box and could have been scattered into the box due to photometric noise. We here exclude four z ∼ 9 candidates that have a low-z peak probability of >20% of the high-z peak probability.
2.5.2. Building a Practical Prior
A flat prior is often assumed for Lyman break galaxies at high z, since it is still unclear whether applying priors from low redshift is appropriate (Benítez 2000; Salmon et al. 2017; Salvato et al. 2018). On the other hand, we know that the LF of galaxies evolves strongly from z ∼ 10 to 0 (e.g., Behroozi et al. 2013; Bouwens et al. 2015b; Mason et al. 2015a; Kelson et al. 2016; Oesch et al. 2018). Combining the intrinsic evolution with changes in the distance modulus with redshift, we should, at a given luminosity, expect many more galaxies at lower redshift in a given survey area (Stiavelli 2009; Vulcani et al. 2017). This effect has not been taken into account yet in this study.
Motivated by this fact, we design an empirical prior based on a combination of deep observations and theoretical modeling, which aims at quantifying the relative abundance of high-z sources versus low-z interlopers for color-selected samples using the dropout technique. To construct such a prior, we start from a mock galaxy catalog by Williams et al. (2018). While the catalog (v1.0) has been primarily aimed at planning observations with the James Webb Space Telescope (JWST), based on real deep surveys with multiband imaging including most HST broadband filters, it reproduces observed galaxy properties self-consistently, such as LF evolution up to  . Therefore, it is well suited for our purposes.
The model flux in the catalog for each galaxy is perturbed to simulate observed fluxes. We assume Gaussian noise based on our limiting magnitudes. In addition to this random noise added to the model flux, we fluctuate the intrinsic flux by 0.3 dex at each redshift bin (whose width is δz = 0.1), to partially take into account the effect of cosmic variance (Somerville et al. 2004; Trenti & Stiavelli 2008), which is not reflected in the original catalog based on relatively small-volume observations. While this is a simplified approach, shifting magnitude artificially adds ∼0.4 dex variation in galaxy number densities at  . We repeat this 10,000 times (i.e., 10,000 mock catalogs with different cosmic fluctuations, where each object has Gaussian random noise added to its flux), then select dropout candidates with our color criteria from all catalogs. The only difference is the use of F435/606/814W bands in the mock catalog, because
  flux is not listed in the original catalog. We estimate the weighted mean flux from the three optical bands as

where the weight is the convolution of transmission in each filter with  ,
,

From the mock catalog, we estimate the fraction of low-z interlopers that are selected with our color selection, as a function of magnitude and redshift. We define low-redshift interlopers as those with intrinsic redshift at  but which satisfy the color–color selection criteria in Section 2.3.
Figure 2 shows examples—the intrinsic redshift distributions of the dropout candidates at a given observed  magnitude. The fraction of interlopers ranges from ∼70% (∼40%) to ≳85% (∼90%) for z ∼ 10 (z ∼ 9) candidates from
  ∼ 24.8 mag to 26.5 mag, which is consistent with the analysis of Vulcani et al. (2017).

Figure 2. Examples of intrinsic redshift distributions of dropout candidates selected in the mock catalog at different magnitude bins. Each histogram is fitted with a double-peaked Gaussian (red solid lines) and used as a photometric redshift prior (Section 2.5.3). The best-fit parameters for Gaussian fitting are summarized in Table 1. The bottom panel shows the fraction of star-forming (blue solid lines) and quiescent galaxies (red dashed lines) selected as dropout candidates ( mag). The total number of mock galaxies is shown as a cumulative fraction (gray solid lines). While low-z interlopers of z ∼ 10 candidates consist of both populations, those of z ∼ 9 candidates are mostly star-forming galaxies.
Download figure:
Standard image High-resolution imageThe interloper population is dominated by z ∼ 2–3 galaxies. The fraction of star-forming/quiescent populations in the low-z interlopers is shown in the bottom panel of Figure 2. While the low-z interlopers of z ∼ 10 candidates consist of both populations, i.e., the star-forming population at  and quiescent population at
  , those of z ∼ 9 candidates are dominated by the star-forming population at
  . For
. For  dropout candidates, the fraction of low-z interlopers increases as it approaches the magnitude
  ∼ 26.5, because large photometric flux errors start to affect the sample selection. On the other hand, for
  dropout candidates it shows a rather flat distribution over the magnitude range. This is partly due to different selection effects for the color selection criteria—while
  dropout candidates are mainly affected by photometric error,
  dropout candidates are contaminated mainly by systematic effects due to, e.g., a smaller number of filters to characterize the Lyman break.
2.5.3. Application of the Redshift Prior
In general, a redshift posterior is calculated as

where  is a likelihood (derived by EAzY) given the data C.
  is a prior as a function of m (e.g., magnitude; Benítez 2000). In the present study, since we first select galaxies with color criteria, an additional term is implicitly implemented in Equation (3):
With this, redshift distributions derived in the previous section (Figure 2) can be used as priors,  , in the calculation of posterior for our preselected candidates.
To build a functional form for priors, we fit the redshift distribution with a dual-peak Gaussian model,  , where
  is the parameter set for the Gaussian fit,
 ![${G}_{i}(z| {I}_{i})={A}_{z,i}\,\exp [-{(z-{\mu }_{z,i})}^{2}/2{\sigma }_{z,i}^{2}]$](https://content.cld.iop.org/journals/0004-637X/867/2/150/revision1/apjaae68cieqn102.gif) . The best-fit parameters (
. The best-fit parameters ( minimization) are summarized in Table 1. Due to the small number of galaxies, Gaussian fits for z ∼ 10 candidates in the
  and ≳26.3 mag bins are not available. We instead extrapolate without changing the parameter values from the 25 mag and 26.25 mag bins to those magnitude bins, respectively.
Table 1. Gaussian Parameters for Redshift Priors
| m160 |

|

|

|

|

|

|
 a
a
|
|---|---|---|---|---|---|---|---|
 dropouts dropouts |
|||||||
| 25.00 | 0.87 | 3.29 | 0.57 | 0.13 | 10.43 | 0.58 | 0.83 |
| 25.25 | 0.66 | 3.13 | 0.60 | 0.34 | 10.53 | 0.12 | 0.86 |
| 25.50 | 0.57 | 3.13 | 0.62 | 0.43 | 10.51 | 0.12 | 0.82 |
| 25.75 | 0.74 | 2.90 | 0.56 | 0.26 | 10.24 | 0.52 | 0.76 |
| 26.00 | 0.77 | 2.51 | 0.61 | 0.23 | 10.11 | 0.62 | 0.77 |
| 26.25 | 0.89 | 2.23 | 0.43 | 0.11 | 9.97 | 0.69 | 0.86 |
 dropouts dropouts |
|||||||
| 24.50 | 0.43 | 2.12 | 0.08 | 0.57 | 8.76 | 0.14 | 0.30 |
| 24.75 | 0.56 | 2.09 | 0.10 | 0.44 | 8.72 | 0.16 | 0.37 |
| 25.00 | 0.57 | 2.07 | 0.10 | 0.43 | 8.72 | 0.17 | 0.38 |
| 25.25 | 0.61 | 2.06 | 0.09 | 0.39 | 8.75 | 0.26 | 0.36 |
| 25.50 | 0.70 | 2.16 | 0.06 | 0.30 | 8.76 | 0.34 | 0.34 |
| 25.75 | 0.55 | 2.08 | 0.12 | 0.45 | 8.74 | 0.46 | 0.35 |
| 26.00 | 0.60 | 2.08 | 0.16 | 0.40 | 8.70 | 0.51 | 0.44 |
| 26.25 | 0.75 | 2.08 | 0.20 | 0.25 | 8.61 | 0.57 | 0.65 |
| 26.50 | 0.86 | 2.07 | 0.28 | 0.14 | 8.47 | 0.66 | 0.84 |
| 26.75 | 0.88 | 1.99 | 0.59 | 0.12 | 8.31 | 0.78 | 0.92 |
Notes. For  dropout candidates with
  and
and  mag, reliable Gaussian fitting parameters are not available from the small sample size. We instead adopt those from
  and 26.25 mag for candidates, respectively.
Download table as: ASCIITypeset image
Given the smaller error in  magnitudes (<0.2 mag) compared to the magnitude bin of the prior, we simply multiply the fitted Gaussian function by each redshift probability distribution derived with a flat prior in the earlier part of this section. We use the redshift at the peak of the posterior distribution as the final redshift (zprior). We exclude those candidates with a low-z peak probability of >20% of the high-z peak probability, based on the typical contamination fraction at z ∼ 10 (Pirzkal et al. 2013). Thus, the photo-z selection assures 80% reliability, or equivalently a contamination fraction
  (Section 4.2). We reject nine and five of the remaining z ∼ 10 and z ∼ 9 candidates, respectively.
While the mock catalog of Williams et al. (2018) reproduces the observed LFs at  sufficiently well, we note that galaxies at
  , especially at the bright end, are yet uncertain, and an a priori assumption, such as the Schechter-form LF, may no longer be appropriate. It is also possible that samples might be somewhat affected by currently unaccounted for contamination by a class of rare intermediate-redshift galaxies with observed colors similar to those of
  sources. Yet, all our final candidates have a low likelihood of being interlopers (less than 20%), regardless of the application of the prior, strengthening confidence in their high-z nature. In fact, the application of the prior suppresses high-redshift probabilities for most of our cases (Table 1), and thus it offers a more conservative candidate selection. Of course, further follow-up of our candidates with deeper imaging, or spectroscopy, would represent an independent assessment of the selection.
2.6. Spitzer/IRAC Photometry
For further validation of our candidates, we check the availability of public Spitzer data17
acquired from multiple Spitzer/IRAC 3.6 μm observations of BoRG fields (PIs S. Bernard, R. Bouwens, B. Holwerda;  mag). While the data set does not offer complete coverage of the entire BoRG[z9] survey, IRAC photometry is capable of efficiently excluding low-z interlopers in the case of significant excess of flux compared to the
  band such as, e.g., quiescent+dusty SEDs at
  (Holwerda et al. 2015; Oesch et al. 2016; Salmon et al. 2018).
The z ∼ 10 candidate has an IRAC 3.6 μm coverage. This candidate is located near a bright galaxy, where the photometry in the IRAC band is challenging with aperture photometry (Figure 3). To extract the flux from the candidate, we use TPHOT (Merlin et al. 2016), which models the IRAC flux based on the light profile obtained from the high-resolution HST images. We use the  +
+  image as the reference model and a convolution kernel that is constructed from the PSFs in the
  and IRAC 3.6 μm bands. This approach yields an extracted model magnitude of
  for the candidate. By including this IRAC flux in the photometric redshift code, the low-z probability peak is ∼16% of the high-z peak, and thus we retain the galaxy as the final, and only, z ∼ 10 candidate in this study (Figure 3).

Figure 3. Final z ∼ 10 candidate ( dropout) that passes the color-cut criteria, visual inspection, and photometric redshift selection. Top: 30 × 30 pixel (∼2.4 arcsec) postage stamps in five HST filters and IRAC ch1. The total magnitude and isophotal S/N are shown in each panel. 1σ limiting magnitudes are shown for those without detection (S/N < 1). Bottom left: spectral energy distribution. Detection (S/N > 1; green squares) and 1.5σ upper limit (arrows) are shown. The best-fit templates of
  minimization at high and low redshifts (blue and red solid lines, respectively) are shown, with expected fluxes in each observed band (open squares). Bottom right: photometric redshift probability distributions (gray dashed line for likelihood; solid line for posterior). Total probabilities at
  and z < 7 are also shown.
Download figure:
Standard image High-resolution imageOne of the z ∼ 9 candidates, 0956+2848–98, has IRAC 3.6 μm coverage, but shows no detection ( ), and a 1σ lower limit is available from the rms map (>25.5 mag; Figure 4). The photometric redshift of the source including the IRAC upper limit remains unchanged, and thus we retain this in the sample of final z ∼ 9 candidates.

Figure 4. Same as Figure 3 but for final z ∼ 9 candidates ( dropouts).
Download figure:
Standard image High-resolution image2.7. Additional F098M Photometry
One of our z ∼ 9 candidates is by chance overlapping with previous archived observations, both from the Hubble Infrared Pure Parallel Imaging Extragalactic Survey (HIPPIES) pure-parallel program (GO 11702; PI: Yan; ∼10 orbits) and from a previous BoRG campaign (∼1 orbit). Combining all data, and in particular thanks to the very deep GO 11702 exposure, the object shows a significant detection in the deep F098M image,  . The most likely photometric redshift for this object becomes
  , and thus we exclude it from the final candidate sample. Two other z ∼ 9 candidates, which were reported in C16, have also been recently followed up with the same filter (1 orbit; Livermore et al. 2018). The follow-up data revised the redshift to
  for one of the two galaxies (while confirming the high-z nature of the other), and thus this source is not included in our final sample.
This suggests that, even after the stringent selection of this study, low-z interlopers could be selected as final high-z candidates. While our final candidates show low probability peaks at low z (≲16%), additional imaging around the putative Lyman break would sample the SED more accurately and further improve the quality of the high-z photometric candidates in the absence of spectroscopic confirmation. Deep Spitzer data would constrain the rest-frame optical wavelength range, but only if sources are well isolated (see the case for 2140+0241–303). Space-based deep medium-/narrowband observations, as in the BoRG Cycle 25 program (Livermore et al. 2018), are ideal before the advent of next-generation facilities such as JWST (see also Appendix C).
2.8. Absolute Magnitude
The UV absolute magnitude at rest-frame 1450 Å, MUV, is then calculated based on the photometric redshift (i.e., the k-correction) and scaled  magnitude (Section 2.3). We assume a log-normal SED with a UV slope β = −2.0 (
 ), appropriate for the high-z population (e.g., Fan et al. 2003; Bouwens et al. 2014). We checked that our choice of β from observed values (∼−1.5 to −2.0 for
  to −20; Bouwens et al. 2014) does not change our final result.
2.9. Magnification Bias
Among the sample, three candidates have neighboring foreground objects in each FoV. The observed light from those high-z candidates is thus possibly affected by the gravitational potential of the foreground objects.
We calculate the magnification by foreground objects in the same manner as Mason et al. (2015b). Briefly, the photometric redshift of low-z objects is derived with EAzY. The probability distributions for both foreground and high-z candidates, and their separation, are then used to estimate the magnification. Single isothermal spheres are assumed for the mass profile of foreground deflectors. The Einstein radius of deflectors is estimated from photometry using a redshift-dependent relation of Faber & Jackson (1976). The resulting magnifications are  (2140+0241−303),
  (0751+2917−499), and
  (2229−0945−394). The error in magnification is also integrated into the calculation of absolute magnitude.
3. Final Candidates
Through the selection processes described in Sections 2.3–2.6, we have collected one z ∼ 10 and two z ∼ 9 candidates (Figures 3 and 4). These candidates show extended morphology in  (>016; compare
  for WFC3IR). In addition, their red colors in
  −
− assure that these are unlikely to be Galactic dwarf stars (Oesch et al. 2013). The photometric properties and redshifts of the final candidates are summarized in Table 2, while those initially selected with the color selection but later rejected are presented in Appendix B. Here we look at the final candidates in detail before proceeding to estimation of the number density.
Table 2. Coordinates and Photometric Properties of Final z ∼ 10 and z ∼ 9 Candidates
| Object ID | α(J2000) | δ(J2000) |

|
Colors | S/N |

|
MUVa | r50a | |||||||
|---|---|---|---|---|---|---|---|---|---|---|---|---|---|---|---|
| (deg) | (deg) | (mag) | C1 | C2 |

|

|

|

|

|

|
flat | prior | (mag) | (arcsec) | |
| z ∼ 10 candidates | |||||||||||||||
| 2140+0241–303 | 324.885438 | 2.685170 | 24.4 | 1.7 ± 0.3 | 0.5 ± 0.1 | 0.3 | 0.5 | 0.9 | 3.1 | 10.2 | 15.8 | 10.0 | 10.0 |

|
0.18 |
| z ∼ 9 candidates | |||||||||||||||
| 0956+2848–98 | 149.122734 | 28.792008 | 26.6 | 1.7 ± 0.8 | −0.2 ± 0.2 | −0.2 | −0.2 | 1.4 | 5.7 | 7.6 | 5.8 | 8.8 | 8.8 |

|
0.17 |
| 2229–0945–394 | 337.190253 | −9.749134 | 25.0 | >2.6 | 0.2 ± 0.2 | 0.7 | 0.1 | 0.4 | 7.4 | 8.7 | 9.3 | 9.0 | 9.0 |

|
0.16 |
Notes. C1:  –
–  and
and  –
–  colors for z ∼ 10 and z ∼ 9 candidates, respectively. C2:
  –
–  color for z ∼ 10 and z ∼ 9 candidates.
  : signal-to-noise ratio in aperture photometry (radius of 016) of
  band. Columns 8–12: isophotal signal-to-noise ratio of each band. Column 13: photometric redshift derived with a flat prior. Peak redshift is presented. Column 14: photometric redshift derived with the modeled prior. Peak redshift is presented. Column 15: UV absolute magnitude at
  assuming
  . Column 16: SExtractor half-light radius measured in
  .
.
Download table as: ASCIITypeset image
3.1. Comparison to Calvi et al. (2016)
Part of our data (36 fields; ∼40%) has been studied in C16. While the initial color selections are identical in both studies, the application of our selection processes, in addition to the update in drizzle pipeline parameters and SExtractor parameters, may affect the final sample. In what follows, we compare our candidates with those presented in C16.
3.1.1. z ∼ 10 Candidates
Both C16's z ∼ 10 candidates are rejected in the present study (as 2134–0708–645 and 2140+0241−38). These objects have consistent photometric properties between the two studies, including photometric redshift, though C16 used the BPZ photo-z code (Benítez 2000; Coe et al. 2006). However, the first object has an inconsistent photo-z after the application of our phenomenological prior (2134–0708–645 in Table 6). In fact, the probability distribution of this object had a secondary peak at z ∼ 4 (see Figure 4 of C16; ∼40% of the high-z peak), and the rejection after the application of our new prior is not surprising. The second object has large apparent size ( ) and is excluded by the size criterion.
On the other hand, we find a new candidate (2140+0241−303; Figure 3), which was oddly not presented in C16. We find that this object was rejected because of an infinity value in its flux measurement, which came from the artificial values (NaN) in the original rms map in C16. As described in Section 2.2, we mask pixels with the artificial value when calculating their source fluxes for all images in this study. The treatment establishes this source as a viable z ∼ 10 candidate.
This candidate is much brighter ( mag) than any other candidates reported at
  so far (Coe et al. 2013; Zitrin et al. 2015; Oesch et al. 2016; Stefanon et al. 2017; Salmon et al. 2018). Even after correction for magnification (Section 2.9), this candidate has an apparent magnitude of ∼25 mag, corresponding to
  mag, making it as one of the brightest objects at high z (see also Figure 3 of Salmon et al. 2018). Without additional data, we cannot reject any contribution from non-stellar components, such as AGNs.
This candidate shows a small central blob in  , despite its non-detection with isophotal flux (
 ). As for O350 (Section 2.3), we measure the S/N in a small aperture (
 ) in
) in  , still finding no significant detection (
 ). Since the exposure in this field is relatively shallow (two orbits), follow-up observations at ∼1.1 μm would be extremely useful to elucidate this source.
Another caveat is its clustering properties. By nature, bright objects are preferentially found in dense environments and thus neighboring objects are also expected (Muñoz & Loeb 2008; Trenti & Stiavelli 2008; Ishigaki et al. 2016; Harikane et al. 2018). However, with moderate depth of imaging, clustering is not expected to play a significant role in discriminating the nature of the candidate (Ren et al. 2018). Not finding any dropout companions around this object is not unusual with our current imaging data. To further confirm any dropout clustering, deeper ( mag) follow-up observations would be required.
3.1.2. z ∼ 9 Candidates
Two of the three z ∼ 9 candidates in C16 are selected here (0956+2848−98 and 2229−0945−394) with consistent photometric properties, and successfully pass all the selection processes in the present study.
The third candidate in C16 also satisfies all selection criteria in this study (0116+1425−442). However, a follow-up study with HST F098M imaging finds this object to be a low-z interloper at  (Livermore et al. 2018), as we described in Section 2.7.
4. Results
4.1. Effective Volume
We calculate the effective volume by following Oesch et al. (2012) and C16 (see also Carrasco et al. 2018, for a public code based on the same approach adopted here). Briefly, we added artificial sources in empty regions of each science frame. Those sources were modeled with realistic intrinsic distributions of UV colors and half-light radii, and they had assigned redshifts and  magnitudes to compute the selection efficiency as a function of those parameters.
The sources were modeled with a mix of n = 1 and n = 4 Sérsic (1968) profiles, and with half-light radii as found in previous studies (Oesch et al. 2010; Grazian et al. 2012; Ono et al. 2013; Holwerda et al. 2015; Kawamata et al. 2015; Curtis-Lake et al. 2016; Bouwens et al. 2017). We assumed that there is no significant evolution at  (Wilkins et al. 2016), and modeled the SED with observed UV slope β fixed to the
  value (Bouwens et al. 2014). We calculated the completeness as a function of apparent
  magnitude, C(m), and the source selection function as a function of magnitude and redshift,
  , in each sightline by detecting those artificial sources.
The effective comoving volume is then calculated as

where dV/dz represents differential comoving volume at redshift z. The total volume, the sum of the effective volume over all the effective survey fields, i.e., the region that is not occupied by bright sources, ranges from ∼4 × 10⁴ Mpc3 to ∼9 × 10⁵ Mpc3 for our magnitude range,  . The effective volume used for each magnitude bin is summarized in Table 3.
Table 3. Number Density of Dropout Candidates
| MUV |

|
Number |

|
|---|---|---|---|
| (mag) | (Mpc−3 mag−1) | (104 Mpc3) | |
| z ∼ 10 | |||
| −23.0 |

|
1 | 95.68 |
| −22.0 | <−5.9 | 0 | 76.08 |
| −21.0 | <−4.6 | 0 | 3.80 |
| z ∼ 9 | |||
| −23.0 | <−5.9 | 0 | 73.39 |
| −22.0 |

|
1 | 63.87 |
| −21.0 |

|
1 | 19.94 |
Note. Errors of number densities are dominated by Poisson uncertainty.
Download table as: ASCIITypeset image
4.2. Number Density of High-z Candidates
With the final candidates and effective volume derived in the previous sections, we estimate the stepwise number density. The density is estimated by dividing the number of candidates at a given UV absolute magnitude by the effective volume. The 1σ confidence level is estimated by assuming a Poisson distribution (Gehrels 1986). For magnitude bins with no candidates, we show 1σ upper limits derived from the Poisson distribution and effective volume.
We also take account of contamination by multiplying by  , where
  is the contamination fraction defined in Section 2.5 (see also Bradley et al. 2012; Schmidt et al. 2014). With this, the uncertainty from this arbitrary contamination fraction is now limited to ≲0.1 dex in the estimation of number density.
Our results are summarized in Table 3 and shown in Figure 5, where we find consistency with previous studies in BoRG (C16) and other fields (Oesch et al. 2013, 2018; Bouwens et al. 2015b). Our upper limits constrain the number density at values a factor of ∼0.3 dex lower than in C16, thanks to the volume from 79 independent fields. It is noted that since three of C16's candidates are rejected as low-z interlopers in this study, one of C16's data points at z ∼ 10 ( ) now becomes an upper limit.

Figure 5. Number density of z ∼ 10 (left) and z ∼ 9 (right) candidates derived in this study. The bin size in magnitude ( ) is taken so that it becomes larger than the typical errors from photometric redshift and magnitude. Previous results from the partial BoRG[z9] data are shown with open symbols (Calvi et al. 2016, circles; Livermore et al. 2018, diamonds). Other results from previous observations in this magnitude range are also shown with filled symbols (Oesch et al. 2013, hexagons; Bernard et al. 2016, diamonds; Stefanon et al. 2017, large diamond; Ishigaki et al. 2018, squares; Bouwens et al. 2015b, dots; Oesch et al. 2018, crosses). Theoretical expectations of luminosity functions at z ∼ 10 and 9 from Mason et al. (2015a, gray shaded regions), Trac et al. (2015, dash lines), and Yung et al. (2018, solid lines) are shown.
Download figure:
Standard image High-resolution imageAt z ∼ 9, we find a good agreement with theoretical expectations at  , both semi-analytical models (e.g., Mason et al. 2015a) and cosmological simulation (e.g., Trac et al. 2015; Cowley et al. 2018; Yung et al. 2018).
At the brightest magnitude bin of z ∼ 10, however, the estimated density is ≳1 dex above what theoretical models expect. While our sample size is limited, and follow-up studies are necessary to differentiate those candidates from the contamination, this may highlight factors that were missed in previous models, such as evolution of the shape of LFs. The contribution of AGNs, which possibly boost the observed light of our candidates, would also be worth investigating.
5. Discussion
5.1. Impact on Previous LFs at z ∼ 9
Our magnitude range is limited to the bright end, and thus deriving robust LFs with the present data alone is challenging. Still, it is worth investigating how much our new candidates influence LFs derived in previous studies that focused on faint objects but with limited volume, where bright objects could be easily missed. We attempt here to combine our z ∼ 9 candidates with those in Ishigaki et al. (2018) and investigate the impact on the best-fit parameters.18
The z ∼ 9 candidates in Ishigaki et al. (2018) are selected by color–color selections from all the Hubble Frontier Fields (∼56 arcmin2 in total), similar to our scheme. We take the data points of stepwise LFs in their Figure 4, which already takes into account the effect of lens magnification. While their samples include those with photometric redshifts inconsistent with the selection, we still use their values to reproduce their best-fit parameters of LF. The error, dominated by Poisson error, is recalculated in the same manner as ours.
We first fit only their points with a similar technique, the Markov chain Monte Carlo (MCMC) method, to see whether our fitting method reproduces their Schechter function fit:
We use the emcee code (Foreman-Mackey et al. 2013), assuming flat priors in the following ranges: ![$\alpha \in [-10\,:0]$](https://content.cld.iop.org/journals/0004-637X/867/2/150/revision1/apjaae68cieqn198.gif) ,
, ![${M}^{* }\in [-30\,:0]$](https://content.cld.iop.org/journals/0004-637X/867/2/150/revision1/apjaae68cieqn199.gif) mag, and
mag, and ![$\mathrm{log}{\phi }^{* }\in [-10\,:0]$](https://content.cld.iop.org/journals/0004-637X/867/2/150/revision1/apjaae68cieqn200.gif) Mpc−3. The calculation is repeated
Mpc−3. The calculation is repeated  times, and the first half realization is discarded to avoid the bias from initial parameter values. The best-fit values and uncertainties (16/50/84 percentiles) are calculated from the rest of the chain.
When all the parameters are set as free, the fitting results are unconstrained with large uncertainty, as also seen in Ishigaki et al. (2018), because the knee of the LF ( mag) is not sufficiently sampled by their data only. We then follow Ishigaki et al. (2018) and fix two of the parameters (
 and
and  ), finding consistent values for the others. This ensures that results with our fitting method are comparable.
We then add our data and fit with the Schechter function, but with a few updates in the treatment of uncertainties. We run the MCMC fitting routine introduced above  times by fluctuating the data, as described in the following.
First, we fluctuate the observed flux within the random flux error and the systematic uncertainty from the magnification model in each iteration. While the latter uncertainty is relatively small for our candidates, some of those of Ishigaki et al. (2018) have large uncertainties in the magnification (by a factor of ∼3) because of complicated cluster lens modeling.19
Second, we take account of the redshift uncertainty. In Ishigaki et al. (2018), they did not have a selection criterion with photometric redshifts, while our final sample does include one (Section 2.5). To make the two samples consistent, we fluctuate redshifts within their 1σ uncertainty range in each iteration and select those with  (95% confidence interval for our z ∼ 9 candidates) when calculating the number density. Absolute magnitudes are also recalculated based on fluctuated redshifts in this step.
Finally, we refine the UV magnitude grid when calculating the number density, because different grids change the stepwise number density and can affect the fitting parameters (Schmidt et al. 2014). We set the magnitude grid as ![${M}_{\mathrm{UV}}\,\in [-24+\mathrm{rand}(-0.5,0.5)\,:\,-\,13+\mathrm{rand}(-0.5,\,0.5)]$](https://content.cld.iop.org/journals/0004-637X/867/2/150/revision1/apjaae68cieqn207.gif) with a magnitude bin size
with a magnitude bin size  in each iteration, where
  is a random float value taken from the range between a and b. The effective volume is interpolated to the refined magnitude grid. Skipping the third process would underestimate the uncertainty down to ∼30%, depending on the size of the magnitude bin.
The result from combining our new observations with the literature data is shown in Figure 6, where we find that all three parameters are constrained within physically meaningful ranges (Table 4). We present the 50/16/84th percentiles taken from the synthesized MCMC chain ( ) as the best-fit parameters. Compared to the fixed values of Ishigaki et al. (2018) (
 and
and  ), our value for α is smaller (−2.1), and
  is ∼0.6 mag smaller (−21.0), which can be understood from the fact that our data constrain the bright end at a lower number density than previously possibly.

Figure 6. Left: LF fit with the Schechter function form to the combined data from this study (red circles) and Ishigaki et al. (2018, black squares). The fit with the best-fit parameters is shown with blue solid line, with its 16/84th percentiles from all the realizations (blue filled region). The theoretical LF by Mason et al. (2015a) is shown for comparison (gray shaded region). The zoomed region shown in Figure 5 is framed with purple lines. Right: covariance matrices of the LF parameters. Fitting only with previous data from Ishigaki et al. (2018) shows unconstrained results in parameter spaces (filled gray histograms and contours; 39/68/95%), whereas inclusion of our data shows constraints for all parameters (blue contours and histograms).
Download figure:
Standard image High-resolution imageTable 4. Fitting Parameters for Schechter Luminosity Function and Cosmic Star Formation Rate Density at z ∼ 9

|

|
α |

|

|
||
|---|---|---|---|---|---|---|
| (Mpc−3 mag−1) | (mag) | (erg s−1 Hz−1 Mpc−3) | ( yr−1 Mpc−3) yr−1 Mpc−3) |
|||
( ) ) |
( ) ) |
( ) ) |
( ) ) |
|||

|

|

|

|

|

|

|
Note. 50th and 16/84th percentiles are taken from the MCMC realization as the best-fit values and their uncertainties. Associated errors are random photometric errors and systematic errors from the binning size in the UV absolute magnitude. We use  yr−1/(erg s−1 Hz−1) (Madau & Dickinson 2014) to convert from the UV luminosity density (
 ) to the star formation rate density (
 ).
).
Download table as: ASCIITypeset image
With the best-fit Schechter parameters, we estimate the cosmic UV luminosity density,

where  is the UV luminosity at a given UV absolute magnitude. As summarized in Table 4, we find
  (25.6) erg s−1 Hz−1 Mpc−3 with
  (−15), or
  (−2.4) M⊙ yr−1 Mpc−3 when the conversion in Madau & Dickinson (2014) is applied.
The derived value is consistent with that derived in Ishigaki et al. (2018,  yr−1 with
  and
and  ) or slightly larger than that in Oesch et al. (2013,
  with
with  and
and  ), but in excellent agreement with McLeod et al. (2016) and theoretical models (e.g., Tacchella et al. 2013; Mason et al. 2015b, see also Figure 5 of Oesch et al. 2018). The luminosity density derived here lies between those claimed at lower redshifts (e.g., z ∼ 8 in Bouwens et al. 2015b) and higher redshift (z ∼ 10 in Oesch et al. 2018).
Our updated value of the UV luminosity density does not qualitatively change the conclusion in Ishigaki et al. (2018), where they found a linear relation in z– up to z ∼ 9 (see also Oesch et al. 2013; Bouwens et al. 2016; McLeod et al. 2016), which may then turn into an accelerated decrease at yet higher redshift (Oesch et al. 2018).
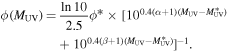
We also fit the number density with a double power law, motivated by recent studies at lower redshift (e.g., Ono et al. 2018):
We set the same prior range as above for α,  , and
, and  , and set
 ![$\beta \in [-10\,:\alpha ]$](https://content.cld.iop.org/journals/0004-637X/867/2/150/revision1/apjaae68cieqn246.gif) . The fit shows unconstrained β and large uncertainties for the other parameters when all the parameters are free. When the characteristic magnitude is fixed (
. The fit shows unconstrained β and large uncertainties for the other parameters when all the parameters are free. When the characteristic magnitude is fixed ( ), the other parameters return some constrained values, but still with relatively large uncertainties (
 ,
,  , and
, and  ). Thus, we conclude that we are still unable to rule out this functional form, and that additional large-area surveys would be highly beneficial.
6. Summary
In this paper, we presented the full data set of BoRG[z9], which collected five-band imaging with HST/WFC3IR and UVIS from 79 independent sightlines (∼370 arcmin2), and we analyzed the data to investigate the number density of bright galaxies at z ∼ 10 and 9. Our findings are summarized as follows.
- 1.With the standard color selection, we first found 15 and 19 candidates at z ∼ 10 and 9, respectively. Through the more strict selection process with photometric redshift and Spitzer photometry, we then identified respectively one and two sources as the final candidates (Figures 3 and 4 and Table 2).
- 2.The z ∼ 10 candidate is one of the brightest galaxy candidates at, an ideal target for follow-up observations.
- 3.We combined our data and previous faint candidates, and constrained the Schechter LF at z ∼ 9 without fixing any parameters for the first time.
- 4.From the best-fit LF parameters, we derived the UV luminosity density, erg s−1 Hz−1 Mpc−3 (when integrated at ), which is consistent with an unaccelerated decreasing of the luminosity density from lower redshift.


Throughout the present study, it became clear that the selection of high-z candidates still suffers from low-z interlopers, especially with a standard color selection method (see also Vulcani et al. 2017). Thanks to our survey design, these candidates are bright and ideal for follow-up photometric and spectroscopic observations that would require only a small fraction of the time devoted to the blind initial search. Future facilities with larger fields of view, such as WFIRST (Spergel et al. 2015), will increase the number of candidates at a similar redshift range and luminosity. Its grism spectroscopic observations, or observations at longer wavelength by JWST (e.g., Kalirai 2018), will be necessary to improve the sample quality beyond that possible with a dropout selection. In addition, such follow-up would also determine the physical properties of the objects such as stellar masses, ages, and possibly chemical composition. Given the limited lifetime of JWST, a BoRG-like pure-parallel observing strategy will be an efficient way of searching for the first bright galaxies at  both with HST and with JWST.
We thank the anonymous referee for providing constructive comments. We thank Masafumi Ishigaki for providing the data points of luminosity function in Ishigaki et al. (2018). T.M. thank Yuichi Harikane for fruitful discussion. Based on observations made with the NASA/ESA Hubble Space Telescope, which is operated by the Association of Universities for Research in Astronomy, Inc., under NASA contract NAS 5-26555. These observations are associated with programs 14701 and 13767. This research was conducted by the Australian Research Council Centre of Excellence for All Sky Astrophysics in 3 Dimensions (ASTRO 3D), through project number CE170100013. C.M. acknowledges support provided by NASA through the NASA Hubble Fellowship grant HST-HF2-51413.001-A awarded by the Space Telescope Science Institute, which is operated by the Association of Universities for Research in Astronomy, Inc., for NASA, under contract NAS 5-26555.
Appendix A: Survey Fields and Limiting Magnitudes
We list here exposure times and limiting magnitudes of all survey fields in the BoRG Cycle 22 observation. The 5σ limiting magnitudes are calculated from rms maps. We measure the median rms value with an aperture of  radius in empty sky regions. Ten out of 89 original fields are discarded, either because the fields are excessively dominated by stars or the acquisition of a guide star failed. Exposure times and limiting magnitudes for all fields are summarized in Table 5.
Table 5. Coordinates, Exposure Times, and 5σ Limiting Magnitudes of BoRG Fields
| Field ID | α(J2000) | δ(J2000) | No. of | E(B − V) | F350LP | F105W | F125W | F140W | F160W |

|
|||||
|---|---|---|---|---|---|---|---|---|---|---|---|---|---|---|---|
| (deg) | (deg) | orbits |

|

|

|

|

|

|

|

|

|

|
(arcmin2) | ||
| 0058–7201a | 1.458e+01 | −7.201e+01 | 2 | 0.322 | ⋯ | ⋯ | ⋯ | ⋯ | ⋯ | ⋯ | ⋯ | ⋯ | ⋯ | ⋯ | ⋯ |
| 0111–7248a | 1.767e+01 | −7.280e+01 | 4 | 0.087 | ⋯ | ⋯ | ⋯ | ⋯ | ⋯ | ⋯ | ⋯ | ⋯ | ⋯ | ⋯ | ⋯ |
| 0116+1425 | 1.906e+01 | 1.441e+01 | 3 | 0.041 | 2408 | 26.41 | 1758 | 26.41 | 2058 | 26.54 | 2208 | 26.43 | 2095 | 27.04 | 4.61 |
| 0119–3411 | 1.968e+01 | −3.418e+01 | 3 | 0.027 | 1758 | 26.05 | 1305 | 26.11 | 1505 | 25.87 | 1605 | 26.08 | 1306 | 26.96 | 4.62 |
| 0132+3035a | 2.311e+01 | 3.059e+01 | 3 | 0.049 | ⋯ | ⋯ | ⋯ | ⋯ | ⋯ | ⋯ | ⋯ | ⋯ | ⋯ | ⋯ | ⋯ |
| 0132–7326 | 2.305e+01 | −7.344e+01 | 2 | 0.073 | 1255 | 26.27 | 1455 | 26.68 | 1705 | 26.46 | 1805 | 26.30 | 1695 | 27.10 | 4.64 |
| 0133+3043a | 2.337e+01 | 3.072e+01 | 3 | 0.041 | ⋯ | ⋯ | ⋯ | ⋯ | ⋯ | ⋯ | ⋯ | ⋯ | ⋯ | ⋯ | ⋯ |
| 0134+3034a | 2.348e+01 | 3.057e+01 | 3 | 0.043 | ⋯ | ⋯ | ⋯ | ⋯ | ⋯ | ⋯ | ⋯ | ⋯ | ⋯ | ⋯ | ⋯ |
| 0134+3041a | 2.343e+01 | 3.068e+01 | 2 | 0.041 | ⋯ | ⋯ | ⋯ | ⋯ | ⋯ | ⋯ | ⋯ | ⋯ | ⋯ | ⋯ | ⋯ |
| 0235–0357 | 3.880e+01 | −3.944e+00 | 16 | 0.023 | 11246 | 26.97 | 8235 | 27.23 | 9446 | 27.06 | 9846 | 27.14 | 8286 | 27.66 | 6.35 |
| 0314–6712 | 4.843e+01 | −6.720e+01 | 8 | 0.038 | 7223 | 27.13 | 5129 | 27.23 | 6123 | 27.28 | 6223 | 27.40 | 4737 | 27.44 | 5.07 |
| 0337–0507 | 5.437e+01 | −5.115e+00 | 3 | 0.044 | 2408 | 26.45 | 1708 | 26.61 | 2058 | 26.41 | 2108 | 26.38 | 1967 | 27.07 | 4.76 |
| 0554–6005 | 8.839e+01 | −6.009e+01 | 4 | 0.057 | 2811 | 26.74 | 2058 | 26.97 | 2411 | 26.85 | 2511 | 26.44 | 2252 | 27.21 | 4.62 |
| 0751+2917 | 1.177e+02 | 2.928e+01 | 4 | 0.043 | 2811 | 26.50 | 2008 | 26.68 | 2411 | 26.56 | 2461 | 26.53 | 2210 | 26.96 | 4.62 |
| 0807+3606 | 1.219e+02 | 3.611e+01 | 4 | 0.049 | 3111 | 26.45 | 2308 | 26.67 | 2611 | 26.63 | 2711 | 26.23 | 2693 | 27.05 | 4.64 |
| 0834+5238 | 1.285e+02 | 5.264e+01 | 3 | 0.035 | 1858 | 26.45 | 1355 | 26.64 | 1605 | 26.59 | 1705 | 26.69 | 1649 | 26.82 | 4.64 |
| 0851+4240 | 1.327e+02 | 4.266e+01 | 3 | 0.025 | 2458 | 26.27 | 1808 | 26.38 | 2108 | 26.29 | 2208 | 26.27 | 2180 | 26.90 | 4.61 |
| 0853+0310 | 1.332e+02 | 3.159e+00 | 3 | 0.050 | 1708 | 26.37 | 1255 | 26.60 | 1505 | 26.49 | 1555 | 26.61 | 1392 | 26.98 | 4.61 |
| 0925+1360 | 1.413e+02 | 1.400e+01 | 3 | 0.032 | 1858 | 26.22 | 1305 | 26.42 | 1505 | 26.41 | 1705 | 26.50 | 1510 | 26.90 | 4.62 |
| 0925+3439 | 1.413e+02 | 3.465e+01 | 3 | 0.020 | 2458 | 26.47 | 1758 | 26.52 | 2058 | 26.44 | 2158 | 26.54 | 2039 | 27.11 | 4.64 |
| 0948+5757 | 1.470e+02 | 5.795e+01 | 3 | 0.015 | 2608 | 26.50 | 1908 | 26.70 | 2208 | 26.34 | 2308 | 26.50 | 2250 | 26.82 | 4.61 |
| 0949+5759 | 1.473e+02 | 5.799e+01 | 4 | 0.014 | 3511 | 26.58 | 2561 | 26.84 | 2861 | 26.70 | 3111 | 26.78 | 2336 | 27.17 | 4.64 |
| 0952+5150 | 1.480e+02 | 5.183e+01 | 3 | 0.007 | 1758 | 26.23 | 1958 | 26.49 | 2308 | 26.45 | 2358 | 26.52 | 1845 | 26.69 | 4.62 |
| 0953+5150 | 1.483e+02 | 5.184e+01 | 4 | 0.009 | 2661 | 26.47 | 1958 | 26.67 | 2308 | 26.64 | 2358 | 26.68 | 1809 | 27.08 | 4.64 |
| 0953+5153 | 1.483e+02 | 5.189e+01 | 8 | 0.009 | 5373 | 26.92 | 3917 | 27.14 | 4617 | 27.10 | 4717 | 27.16 | 3608 | 27.63 | 4.95 |
| 0953+5157 | 1.483e+02 | 5.195e+01 | 4 | 0.010 | 2661 | 26.59 | 1958 | 26.90 | 2308 | 26.80 | 2358 | 27.00 | 1809 | 27.22 | 4.61 |
| 0955+4528 | 1.488e+02 | 4.547e+01 | 3 | 0.011 | 1858 | 26.27 | 1355 | 26.45 | 1605 | 26.30 | 1705 | 26.26 | 1504 | 26.95 | 4.64 |
| 0956+2848 | 1.491e+02 | 2.880e+01 | 6 | 0.018 | 4417 | 26.74 | 3214 | 26.85 | 3767 | 26.70 | 3864 | 26.69 | 2940 | 27.20 | 4.76 |
| 1015+5945 | 1.537e+02 | 5.975e+01 | 6 | 0.010 | 4717 | 26.74 | 3467 | 26.87 | 4017 | 26.60 | 4214 | 25.67 | 3084 | 26.96 | 4.69 |
| 1017–2052 | 1.544e+02 | −2.087e+01 | 3 | 0.044 | 1058 | 25.96 | 705 | 26.13 | 855 | 26.07 | 855 | 26.03 | 900 | 26.77 | 4.64 |
| 1018+0544 | 1.545e+02 | 5.735e+00 | 3 | 0.020 | 2408 | 26.51 | 1758 | 26.70 | 2008 | 26.54 | 2108 | 26.56 | 2000 | 27.09 | 4.64 |
| 1048+1518 | 1.620e+02 | 1.530e+01 | 3 | 0.028 | 2308 | 26.10 | 1658 | 26.16 | 1958 | 26.11 | 2058 | 26.24 | 1980 | 26.78 | 4.61 |
| 1103+2913 | 1.657e+02 | 2.922e+01 | 4 | 0.029 | 3211 | 26.74 | 2311 | 26.81 | 2811 | 26.73 | 2911 | 26.77 | 2575 | 27.34 | 4.64 |
| 1104+2813 | 1.660e+02 | 2.821e+01 | 4 | 0.033 | 2861 | 26.41 | 2058 | 26.50 | 2461 | 26.46 | 2508 | 26.50 | 2275 | 26.98 | 4.63 |
| 1106+2925 | 1.665e+02 | 2.941e+01 | 3 | 0.030 | 2308 | 26.33 | 1605 | 26.43 | 1908 | 26.39 | 2008 | 26.43 | 1823 | 26.96 | 4.66 |
| 1106+3508 | 1.665e+02 | 3.514e+01 | 4 | 0.018 | 3111 | 26.61 | 2208 | 26.79 | 2661 | 26.80 | 2761 | 26.61 | 2480 | 27.18 | 4.64 |
| 1115+2548 | 1.687e+02 | 2.580e+01 | 4 | 0.017 | 2761 | 26.59 | 2008 | 26.81 | 2411 | 26.74 | 2461 | 26.80 | 2151 | 27.21 | 4.62 |
| 1127+2653b | 1.718e+02 | 2.688e+01 | 2 | 0.018 | ⋯ | ⋯ | ⋯ | ⋯ | ⋯ | ⋯ | ⋯ | ⋯ | ⋯ | ⋯ | ⋯ |
| 1136+0747 | 1.739e+02 | 7.786e+00 | 3 | 0.036 | 2408 | 26.43 | 1708 | 26.48 | 2058 | 26.57 | 2108 | 26.57 | 2113 | 27.06 | 4.64 |
| 1142+2640 | 1.755e+02 | 2.667e+01 | 7 | 0.019 | 4370 | 26.71 | 3214 | 26.89 | 3717 | 26.87 | 3817 | 26.88 | 3166 | 27.21 | 4.75 |
| 1142+2647 | 1.755e+02 | 2.678e+01 | 3 | 0.022 | 2158 | 26.37 | 1658 | 26.52 | 1908 | 26.33 | 1958 | 26.52 | 1486 | 26.90 | 4.64 |
| 1142+3020 | 1.756e+02 | 3.034e+01 | 3 | 0.021 | 2408 | 26.52 | 1758 | 26.79 | 2108 | 26.71 | 2158 | 26.78 | 2130 | 27.20 | 4.61 |
| 1143+3019 | 1.756e+02 | 3.032e+01 | 3 | 0.020 | 1808 | 26.35 | 1305 | 26.55 | 1505 | 26.36 | 1605 | 26.52 | 1266 | 26.88 | 4.63 |
| 1149+2202 | 1.772e+02 | 2.203e+01 | 3 | 0.025 | 1758 | 26.19 | 1305 | 26.28 | 1555 | 26.30 | 1605 | 26.23 | 1480 | 26.74 | 4.64 |
| 1152+3402 | 1.779e+02 | 3.403e+01 | 2 | 0.020 | 1605 | 26.38 | 1155 | 26.51 | 1405 | 26.44 | 1455 | 26.51 | 1154 | 26.91 | 4.64 |
| 1152+5433 | 1.779e+02 | 5.455e+01 | 4 | 0.010 | 2811 | 26.43 | 2008 | 26.72 | 1758 | 26.52 | 2461 | 25.82 | 2185 | 27.04 | 4.62 |
| 1152+5434 | 1.779e+02 | 5.456e+01 | 7 | 0.010 | 5070 | 26.64 | 3617 | 26.84 | 4320 | 26.82 | 4370 | 26.60 | 3947 | 27.33 | 5.81 |
| 1154+4639 | 1.784e+02 | 4.665e+01 | 6 | 0.032 | 3717 | 26.81 | 2711 | 27.03 | 3211 | 26.91 | 3411 | 27.09 | 2583 | 27.46 | 4.71 |
| 1160+0015 | 1.800e+02 | 2.522e–01 | 2 | 0.032 | 1805 | 26.51 | 1255 | 26.54 | 1505 | 26.44 | 1605 | 26.62 | 1473 | 26.88 | 4.64 |
| 1209+4543 | 1.824e+02 | 4.572e+01 | 7 | 0.014 | 4420 | 26.94 | 3164 | 27.14 | 3717 | 27.12 | 3917 | 26.75 | 3500 | 27.48 | 4.62 |
| 1218+3008 | 1.846e+02 | 3.013e+01 | 6 | 0.021 | 4067 | 26.73 | 2964 | 26.85 | 3417 | 26.80 | 3564 | 26.68 | 2764 | 27.20 | 4.65 |
| 1229+0751a | 1.874e+02 | 7.857e+00 | 8 | 0.024 | ⋯ | ⋯ | ⋯ | ⋯ | ⋯ | ⋯ | ⋯ | ⋯ | ⋯ | ⋯ | ⋯ |
| 1313+1804a | 1.982e+02 | 1.807e+01 | 4 | 0.020 | ⋯ | ⋯ | ⋯ | ⋯ | ⋯ | ⋯ | ⋯ | ⋯ | ⋯ | ⋯ | ⋯ |
| 1334+3131 | 2.034e+02 | 3.152e+01 | 3 | 0.012 | 2408 | 26.52 | 1808 | 26.75 | 2108 | 26.68 | 2108 | 26.55 | 2133 | 27.15 | 4.64 |
| 1410+2623 | 2.124e+02 | 2.638e+01 | 4 | 0.017 | 2811 | 26.63 | 2008 | 26.85 | 2411 | 26.85 | 2461 | 26.73 | 2210 | 27.21 | 4.62 |
| 1413+0918 | 2.132e+02 | 9.299e+00 | 4 | 0.026 | 3061 | 26.65 | 2211 | 26.68 | 2561 | 26.71 | 2661 | 26.70 | 2358 | 27.12 | 4.61 |
| 1421+4725 | 2.153e+02 | 4.741e+01 | 2 | 0.013 | 1205 | 26.21 | 1305 | 26.55 | 1605 | 26.38 | 1705 | 26.07 | 1480 | 26.93 | 4.61 |
| 1431+0259 | 2.179e+02 | 2.989e+00 | 4 | 0.029 | 3011 | 26.48 | 2208 | 26.59 | 2561 | 26.52 | 2661 | 26.47 | 2551 | 27.08 | 4.61 |
| 1437–0150 | 2.194e+02 | −1.826e+00 | 5 | 0.044 | 3364 | 26.57 | 2461 | 26.66 | 2914 | 26.63 | 3011 | 26.66 | 2541 | 27.15 | 4.63 |
| 1438–0142 | 2.195e+02 | −1.700e+00 | 7 | 0.043 | 4420 | 26.82 | 3164 | 26.96 | 3767 | 26.87 | 3917 | 27.03 | 3393 | 27.43 | 4.65 |
| 1442–0212 | 2.205e+02 | −2.195e+00 | 2 | 0.053 | 1605 | 26.35 | 1155 | 26.46 | 1355 | 26.40 | 1405 | 26.46 | 1252 | 26.88 | 4.64 |
| 1503+3645 | 2.258e+02 | 3.674e+01 | 3 | 0.015 | 2208 | 26.66 | 1605 | 26.80 | 1908 | 26.69 | 2008 | 26.81 | 1443 | 27.25 | 4.64 |
| 1519–0746 | 2.298e+02 | −7.767e+00 | 4 | 0.100 | 2511 | 26.34 | 1858 | 26.64 | 2208 | 26.49 | 2361 | 26.51 | 2244 | 26.91 | 4.63 |
| 1520–2501 | 2.301e+02 | −2.502e+01 | 2 | 0.165 | 1505 | 26.23 | 1005 | 26.28 | 1255 | 26.29 | 1355 | 26.42 | 1872 | 27.01 | 4.62 |
| 1524+0956 | 2.310e+02 | 9.939e+00 | 5 | 0.042 | 3364 | 26.74 | 2461 | 26.85 | 2914 | 26.88 | 3011 | 26.85 | 2520 | 27.31 | 4.64 |
| 1525+0955 | 2.312e+02 | 9.921e+00 | 3 | 0.039 | 1608 | 26.14 | 1155 | 26.40 | 1355 | 26.40 | 1455 | 26.53 | 1230 | 26.87 | 4.61 |
| 1525+0960 | 2.312e+02 | 1.000e+01 | 4 | 0.038 | 2861 | 26.68 | 2008 | 26.87 | 2361 | 26.74 | 2461 | 26.92 | 2154 | 27.22 | 4.64 |
| 1536+1410 | 2.341e+02 | 1.417e+01 | 3 | 0.047 | 2408 | 26.62 | 1758 | 26.62 | 2108 | 26.74 | 2158 | 26.69 | 1950 | 27.19 | 4.63 |
| 1558+0812 | 2.396e+02 | 8.196e+00 | 3 | 0.039 | 2308 | 26.60 | 1255 | 26.64 | 955 | 26.27 | 1505 | 26.58 | 1457 | 27.10 | 4.64 |
| 1607+1332 | 2.417e+02 | 1.354e+01 | 3 | 0.036 | 2408 | 26.60 | 1758 | 26.76 | 2108 | 26.77 | 2158 | 26.76 | 1975 | 27.13 | 4.64 |
| 1614+4856 | 2.435e+02 | 4.894e+01 | 4 | 0.014 | 3211 | 26.71 | 2308 | 26.97 | 2661 | 26.76 | 2711 | 26.75 | 2222 | 26.94 | 4.63 |
| 1619+2541 | 2.448e+02 | 2.568e+01 | 3 | 0.048 | 2408 | 26.63 | 1758 | 26.77 | 2108 | 26.72 | 2158 | 26.72 | 1997 | 27.31 | 4.63 |
| 1632+3736 | 2.479e+02 | 3.761e+01 | 12 | 0.010 | 8435 | 27.16 | 6026 | 27.40 | 7235 | 27.24 | 7385 | 27.34 | 6480 | 27.82 | 5.28 |
| 1659+3732 | 2.548e+02 | 3.753e+01 | 3 | 0.017 | 2508 | 26.60 | 1808 | 26.76 | 2108 | 26.85 | 2158 | 26.71 | 2179 | 27.38 | 4.62 |
| 1708+4237 | 2.571e+02 | 4.262e+01 | 3 | 0.024 | 2708 | 26.84 | 2108 | 26.90 | 2408 | 26.88 | 2408 | 26.86 | 2055 | 27.38 | 4.64 |
| 1715+0455 | 2.588e+02 | 4.915e+00 | 4 | 0.119 | 2461 | 26.47 | 1908 | 26.70 | 2261 | 26.66 | 2411 | 26.66 | 933 | 26.66 | 4.63 |
| 1715+0502 | 2.588e+02 | 5.035e+00 | 5 | 0.132 | 3064 | 26.63 | 2261 | 26.82 | 2661 | 26.71 | 2911 | 26.85 | 3262 | 27.41 | 4.64 |
| 1738+1839 | 2.644e+02 | 1.865e+01 | 2 | 0.061 | 1605 | 26.40 | 1155 | 26.51 | 1355 | 26.52 | 1505 | 26.32 | 1541 | 27.07 | 4.64 |
| 1920–4531 | 2.901e+02 | −4.552e+01 | 4 | 0.086 | 2911 | 26.51 | 2058 | 26.74 | 2511 | 26.35 | 2661 | 26.48 | 2660 | 26.98 | 4.62 |
| 2008–6610 | 3.020e+02 | −6.617e+01 | 2 | 0.071 | 1805 | 26.44 | 1305 | 26.63 | 1505 | 26.49 | 1605 | 26.07 | 1855 | 27.08 | 4.64 |
| 2057−1423 | 3.143e+02 | −1.438e+01 | 3 | 0.051 | 1908 | 26.32 | 1505 | 26.53 | 1705 | 26.45 | 1705 | 26.44 | 1710 | 27.10 | 4.64 |
| 2134–0708 | 3.235e+02 | −7.126e+00 | 6 | 0.033 | 4167 | 26.28 | 2964 | 26.54 | 3514 | 26.35 | 3714 | 26.27 | 3605 | 26.92 | 4.70 |
| 2140+0241 | 3.249e+02 | 2.690e+00 | 2 | 0.088 | 1605 | 26.37 | 1155 | 26.45 | 1355 | 26.31 | 1405 | 26.30 | 1872 | 27.09 | 4.61 |
| 2141–2310a | 3.252e+02 | −2.317e+01 | 3 | 0.049 | ⋯ | ⋯ | ⋯ | ⋯ | ⋯ | ⋯ | ⋯ | ⋯ | ⋯ | ⋯ | ⋯ |
| 2228–0955 | 3.371e+02 | −9.920e+00 | 3 | 0.052 | 2408 | 26.38 | 1708 | 26.52 | 2058 | 26.47 | 2108 | 26.50 | 2093 | 26.97 | 4.64 |
| 2229–0945 | 3.372e+02 | −9.752e+00 | 3 | 0.050 | 1758 | 26.26 | 1255 | 26.39 | 1505 | 26.40 | 1605 | 26.32 | 1479 | 26.83 | 4.63 |
| 2253–1411 | 3.434e+02 | −1.419e+01 | 4 | 0.044 | 2761 | 26.57 | 2008 | 26.70 | 2361 | 26.65 | 2461 | 26.75 | 2174 | 27.09 | 4.61 |
| 2312–1423 | 3.479e+02 | −1.439e+01 | 3 | 0.035 | 2408 | 26.55 | 1758 | 26.57 | 2108 | 26.72 | 2158 | 26.57 | 1970 | 27.09 | 4.64 |
| 2323+0059 | 3.507e+02 | −9.841e–01 | 3 | 0.044 | 2408 | 26.37 | 1708 | 26.42 | 2008 | 26.34 | 2158 | 26.40 | 2095 | 26.94 | 4.63 |
Note. Column 1: Field name derived from the coordinates. Columns 2 and 3: α and δ coordinates (in degrees) from the F140W exposure. Column 4: total number of HST orbits allocated. Column 5: Galactic extinction E(B − V) from Schlafly & Finkbeiner (2011). Columns 6–15: exposure time (in seconds) and 5σ limiting magnitude (in AB magnitudes) within an  aperture in each band. Column 16: effective area (in arcmin2).
Appendix B: Rejected Candidates
We summarize here objects that are selected in the color–color selection (Section 2.3) but rejected in the later selection processes. Out of 15 (19) objects selected with the color selection as z ∼ 10 (z ∼ 9) candidates, 0 (1) are rejected by the small aperture photometry in  (Section 2.3), 5 (5) by visual inspection (Section 2.4), 0 (4) by photometric redshifts without priors (Section 2.5.1), 9 (5) by photometric redshifts with priors (Section 2.5.2), and 0 (2) with additional F098M photometry (Section 2.7). The rejected objects are summarized in Table 6.
Table 6. Coordinates and Photometric Properties of Rejected Objects
| Object ID | α(J2000) | δ(J2000) |

|
Colors | S/N |

|

|
Reason for | |||||||
|---|---|---|---|---|---|---|---|---|---|---|---|---|---|---|---|
| (deg) | (deg) | (mag) | C1 | C2 |

|

|

|

|

|

|
Peak | Prior | Rejection | ||
| z ∼ 10 candidates | |||||||||||||||
| 0807+3606−406 | 121.854693 | 36.100561 | 25.4 | 1.3 ± 0.3 | 0.6 ± 0.2 | −0.3 | −3.2 | 0.9 | 3.3 | 6.6 | 9.3 | 9.3 | 3.1 | 2.28 | zprior |
| 0834+5238−575 | 128.508154 | 52.632111 | 26.3 | 2.0 ± 0.8 | 0.9 ± 0.3 | 0.5 | 0.4 | 0.9 | 1.3 | 4.0 | 7.5 | 7.0 | 3.6 | 2.16 | vis |
| 0851+4240−465 | 132.729208 | 42.670074 | 24.8 | 1.7 ± 0.5 | 0.6 ± 0.2 | 1.0 | 1.2 | 0.9 | 2.2 | 6.5 | 10.5 | 10.1 | 3.4 | 0.95 | zprior |
| 0948+5757−185 | 147.048362 | 57.949351 | 25.4 | 2.1 ± 0.9 | 0.8 ± 0.2 | 0.4 | −0.0 | 1.3 | 1.2 | 5.8 | 10.0 | 7.2 | 3.9 | 0.53 | zprior |
| 0953+5153−1073 | 148.299729 | 51.877393 | 26.1 | 1.4 ± 0.6 | 0.6 ± 0.3 | 1.1 | 1.0 | 1.0 | 2.0 | 4.5 | 6.5 | 7.0 | 2.8 | 5.45 | zprior |
| 0956+2848−401 | 149.093549 | 28.792157 | 26.2 | 1.4 ± 0.5 | 0.7 ± 0.3 | 1.0 | 1.0 | 0.9 | 2.1 | 4.5 | 7.6 | 9.9 | 3.1 | 1.41 | zprior |
| 1136+0747−805 | 173.930982 | 7.777363 | 25.8 | 2.2 ± 1.1 | 0.8 ± 0.3 | 0.7 | 1.4 | 0.8 | 1.0 | 3.5 | 7.3 | 10.3 | 2.8 | 1.09 | vis |
| 1152+5433−109 | 177.928053 | 54.574866 | 25.8 | 1.4 ± 0.5 | 0.6 ± 0.2 | −0.1 | 1.1 | 1.3 | 2.2 | 5.5 | 7.4 | 7.0 | 3.0 | 2.55 | zprior |
| 1218+3008−265 | 184.563250 | 30.136829 | 24.4 | 1.8 ± 0.2 | 0.7 ± 0.1 | −0.3 | 0.2 | 0.7 | 4.4 | 13.1 | 21.4 | 10.1 | 3.5 | 0.47 | zprior |
| 1619+2541−760 | 244.807436 | 25.686392 | 26.5 | 2.2 ± 1.0 | 0.9 ± 0.3 | −1.4 | −1.0 | 1.0 | 1.1 | 3.5 | 7.3 | 7.5 | 3.9 | 0.11 | vis |
| 1738+1839−581 | 264.400431 | 18.664927 | 27.0 | 1.5 ± 0.7 | 0.6 ± 0.3 | 0.7 | 1.3 | −0.3 | 1.7 | 3.8 | 6.1 | 9.9 | 3.2 | 1.49 | vis |
| 2134–0708–645† | 323.562304 | −7.120044 | 25.4 | 1.8 ± 0.8 | 0.5 ± 0.2 | 0.5 | 1.0 | −0.2 | 1.4 | 5.7 | 6.9 | 10.0 | 10.4 | 0.12 | zprior |
| 2229–0945–424 | 337.196149 | −9.738446 | 26.4 | 1.8 ± 0.6 | 0.8 ± 0.3 | −1.1 | −0.4 | −0.2 | 1.8 | 4.8 | 8.5 | 10.2 | 3.5 | 6.05 | vis |
| 2312–1423–353 | 347.931939 | −14.404852 | 25.4 | 1.7 ± 0.5 | 1.0 ± 0.3 | −0.2 | −0.4 | 0.5 | 2.1 | 3.6 | 9.1 | 10.2 | 3.6 | 1.75 | zprior |
| z ∼ 9 candidates | |||||||||||||||
| 0116+1425−442 | 19.034665 | 14.402626 | 24.4 | 1.8 ± 0.4 | 0.1 ± 0.1 | 0.2 | −0.8 | 2.7 | 11.0 | 14.4 | 16.4 | 8.4 | 8.7 | 0.32 | Y098 |
| 0314–6712–1393 | 48.393390 | −67.198000 | 26.5 | 1.8 ± 0.8 | 0.0 ± 0.3 | 0.8 | 0.7 | 1.3 | 3.6 | 6.1 | 5.6 | 8.4 | 2.0 | 0.87 | zprior |
| 0337–0507–775 | 54.365817 | −5.118763 | 25.0 | 1.8 ± 0.6 | −0.0 ± 0.1 | 3.0 | 1.2 | 1.9 | 6.1 | 13.1 | 10.8 | 7.7 | 2.0 | 1.05 |

|
| 0554–6005–812 | 88.383324 | −60.080277 | 26.8 | >1.9 | −0.1 ± 0.3 | 0.7 | 1.1 | 0.1 | 3.2 | 6.8 | 4.9 | 9.2 | 2.1 | 0.38 | zprior |
| 0751+2917−410 | 117.723475 | 29.287342 | 25.1 | >3.0 | −0.0 ± 0.1 | 0.0 | −4.7 | 0.0 | 11.9 | 12.6 | 10.7 | 9.2 | 8.8 | 0.17 | vis |
| 0751+2917−499 | 117.717853 | 29.288468 | 25.4 | >2.4 | 0.1 ± 0.2 | 0.0 | 0.9 | 0.7 | 4.8 | 7.8 | 7.5 | 9.0 | 8.9 | 0.05 | Y098 |
| 0952+5150−162 | 148.066856 | 51.817542 | 25.4 | 1.6 ± 0.5 | 0.1 ± 0.2 | 0.6 | 0.4 | 2.3 | 4.4 | 9.4 | 8.4 | 7.7 | 2.0 | 0.79 | zprior |
| 1017–2052–119 | 154.367086 | −20.858955 | 24.9 | 1.6 ± 0.6 | 0.1 ± 0.2 | 0.1 | −0.6 | 2.0 | 4.4 | 9.5 | 9.0 | 7.4 | 2.0 | 1.10 | zprior |
| 1104+2813−156 | 165.968967 | 28.198873 | 24.9 | 1.7 ± 0.5 | 0.0 ± 0.1 | 0.9 | −0.3 | 2.3 | 5.6 | 11.5 | 10.9 | 7.5 | 2.0 | 1.07 | zprior |
| 1152+5433−577 | 177.915777 | 54.541200 | 26.4 | >1.5 | 0.1 ± 0.3 | −0.4 | −0.4 | 0.1 | 3.9 | 6.2 | 5.0 | 8.7 | 8.7 | 0.08 | vis |
| 1152+5433−664 | 177.922295 | 54.541692 | 26.4 | >1.5 | −0.1 ± 0.3 | 0.3 | −0.1 | −3.5 | 3.7 | 6.1 | 4.4 | 9.0 | 9.0 | 0.01 | vis |
| 1438–0142–939 | 219.459857 | −1.683573 | 26.6 | >2.8 | −0.9 ± 0.3 | 0.1 | −0.5 | 0.3 | 0.1 | 10.5 | 4.2 | 10.5 | 2.0 | 1.14 | vis |
| 1442–0212–600 | 220.555169 | −2.177198 | 25.6 | >2.2 | 0.2 ± 0.2 | 0.9 | 0.8 | 0.9 | 4.9 | 7.9 | 6.8 | 8.8 | 8.8 | 0.22 | zflat |
| 1520–2501–228 | 230.076333 | −25.013525 | 24.2 | 1.7 ± 0.3 | 0.2 ± 0.1 | 0.6 | −0.1 | 3.1 | 8.0 | 14.1 | 16.4 | 7.5 | 8.6 | 0.72 | zflat |
| 2008–6610–77 | 302.024097 | −66.165779 | 25.7 | >2.4 | 0.1 ± 0.2 | 0.2 | −0.6 | 0.8 | 8.7 | 8.6 | 8.4 | 8.9 | 8.9 | 0.34 | zflat |
| 2229–0945–755 | 337.194543 | −9.768108 | 26.3 | 2.1 ± 1.0 | −0.2 ± 0.2 | 0.7 | 0.0 | 1.1 | 7.8 | 8.9 | 7.0 | 8.8 | 8.8 | 0.02 | vis |
| 2312–1423–763 | 347.926274 | −14.380445 | 26.1 | >2.1 | 0.1 ± 0.2 | −0.2 | 1.0 | −0.8 | 3.2 | 6.6 | 7.0 | 10.1 | 8.8 | 0.61 | zprior |
Notes. Same as Table 2, but for those color-selected objects rejected by either of the following. Reasons of rejection: vis: visual inspection;  : photometric redshifts with a flat prior show inconsistent results with color-cut criteria and/or the peak of high-
 probability is not sufficient compared to the low-
 one (
one ( );
);  : same as
  but for photometric redshifts with a custom prior (Section 2.5.3);
  : excess of
  flux (S/N
  ) in a small aperture (radius of 016); and
  : follow-up study rejects the high-
 possibility (Livermore et al. 2018).
Download table as: ASCIITypeset image
Appendix C: Importance of Supplemental F098M Photometry
Two among the final z ∼ 9 candidates were rejected after adding supplemental F098M photometry (one in this study and one in Livermore et al. 2018). These candidates would otherwise have been included in the final sample, satisfying all the criteria in this study (i.e., <20% of contamination rate). In particular, without F098M data, the redshift probability distribution for the former source included a >98% likelihood at  . With the F098M photometry (
 ), the redshift probability changed dramatically, preferring a low-z result at
  (Figure 7).

Figure 7. Same as Figure 3 but for 0751+2917−499 with F098M detection (top right), despite the absence of clear detection in F105W. The color stretch is changed for Y105 from other filters to stress its noise level. The central blob is hardly distinguishable from the surrounding noise either by eye or with SExtractor ( ). The non-detection in
  is attributed to its shallow exposure (t = 2008 s), while F098M has a much deeper exposure from multiple observing programs (t = 18,642 s). Addition of F098M photometry dramatically changes the photometric probability distribution (from middle to bottom panels), revealing the importance of medium-band photometry near Lyman breaks.
Download figure:
Standard image High-resolution imageWith F098M, the SED (Figure C1) is now fitted with a passive galaxy template, whose best-fit parameters are  ,
,  mag, and
  , revealing this as an intermediate-mass, moderately dusty, quiescent galaxy. The SED parameters are derived from FAST (Kriek et al. 2009), assuming the dust law of Calzetti et al. (2000) and the initial mass function of Salpeter (1955). The best-fit template indicates the magnitude in Y105 to be ∼27 mag.
Our results and the recent work by Livermore et al. (2018) jointly highlight the benefit from additional follow-up data with medium-band filters around the expected Lyman break in order to build reliable photometric samples. This approach is more efficient than just application of a yet stricter selection criterion (which risks decreasing significantly the selection completeness), and would require only a modest amount of additional observing time because  candidates are rare.
Footnotes
- 11
For example, cosmic variance for our 79 independent fields of view reduces to ∼26% of the value for a single contiguous survey with the same area coverage (Trenti & Stiavelli 2008).
- 12
- 13
Since we update the source detection parameters from C16, target IDs between the two studies are not identical.
- 14
- 15
- 16
- 17
- 18
We adopt the result of Ishigaki et al. (2018) because it consists of the largest survey volume down to
mag at z ∼ 9. It should therefore be least affected by adding our bright-end data points, which is ideal for our test here. - 19
