


Abstract
We present observations of NGC 1068 covering the 19.7–53.0 μm wavelength range using FORCAST and HAWC+ on board SOFIA. Using these observations, high-angular-resolution infrared (IR) and submillimeter observations, we find an observational turnover of the torus emission in the 30–40 μm wavelength range with a characteristic temperature of 70–100 K. This component is clearly different from the diffuse extended emission in the narrow line and star formation regions at 10–100 μm within the central 700 pc. We compute 2.2–432 μm 2D images using the best inferred clumpy torus model based on several nuclear spectral energy distribution (SED) coverages. We find that when 1–20 μm SED is used, the inferred result gives a small torus size (<4 pc radius) and a steep radial dust distribution. The computed torus using the 1–432 μm SED provides comparable torus sizes,  pc radius, and morphology to the recently resolved 432 μm Atacama Large Millimeter Array observations. This result indicates that the 1–20 μm wavelength range is not able to probe the full extent of the torus. The characterization of the turnover emission of the torus using the 30–60 μm wavelength range is sensitive to the detection of cold dust in the torus. The morphology of the dust emission in our 2D image at 432 μm is spatially coincident with the cloud distribution, while the morphology of the emission in the 1–20 μm wavelength range shows an elongated morphology perpendicular to the cloud distribution. We find that our 2D clumpy torus image at 12 μm can produce comparable results to those observed using IR interferometry.
Export citation and abstract BibTeX RIS
1. Introduction
NGC 1068 (D = 14.4 Mpc, Bland-Hawthorn et al. 1997, and 1'' = 70 pc, adopting H0 = 73 km s−1 Mpc−1) is the archetypical type 2 active galactic nucleus (AGN). The emission from its central engine is obscured by a distribution of optically thick dust. This dusty distribution has recently (Gallimore et al. 2016; García-Burillo et al. 2016; Imanishi et al. 2018) been resolved with the Atacama Large Millimeter Array (ALMA) observations using continuum and emission line observations with angular resolution <0 1 (<7 pc), which have provided tight constraints on the torus size and morphology. Specifically, García-Burillo et al. (2016) measured a 7–10 pc torus diameter using 432 μm continuum emission, Gallimore et al. (2016) found a 12 × 7 pc structure through the study of the CO J = 6 → 5 emission, and Imanishi et al. (2018) found that both the morphology and dynamics of the HCN J = 3 → 2 and HCO+ J = 3 → 2 emission are fairly aligned in the east–west direction with a size of ∼12 × 5 pc. In addition, infrared (IR) interferometric observations (Wittkowski et al. 2004; Jaffe et al. 2004; Raban et al. 2009; López-Gonzaga et al. 2014) have put tight constraints on the different emission components of the torus in NGC 1068. Specifically, a 700 K dust structure with a size 1.4 pc, 250 K structure with a size of 3 pc, and an extended 14 pc dust component in the polar direction with a characteristic temperature of 350 K. These observations have challenged our current understanding on the emission and distribution of dust surrounding the active nucleus of NGC 1068.
The torus is not resolved by the current suite of single-dish telescopes, thus spectral energy distribution (SED) modeling using the best angular resolution to isolate the torus emission from extended diffuse dust emission, star formation regions, and/or host galaxy is crucial to obtain physical information about the torus (i.e., Mason et al. 2006; Hönig et al. 2008; Alonso-Herrero et al. 2011; Ramos Almeida et al. 2011, 2014; Feltre et al. 2012; Ichikawa et al. 2015). These extensive works have been performed in the 1–20 μm wavelength range with the general agreement that the torus is formed by a clumpy distribution of optically thick dust with sizes of a fews parsec surrounding the central engine. The 1–20 μm high-angular resolution observations show an increase in the total flux density with increasing wavelength. The silicate feature at 10 and 18 μm, the near-IR (NIR) emission, and the luminosity of the torus in the 10 μm window provide important diagnostic tools to constrain the torus structure (Ramos Almeida & Ricci 2017). However, these studies show that the turnover of the torus emission occurs in the 20–30 μm, which causes the torus emission to be dominated by warm dust with a characteristic temperature of ∼100–150 K, and with typical torus diameters of ≤5 pc—slightly smaller than the currently resolved observations by ALMA.
There is an observational gap within the 20–70 μm wavelength range with angular resolutions <10'', where warm/cold dust in the torus seems to have its peak of emission, and that it has not been characterized. A Bayesian exploration study by Asensio Ramos & Ramos Almeida (2013) using clumpy torus models found that the region between 10 and 200 μm provides the best wavelength range to constrain the torus radial extent and the number and radial distribution of clouds in the torus. Fuller et al. (2016) observationally show the potential of far-IR (FIR) observations to constrain the torus size using 31.5 μm imaging observations with the Faint Object Infrared Camera for the SOFIA Telescope (FORCAST) on board SOFIA. They found that (1) the torus radial extent model parameter decreases by 30% in size for 60% (6 out of 10 AGNs) of their sample, and (2) the SED turnover of the torus emission does not occur up to 31.5 μm, in  . Their observations also show resolved diffuse extended emission along the narrow line region (NLR), which allowed them to better isolate the torus emission using SOFIA than previous Spitzer 30–40 μm observations. The combination of fully sampled nuclear SED, resolved IR interferometric and ALMA observations, and torus models is crucial to break degeneracies in the physical properties of the torus.
With the tight constraint on the torus size of NGC 1068 provided by the resolved images by ALMA, and the currently available moderate angular resolution FIR capabilities, we here present an observational study to characterize the emission and distribution of dust through the characterization of the SED of NGC 1068 using torus models. We present observations of NGC 1068 covering the 19.7–37.1 μm wavelength range using FORCAST and newly obtained 53.0 μm imaging observations by the High-resolution Airborne Wideband Camera (HAWC+) on board SOFIA. The paper is organized as follows: Section 2 describes the observations and data reduction, Section 3 discusses the emission and dust distribution of dust in the torus of NGC 1068, and Section 4 shows the spectral decomposition of the nuclear SED. In Section 5, we present our conclusions.
2. Observations and Data Reduction
2.1. FORCAST Observations
NGC 1068 was observed as part of the Guaranteed Time Observations (GTO; PI: T. Herter) on 2016 September 17 using FORCAST (Herter et al. 2012) on the 2.5 m SOFIA telescope. We made observations with the dual-channel mode at the 19.7, 31.5, and 37.1 μm using the two-position chop-nod (C2N) method with symmetric nod-match-chop to remove time-variable sky background and telescope thermal emission and to reduce the effect of 1/f noise from the array. In all observations, we used an instrumental position angle, i.e., long axis of the detector with respect to the north on the sky, of 305°, a chop-throw of 1' with a 30° E of N chop-angle. The on-source times were 427s, 471s, and 343s at 19.7 μm, 31.5 μm, and 37.1 μm, respectively.
SOFIA provided reduced data using the forcast redux pipeline v1.1.3 following the method described by Herter et al. (2013) to correct for bad pixels, "droop" effect, nonlinearity, and cross-talk. The point-spread functions (PSFs) of the observations were estimated using observations of Ceres taken immediately before NGC 1068 observations with the same instrumental configuration and bands. We estimated a full width at half maximum (FWHM) of Ceres of 24, 28, and 29 at 19.7 μm, 31.5 μm, and 37.1 μm, respectively. NGC 1068 was flux-calibrated using the set of standard stars of the observing run, which provides flux uncertainties of 5.0%, 5.2%, and 7.7% at 19.7 μm, 31.5 μm, and 37.1 μm, respectively.
2.2. HAWC+ Observations
NGC 1068 was observed as part of the GTO (PI: D. Dowell) on 2017 May 06 using HAWC+ (Vaillancourt et al. 2007; D. A. Harper et al. 2018, in preparation) on the 2.5 m SOFIA telescope. We made observations using the Lissajous pattern in the total intensity mode at 53 μm ( μm,
μm,  bandwidth). In this new SOFIA observing mode, the telescope is driven to follow a parametric curve at a nonrepeating period whose shape is characterized by the relative phases and frequency of the motion. Figure 1 shows the Lissajous pattern of a single observation at 53 μm of NGC 1068 with a scan rate of 100'' s−1 and a 60'' scan amplitude. We performed a total of five Lissajous scans with relative phases of 5° and 27° with a total on-source time of 455 s.
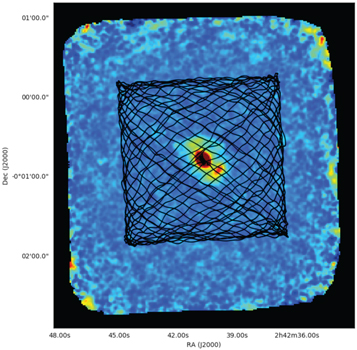
Figure 1. Example of a single Lissajous pattern (black line) overlaid on the final image at 53 μm of NGC 1068 (color scale) using several Lissajous scans.
Download figure:
Standard image High-resolution imageWe reduced the data using the Comprehensive Reduction Utility for SHARC II v2.34-3beta (crush, Kovács 2006, 2008)17
optimized for HAWC+ and the hawc_dpr pipeline v1.1.1. crush estimates and removes the correlated atmospheric and instrumental signals, solves for the relative detector gains, and determines the noise weighting of the time streams in an iterated pipeline scheme. The PSF was estimated using Uranus observations on 2017 May 07 with an FWHM of 49, consistent with diffraction-limited observations at 53 μm. Flux calibrators were not observed during the same flight, thus we cross-calibrated our observations using flux calibrators, i.e., Uranus, from other flights. Although we find a flux calibration accuracy of ∼8% for observations taken within the same flight, the cross-calibration between flights can only ensure a flux accuracy of ∼20%.
2.3. Photometry and Nuclear Flux Imaging Modeling
We aim to obtain the emission from the unresolved core of NGC 1068 at all the observed wavelengths. The SOFIA observations of NGC 1068 show a resolved core (Figure 2) that is thought to arise from an unresolved component and an extended component. To obtain the fractional contribution to the total emission from both unresolved and extended components, we made two different photometric measurements (Table 1). First, the flux in a circular aperture of 10'' (700 pc) diameter was measured, which ensures to enclose the whole flux of an unresolved source at the given wavelength and minimizes the contribution from the diffuse extended emission. Second, the central 20'' × 20'' (1.4 × 1.4 kpc2) emission was fitted with a composite model using the corresponding PSF to each observation and a 2D Gaussian profile. We refer to these methods as "aperture" and "PSF-scaling" photometry, respectively, in the remainder of the paper. The aperture photometry represents the total flux from the observed galaxy at a given wavelength, FT. In the PSF-scaling method, the total flux from the scaled-PSF, FPSF, represents the maximum likely contribution from an unresolved nuclear component at the given angular resolution of the observations, while the total flux from the 2D Gaussian profile, Fext, provides the minimum contribution of the extended component surrounding the central source. We estimated the total flux of the model,  , as the sum of both the PSF and the 2D Gaussian profile. The PSF-scaling method has five free parameters, the amplitudes of both PSF and 2D Gaussian profile, the FWHM of the long, b, and short, a, axes and the position angle (P.A.) of the 2D Gaussian profile. The fitting routine minimizes the residuals (galaxy minus model: scaled-PSF + 2D Gaussian) to a level <5% of the total flux, FT, within the central 20'' diameter. We also considered a 2D Sérsic profile to fit the extended component. We obtained index profiles ∼0.5 and size parameters of the Sérsic profiles similar to the FWHM of the observations, which is close to the special case of the Sérsic profile tending to a Gaussian profile. Due to this behavior and that the Sérsic profile increases the number of free parameters, we decided to use 2D Gaussian profiles.

Figure 2. From left to right: NGC 1068 observations, scaled PSF, Model (PSF+2D Gaussian) of the central  (1.4 × 1.4 kpc2), and Residuals (NGC 1068–Model) at 19.7 μm, 31.5 μm, 37.1 μm and 53 μm from top to bottom, respectively. In all cases, the FOV is
  (3.5 × 3.5 kpc2). NGC 1068, PSF and Model contours are shown in
 ![$\mathrm{log}{\rm{(flux}}\,{\rm{density}}\,{\rm{[Jy])}}$](https://content.cld.iop.org/journals/0004-637X/859/2/99/revision1/apjaabd7bieqn8.gif) from −2.0 to 1.5 in steps of 0.2. Residual contours are shown in flux density (Jy) from −0.4 Jy to 0.3 Jy in steps of 0.02 Jy. North is up and east is left.
from −2.0 to 1.5 in steps of 0.2. Residual contours are shown in flux density (Jy) from −0.4 Jy to 0.3 Jy in steps of 0.02 Jy. North is up and east is left.
Download figure:
Standard image High-resolution imageTable 1. Measured and Modeled Nuclear Photometry
| Photometric Measurementsa | Spectral Decompositionb | ||||||||
|---|---|---|---|---|---|---|---|---|---|

|
FT | F
|
FPSF | Fext | PSF | Extended | Star Formation | Dust at 200 K | Torus |
| (μm) | (Jy) | (Jy) | (Jy) | (Jy) | % | % | % | % | % |
| 19.7 | 61.9 ± 3.1 | 60.9 ± 3.8 | 22.0 ± 1.4 | 38.9 ± 2.4 | 36 ± 4 | 64 ± 7 | 10 | 60 | 30 |
| 31.5 | 59.4 ± 3.1 | 58.4 ± 3.7 | 28.8 ± 1.8 | 29.6 ± 1.9 | 49 ± 5 | 51 ± 6 | 23 | 36 | 41 |
| 37.1 | 59.6 ± 4.6 | 58.8 ± 5.0 | 29.7 ± 2.5 | 29.1 ± 2.5 | 51 ± 8 | 49 ± 8 | 33 | 26 | 41 |
| 53.0 | 71.6 ± 14.3 | 71.5 ± 14.5 | 23.8 ± 4.8 | 47.7 ± 9.7 | 33 ± 15 | 67 ± 25 | 64 | 16 | 20 |
Notes. Fractional contribution of emissive components in a 10'' aperture.
aMeasured and modeled photometry as described in Section 2.3. bFractional contribution of the several components used in the spectral decomposition described in Section 4. We estimate a 5% uncertainty for the fractional contribution of each component.Download table as: ASCIITypeset image
The uncertainty in the photometry was estimated in the following manner. The aperture photometry uses the flux uncertainties estimated from the flux calibration described in Sections 2.1 and 2.2. For the PSF-scaling photometry, an estimate of the error induced by a variable PSF was obtained by cross-calibrating the standard stars observed on the same or several nights. This error was found to be ∼5%. Another estimate of the error induced by the fitting procedure was estimated to be ∼3%. The total uncertainty for the PSF-scaling photometry was calculated by adding in quadrature these individual contributions.
Figure 2 shows the NGC 1068 observations, scaled PSF, Model (PSF+2D Gaussian), and residuals (NGC 1068–Model) of the central 50'' × 50'' (3.5 × 3.5 kpc2) observations at 19.7, 31.5, 37.1, and 53 μm. Table 1 shows the measured and modeled nuclear photometry for each photometric method and model component in the central 10'' aperture. The fractional contribution of the PSF and 2D Gaussian profile in the central 10'' diameter is also shown. Our flux density at 19.7 μm estimated by using PSF-scaling of 22.0 ± 1.4 Jy is in excellent agreement with the flux density of 20.2 ± 3.4 Jy in a 04 aperture by Tomono et al. (2001). We took PACS/Herschel spectroscopic data of NGC 1068 from the Herschel Archive and we obtained a nuclear flux density of ∼70 Jy at 60 μm per spaxel, where a spaxel is  (658 × 658 pc2). Despite the difference in wavelength, this result is in good agreement with our total flux of 72 ± 14 Jy at 53 μm using HAWC+. At all wavelengths, the total flux model,
  , is <2% of the total flux of the observations, FT, and the P.A. of the extended emission is
  with a decrease of the ratio of the short and long axis, a/b, from 0.85 at 19.7 μm to 0.61 at 53 μm. Our extended diffuse emission is spatially coincident with the large scale, 32'' (1.92 kpc) inner bar at a P.A. of
  , the so-called NIR bar (Scoville et al. 1988; Schinnerer et al. 2000; Emsellem et al. 2006). Despite any contribution of diffuse extended emission within the PSF of SOFIA in the 20–53 μm wavelength range (Section 4), we found a turnover of the unresolved emission, FPSF in Table 1, within the 31.5–53 μm wavelength range. Specifically, the PSF fractional contribution to the total flux decreases from ∼50% in the 30–40 μm wavelength range to <40% at shorter and longer wavelengths. This result is in agreement with the observational constraint by Fuller et al. (2016), who suggested that the turnover of the torus emission does not occur until wavelengths >31.5 μm for a sample of nearby AGNs.
3. The Torus of NGC 1068
3.1. Clumpy Torus Models
We here describe the details of the fitting to the nuclear SED of NGC 1068. The nuclear SED is composed of our PSF-scaling photometry (FPSF) in conjunction with the 04 aperture photometry from 2 to 20 μm photometry by Tomono et al. (2001), the 8–13 μm nuclear spectrum in a 04 aperture using Michelle on the 8.1 m Gemini-north Telescope by Mason et al. (2006), and the 432 μm ALMA observation by García-Burillo et al. (2016). We fitted the nuclear SED using the clumpy torus models of Nenkova et al. (2008) and the BayesClumpy approach developed by Asensio Ramos & Ramos Almeida (2009). This approach has been successfully applied to this and other Seyfert galaxies (e.g., Alonso-Herrero et al. 2011; Ichikawa et al. 2015). The free parameters of the model were set with a flat prior distribution, with the exception of the foreground visual extinction to the core, AV, was set to be in the 0–10 mag range. The best inferred model with the 1σ uncertainty region is shown in Figure 3, and the posterior distributions of each model parameter are shown in the Appendix. Table 2 shows the output values of each torus model parameter.
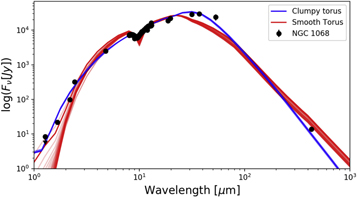
Figure 3. Best-fit (solid line) and 1σ uncertainties (shadowed area) of the clumpy (blue) and smooth (red) torus models to the nuclear SED (black dots) of NGC 1068.
Download figure:
Standard image High-resolution imageTable 2. Clumpy and Smooth Torus Model Parameters
| clumpy Torus | Smooth Torus | ||||
|---|---|---|---|---|---|
| Parameter | Symbol | Value | Parameter | Symbol | Value |
| Angular width | σ |
 ° ° |
Opening angle |

|
 ° ° |
| Radial thickness | Y |

|
Radial thickness | Ys |

|
| Number clouds along the equatorial plane | N0 |

|
⋯ | ⋯ | ⋯ |
| Index of the radial density profile | q |

|
Index of the radial density profile | qs | 1 (fixed) |
| Optical depth of each cloud |

|

|
Optical depth of the torus, LOS |

|

|
| Viewing angle | i |
 ° ° |
Viewing angle | is |
 ° ° |
| Inner radius | rin |
 pc pc |

|
 pc pc |
|
| Outer radius | rout |
 pc pc |

|
 pc pc |
|
| Height | H |
 pc pc |
Hs |
 pc pc |
|
| Bolometric luminosity (erg s−1) | Lbol |

|

|

|
|
Download table as: ASCIITypeset image
In general, the full family of clumpy torus model solutions when using the SOFIA observations from 20 to 53 μm provides a tighter 1σ dispersion than previous studies (i.e., Alonso-Herrero et al. 2011, Figure 5; García-Burillo et al. 2016, Figure 4, our Figure 4). This result is due to the better sampling of the turnover of the torus emission in the 30–40 μm as in comparison with previous studies. The median value for the foreground visual extinction was found to be  mag. We notice that if the extinction to the core was set to be negligible,
  mag, then the fitting tends to obtain viewing angles, i, of the torus in the
  range, and does not fit the SED in the 1–5 μm wavelength range. Packham et al. (1997) found that a visual extinction of 36 mag to the core of NGC 1068 can explain the absorptive polarization at 2.0 μm, compatible with the expected null polarization observed at 10 μm by the emissive polarization of the torus found by Lopez-Rodriguez et al. (2016). Both works also found a visual extinction by the central dust lane to be ∼8 mag. Thus, we expect that the torus emission is extinguished by a column of dust into our LOS with a visual extinction in the range of 8–36 mag, our computed visual extinction of
  mag is in agreement within that range. We obtained a viewing angle,
  compatible with the H20 maser observations in the central parsec of NGC 1068, which suggests a torus with an almost edge-on view, ∼90°.
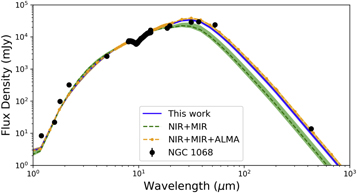
Figure 4. Clumpy torus models inferred using different SED sampling (Table 3). The posterior distributions for each model are shown in Table 3 and Figure 7.
Download figure:
Standard image High-resolution imageBased on the best inferred clumpy torus model, we can estimate torus morphological parameters as the outer radius,  pc, where rin is the inner radius of the torus defined by the distance of the sublimation temperature of dust grains, T, as a function of the bolometric luminosity, Lbol, as
  pc (Barvainis 1987), and the torus scale height as
  pc. The estimated bolometric luminosity from our clumpy torus model,
  erg s−1, yields an inner torus radius of
  pc for dust grains at a temperature of 1500 K. Using
  and
and  °, the torus radius and scale height are estimated to be
  pc and
  pc, respectively. Table 2 summarizes these results. These results are in agreement with the resolved 7–10 pc torus extension (García-Burillo et al. 2016), 12 × 7 pc (Gallimore et al. 2016), and 12 × 5 pc (Imanishi et al. 2018) torus diameter using ALMA observations. We can estimate the visual extinction into our LOS,
  , as
, as  mag. From our best clumpy torus model, we estimate
  mag. Using the standard Galactic ratio
  mag cm2 (Bohlin et al. 1978), we estimate a column density of
  cm−2.
cm−2.
3.2. Smooth Torus Models
We have also used smooth torus models (Efstathiou & Rowan-Robinson 1995) to fit the nuclear SED of NGC 1068. The best-fit model and the output parameters are shown in Figure 3 and Table 2, respectively. In general, the smooth torus models reproduce well the nuclear SED of NGC 1068, except for the FIR (20–60 μm) wavelength range. In this spectral range, the smooth torus models underestimate the measured nuclear fluxes. We note that if we force these models to fit the FIR range, then the smooth torus models overpredict the submillimeter fluxes by a factor of 10 or more, and the torus size increases to a few tens of parsecs. Thus, we use the MIR spectroscopic observations, i.e., the 10 μm silicate feature, and the ALMA observations to find the best fit of the smooth torus model.
We find a smooth torus with similar physical characteristics as the clumpy torus (Table 2), except for the outer radius, which is larger in the case of the smooth torus. This difference is mainly due to the sublimation temperature used by both models, the smooth torus models use a maximum temperature of dust grains of 1000 K, in comparison with the 1500 K used by the clumpy torus models. Although we exclusively used the smooth torus models of Efstathiou & Rowan-Robinson (1995), we speculate that other smooth torus models (i.e., Schartmann et al. 2005; Fritz et al. 2006) may similarly fail to account for the complete SED of the torus. This may be due to the fact that smooth models generally have much less flexibility in the specification of the distribution of the dust in the torus and especially its outer part to which the far-infrared and submillimeter observations are more sensitive. This certainly merits further study and we plan to pursue this in future work.
3.3. The Clumpy Torus Properties versus SED Coverage
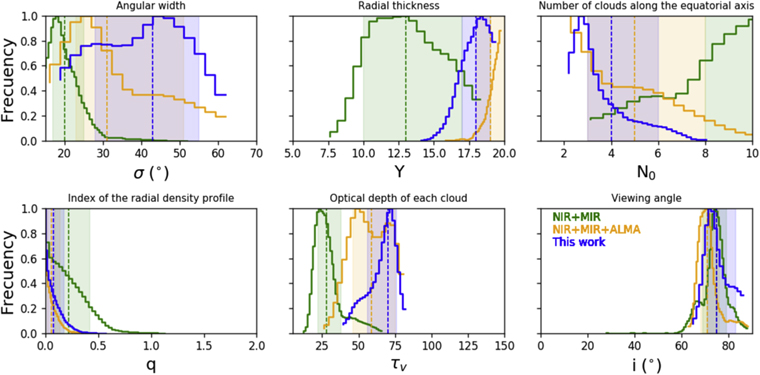
We here investigate the emission and distribution of dust in the torus of NGC 1068 using several SED coverages. Direct comparison between previous studies are not straightforward due to the development of the clumpy torus models through the past several years.18 Our nuclear SED is constructed using the mentioned previous studies in Section 3.1. Thus, to avoid any potential misinterpretation of the physics of the torus that a slightly different version of the models could introduce, we here reanalyze the nuclear SED as a function of the SED coverage using the most updated version of the Clumpy torus models. Table 3 shows the output parameters of the best inferred Clumpy torus model for an SED using 1–20 μm imaging and spectroscopic observations (labeled as NIR+MIR), and for an SED using 1–20 μm imaging and spectroscopic observations and ALMA observations (labeled as NIR+MIR+ALMA). The posterior distributions for each parameter with their median value and 1σ error are shown in the Appendix. For each SED coverage, Figure 4 shows the best inferred clumpy torus model and their 1σ uncertainty.
Table 3. clumpy Torus Model Parameters As a Function of SED Coverage
| σ (°) | Y | N0 | q |

|
i (°) | rout (pc) | SED |
|---|---|---|---|---|---|---|---|
20
|

|

|

|

|

|

|
1–20 μm SED+MIR Spectroscopy |
31
|

|

|

|

|

|

|
1–20 μm SED+MIR Spectroscopy+ALMA |
Download table as: ASCIITypeset image
When clumpy torus model fitting is used with data only in the 1–20 μm wavelength range, (1) the torus is smaller and more compact (large q values) than the current resolved torus of ∼10 pc diameter of NGC 1068 by the ALMA observations, and (2) the turnover of the torus emission peaks at shorter wavelengths than when the SED coverage includes observations at longer wavelengths. This result implies that 1–20 μm observations are not able to probe the full extent of the torus. Despite the angular resolution,  , Figure 4 shows that the turnover of the torus emission occurs in the range of 30–40 μm, which corresponds to a characteristic temperature of 70–100 K. This result indicates that (1) the amount of cold dust and/or (2) the radiation from indirectly radiated clouds is substantial to shift the peak emission of the torus toward longer wavelengths.
3.4. 2D Clumpy Torus Images
We use the radiative transfer code clumpy torus (Nenkova et al. 2008) to compute the surface brightness and cloud distributions of the dusty torus as a function of wavelength for each set of parameters shown in Table 3. Specifically, we use the HyperCubes of AGN Tori (HyperCAT19 ; R. Nikutta et al. 2018, in preparation). HyperCAT uses the clumpy torus models with any combination of parameters to generate physically scaled and flux-calibrated 2D images of the dust emission and distribution for a given AGN. We use a distance of 14.4 Mpc, a torus orientation on the plane of the sky of ∼138° east of north based on the IR polarimetric signature of the nucleus (e.g., Packham et al. 1997; Simpson et al. 2002; Gratadour et al. 2015; Lopez-Rodriguez et al. 2015), and the bolometric luminosities and model parameters by each inferred model from Table 3. Figure 5 shows the dust emission distribution from 2.2 to 432 μm for the 1–20 μm SED+MIR Spectroscopy (labeled as NIR+MIR), 1–20 μm SED+MIR Spectroscopy+ALMA (labeled as NIR+MIR+ALMA), and this work, whose torus parameters are summarized in Table 2. The last column shows the cloud distribution for each clumpy torus.
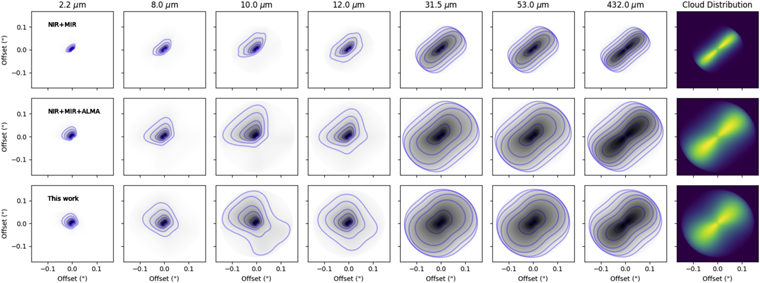
Figure 5. 2D Clumpy torus images of NGC 1068 generated using HyperCAT based on the several SEDs in Table 3 as a function of wavelength. The first seven columns show the dust emission from 2.2 to 432 μm, while the last column shows the cloud distribution. Contours show the intensities at the levels of 0.05, 0.1, 0.2, 0.3, 0.5, 0.7, and 0.9 times the peak flux. In all cases, the model was scaled to a distance of 14.4 Mpc; north is up and east is left.
Download figure:
Standard image High-resolution imageFor all cases, the clouds are distributed in the equatorial plane with major differences in their torus sizes, angular widths, and radial density profile (Figure 4, last column). These differences affect the morphology of the dust emission as a function of wavelength. We find that the 2.2 μm dust emission is concentrated on the inner edge of the torus where dust is directly radiated by the central engine, while the 8–12 μm dust emission is along the polar direction as the high opacity in the equatorial direction is absorbing most of the radiation from the central engine. At longer wavelengths, >30 μm, the dust emission is along the equatorial plane, where the 432 μm truly describes the bulk of dust distribution in the torus.
We point out the tight morphological and size similarities between our 2D clumpy torus image at 432 μm, using the well sampled SED from 1 to 432 μm, with the observed torus emission by the ALMA observations (García-Burillo et al. 2016; Imanishi et al. 2018). However, when ALMA observations are compared with the 2D images produced by the 1–20 μm SED, the inferred torus model is smaller, more compact, and thinner, which supports the discussion above regarding the 1–20 μm observations, which underestimate the true size of the torus.
Using our 2D clumpy torus image at 12.0 μm, we find that the dust emission along the polar direction is ∼5 times that of the central dust emission. We estimate the dust emission along the polar direction using an ellipse of semimajor axis of 139 mas (9.7 pc) and an eccentricity of 0.91, while the central dust emission was estimated in a circular aperture of 50 mas (3.5 pc) diameter. At this wavelength, the north emission is more prominent than that coming from the south, due to the inferred torus inclination of 75°. We estimate that the fractional contribution along the polar direction increases at larger inclinations, although further extinction by the host galaxy and/or dust in the NLR will play an important role in the observed emission as a function of the location in the galaxy. López-Gonzaga et al. (2014), using IR interferometric observations with MIDI/VLTI, found that dust emission in the polar regions at scales of 5–10 pc contributes four times more at 12 μm than dust located in the torus. They also found a dependency on flux density as a function of the location along the north–south direction attributed to extension by the host galaxy. Our results using a solely 2D clumpy torus model and those by IR interferometric observations are of comparable order of magnitude, which tentatively indicates that the IR interferometric observations of NGC 1068 may be observing the dust emission from the optically thin dust of the torus.
4. Spectral Decomposition
Diffuse extended emission from dust and/or star formation regions surrounding the AGN can contribute at some level within the unresolved core of the SOFIA observations. What is the contribution of AGN emission within the unresolved core of our SOFIA observations?
We perform an SED analysis and fit the SED of the nuclear emission using the aperture and PSF-scaling photometric measurements, hereafter referred to as "large" and "small" aperture SEDs, respectively.
The large aperture SED is composed of our 10'' aperture photometry (FT in Table 1) in combination with Spitzer spectroscopic data taken from CASSIS20 (Lebouteiller et al. 2011). In addition, we also include the 2–20 μm photometry in a 4'' (280 pc) aperture using the Mid-Infrared Test Observation System on the 8.2 m Subaru Telescope by Tomono et al. (2001). Figure 6 shows the nuclear SED using large (red dots) and small (black dots) apertures. It is worth noticing that (1) all the photometric measurements using large apertures are consistent with our aperture photometry, FT, and (2) our 10'' photometric measurement at 53 μm shows an increase in flux density with respect to the 30–40 μm photometric measurements, which indicates an extra emissive component at long wavelengths.
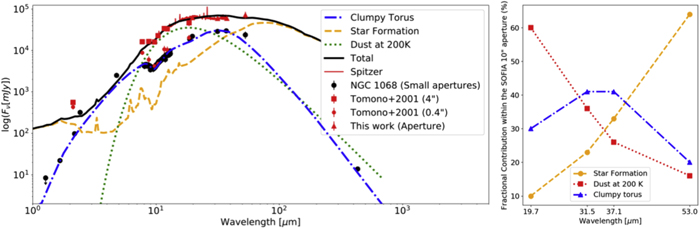
Figure 6. Left: spectral decomposition of the nuclear SED of NGC 1068. The large apertures (red dots and lines) were fitted using the star formation region (orange dashed line), the clumpy torus (blue dotted–dashed line), and a blackbody component at 200 K (green dotted line). The small aperture photometry and spectroscopy (black dots) was fitted as described in Section 3.1. The total model (black line) is shown. Right: fractional contribution to the total flux within the SOFIA 10'' aperture from the star formation (orange dashed line/circle), dust at 200 K (red dotted line/square), and clumpy torus (blue dotted–dashed line/triangle) components.
Download figure:
Standard image High-resolution imageThe large aperture SED was fitted as the contribution of the best inferred of the clumpy torus model to the small aperture SED (Section 3.1) and a star formation component. We use the clumpy torus model because it better reproduces the smaller aperture SED than the smooth torus models. We use the empirical template of M82 as the star formation component from the Spitzer-space-telescope, Wide-field, InfraRed Extragalactic (SWIRE) template library21
(Polletta et al. 2007). We estimate the minimum reduced  , ensuring that the total model was within 10% of the measured total flux density of the large aperture SED. We find that the aperture photometric measurements in the 20–53 μm wavelength range can be explained by the contribution of the torus emission and star formation region. However, we have to include an extra component to explain the excess of emission in the 8–20 μm wavelength range. This excess emission can be explained with the combination of the torus emission and an additional blackbody component with a characteristic temperature at 200 K. We interpret the dust component at 200 K as dust emission arising from the NLR in the central 10'' (700 pc) of NGC 1068 (see Tomono et al. 2001). Table 1 lists the fractional contribution of each component within the 10'' aperture for the SOFIA observations. We estimate a 5% uncertainty for the fractional contribution of each component shown in Table 1.
Based on our spectral decomposition within the 10'' (700 pc) nuclear aperture, the fractional contribution to the total flux of the star formation increases with increasing wavelength, from 10 ± 1% at 19.7 μm to 64 ± 3% at 53 μm (Figure 6, right panel). The dust emission from extended dusty structures modeled as a blackbody component with a characteristic temperature at 200 K decreases with increasing wavelength, from 60 ± 3% at 19.7 μm to 16 ± 1% at 53 μm. This extended emission, not associated with the torus, contributes >80% of the total flux in the 8–20 μm wavelength range and it is attributed to the N-S dust emission as seen by Bock et al. (2000) and also previously suggested by Cameron et al. (1993) and Mason et al. (2006). The fractional contribution to the total flux of the torus emission shows a turnover in the range of 30–40 μm with a maximum fractional contribution to the total emission of 41 ± 2%, reaching a minimum of 20 ± 1% at 53 μm.
We can compare the potential contribution from the torus emission within the PSF-scaling photometry estimated in Section 2.3. In general, the fractional contribution of the total flux from the PSF-scaling method, percent PSF in Table 1, is slightly larger than the torus emission estimated by the spectral decomposition, percent Torus in Table 1. Specifically, the PSF-scaling method agrees with the torus emission within the PSF of SOFIA at all wavelengths within a fraction of ∼10% in the 20–53 μm wavelength range. Based on Figure 6, the turnover of the torus emission in the range of 30–40 μm can be distinguished from (a) the expected peak emission at ∼100 μm by star formation regions, and (b) the extended dust emission associated with the NLR at shorter wavelengths.
5. Conclusions
Using SOFIA observations taken with FORCAST (19.7–37.1 μm) and HAWC+ at 53.0 μm on board SOFIA, we observationally find the turnover of the torus emission of NGC 1068 to be in the 30–40 μm wavelength range. Specifically, the torus emission increases from 1 to 30 μm and then we measure a decrease in the unresolved nuclear emission at 53 μm with respect to the photometric measurements in the 30–40 μm wavelength range. This result is in agreement with the observational constraint that the turnover does not occur until wavelengths >31.5 μm found by Fuller et al. (2016) using a sample of 11 Seyfert galaxies. Using Clumpy torus models, we found a radius of  pc for the torus of NGC 1068. Our estimation of the torus size is in excellent agreement with the recently observed diameter of 7–10 pc by ALMA (Gallimore et al. 2016; García-Burillo et al. 2016; Imanishi et al. 2018). Although smooth torus models produce compatible results with those found by the clumpy torus models, they overestimate the nuclear SED in the FIR wavelength range. Despite the angular resolution of SOFIA, the 20–53 μm SOFIA observations together with (1) PSF-scaling and spectral decomposition techniques, and (2) clumpy torus models provide a tool to characterize the size of the torus in a large sample of AGNs when subarcsecond resolution observations by ALMA are not available.
We computed 2D images for the best inferred clumpy torus model using several SED coverages. We found that the full extent and the cold dust of the torus are underestimated when a nuclear SED covering the 1–20 μm wavelength range is used. The inferred clumpy torus from our 1–432 μm nuclear SED reproduces well the ALMA observations. Specifically, the dust emission at 432 μm is spatially coincident with the cloud distribution of the torus, while the morphology of the dust emission in the 1–20 μm wavelength range probes mostly optically thin dust located above and below the equatorial plane of the torus. We estimated a contribution of the polar dust emission at 12 μm to be  times that from the central source, which indicates that the IR interferometric observations of NGC 1068 may be observing the dust emission from the optically thin dust of the torus.
Based on observations made with the NASA/DLR Stratospheric Observatory for Infrared Astronomy (SOFIA). SOFIA is jointly operated by the Universities Space Research Association, Inc. (USRA), under NASA contract NAS2-97001, and the Deutsches SOFIA Institut (DSI) under DLR contract 50 OK 0901 to the University of Stuttgart. Financial support for this work was provided by NASA through awards #02_0035 and #04_0048 issued by USRA. E.L.-R. acknowledges support from the Japanese Society for the Promotion of Science (JSPS) through award PE17783 and the National Observatory of Japan (NAOJ) at Mitaka and the Thirty Meter Telescope (TMT) Office at NAOJ-Mitaka for providing a space to work and great collaborations during the short stay at Japan. A.A.-H. acknowledges financial support from the Spanish Ministry of Economy and Competitiveness through grant AYA2015-64346-C2-1-P, which is party funded by the FEDER program. C.R.A. acknowledges the Ramón y Cajal Program of the Spanish Ministry of Economy and Competitiveness through project RYC-2014-15779 and the Spanish Plan Nacional de Astronomía y Astrofisíca under grant AYA2016-76682-C3-2-P.
Facilities: SOFIA(FORCAST - , HAWC+) - .
Software: astropy (Astropy Collaboration et al. 2013).
Appendix: Clumpy Torus Model Paramater Posteriors
Figure 7 shows the posterior distributions of the best inferred clumpy torus model shown in Figures 3 and 4.
Figure 7. Posterior distributions (black lines) of the clumpy torus model parameters for the best model shown in Figures 3 and 4. The blue shadowed region shows the  uncertainty and the blue line shows the best inferred model.
Download figure:
Standard image High-resolution image
Footnotes
- 17
crush can be found at http://www.submm.caltech.edu/~sharc/crush/.
- 18
News update of Clumpy torus models: https://www.clumpy.org/pages/news-updates.html.
- 19
clumpy images can be found at https://www.clumpy.org/pages/images.html.
- 20
The Combined Atlas of Sources with Spitzer IRS Spectra (CASSIS) is a product of the IRS instrument team, supported by NASA and JPL: http://cassis.sirtf.com.
- 21
SWIRE templates can be found at http://www.iasf-milano.inaf.it/~polletta/templates/swire_templates.html.