


Abstract
We analyzed Suzaku/XIS data (2006–2015) and Fermi/LAT data (2008–2015) of the gamma-ray emitting radio galaxy NGC 1275. Correlated brightening of the nucleus in both the X-ray and GeV gamma-ray energy bands was found for the period 2013–2015. This is the first evidence of correlated variability between these two energy bands for NGC 1275. We also analyzed Swift/XRT data and found that the X-ray flux increased over several days in 2010, coincidentally with the GeV gamma-ray flare. During the flare, the X-ray spectra were softer, with a photon index of ∼2 compared with 1.5–2.1 of the other periods, suggesting the brightening of a synchrotron component. The GeV gamma-ray band also showed a higher flux with a harder spectrum during the 2010 flare. Simultaneous X-ray and GeV gamma-ray flux increase in the flare could be explained by the shock-in-jet scenario. On the other hand, a long-term gradual brightening of radio, X-ray, and GeV gamma-ray flux with a larger gamma-ray amplitude could have an origin other than internal shocks, and some of these possibilities are discussed.
Export citation and abstract BibTeX RIS
1. Introduction
Radio galaxies are very important to the study of active galactic nucleus (AGN) jet phenomena. The viewing angle of their jets is not as small as that for blazars. Thus, the apparent enhancement of the jet core emission due to the beaming effect is not so significant, and we can probe the jet structure by observing the emission from the jet periphery.
NGC 1275 is an elliptical galaxy located at the center of the Perseus cluster. It is also known to host an AGN, and to be a radio galaxy (Perseus A, 3C 84). On the basis of its optical spectrum, NGC 1275 was classified as a Seyfert galaxy. In recent years, the Large Area Telescope (LAT) on board the Fermi Gamma-ray Space Telescope detected GeV gamma-ray emission from several radio galaxies (Abdo et al. 2010), and NGC 1275 is the brightest among them. As NGC 1275 was not detected with CGRO/EGRET (Reimer et al. 2003), and the gamma-ray flux measured by Fermi/LAT is much higher than the EGRET sensitivity limit, we conclude that the gamma-ray emission from NGC 1275 has increased by over an order of magnitude since the 1990s (Abdo et al. 2009). Fermi/LAT observations showed time variation of gamma-ray flux on the timescale of a few months (Kataoka et al. 2010) with gamma-ray flares detected in 2010 (Donato et al. 2010; Brown & Adams 2011). These results rule out the possibility that the gamma-ray emission comes from the Perseus cluster via the cosmic ray interactions with the intracluster medium or dark matter annihilation (Berezinsky et al. 1997; Totani 2004). In addition, NGC 1275 was also detected above 100 GeV with MAGIC (Aleksić et al. 2012), and correlated variability between GeV and optical was also found (Aleksić et al. 2014). Thus, this radio-loud, gamma-ray emitting galaxy is an ideal laboratory to study jet properties.
The spectral energy distribution (SED) of NGC 1275, including the X-ray band, can be explained by synchrotron self-Compton (SSC) emission in a one-zone model (Abdo et al. 2009; Suzuki et al. 2012) or a structured jet (Tavecchio & Ghisellini 2014). However, the contribution of the jet emission in X-rays is not completely confirmed, as described below. Therefore, the SED of the NGC 1275 jet component currently relies mainly on the radio and gamma-ray data which, depending on the X-ray flux, could make the SSC model parameters change significantly.
In the X-ray band, the host Perseus cluster is very bright, and a point-like source was resolved for the first time with Einstein/HRI (Branduardi-Raymont et al. 1981). XMM-Newton and Chandra can spatially resolve the nucleus emission (Churazov et al. 2003; Balmaverde et al. 2006). Based on the XMM-Newton observations in 2001 and 2006, the X-ray spectrum of the nucleus was reported to be represented by a power law with a photon index of 1.70–1.75 and a flux of (3 − 6) × 10−12 erg cm−2 s−1 in the 5–10 keV energy range (Churazov et al. 2003; Yamazaki et al. 2013). Fabian et al. (2015) reported a historical X-ray light curve of NGC 1275 by collating the results of many past satellites from OSO-8 to Swift/XRT. They showed that the X-ray flux was very high in the 1980s, decreased during the 1990s, and is brighter again after the 2000s. However, the X-ray and GeV gamma-ray connection and the origin of X-rays from the NGC 1275 nucleus have been not well understood. Yamazaki et al. (2013) reported that the Suzaku/XIS observations of NGC 1275 in 2006–2011 showed no clear variability compared to a GeV gamma-ray variability of a factor of three, suggesting that the jet emission is not dominant in the X-ray band.
The Fermi/LAT light curve showed a gradual GeV gamma-ray flux increase after 2010, almost correlating with the 90 GHz radio flux (Dutson et al. 2014). VLBI observations confirmed that the radio outburst seen since 2005 was associated with the emergence of a new component (Nagai et al. 2010). Nagai et al. (2012) reported that the radio flux increase was mostly attributed to one compact component, C3 (Figure 3 in that paper). In this paper, we extend the analysis of Suzaku/XIS data of NGC 1275 presented in Yamazaki et al. (2013) up to 2015, and also show systematic analysis of Swift/XRT data of NGC 1275 in 2006, 2011, and 2013. Throughout this paper, errors correspond to 90% confidence level. In Sections 2–4, we describe the analysis of Suzaku/XIS, Fermi/LAT, and Swift/XRT data, respectively. Finally, Section 5 gives a discussion of our results.
2. Suzaku/XIS Data Analysis and Results
We performed X-ray imaging spectroscopy using the archival Suzaku/XIS (Koyama et al. 2007; Mitsuda et al. 2007) data of NGC 1275, which was repeatedly observed with Suzaku every half year as a calibration target; 19 observations were made from 2006 to 2015 (Table 1 shows 2012–2015). The analysis method is described in detail in Yamazaki et al. (2013). In the Suzaku/XIS data, we can see an X-ray enhancement at NGC 1275 against the ambient Perseus cluster emission in the XIS image. The excess becomes larger in the higher energy band up to 12 keV, indicating that the X-ray spectrum is harder than the cluster emission. We evaluated this excess emission against the ambient cluster emission from the radial count rate profile centered on NGC 1275 in nine energy bands and derived the X-ray spectra of excess emission in each observation. The X-ray spectrum of the excess emission is roughly represented by an absorbed power law with a photon index of 1.6–1.8, and we obtained a history of the 5–10 keV flux from the derived spectra.
Table 1. Summary of Suzaku Observations of NGC 1275 in 2012–2015
| Observation Start | Sequence No. | R.A. Decl.a | Euler Angle | Exposure (XIS)b |
|---|---|---|---|---|
| (deg) | (deg) | (s) | ||
| 2012 Feb 07 20:00:00 | 106005020 | 49.9506 41.4000 | 49.9531 48.4984 188.0014 | 93635 (0, 3) |
| 2012 Aug 20 23:30:00 | 107005010 | 49.9347 41.5380 | 49.9448 48.4826 17.3897 | 82263 (0, 3) |
| 2013 Feb 11 04:59:00 | 107005020 | 49.9644 41.4892 | 49.9561 48.4897 193.7124 | 82795 (0, 3) |
| 2013 Aug 15 10:14:00 | 108005010 | 49.9376 41.5389 | 49.9459 48.4822 13.7581 | 82514 (0, 3) |
| 2014 Feb 05 12:30:00 | 108005020 | 49.9630 41.4842 | 49.9546 48.4948 194.0004 | 75999 (0, 3) |
| 2014 Aug 27 15:50:00 | 109005010 | 49.9309 41.5377 | 49.9434 48.4822 22.6569 | 40051 (0, 3) |
| 2015 Mar 03 17:25:00 | 109005020 | 49.9680 41.4854 | 49.9560 48.4945 201.4727 | 74409 (0, 3) |
Notes. Log of 12 observations in 2006–2011 is given in Yamazaki et al. (2013).
aPointing direction. bExposure time summed over XIS-0 and 3. The values in parenthesis represent the XIS detector ID used for the analysis.Download table as: ASCIITypeset image
The top panel of Figure 1 shows the Suzaku/XIS X-ray light curve of NGC 1275 in 2006–2015. It can be seen that the X-ray flux in the 5–10 keV energy range was constant before 2012 (MJD = 55927 for 2012 January 1) and gradually increased by a factor of 1.5 between 2012 and 2015. There is a systematic difference of flux between Suzaku/XIS and Swift/XRT, whose light curve is derived in Section 4. The analysis region radius of Suzaku/XIS is 1.3 arcmin, almost comparable to the point spread function of 1.0 arcmin (radius). In addition, we applied the simple modeling of cluster emission in the image analysis, although the cluster emission is found to be very complex (Fabian et al. 2006). These issues could give a systematic error of absolute flux calibration. Therefore, in the Suzaku/XIS analysis, we focus on the flux variability.
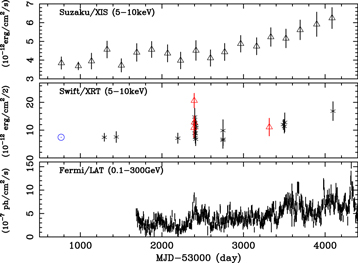
Figure 1. Light curve of the NGC 1275 nucleus from 2005–2016 (The first data point is with Swift/XRT on 2006 January 6, and the last one is with Fermi/LAT on 2016 January 7). Top: Suzaku/XIS X-ray light curve from 5–10 keV, obtained by the analysis of radial count profiles. Middle: Swift/XRT X-ray light curve from 5–10 keV, obtained by spectral fitting. Crosses and triangles represent PC and WT mode, respectively. Circle is a XMM-Newton result (5–10 keV) in 2006 (Yamazaki et al. 2013). Bottom: Fermi/LAT GeV gamma-ray light curve in 0.1–300 GeV with a 4 day time bin.
Download figure:
Standard image High-resolution image3. Fermi/LAT Data Analysis and Results
The Fermi/LAT is a pair conversion telescope with a field of view of about 20% of the sky from 20 MeV to over 300 GeV (Atwood et al. 2009). We analyzed the LAT Pass 8 data (P8R2) (Atwood et al. 2013), based on a complete and improved revision of the entire LAT event-level analysis, collected from 2008 August 4 to 2016 January 7; mission elapsed time (MET) 239557417 to 473874217. Source class events (event type 3, event class 128: front and back events) were selected with a zenith angle cut of <90°, and a time region is selected with the filter expression (DATA_QUAL>0)&&(LAT_CONFIG==1).
We used LAT Science Tools version v10r0p5 with the P8R2_SOURCE_V6 Instrument Response Functions. We extracted the data within a circular region of interest (ROI) of radius 22 5 centered on NGC 1275. The binned likelihood fitting with the gtlike tool was performed for deriving light curves and spectra. The field background point sources within 225 from NGC 1275, listed in the LAT Third Source Catalog (3FGL; Acero et al. 2015), were included, and their spectra were assumed to be the same model as in the catalog. Parameters11
were set to be free or fixed to the catalog values for sources within 10° and beyond 10° from NGC 1275, respectively. The Galactic emission was modeled by the official standard model (gll_iem_v06.fits) (Acero et al. 2016) and the isotropic diffuse gamma-ray background and the instrumental residual background were modeled by the standard official model (iso_P8R2_SOURCE_V6_v06.txt). The normalizations of these two models were left free in the following analysis. A likelihood analysis performed with the energy information binned logarithmically into 30 bins in the 0.1–300 GeV band, and the spatial information binned with 0.1 × 0.1 deg2 bin size in the 30 × 30 deg2 square map region within the circular ROI. We derived the GeV gamma-ray light curve by binning the LAT data into 4 day bins and performing the gtlike analysis for each time bin. The power-law model is assumed for NGC 1275 emission. Figure 1 bottom shows a plot of the GeV gamma-ray light curve. We can see a similar behavior between X-ray and GeV gamma-ray light curves; both light curves show a gradual flux increase since 2013. Figure 2 shows a comparison between the Suzaku flux estimated every half year and the Fermi/LAT flux averaged over every half year. The correlation coefficient is 0.84 for 14 data elements; non-correlation probability is less than 1%. This is the first evidence of positive correlation between X-rays and GeV gamma-rays.
5 centered on NGC 1275. The binned likelihood fitting with the gtlike tool was performed for deriving light curves and spectra. The field background point sources within 225 from NGC 1275, listed in the LAT Third Source Catalog (3FGL; Acero et al. 2015), were included, and their spectra were assumed to be the same model as in the catalog. Parameters11
were set to be free or fixed to the catalog values for sources within 10° and beyond 10° from NGC 1275, respectively. The Galactic emission was modeled by the official standard model (gll_iem_v06.fits) (Acero et al. 2016) and the isotropic diffuse gamma-ray background and the instrumental residual background were modeled by the standard official model (iso_P8R2_SOURCE_V6_v06.txt). The normalizations of these two models were left free in the following analysis. A likelihood analysis performed with the energy information binned logarithmically into 30 bins in the 0.1–300 GeV band, and the spatial information binned with 0.1 × 0.1 deg2 bin size in the 30 × 30 deg2 square map region within the circular ROI. We derived the GeV gamma-ray light curve by binning the LAT data into 4 day bins and performing the gtlike analysis for each time bin. The power-law model is assumed for NGC 1275 emission. Figure 1 bottom shows a plot of the GeV gamma-ray light curve. We can see a similar behavior between X-ray and GeV gamma-ray light curves; both light curves show a gradual flux increase since 2013. Figure 2 shows a comparison between the Suzaku flux estimated every half year and the Fermi/LAT flux averaged over every half year. The correlation coefficient is 0.84 for 14 data elements; non-correlation probability is less than 1%. This is the first evidence of positive correlation between X-rays and GeV gamma-rays.
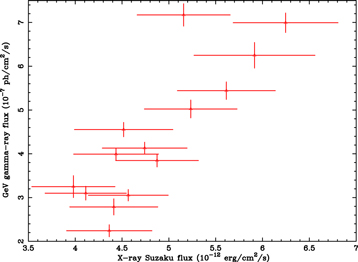
Figure 2. Plot between the Suzaku flux estimated every half year vs. Fermi/LAT flux averaged over every half year.
Download figure:
Standard image High-resolution imageWe performed the spectral studies with the likelihood analysis. We fitted the spectra with a simple power-law model for the three periods: the whole period of 7.5 years, the high-flux period from MJD 56500 (2013 July 27) to MJD 57200 (2015 June 27), and the 2010 Swift/XRT flare period (MJD: from 55388 to 55396; 2010 July 11–19). Then, we obtained a power-law photon index of 2.09 ± 0.01, 2.11 ± 0.01, and 1.91 ± 0.06 for 7.5 years, high-flux period, and 2010 flare, respectively. The former two indices agree with the 2 years data analysis of 2.09 ± 0.02, and the index during the 2010 flare is smaller, indicating that the GeV gamma-ray spectrum became hard during the flare, as indicated by Brown & Adams (2011).
Next we derived the model-independent GeV gamma-ray spectrum by performing the likelihood analysis for 6 energy bands which are logarithmically spaced in 0.1–300 GeV. Figure 3 shows the GeV gamma-ray spectra obtained for the three periods. The 7.5 years spectrum has a higher flux than that in the 3FGL catalog. When we fitted the 7.5 years spectrum by the logParabola  , the fit improves with an increase of test statistics ΔTS = 45 from the single power-law model fitting, and we obtained α = 2.033 ± 0.007 and β = 0.048 ± 0.003 with Eb = 0.530 GeV (fixed, as used in the 3FGL catalog where α = 1.984 ± 0.014 and β = 0.064 ± 0.006). The spectra of the 7.5 years and high-flux periods have a similar shape with a curvature, peaking around 1 GeV and steepening toward the higher energy as reported by Aleksić et al. (2014). On the other hand, the spectrum during the 2010 flare is certainly harder and brighter than those of other periods. Note that the spectrum of Figure 3 in Aleksić et al. (2014) was taken just after the 2010 flare.
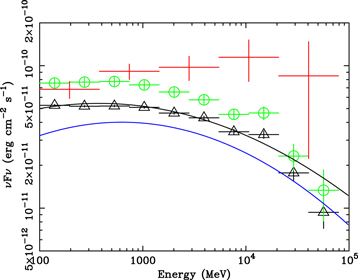
Figure 3. Fermi/LAT GeV gamma-ray spectra of NGC 1275 for the 7.5 years (black), high-flux period (green), and 2010 flare (red). The black solid line represents the best-fit logParabola model for the 7.5 years, and the blue solid line does for the 3FGL catalog (4 years).
Download figure:
Standard image High-resolution image4. Swift/XRT Data Analysis and Results
We analyzed archival Swift/XRT (Gehrels et al. 2004; Burrows et al. 2005) data of NGC 1275 as summarized in Table 2. NGC 1275 was observed several times in 2006, 2010, and 2013. The 2010 and 2013 observations were triggered by Fermi/LAT GeV gamma-ray flux increases; the 2013 increase was reported in Ciprini (2013). Observations were performed in both Windowed-Timing (WT) and Photon-Counting (PC) modes as summarized in Table 2. We analyzed the data with HEADAS 6.11 to obtain a flux for deriving a light curve and study a spectral variation to search for the jet-origin X-ray emission.
Table 2. Summary of Swift Observations of NGC 1275
| Sequence No. | Observationa | Exposureb | Modec | Fluxd | Γe |
|---|---|---|---|---|---|
| 00036524001 | 2007 Jul 13 (54294) | 5387 | PC | 7.4−1.4+1.6 | 1.81−0.14+0.14 |
| 00036524002 | 2007 Dec 06 (54440) | 3554 | PC | 7.5−1.9+2.3 | 2.14−0.18+0.19 |
| 00030354003 | 2009 Dec 30 (55195) | 4311 | PC | 7.1−1.8+2.1 | 1.82−0.19+0.20 |
| 00031763001 | 2010 Jul 15 (55392) | 1988 | WT | 10.9−3.5+4.2 | 1.98−0.34+0.36 |
| 00031763002 | 2010 Jul 18 (55395) | 4063 | WT | 20.6−2.6+2.8 | 2.07−0.12+0.13 |
| 00031763003 | 2010 Jul 20 (55397) | 4110 | WT | 12.8−2.4+2.6 | 2.10−0.18+0.19 |
| 00031770001 | 2010 Jul 22 (55399) | 2186 | PC | 12.6−2.4+2.7 | 1.94−0.13+0.14 |
| 00031770002 | 2010 Jul 24 (55401) | 2033 | PC | 14.7−3.1+3.5 | 1.85−0.15+0.16 |
| 00031770003 | 2010 Jul 26 (55403) | 2031 | PC | 8.9−2.3+2.7 | 2.00−0.18+0.19 |
| 00031770004 | 2010 Jul 28 (55405) | 2162 | PC | 12.6−2.7+3.0 | 1.75−0.16+0.16 |
| 00031770006 | 2010 Aug 01 (55409) | 2116 | PC | 7.4−2.1+2.5 | 2.02−0.20+0.21 |
| 00031770007 | 2010 Aug 03 (55411) | 2409 | PC | 8.9−2.3+2.7 | 1.92−0.19+0.20 |
| 00031770008 | 2010 Aug 05 (55413) | 1989 | PC | 6.7−2.3+2.9 | 2.14−0.25+0.27 |
| 00031770009 | 2010 Aug 07 (55415) | 2091 | PC | 11.5−2.6+2.9 | 1.92−0.16+0.16 |
| 00031770010 | 2010 Aug 09 (55417) | 2103 | PC | 11.0−2.6+3.0 | 1.85−0.17+0.18 |
| 00091128001 | 2011 Jul 05 (55747) | 1008 | PC | 6.3−2.9+3.9 | 1.97−0.34+0.38 |
| 00091128002 | 2011 Jul 06 (55748) | 1343 | PC | 9.8−3.9+5.0 | 1.54−0.34+0.34 |
| 00091128003 | 2011 Jul 07 (55749) | 1748 | PC | 6.7−2.3+2.9 | 1.89−0.25+0.27 |
| 00091128004 | 2011 Jul 09 (55751) | 3460 | PC | 8.9−2.1+2.4 | 1.77−0.18+0.18 |
| 00091128005 | 2011 Jul 10 (55752) | 4922 | PC | 8.0−1.8+2.0 | 1.68−0.17+0.18 |
| 00032691002 | 2013 Jan 23 (56315) | 2679 | WT | 11.1−3.2+3.7 | 1.72−0.32+0.33 |
| 00049799004 | 2013 Jul 14 (56487) | 5262 | PC | 12.0−1.8+2.0 | 1.68−0.11+0.11 |
| 00049799005 | 2013 Jul 26 (56499) | 3054 | PC | 11.4−2.4+2.8 | 1.84−0.15+0.16 |
| 00049799006 | 2013 Aug 01 (56505) | 1566 | PC | 12.8−3.4+3.9 | 1.71−0.20+0.21 |
| 00092034002 | 2015 Mar 15 (57096) | 2143 | PC | 16.9−3.4+3.8 | 1.52−0.16+0.16 |
Notes.
aObservation Date. MJD is shown in parenthesis. bExposure time in unit of second. cPC: Photon-Counting mode; WT: Windowed-Timing mode. dFlux in 5–10 keV in unit of 10−12 erg cm−2 s−1. ePhoton index.Download table as: ASCIITypeset image
Following the analysis of XMM-Newton data in Yamazaki et al. (2013), the source spectra were extracted within 0.4 arcmin from NGC 1275 for the PC mode data. Note that the point spread function of Swift/XRT telescope is almost the same as that of the XMM-Newton telescope. Since pile-up occurs in the PC data, we exclude the central 7 arcsec region to avoid the pile-up events. Background spectra are extracted within 60–65 arcsec from the center; these spectra include the cluster emission.
For the WT mode data, we extracted the spectra within 0.3 arcmin of NGC 1275; the corresponding extraction region is 36 × 1416 arcsec2 in the sky. These source spectra are contaminated by a large amount of hot gas emission from the ambient intracluster medium, thus background estimation should be carefully performed. To estimate the background in this sky region, we made use of the PC mode data of NGC 1275; the PC mode data is not projected into 1D as the WT mode data, thus we can estimate the background contaminating to the WT mode spectra. Then, by using all the PC mode data, we created the spectra from the same sky region as that of the WT mode spectra, but excluded the central 36 × 36 arcsec2. We subtracted them from the WT mode spectra as a background. In addition, as reported by Godet et al. (2009), there is a significant difference of response function in the lower energy band between the PC and WT modes, thus we ignored the spectra below 1.6 keV in the following analysis.
We fitted all the XRT spectra with a single temperature apec plus power-law model; phabs∗(apec+powerlaw) in the XSPEC model. Parameters of the apec model, which represents the residual hot gas emission from the Perseus cluster, are at first left free and then fixed to the average values among each spectrum in each mode: a temperature of 4.1 keV and 4.0 keV, a metal abundance of 0.65 solar and 0.60 solar, and a normalization of 0.00605 and 0.0208, for the PC and WT mode, respectively. These temperatures and abundances are compatible with the values obtained by Chandra (Zhuravleva et al. 2013), XMM-Newton (Churazov et al. 2003), and Hitomi (Hitomi Collaboration et al. 2016).
Figure 4 shows an example of XRT spectra in PC and WT modes. X-ray spectra in both modes are featureless. We fitted all the XRT spectra with the above mentioned model, and obtained a photon index and flux for each observation as summarized in Table 2. In some cases, we could not constrain the power-law parameters due to low statistics, and then we did not show such cases in the figure and table. Figure 1 middle shows a time history of X-ray flux in the 5–10 keV band, obtained by Swift/XRT. For this plot, we derived a Fermi/LAT light curve with a 1 day time bin and plotted it together. The XMM-Newton flux in 2006 is also plotted. The fluxes in 2010are somewhat higher by a factor of two or less. As shown in Figure 5, the bright phase continued for 5–10 days in 2010. This X-ray bright period corresponds to the GeV flare in 2010 which can be seen in this figure. Photon index during this bright phase in 2010 is around 2, while it is around 1.5–2.1 in other periods. ATel 4753 (Ciprini 2013) also reported the GeV gamma-ray flux increase up to (1.1 ± 0.3) × 10−6 ph cm2 s−1 in 2013.
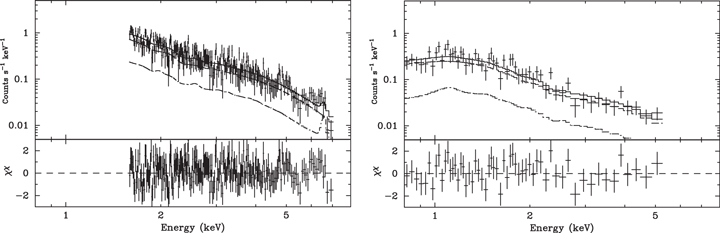
Figure 4. Swift/XRT spectra of NGC 1275 within 0.1 arcmin on MJD = 55392 (WT mode, left) and MJD = 55403 (PC mode, right). Solid lines represent the best-fit wabs∗(apec+powerlaw) model, and dashed and dotted–dashed lines are power law and apec components, respectively. Bottom panels show the fitting residuals.
Download figure:
Standard image High-resolution image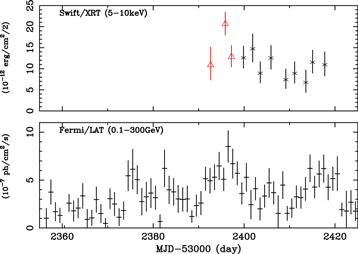
Figure 5. Light curves of Swift/XRT and Fermi/LAT (1 day time bin) of NGC 1275 around MJD = 55400 (2010). In the top panel, the crosses and triangles are Photon counting and Windows mode, respectively.
Download figure:
Standard image High-resolution imageAll Swift/XRT spectra are featureless, while the XMM-Newton spectra show a fluorescence Fe–K line. The tightest upper limit of Fe–K line equivalent width (EW) is 619 eV and 191 eV in PC and WT modes, respectively. Both constraints are consistent with EWs (70–120 eV; Yamazaki et al. (2013)) measured with XMM-Newton; the signal-to-noise ratio of Swift/XRT data is too low to detect a Fe–K line due to a short exposure.
5. Discussion
Analysis of Suzaku/XIS and Swift/XRT data has shown that NGC 1275 nuclear X-ray emission varied over a long-term (several years) timescale and a short-term (several days) timescale. During the short-term flare-up in 2010, the X-ray spectrum became softer, the power-law photon index became 2.0 against 1.5–2.1 in other periods. Figure 6 shows a SED where the data are taken from our results and past results. We plot the data of the long-term variation in black. For the radio band, we used VLBA data (Suzuki et al. 2012). For the optical data, we took the flux range of the KVA light curve in Aleksić et al. (2014). For the X-ray data, we plot the ROSAT/HXI flux (Fabian et al. 2015), long-term flux range with a photon index of 1.7 of Swift and Suzaku in the normal state (this work), and Swift flux during the flares (this work). For the Fermi/LAT, we took the spectra in Figure 3. In the plot, we represented the data of the 2010 flare in red and the data of the GeV gamma-ray high-flux state in green. With reference to this plot, we discuss the flux variation of NGC 1275.
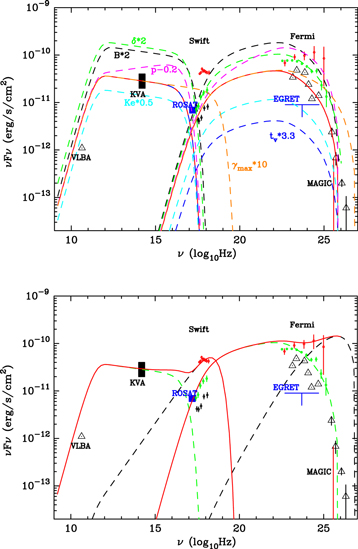
Figure 6. Spectral energy distribution of NGC 1275: the VLBA radio data of the C3 component (Suzuki et al. 2012), optical KVA data (Aleksić et al. 2014). ROSAT/HXI flux (Fabian et al. 2015) (filled rectangle), Swift in the normal (black, 00036524001 in 2007), high-flux (green, 00092034002 in 2015), and flare (red, 00031763002) states (this work), the LAT and MAGIC gamma-ray data in the normal (black) state (Abdo et al. 2009; Aleksić et al. 2014), high-flux (green), and flare (red) states (this work, the colors are the same as Figure 3). See the text for details. Solid and dashed lines are one-zone synchrotron self-Compton model curves calculated with the formula in Finke et al. (2008) for various parameter sets. Top: solid red line represents the baseline parameter set, and other dashed lines are curves which are based on the parameter set where only one parameter (as indicated on the plot) is changed from the baseline parameter set. Bottom: solid red line represents the double SSC model; one is for a steady component (green dashed) and the other is for a flare component (black dashed). See Table 3 for details.
Download figure:
Standard image High-resolution imageThe long-term X-ray variation was already reported by Fabian et al. (2015) with data from many previous X-ray satellites, but our results are unique in terms of showing a positive correlation between the X-ray and GeV gamma-ray bands for the first time. The origin of X-ray emission from the NGC 1275 nucleus is somewhat uncertain. Several papers assumed that the X-ray emission comes from the inner jet (Abdo et al. 2009; Kataoka et al. 2010; Suzuki et al. 2012; Aleksić et al. 2014), and obtained the jet emission parameters by analyzing the SED. On the other hand, XMM-Newton spectrum shows a Fe–K line with an EW of ∼70 eV and a power-law photon index of 1.7 (Churazov et al. 2003; Yamazaki et al. 2013). These properties are typical of Seyfert galaxies, thus the disk/corona emission and its reflection component are suggested to be dominant in the normal state. We suggest that the jet emission largely contributes to the X-ray region when the GeV gamma-ray flux increases as in 2013–2014.
We plot one-zone synchrotron self-Compton model curves calculated with the formula in Finke et al. (2008) for various parameter sets, using the code of Itoh et al. (2015). We assumed a broken power law for the electron energy distribution as in Abdo et al. (2009). The baseline parameter set (Table 3) is a modification of Abdo et al. (2009); we adjusted the magnetic field and the variability timescale to be weaker and shorter, respectively, so that the VLBA, optical, and X-ray data in the normal state are reproduced. We calculated the dashed curves by changing only one parameter from the normal state for magnetic field B, Doppler factor δ, variability timescale tvar, normalization of electron energy spectrum Ke, and power-law index of electron energy distribution p2 above the break energy.
Table 3. Baseline SED Model Parameters of NGC 1275 Nucleus
| Baseline | Change | Steady | Flare | |
|---|---|---|---|---|
| Γ | 2.3 | ×2 | same | same |
| B [G] | 0.035 | ×2 | same | same |
| tv [Ms] | 13.4 | ×3.3 | 8.94 | 0.50 |
| p1 | 2.1 | same | 2.0 | |
| p2 | 3.1 | −0.2 | same | 2.0 |
| γmin | 8 × 10² | same | same | |
| γmax | 4 × 10⁵ | ×10 | same | 4 × 10⁶ |
| γbrk | 9.6 × 10² | same | same | |
| Pj,B [1040 erg s−1] | 0.24 × 10⁴ | 0.11 × 10⁴ | 3.4 | |
| Pj, e [1040 erg s−1] | 2.0 × 10⁴ | 3.0 × 10⁴ | 2.8 × 10³ | |
Note. The model parameters are as follows: δ is the Doppler factor, B is the magnetic field, tv is the variability timescale, p1 and p2 are the low-energy and high-energy electron spectral indices, respectively, γmin, γmax, and γbrk are the minimum, maximum, and break electron Lorentz factors, respectively, and Pj, B and Pj, e are the jet powers in magnetic field and electrons, respectively.
Download table as: ASCIITypeset image
In the long-term variation, the X-ray flux increase is not as large as the GeV gamma-ray increase. Such behavior is reproduced by an increase of the electron density Ke, spectral hardening (decrease of p2) of electron energy distribution, increase of Doppler factor δ, and increase of magnetic field as shown in Figure 6 left (light blue, purple, light green, and black, respectively). However, the latter two cases are not consistent with a slight increase of optical flux as seen in Aleksić et al. (2014). Also, a year-scale gradual hardening of electron energy distribution is unlikely, since the cooling time of high-energy electrons is much shorter than one year. Therefore, the increase of electron density is one possibility. In addition, the reduction of the size of the emission region, in other words, the decrease of variability timescale  may also contribute (inferred from the opposite trend against the blue lines in Figure 6 left, which shows a longer tvar case). We plot the model in the case that tvar is shorter by a factor of 1.5 in Figure 6 right (green dashed). We might see the jet collimation for the recent gradual brightening. On the other hand, the radio C3 component brightened since 2003 with an accelerating apparent speed of 0.10c to 0.47c (Nagai et al. 2010, 2012; Suzuki et al. 2012). Their flux history is similar to that of GeV gamma-ray and also X-ray. Nagai et al. (2012) reported no radio flare during the 2010 gamma-ray flare. Therefore, C3 is likely to be related to the long-term gamma-ray and X-ray flux increase. Nagai et al. (2016) suggested that the C3 is the head of a radio lobe including a hot spot, and its activity would be enhanced by the energy input from the nucleus. As seen in Figure 2 of Nagai et al. (2016), the radio core (C1 component) has also been increasing a little as well as C3. Therefore, the C1 increasing activity is one possible origin of long-term gradual increase of X-ray and gamma-ray flux.
Here, we calculate the one-zone SSC model, following Abdo et al. (2009). In this modeling, the X-ray emission in the normal state is the low-energy tail of the inverse Compton scattering (IC), and the main IC component appears above 1 MeV, due to a relatively high minimum electron energy (γ = 800). The assumed electron spectrum is as steep as ∝γ−3.1. On the other hand, Aleksić et al. (2014) modeled the SSC with a flatter electron spectrum ∝γ−2.5 or ∝γ−2.4 and a lower minimum electron energy of γ = 100. However, their model exceeds the observed X-ray emission in the normal state. Therefore, Tavecchio & Ghisellini (2014) introduced the structured jet model where the fast spine component mainly contributes to the low-energy peak of the SED, while the slower layer surrounding the spine produces the high-energy peak of the SED. In fact, Nagai et al. (2014) found limb-brightened structure in the VLBA core of NGC 1275, suggesting such a structured jet. In this case, the X-ray emission is the lower part of the main IC component coming from the slow layer.
One interesting fact is that NGC 1275 was not detected with CGRO/EGRET in 1991–2000, when the X-ray flux was almost the same as the current flux (Fabian et al. 2015). NGC 1275's current GeV gamma-ray flux observed with Fermi/LAT is brighter than the EGRET sensitivity limit. This indicates that the gamma-ray to X-ray flux ratio was smaller in 1991–2000 by a factor of >10 than that at present. The X-ray variation almost follows the radio variation (Fabian et al. 2015). This could be caused by a different electron energy density in the emission region between two epochs; a higher electron energy density in the present epoch by a factor of >10 than that in 1990s (light blue). The difference of emission region size (or tvar) could be the origin of this change in density, but a reduction of emission region size by a factor of >3 from the 1990s to the present epoch is needed, and it seems unlikely. Asada et al. (2006) reported that the radio flux decrease in the 1990s is attributed to the adiabatic expansion of the radio lobe in the central ∼5 pc, in agreement with the above scenario.
Short-term X-ray brightening found with Swift/XRT coincides with GeV gamma-ray brightening for the 2010 flare (Brown & Adams 2011). This indicates that the source of the X-ray flare is the jet emission. The 2010 flare showed a GeV gamma-ray flux increase by a factor of ∼2 with a spectral hardening, compared to a factor of ∼2 of the X-ray flux increase. A steeper X-ray spectrum during the flares can be explained by the fact that the X-ray component is due to a synchrotron high-energy tail unlike the SSC low-energy tail in the normal state.
Another possibility is that the X-ray flare comes from the disk/corona when the GeV gamma-ray emitting jet emerged. Radio galaxy 3C 120 shows radio knot ejection events after the dimming in the X-ray band (Chatterjee et al. 2009), and they suggested that the inner material of the disk/corona suddenly goes into the central black hole and generates a new jet. In fact, X-ray emission of 3C 120 has been reported to be dominated by the disk/corona emission (Kataoka et al. 2011; Fukazawa et al. 2015; Tanaka et al. 2015). Coincident brightening between X-ray and GeV gamma-ray for NGC 1275 flares cannot be explained by this scenario, thus the jet origin of the X-ray flares is likely.
If so, a spectral steepening of X-ray and gamma-ray emission can be explained by a higher magnetic field in the flaring region. The synchrotron emission in the steady state does not reach the X-ray band (Abdo et al. 2009), and a stronger magnetic field could move the synchrotron cutoff to higher energy. However, the X-ray spectrum during the flare is not so steep and thus the synchrotron cutoff seems to exist in a higher energy band than the Swift/XRT band. Therefore, in addition to the higher magnetic field, a higher maximum electron energy is needed. If the maximum electron energy increases by a factor of 10 in the flare, the synchrotron emission reaches the X-ray band, as seen in Figure 6 top (red dashed line). Shock-in-jet model can produce such a parameter change. If the flare is induced by the shock, the steep electron spectral index of 3.1 is not likely. Therefore, we calculate the SSC model by assuming a single power-law index of 2.0 and show the model curve in Figure 6 bottom (black dashed). Other parameters are summarized in Table 3. In this case, the X-ray flare is almost dominated by the flaring synchrotron component, while the hard gamma-ray emission includes both a steady soft and a flaring hard SSC component.
In conclusion, we studied the short and long-term variability of the X-ray emission of NGC 1275 with Suzaku/XIS and Swift/XRT data, together with the GeV gamma-ray variability observed in Fermi/LAT data. We found correlated long-term variability between X-ray and GeV gamma-ray flux, suggesting a jet contribution to the X-ray band. The long-term variability could be attributed to the change of emission region, such as radio C3 activity. Swift/XRT showed X-ray increases with a timescale of several days, simultaneous with GeV gamma-ray flux increase. The SED during these flares can be explained by the injection of fresh electrons accelerated by a shock in the jet.
The authors thank the Suzaku, Swift, and Fermi teams for the operation, calibration, and data processing. Y.F. was supported by JSPS KAKENHI grant Nos. 2400000401 and 2424401400. The authors also thank the anonymous referee for helpful comments.
The Fermi LAT Collaboration acknowledges generous ongoing support from a number of agencies and institutes that have supported both the development and the operation of the LAT as well as scientific data analysis. These include NASA and the Department of Energy in the United States, the Commissariat à l'Energie Atomique and the Centre National de la Recherche Scientifique/Institut National de Physique Nucléaire et de Physique des Particules in France, the Agenzia Spaziale Italiana and the Istituto Nazionale di Fisica Nucleare in Italy, the Ministry of Education, Culture, Sports, Science and Technology (MEXT), High Energy Accelerator Research Organization (KEK) and Japan Aerospace Exploration Agency (JAXA) in Japan, and the K. A. Wallenberg Foundation, the Swedish Research Council and the Swedish National Space Board in Sweden.
Additional support for science analysis during the operations phase is gratefully acknowledged from the Istituto Nazionale di Astrofisica in Italy and the Centre National d'Études Spatiales in France. This work was performed in part under DOE Contract DE- AC02-76SF00515.
Footnotes
- 11
Parameters depend on the spectral model used for each background source. Photon index and normalization for power-law model; N0, α, β, E0 for LogParabola model
 N0, γ1, γ2, E0, Ec for PLSuperExpCutoff model . (https://fermi.gsfc.nasa.gov/ssc/data/analysis/scitools/source_models.html).