


Abstract
The Carnegie–Chicago Hubble Program (CCHP) seeks to anchor the distance scale of Type Ia supernovae via the Tip of the Red Giant Branch (TRGB) method. Based on deep Hubble Space Telescope ACS/WFC imaging, we present an analysis of the TRGB for the metal-poor halo of NGC 1365, a giant spiral galaxy in the Fornax cluster that was host to the Type Ia supernova SN 2012fr. We have measured the extinction-corrected TRGB magnitude of NGC 1365 to be F814W = 27.34 ± 0.03stat ± 0.04sys mag. In advance of future direct calibration by Gaia, we adopt a provisional I-band TRGB luminosity set at the Large Magellanic Cloud and find a true distance modulus μ0 = 31.29 ± 0.04stat ± 0.06sys mag or D = 18.1 ± 0.3stat ± 0.5sys Mpc. This measurement is in excellent agreement with recent Cepheid-based distances to NGC 1365 and reveals no significant difference in the distances derived from stars of Populations I and II for this galaxy. We revisit the error budget for the CCHP path to the Hubble constant based on the analysis presented here, i.e., that for one of the most distant Type Ia supernova hosts within our Program, and find that a 2.5% measurement is feasible with the current sample of galaxies and TRGB absolute calibration.
Export citation and abstract BibTeX RIS
1. Introduction
The growing difference in the value of H0 (by some accounts now ≳3σ) as determined by direct (the distance ladder; e.g., Freedman et al. 2012; Riess et al. 2016) and indirect methods (via modeling of the cosmic microwave background; e.g., Komatsu et al. 2011; Planck Collaboration et al. 2016) has motivated alternative efforts at calibration for a possible easing of the commonly framed "tension." With regard to direct routes to H0, i.e., via the distance ladder, understanding the impact of (possibly hidden) systematics of Cepheid-based distances is an on-going and necessary part of our program. Current uncertainties in the Cepheid distance scale include the metallicity dependence of the Leavitt law, the impact of crowding on measured magnitudes, and how best to quantify and remove the effects of interstellar extinction (see Beaton et al. 2016, Paper I; for an updated detailed discussion).
Some, but not all, of these uncertainties relate to the physical location of Cepheids as Population I (Pop I) stars within the dusty, crowded spiral arms of their parent galaxies. In light of these systematics affecting the Cepheid distance scale, the Carnegie–Chicago Hubble Program (CCHP; Freedman 2014) is developing a parallel path to H0 using Type Ia supernovae (SNe Ia) calibrated exclusively using Pop II stars, which have systematics that are largely independent of and decoupled from the Cepheids. By moving to a distance scale based on RR Lyrae (RRL) and tip of the red giant branch (TRGB) stars, the CCHP is bypassing the concerns associated with Cepheid-based distances, using these Pop II stars that inhabit the intrinsically low-surface-brightness, low-extinction, and low-metallicity halos of spiral, lenticular, and elliptical galaxies.
The SNe Ia zero-point is being established using the RRL stars to cross-calibrate the absolute magnitude of the TRGB in Local Group galaxies. TRGB distances are then being determined for galaxies beyond the Local Group that have been host to recent Type Ia supernova events. This provides the zero-point calibration of the SN Ia absolute magnitudes at maximum light; and that zero-point is then applied to a significantly larger sample of SNe Ia found at cosmologically significant distances. Those galaxies encompass the unperturbed Hubble flow, ultimately giving us a measurement of H0.
In the near future, the zero-point of the TRGB will be calibrated directly using the trigonometric parallaxes of Milky Way RGB stars as measured by Gaia, enabling a three-step route to H0. Since this path to H0 is completely independent of the traditional Cepheid-based distance scale that currently sets the SNe Ia zero-point, it has the potential to provide insight into the divide between the direct (astrophysical) and indirect (cosmological modeling) routes.
In Paper I, the motivations and full scope of the CCHP have been presented in detail. Taking into account current and projected calibrations of the Pop II distance scale, Paper I estimated that a 2.9% measurement of the Hubble constant was feasible at the conclusion of the CCHP assuming ∼0.1 mag precision of TRGB-based distance measurements in SNe Ia host galaxies. With direct calibration of the TRGB with Gaia, the precision in the Hubble constant is now expected to be 2.3% (still assuming a 0.1 mag precision for the TRGB-based distances). This uncertainty on H0 is competitive with the uncertainty on the most recent value from the Cepheid-based route (2.4%; Riess et al. 2016), despite our having a smaller number of calibrating SNe Ia host galaxies at this juncture.
In Hatt et al. (2017, Paper II), the methods for image processing, photometry, and measuring the TRGB for CCHP targets are described in detail, and are applied to the nearby and isolated dwarf galaxy IC 1613. Due to its low surface brightness, low line-of-sight extinction, and relative proximity, IC 1613 represents an ideal case for the first application of the tools being used in the CCHP. In that study, both the TRGB and RRL stars were independently used to measure distances to the galaxy, each to a precision of ∼3%. Notably, the primary source of uncertainty for either measurement was the absolute calibration, which will soon be dramatically improved with the upcoming Gaia data releases.
In this study, we apply the TRGB methodology of Paper II to NGC 1365, one of the most distant SNe Ia host galaxies in the CCHP sample. NGC 1365 is the brightest spiral galaxy in the Fornax cluster and it already holds historical importance in setting the extragalactic distance scale. In particular, Cepheids were discovered in this galaxy by Silbermann et al. (1999) and Madore et al. (1999) as part of the Hubble Space Telescope (HST) H0 Key Project. The distance to NGC 1365 derived by the Key Project was subsequently adopted for the Fornax cluster as a whole and for all of its members, whereby it was possible to calibrate the Fundamental Plane method and the Tully–Fisher relation (Madore et al. 1998; Freedman et al. 2001) for more distant applications.
In 2012, NGC 1365 became even more important for the extragalactic distance scale with the explosion of a Type Ia supernova event in it. SN 2012fr (Klotz & Conseil 2012) was discovered and classified sufficiently early that it received extensive follow-up, with 594 photometric and 144 spectroscopic data points included in the Open Supernova Database7 (Guillochon et al. 2017). It was also extensively monitored in the optical and near-infrared by the Carnegie Supernova Project (CSP), with a detailed analysis of SN 2012fr to be presented by C. Contreras et al. 2017, in preparation. An accurate and precise distance to NGC 1365 has been and continues to be a key point in the calibration of the extragalactic distance scale.
The structure of this paper is as follows. Section 2 details the observations and data processing. In Section 3, we describe the measurement of the TRGB, estimate its uncertainties, and determine the distance to NGC 1365 by adopting a provisional TRGB zero-point, pending a reassessment using Gaia parallaxes. In Section 4, we compare our current TRGB distance to those derived from Cepheids, and discuss the implications of our measurement in the context of the goals of the CCHP. Lastly, Section 5 summarizes the primary results of this work. We also provide detailed comparisons of the methods used in this paper to similar works in the appendix.
2. Data
The image processing and photometry presented here were performed identically to the analysis in Paper II, which we summarize below.
2.1. Observations and Image Preparation
We obtained optical imaging over 16 orbits on 2014 September 17, 21, and 25 using the ACS/WFC instrument aboard HST (PID:GO13691, PI: Freedman; Freedman 2014). Six and ten orbits were used for the F606W and F814W filters, respectively. Pointings were centered on  and
and  , which is 5
 0 southeast of the center of NGC 1365. The field was selected to be safely in the stellar halo of NGC 1365, and care was taken to place the pointing sufficiently far from the spiral arm by inspection of WISE and GALEX imaging.
Individual exposures were approximately 1200 s each, yielding total exposure times of 14,676 and 24,396 s for the F606W and F814W filters, respectively. The exposure times were designed to obtain a signal-to-noise ratio (S/N) of 10 in F814W at the anticipated apparent magnitude of the TRGB, as predicted using previous distance estimates to NGC 1365 (Freedman et al. 2001; Riess et al. 2016). The F606W S/N is lower (typically by a factor of 3), but since the color is intended to serve only as a means of isolating the TRGB by removing RGB contaminants, the lower precision in the color does not directly affect the I-band TRGB measurement itself. This observation strategy was designed to provide reliable photometry reaching at least one magnitude below the anticipated TRGB, thereby meeting the sampling requirements for a robust TRGB identification as defined in Madore et al. (2009). A summary of the observations, split into the three HST visits, is given in Table 1.
Table 1. Summary of ACS/WFC Observations for NGC 1365
| Dates | Filter | No. obs | R.A. (2000) | Decl. (2000) | Field Size | Exposure Time (s) |
|---|---|---|---|---|---|---|
| 2014 Sep 17 | F606W | 12 |

|
−36°12'05 0 0 |
337 × 337 |
∼1200 |
| 2014 Sep 21 | F814W | 10 |

|
−36°12'050 |
337 × 337 |
∼1200 |
| 2014 Sep 25 | F814W | 10 |

|
−36°12'050 |
337 × 337 |
∼1200 |
Note. See also Figure 1 for the coverage of the imaging.
Download table as: ASCIITypeset image
Figure 1(a) shows the ACS/WFC pointing relative to the galaxy using a wide-area (10' × 12') J-band image from the FourStar near-infrared imager on the Magellan–Baade telescope (for a description of the instrument see Persson et al. 2013) taken as part of the CSP follow-up campaign for SN 2012fr (C. Contreras et al. 2017, in preparation). Figure 1(b) is a gray-scale map of the ACS/WFC observations based on a "drizzled" co-add, and Figure 1(c) is a 10'' × 10'' region of the ACS/WFC image. Here we circle point sources that have magnitudes and colors of RGB stars. This clearly illustrates that the RGB stars in our halo pointing are well isolated from neighboring sources.
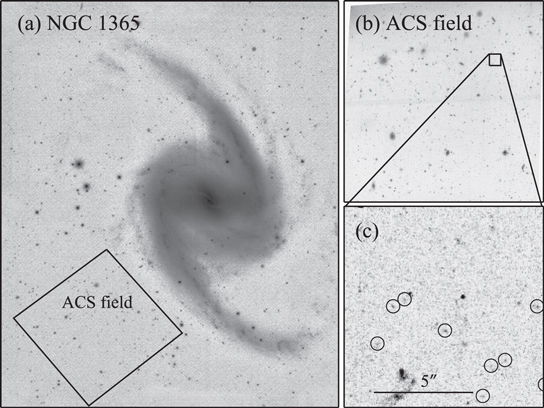
Figure 1. (a) Location of the HST ACS/WFC field overlaid on a grayscale map of 10' × 12' J-band image (C. Contreras et al. 2017, in preparation) to show its position relative to the spiral arms of NGC 1365. (b) An ACS/WFC F814W image of the CCHP NGC 1365 field generated with DrizzlePac software. (c) A 10'' × 10'' section of the ACS/WFC field. Circles enclose point sources that lie in the anticipated color–magnitude region of the RGB.
Download figure:
Standard image High-resolution imageIndividual ACS/WFC images used were of the FLC data type, which are calibrated, flat-fielded, and CTE-corrected in the Space Telescope Science Institute (STScI) CALACS pipeline. The non-uniform pixel area due to ACS/WFC geometric distortions was corrected using the STScI-provided Pixel Area Maps.8 All further analysis is conducted on these pixel-area-corrected FLC frames.
2.2. Photometry
Instrumental magnitudes were derived for individual FLC images via point-spread function (PSF) fitting in the software DAOPHOT (Stetson 1987). We generated stellar grids on the ACS footprint using the synthetic HST PSF Tiny Tim (Krist et al. 2011) and then constructed a PSF model for each filter with DAOPHOT. A direct test of the Tiny Tim PSFs against direct frame-by-frame PSF modeling with isolated, bright stars is described in Paper II and was found to agree within the photometric uncertainties. Images were aligned using the routines DAOMATCH and DAOMASTER (Stetson 1987). A master star list was created from a co-add of all images to perform photometry simultaneously using ALLFRAME (Stetson 1994).
2.3. Calibration of HST Photometry
We transformed the instrumental magnitudes to the ACS Vega magnitudes following Equations (2) and (4) of Sirianni et al. (2005). A correction from the PSF magnitudes to the 05 aperture magnitudes for each CCD chip was determined by comparing the curve of growth generated from aperture magnitudes to the PSF magnitude (also measured at a 05 radius). We find aperture corrections of −0.065 mag (chip 1) and −0.063 mag (chip 2) for F814W and −0.023 mag (chip 1) and −0.018 mag (chip 2) for F606W. The statistical uncertainty (the error on the mean) for the aperture corrections is <0.01 mag. However, we found that independent efforts in the selection of bright, isolated stars resulted in differences at the level of ∼0.01 mag. We therefore adopt a systematic uncertainty of 0.01 mag in the photometric calibration due to the aperture correction at 05.
The values of 05 to infinite aperture correction are 0.095 mag for F606W and 0.098 mag for F814W (Bohlin 2016). Bohlin (2016) describes a ∼4% uncertainty in encircled energy (EE) for cool, late-type stars that are used to compute the 05 to infinite aperture correction. Table 6 of Sirianni et al. (2005), however, shows that the total variation in EE due to changes in effective wavelength via spectral type is <0.01 mag for WFC at 05, implying that the EEs for these cooler stars are consistent with hotter stars that are constrained at the level of 1%. We therefore adopt half of the estimate of Bohlin (2016), or 2% error in flux (0.02 mag) as another systematic uncertainty due to the scatter in measured EE for the RGB stars that are the focus of this work.
We used photometric zero-point values of 26.412 mag for F606W and 25.524 mag for F814W, which were provided for a given observation date by the online STScI ACS Zero-points Calculator.9 There is a systematic uncertainty in the observed flux of Vega, which forms the basis of the ACS zero-point calculation. As per Sirianni et al. (2005), we adopt a conservative systematic uncertainty of 0.02 mag for the zero-points.
Mean magnitudes for each filter were computed from the individual frame intensities with a median-based σ-clip algorithm, setting the clip at 3σ. We also use the image-quality parameter "sharpness" to remove non-stellar sources. The selection criteria we used are sharpnessF814W < 0.1 exp(F814W – 23.5) and sharpnesssF814W ≥ −0.4, which, from visual inspection of the objects in the images, adequately removes obvious extended sources and cosmic rays.
2.4. Color–Magnitude Diagram (CMD)
The calibrated CMD is shown in Figure 2. A dramatic change in the source density in the range 27.3 ≲ F814W ≲ 27.4 mag corresponds to the TRGB, which is marked by an arrow but is also visible by eye. Stars brighter than the TRGB are likely either thermally pulsing asymptotic giant branch (TP-AGB) stars or blended RGB stars. The blue shaded region highlights the approximate color–magnitude space of the RGB stars. The slope (−6 mag/color) and the colors of edges of the shaded region (=1.0 and 1.5 at the anticipated TRGB level) have been determined from the investigation of stellar isochrones for old (12 Gyr age) and metal-poor ([Fe/H] ≤ −0.9) RGB stars provided by the Dartmouth group (Dotter et al. 2008).
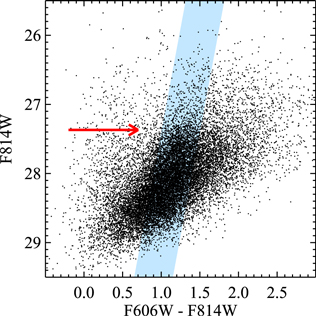
Figure 2. CMD of resolved stars in the HST/ACS field of NGC 1365. The red arrow marks the approximate position of the TRGB and the blue shaded region indicates the color range adopted for the locus of the red giant branch.
Download figure:
Standard image High-resolution imageTo quantify the completeness of our photometry, we performed extensive artificial star tests spanning a wide range in the color–magnitude space. We input 2000 stars with pixel coordinates randomly sampled from a uniform distribution. Their input F814W magnitudes are randomly sampled from the range 20 ≤ F814W ≤ 29 mag, and colors were sampled from 1.0 ≤ F606W – F814W ≤ 1.5 in order to approximate the range of likely TRGB stars as seen in the blue shaded region of Figure 2. This process was repeated 100 times, producing 200,000 artificial stars.
We performed photometry on these new images identically to the original frames. The results of the tests are shown in Figure 3. Figure 3(a) shows the completeness of the artificial stars as a function of F814W magnitude, split into two color regions:
We find that the completeness of the photometry remains constant up to the anticipated TRGB magnitude. The completeness curves in Figure 3 are an average over all physical coordinates, and the only deviation from the average is in the upper 10% of CCD 1 (closest to NGC 1365), where the completeness falls to ∼75% from ≳90%. In general 100% completeness is unobtainable due to, for example, source blending with background galaxies and bright foreground stars, and the incompleteness of observations at the edges of the imaging dither pattern.

Figure 3. The completeness and accuracy of the photometric catalogs of NGC 1365. (a) Recovery rate vs. F814W magnitude for  (solid) and
  mag (dashed). A vertical shaded region indicates the TRGB level of NGC 1365. (b) Difference between input and output F814W magnitudes (input minus output) vs. input F814W magnitude. Circles with error bars represent mean values and their standard deviations. (c) Same as in (b) but for the F606W – F814W color.
Download figure:
Standard image High-resolution imageOne concern for the TRGB analysis is the potential blending of stars fainter than the anticipated TRGB, which could obscure the location of the tip. By sub-sampling the artificial star luminosity function (ASLF) from the uniform distribution to one that follows the commonly adopted slope of the RGB luminosity function (LF), e.g., 0.3 dex mag−1 (Méndez et al. 2002), and by limiting the number of stars found to that within a magnitude of the anticipated TRGB (∼10,000), we find that <1% of measured stars fainter than the anticipated TRGB magnitude exceed their input magnitudes by greater than 3σ, suggesting that negligibly few stars should systematically obscure the TRGB.
In Figures 3(b) and (c), the recovered photometry is compared to the input photometry for the entire sample of simulated stars for F814W and F606W – F814W, respectively. We find that the recovered photometry in F814W is in agreement to within the uncertainties to roughly ∼1 magnitude fainter than the anticipated TRGB magnitude. This result suggests that crowding (which would alter sky values and hence the final measured magnitudes) is not a significant concern.
We observe that the uncertainty in color grows much more quickly due to the lower S/N of the F606W imaging, though, as is discussed later, the color–magnitude behavior of the TRGB has little to no impact on its measurement for our data set because we preferentially target metal-poor stars in the halo of NGC 1365. In the next section, we make our measurement of the TRGB and estimate its associated uncertainties.
3. The Tip of the Red Giant Branch
The TRGB is a discontinuity in the RGB LF caused by the sudden lifting of degeneracy in the He-burning cores of low-mass RGB stars (theoretical overviews of RGB evolution can be found in Iben & Renzini 1984; Salaris & Cassisi 1997; Serenelli et al. 2017). The sequence of stars ascending the RGB is thus truncated at this magnitude as they rapidly evolve onto the Horizontal Branch or Red Clump. As first shown empirically using a sample of nearby galaxies by Lee et al. (1993), the TRGB is well delineated and effectively flat for metal-poor populations in the I-band (equivalent to the F814W filter in the HST flight magnitude system).
The algorithmic approach to measuring the TRGB has been refined and expanded since its initial implementation in Lee et al. (1993). An overview of several of the more recent techniques is given in Paper II. In general, measuring the magnitude of the TRGB relies on locating the point of greatest change in the RGB LF. The transition from AGB stars into the RGB sequence can be described as a (slightly blurred) step function. Tools like the first-derivative kernel [−1, 0, +1] from finite-difference methods are suitable for locating the point of greatest change provided that the LF is placed into binned form. Since the bin size places a lower bound on precision for the TRGB measurement, i.e., an uncertainty at least as large at the bin size itself, we finely bin our RGB LF in F814W using steps of 0.01 mag.
To control the noise in the finely binned LF, we apply GLOESS (Gaussian-windowed, locally weighted scatterplot smoothing), which is a data-smoothing technique first introduced in an astrophysical context by Persson et al. (2004) for Cepheid light curves and described in more detail in Monson et al. (2017) in their study of RR Lyrae light curves. The technique uses a smoothing window around a reference point in the input discrete function and applies a Gaussian weighting function based on the distance to neighboring data points. The only free parameter is then the characteristic width of the weighting function,  . This smoothed LF is then convolved with the [−1, 0, +1] edge detection kernel, and the point of greatest response corresponds to the location of the TRGB.
As discussed in Paper II, there are practical considerations for application of this technique that must be statistically modeled for a given data set. The primary concern is the selection of the optimal value for  , which they define as the value for which the combination of the statistical and systematic uncertainties associated with the TRGB edge detection is minimized. Paper II further describes a procedure using artificial star tests to empirically derive the associated uncertainties and hence
  . We describe this approach further, as applied to NGC 1365 in Section 3.1. We measure the TRGB of NGC 1365 in Section 3.2 and determine our final distance in Section 3.3.
3.1. Optimizing the TRGB Detection
In order to make an optimal measurement of the TRGB, we seek the level of smoothing in the LF that most reduces the associated statistical and systematic errors. Sections 3.1.1 and 3.1.2 below describe the creation of an ASLF as well as simulations of TRGB measurements in order to model the properties of our GLOESS smoothing function and the [−1, 0, +1] edge detection kernel.
3.1.1. Artificial Star LFs
We conservatively assumed that the RGB LF has a relative count of stars four times greater than the AGB LF within 0.1 mag of the TRGB, which is the upper range that has recently been observed in nearby galaxies (Rosenfield et al. 2014). We assumed that the LF for the RGB has a slope of 0.3 dex mag−1, which has been confirmed empirically in several TRGB studies (see, e.g., Méndez et al. 2002; Makarov et al. 2006; Conn et al. 2012). To account for the possible contamination of the TRGB by TP-AGB stars, we further assumed an AGB component to the ASLF with a slope of 0.1 dex mag−1. This slope is an intermediate value between commonly adopted flat LFs (Durrell et al. 2002; McConnachie et al. 2004) and steeper (though uncertain) direct estimates (see, e.g., Makarov et al. 2006). Since we have found little evidence of blending/crowding from the artificial star tests described in Section 2.4, the small magnitude range that is relevant for the TRGB analysis (ΔF814W ∼ 0.1 mag) suggests that these slopes are largely symbolic to produce more realistic simulations.
The RGB component of our ASLF begins at the estimated tip magnitude F814W = 27.37 in the ACS Vega system (determined retroactively from an initial assessment of the TRGB), and it extends to F814W = 28.37 mag. The AGB component begins 1 mag brighter than the tip magnitude and extends to the same depth as the RGB. As discussed above, we normalize the AGB LF relative to the RGB LF such that it comprises one-fifth of the total stars within ±0.1 mag of the TRGB. We assign a central color of F814W − F606W = 1.25 for each component of the ASLF and sample uniformly in color for individual stars such that the RGB spans 1.0 ≤ F606W – F814W ≤ 1.5.
Two thousand stars were sampled at random from this ASLF distribution and placed into each individual FLC frame at pixel coordinates uniformly distributed in X and Y. These stars were manually added to the "master list" of sources and the ALLFRAME photometry was performed as previously described. The artificial star process was repeated 250 times for CCD 1, which comprises ∼80% of stars belonging to NGC 1365. In a separate test, we observed that there was no difference in the quality of artificial star photometry between CCDs, and we therefore focused on the more populated CCD 1.
These simulations produced a total of 500,000 artificial RGB stars, for which ∼445,000 stars were successfully measured for ∼88% completeness over the RGB magnitude range. Figure 4(a) shows the input and output ASLFs as blue and yellow histograms, respectively. While the input ASLF has a hard bright edge to represent the TRGB, the output ASLF demonstrates the broadening of the TRGB edge due to measurement uncertainties and the increasing incompleteness as a function of magnitude. In black, we display a scaled LF of the observed data set to show the good agreement in the relative number of AGB and RGB stars around the TRGB.
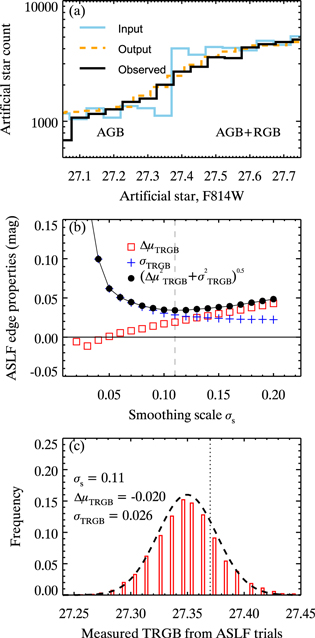
Figure 4. Results from artificial star tests. (a) The input (blue, solid) and recovered (yellow, dashed) artificial luminosity functions, and the observed luminosity function (black, solid), which is scaled to match the artificial star counts), in 0.05 mag bins. (b) Displacement of the input TRGB ( , open red squares), the dispersion in measured TRGB (
 , blue plus symbols), and the quadrature sum of these values (black filled circles). The systematic and random (statistical) uncertainties in our edge detection are represented by
  and
and  , respectively. The optimal
  yields minimum total uncertainty and is marked by a vertical dashed line. (c) Distribution of maximal Sobel kernel responses for our 10,000 realizations of the ASLF for the optimal smoothing scale of
  mag (red histogram with bin sizes of 0.01 mag) with the Gaussian model of the distribution overplotted (dashed line). A vertical dashed line marks the input TRGB magnitude.
Download figure:
Standard image High-resolution image3.1.2. Simulating TRGB Edge Detections
Using subsets of the artificial stars described in the previous subsection, we now estimate the statistical and systematic errors that are associated with varying the degree of smoothing using GLOESS, and our [−1, 0, +1] edge detection kernel for measuring the TRGB.
We sub-sample the full ASLF to mimic the LF distribution of stars in our field. There are ∼10,000 stars within ±1 mag of the TRGB within its color–magnitude range (e.g., the blue shaded region of Figure 2), but ∼80% of these stars are located on just one of the two ACS chips (CCD 1; the upper half of Figure 1(b)). We model the relative surface density of these stars across the ACS field of view using an exponential function in the Y-axis perpendicular to the closest arm of NGC 1365 (the upper left of Figure 1(b)). Using this model, we sample 8000 artificial stars from CCD 1. We also sample an additional 2000 sources from a uniform distribution in both X and Y from CCD 1 to model the contribution from CCD 2 (the lower half of Figure 1(b)). We construct an LF using 0.01 mag bins and apply GLOESS with a set value for  . We run the Sobel kernel on the smoothed LF and we select the bin of greatest response as the TRGB. We repeat this process 10,000 times each for 0.01 <
  < 0.20 mag in 0.01 mag increments.
We next use the distribution of TRGB measurements to estimate the intrinsic uncertainties of the GLOESS smoothing and Sobel kernel. The displacement of the detected edge,  , for a given
  is defined as the mean offset from the TRGB edge and serves as an estimate of the systematic uncertainty for a given
  . The dispersion of estimates,
  , is the ±1σ standard deviation of all realizations and serves as our estimate of the random (statistical) uncertainty.
Figure 4(b) gives the results for all  . At
. At  ≈ 0.11 mag the combined error (the quadrature sum of
  and
and  ) is minimized and this represents the "optimal" smoothing scale (e.g., the scale that yields the smallest total uncertainty). Figure 4(c) shows the distribution of measured TRGB value for this
  . We adopt 0.02 mag and 0.03 mag as the systematic and random uncertainties based on the Gaussian fit shown in Figure 4(c).
The random uncertainty in the tip detection for the LF of NGC 1365 is similar to that measured in Paper II for the much closer dwarf galaxy, IC 1613. The average photometric precision at the TRGB in IC 1613 was ∼0.02 mag whereas for NGC 1365 it is ∼0.1 mag, and if the uncertainties were based solely on the photometric errors for its TRGB stars, one might expect that the TRGB measurement for NGC 1365 would have larger uncertainties. The TRGB measurement, however, is based on a population of stars, and the number of stars defining TRGB also plays a large role in its detectability: the greater the sample of stars contributing to the tip, the more readily it is detected even if the TRGB itself is not sharply defined. For the RGB of NGC 1365 in this study, it is over three times more populated than IC 1613, which therefore helps reduce the overall uncertainty in the TRGB measurement presented here.
3.2. Measurement of the TRGB
Figure 5(a) presents the final CMD used to determine the distance to NGC 1365. We first consider a color–magnitude restriction, described in the previous sections and displayed as the shaded region, that isolates the RGB. We note that these limits coincide with the color range over which the absolute magnitude of the TRGB is known to be flat with color (Lee et al. 1993; Jang & Lee 2017b), within the present uncertainties on that determination. Moreover, we note that our highlighted data are also consistent with no trend in color to within our measurement uncertainties. We therefore do not modify the CMD data in any way for the TRGB measurement (see Section 4.1.2 below for a discussion of this point). Figure 5(b) is the resulting LF for stars in the blue shaded region after smoothing using the GLOESS algorithm and our optimized scaling parameter,  mag, as determined in the previous section. Figure 5(c) is the result of applying the [−1, 0, +1] Sobel kernel to the LF, which shows a strong peak at 27.37 mag (indicated by the dashed lines in Figures 5(a) and (b)).

Figure 5. Detection of the TRGB edge NGC 1365. (a) Final CMD of sources in NGC 1365. The blue shaded region indicates a sample parameter space that encompasses the bulk of the RGB. As discussed in the text, however, color–magnitude selections have an impact at the level of only 0.01 mag in the measurement of the TRGB. (b) GLOESS-smoothed luminosity function in the F814W band using the optimal smoothing parameter determined via ASLF simulations. (c) Edge response of the [−1, 0, +1] kernel with S/N weighting. We find a peak response at F814W = 27.37 mag, which is indicated in panels (b) and (c) by the dashed line.
Download figure:
Standard image High-resolution imageWe next consider the TRGB measurement without the color–magnitude restriction. As with the study of IC 1613 in Paper II, we find that the inclusion of all stars within the CMD displaces the TRGB by at most a negligible ∼0.01 mag from the case of a restricted color region. Since the restricted color–magnitude region has stars (with better constrained average colors), it is no surprise that the measured TRGB magnitude is roughly unchanged because most stars fall within the blue shading. In terms of simulating the TRGB detection for the full CMD sample, the systematic error remains unchanged while the statistical error decreases by ∼0.01 mag given the larger sample of stars used to define the TRGB.
Based on the simulations in the previous subsection, we assign a statistical uncertainty of 0.03 mag and a systematic uncertainty of 0.04 mag. Incorporating the estimated systematic uncertainties from the HST photometric calibration, our TRGB determination is F814W = 27.37 ± 0.03stat ± 0.04sys mag before correcting for line-of-sight reddening.
3.3. TRGB Reddening and Distance
The Milky Way foreground extinction is estimated to be small: 0.051 mag for F606W and 0.031 mag for F814W, or E(F606W – F814W) = 0.020 mag (Schlafly & Finkbeiner 2011, retrieved from NED, the NASA/IPAC Extragalactic Database). Applying the foreground estimates to our TRGB measurement from the previous subsection, we find an extinction-corrected TRGB magnitude of F814W = 27.34 mag. Since the uncertainty in the color excess ( via Schlegel et al. 1998) is comparable to the estimated level of reddening, we adopt half of the reddening as an additional systematic uncertainty.
Reddening internal to NGC 1365 itself is an unknown, though the halo observations ensure that it is minimized relative to the disk of the galaxy. To test for the presence of halo dust within our observations, we looked for differential reddening in the measurement of the TRGB in four regions of equal star count that represent concentric annuli from NGC 1365. The measured TRGB values from each of these distinct regions are F814W = 27.44, 27.33, 27.39, and 27.40 mag in order from the inner to outer regions. The average of these TRGB measurements is 27.39 ± 0.04 mag, where the uncertainty is taken to be the standard error on the mean. The TRGB magnitudes do not show a clear gradient as a function of galactocentric radius, and the average TRGB measurement is in good agreement with the TRGB value from the full CMD sample.
Because the four regions are reduced to ∼25% of the population count from the observed data, we performed an additional test in which we divided the total imaging into only two regions to make use of a larger sample of stars. In these two regions, we measured TRGB values of F814W = 27.42 mag and 27.39 mag for the regions closest to and furthest from NGC 1365, respectively. The difference between these two measured TRGB values is consistent with the uncertainty in the measurement of the TRGB itself using the full data set. From the results above, we conclude that there is insufficient evidence for systematic halo dust within the uncertainties of the current set of observations. Nonetheless, we do note that the faintest TRGB measurement is in the region closest to NGC 1365 for both experiments. Any individual galaxy within the CCHP sample may not have adequate population statistics to assess the level of internal reddening, though the results across several galaxies will be enlightening in determining the existence of halo dust.
Currently, the absolute magnitude of the TRGB in the optical has no direct calibration from trigonometric parallaxes, although Gaia will be providing these measurements in the near future. In the interim, we have chosen to adopt an absolute magnitude for the TRGB for the CCHP. Justification for this adopted value is presented in a forthcoming analysis of the main body of the Large Magellanic Cloud (LMC) and is anchored to direct distance determination to detached eclipsing binaries in the bar of the LMC. Our adopted zero-point is  mag (T. J. Hoyt et al. 2017, in preparation). The adoption of a provisional zero-point is a strategy similar to that employed in the mid-stages of the Key Project for the purpose of internal consistency. This provisional calibration is also consistent to within ±1σ with the canonical TRGB calibration based on globular clusters,
  mag, and is consistent with other calibration efforts (e.g., Rizzi et al. 2007; Jang & Lee 2017b, among others). We note that Jang & Lee (2017b) find
  mag in the LMC using a similar TRGB measurement process to that adopted in this paper (e.g., spanning a similar color range).
Applying this provisional zero-point to our TRGB apparent magnitude, we find a true distance modulus to NGC 1365 of μ0 = 31.29 ± 0.04stat ± 0.06sys mag, or a distance of D = 18.1 ± 0.3stat ± 0.5sys Mpc. Table 2 summarizes the values for the TRGB magnitude, the distance modulus, its uncertainties, and the adopted reddening.
Table 2. TRGB Distance and Error Budget
| Parameter | Value |

|

|
|---|---|---|---|
| TRGB F814W magnitude | 27.37 | 0.03 | 0.04 |

|
0.03 | ⋯ | 0.02a |
Provisional 
|
−3.95 | 0.03 | 0.05 |
| True distance modulus (mag) | 31.29 | 0.04 | 0.06 |
| Distance (Mpc) | 18.1 | 0.3 | 0.5 |
Note.
aTaken to be half of .
.
Download table as: ASCIITypeset image
4. Discussion
In this section we provide context for our TRGB measurement with regard to existing Cepheid-based distances and the goals of the CCHP. First, we compare the CCHP methods to recent TRGB studies at a similar distance to NGC 1365 in Section 4.1. Next, we compare the CCHP TRGB distance to those determined by Cepheids in Section 4.2. Lastly, in Section 4.3 we discuss how the results of this study impact the goals of the CCHP.
4.1. Comparison to Other TRGB Studies
The objective of the CCHP is to obtain a high-fidelity measurement of the Hubble constant, minimizing systematics by observing and applying a homogeneous analysis of the TRGB in galaxies spanning 10 magnitudes in distance modulus (see Paper I, Table 5 for a summary of the TRGB targets). We have developed a data-reduction strategy that can be applied to galaxies spanning this wide range in distance. As a result, the data processing, treatment of the sloped TRGB, and edge detection strategies differ from similar studies using the TRGB at these distances. In the subsections to follow, we compare our methods to those used in other studies.
4.1.1. Data Processing
Previous studies using the TRGB method at the distance of NGC 1365 (e.g., Durrell et al. 2002; Caldwell 2006; Aloisi et al. 2007; Bird et al. 2010; Jang & Lee 2017a, 2017b) have utilized stacked images, from which photometry is derived using PSF fitting to bright stellar sources in the image. These stacks provide image products that can be optimized in resolution and provide higher S/N than analyses performed on individual frames, but come at the cost of producing image products that vary based on the observing strategy employed.
We provide a detailed comparison to photometry derived identically to Jang & Lee (2017a) in Appendix A.1. We find our photometry to be statistically identical over the magnitude range of interest. Moreover, the same TRGB magnitude is obtained within the statistical uncertainties. Thus, we find no bias due to our reduction strategy.
4.1.2. Rectification of the TRGB Slope
Recent studies applying the TRGB method at a similar distance to NGC 1365 (e.g., Jang & Lee 2017a, 2017b) have explored the use of a technique that extends the fitting to higher-metallicity/redder stars (for which the optical tip magnitudes are fainter as a function of metallicity/color). The extension, in principle, gives better number statistics at the tip. The method involves a renormalization of the tip-star magnitudes as a function of color that effectively places them all at a fixed absolute magnitude, chosen to correspond to the low-metallicty solution. The form of the rectification is either linear (Rizzi et al. 2007; Madore et al. 2009) or quadratic (Jang & Lee 2017b) with color. Because the CCHP program has specifically designed pointings to target the metal-poor halos of galaxies, and given that the S/N in our observed F606W is significantly less than that in the F814W images, we have chosen not to rectify the F814W magnitudes. We do, however, provide a detailed comparison to the application of these methods, and to the body of work summarized in Jang & Lee (2017a), in Appendix A.2. To within the uncertainties, we find that the results using the rectified magnitudes are the same as with our unrectified magnitudes; we find no bias introduced in our choice to limit the color range used in our LF.
4.1.3. Edge Detectors
We have followed a simple edge detection methodology for the TRGB in this work, modeled after Paper II, for the ease of estimating the uncertainties associated with our measurement as well as avoiding previous algorithmic complications such as binning and oversmoothing data. As with Paper II, we compare results using several of the different approaches in Appendix A.3. We find that there is good agreement with the TRGB measurement presented in this study.
4.2. Comparison to Cepheid Distances
Previously published estimates of the distance modulus to NGC 1365, based on Cepheids, a Type II supernova (SN 2001du), and the Tully–Fisher relation (NED-D), range from  to 32.09 mag, with mean and median values of 31.20 and 31.26 mag, respectively. Cepheids are the only fully independent measure of the distance to NGC 1365, and we therefore focus our distance comparison on them.
There are roughly 30 distance estimates for NGC 1365 based on Cepheids tabulated in NED up to late 2017. However, nearly all of these estimates are based on the same imaging data set that was obtained by the Hubble Key Project: 12 epochs of F555W and four epochs of F814W taken with the WFPC2 instrument (Silbermann et al. 1999; Freedman et al. 2001), with later works simply updating the calibration of the original study. These updated distance moduli show a large spread, ranging from  to 32.09 mag, resulting primarily from uncertainties in the color and metallicity dependence of the Cepheid period–luminosity (PL) relation. Because of this uncertainty and the systematic offsets introduced by comparing the results of consecutive publications differing only in zero-points, we have chosen the result of Freedman et al. (2001) to represent the results from this ensemble of publications. We have further considered a recent analysis by Riess et al. (2016), who analyze new near-IR photometry for a subset of the Cepheids originally discovered within the Key Project (Freedman et al. 2001).
Updating the final, metallicity-corrected Key Project Cepheid distance to reflect the updated LMC anchor distance of  gives
gives  mag. Riess et al. (2016) find
  mag using near-IR Cepheids and anchoring the zero-point of the PL relation to a number of different techniques in the Galaxy, the LMC, and NGC 4258.10
Figure 6 illustrates the consistency of the two independent Cepheid distances with the value derived in this study. The sample error on the mean is only 0.04 mag, and gives no indication of a significant difference in the distances derived from stars of Pop I and Pop II for NGC 1365 at this time. The weighted average of these results suggests a true distance modulus
mag using near-IR Cepheids and anchoring the zero-point of the PL relation to a number of different techniques in the Galaxy, the LMC, and NGC 4258.10
Figure 6 illustrates the consistency of the two independent Cepheid distances with the value derived in this study. The sample error on the mean is only 0.04 mag, and gives no indication of a significant difference in the distances derived from stars of Pop I and Pop II for NGC 1365 at this time. The weighted average of these results suggests a true distance modulus  mag, which is statistically indistinguishable from the TRGB measurement presented here based on the provisional TRGB luminosity in the LMC.

Figure 6. Comparison of Cepheid distances to NGC 1365 and the TRGB distance of this study. Error bars indicate the total uncertainty (combined statistical and systematic uncertainties). The vertical dashed line and dotted lines show the weighted average distance and ±1σ confidence intervals, respectively, or  mag. The plotted results show strong agreement between independent studies of NGC 1365, including between Pop I and Pop II indicators.
Download figure:
Standard image High-resolution image4.3. Evaluating the CCHP
4.3.1. Comparing the Distance Scales for Population I and Population II
One goal of the CCHP is to provide a test of the systematics of the Cepheid-based distance calibration for SNe Ia. In Paper II, we found consistency between the Pop I (Cepheids) and the Pop II (RRL and TRGB) based on distances to the Local Group dwarf irregular galaxy IC 1613. The Cepheids in IC 1613 represent a sample with low crowding, low metallicity (12 + log(O/H) = 7.90; Bresolin et al. 2007), and low internal reddening. Thus, in addition to being an ideal case for the TRGB, IC 1613 is also an ideal galaxy for application of the Leavitt law. At another extreme, NGC 1365 presents challenges for accurately measuring the photometric properties of Cepheids: there can be intense crowding in the high-surface-brightness spiral arms, NGC 1365 has solar or supersolar metallicity (8.33 < 12 + log(O/H) < 8.71; Bresolin et al. 2005), and the reddening within the disk of NGC 1365 is patchy, and significantly larger in the mean than that of the low-metallicty and relatively transparent disk of IC 1613. By way of contrast, we can now use the TRGB distance to NGC 1365 to provide an additional assessment of the impact of these effects on the Cepheid distance scale.
As discussed previously (Paper II), we find broad agreement between the Pop I and Pop II distance indicators for both the simple case of IC 1613 and the more complicated case of NGC 1365 studied here. The LMC has an intermediate metallicity (12 + log(O/H) = 8.26, estimated using identical techniques to those in NGC 1365 and IC 1613 by Berg et al. 2012). In the LMC, the Cepheid and (geometric) eclipsing binary distances agree to better than 1% (Freedman et al. 2012; Pietrzyński et al. 2013). This early agreement between Pop I and Pop II scales suggests that the oft-cited concerns regarding Cepheids of crowding, metallicity, and extinction cannot be fully responsible for the current impasse between direct and indirect paths to the Hubble constant. As already described in Paper I, over the course of the CCHP we will provide additional direct tests of Cepheids, RRL, and the TRGB in three Local Group galaxies (with RRL and TRGB methods alone being additionally tested in three other Local Group galaxies) and then further afield, making the comparison between Cepheid and TRGB distances in a total of five SNe Ia hosts that have both Pop I and Pop II measurements.
4.3.2. The TRGB Error Budget
In Paper I, we used literature studies to provide an estimate for the CCHP error budget. We adopted a TRGB measurement uncertainty of σ = 0.10 mag, which was justified as twice the uncertainty quoted by Rizzi et al. (2007) to account for increased magnitude uncertainties for our more distant objects and the uncertainty determined by Caldwell (2006) for a sample of dwarf galaxies in the Virgo cluster. To this we added in quadrature a term for the "blurring" of the TRGB due to multi-metallicity populations of ![${\sigma }_{[\mathrm{Fe}/{\rm{H}}]}=0.028$](https://content.cld.iop.org/journals/0004-637X/852/1/60/revision1/apjaa9d92ieqn45.gif) mag. With results from NGC 1365 and IC 1613 in hand, we can re-evaluate these estimates.
mag. With results from NGC 1365 and IC 1613 in hand, we can re-evaluate these estimates.
As shown by our comparison of rectified and unrectified TRGB magnitudes (Section 4.1.2), the metallicity term is likely unnecessary if our method is followed. Our total TRGB measurement uncertainty (Table 2) is ∼0.05 mag, a factor of two smaller than was conservatively assumed earlier in Paper I. This can be understood largely in the context of the increased sample size populating the TRGB, as was originally described by Madore & Freedman (1995). With ∼10,000 stars populating the LF within the 1 mag interval below the TRGB, we are able to measure the tip magnitude much more precisely than the sparsely sampled study of dwarf galaxies by Caldwell (2006) at a similar distance. Moreover, we obtain measurement uncertainties at the same level as Rizzi et al. (2007) for their more nearby objects. Given that we are able to cover a larger physical area in the halos of our more distant galaxies, this panoramic advantage compensates for and largely offsets the decrease in photometric precision.
If we assume that measurement uncertainties of 0.05 mag can be obtained for each of our nine SNe Ia host galaxies (all of which are no more distant than NGC 1365), then this is a factor of 2× reduction in the uncertainty (a factor of 4× decrease in the variance) in our initial error budget given in Paper I. The TRGB uncertainty is added in quadrature to the 0.120 mag intrinsic scatter of the SNe Ia (Folatelli et al. 2010), resulting in a total uncertainty for an individual measurement of the SNe Ia absolute magnitude of 0.130 mag, and an uncertainty of 0.038 mag (1.73%) for that term in the averaged zero-point for the 12 SNe Ia in our sample. Assuming no other changes to the CCHP error budget (the analyses of Paper II align with the predictions), a 2.5% measure of the Hubble constant using the RRL–TRGB hybrid path will be feasible, without yet taking into account Gaia parallaxes. With a direct calibration of the TRGB (i.e., skipping the RRL rung in the CCHP) the uncertainty in the Hubble constant is projected to approach the level of 2%. At that point, the dominant term in the error budget will remain the number of independently calibrated SNe Ia. Efforts to expand this sample, providing greater insight into the intrinsic scatter of SNe Ia, will provide the greatest impact on the final precision from this route to the Hubble constant.
5. Conclusion
As part of the CCHP, we have measured a TRGB distance to the galaxy NGC 1365 in the Fornax cluster, which is host to the Type Ia supernova, SN 2012fr. We have resolved the stellar component of the galaxy's old, metal-poor halo using photometry obtained from deep F606W and F814W images taken with the ACS/WFC instrument aboard HST. We have measured an extinction-corrected TRGB magnitude of F814W = 27.34 ± 0.03stat ± 0.04sys mag, corresponding to a true distance modulus of μ0 = 31.29 ± 0.04stat ± 0.06sys mag, or a physical distance of D = 18.1 ± 0.3stat ± 0.5sys Mpc (see Table 2).
We find that our TRGB distance to NGC 1365 is consistent with the existing, independent measurements using the Cepheid Leavitt law in the optical and near-infrared bands (Freedman et al. 2001; Riess et al. 2016). Taken together with similar agreement for IC 1613 in Paper II, we find good agreement between the Pop I and Pop II scales over a large span of Cepheid metallicity, crowding, and internal extinction.
This work was supported by the National Research Foundation of Korea (NRF) grant funded by the Korea Government (MSIP) (No. 2012R1A4A1028713). Support for program #13691 was provided by NASA through a grant from the Space Telescope Science Institute, which is operated by the Association of Universities for Research in Astronomy, Inc., under NASA contract NAS 5-26555. We thank the Carnegie Institution for its continued support of this program over the past 30 years. This research has made use of the NASA/IPAC Extragalactic Database (NED), which is operated by the Jet Propulsion Laboratory, California Institute of Technology, under contract with the National Aeronautics and Space Administration.
Facility: HST (ACS/WFC). -
Software: DAOPHOT (Stetson 1987), ALLFRAME (Stetson 1994), Tiny Tim (Krist et al. 2011), DrizzlePac (Fruchter & Hook 2002).
Appendix: Comparison of CCHP and Literature Techniques
To better understand the robustness of our methodology presented in this work, we undertake comparisons at three stages of the data reduction and analysis: (i) image processing and photometry (Appendix A.1), (ii) rectification of the color sensitivity of the RGB (Appendix A.2), and (iii) testing of other edge detection techniques (Appendix A.3). Throughout this discussion, we will use the term Δμ to refer to the difference between our TRGB measurement in the main text (F814W = 27.37 ± 0.03ran ± 0.04sys mag) and the variant method being discussed.
A.1. Comparison of FLC and Drizzled Photometry
The RGB stars measured in this study are as faint as F814W ≈ 29 mag and F606W ≈ 30 mag. In individual frames (20 for F814W and 12 for F606W), these stars are measured at low S/N. There are two independent approaches to producing photometry for these sources:
- 1.Generate a master source list from a high-S/N median image and use it as an input to force-photometer individual frames (as is done in the ALLFRAME software). The photometry is completed on the flc image products and we will refer to this technique as flc.
- 2.Directly photometer co-added images, defining an empirical PSF based on high-S/N sources in the median image. The photometry is completed on a drc image product and we will refer to this technique as drc.
The former (flc) is the technique described in the main text, for which we utilize the theoretical Tiny Tim PSFs (Krist et al. 2011). It has the disadvantage of the stellar FWHM being undersampled (though we note that because stellar crowding is low, our stellar profile fitting is not limited to the stellar FWHM). The latter technique (drc) has been used more broadly in the literature for TRGB-based analyses at these distances (e.g., Caldwell 2006; Aloisi et al. 2007; Bird et al. 2010; Jang & Lee 2017a, and references therein) and comes with the advantage of producing stellar profiles that are Nyquist-sampled within the stellar FWHM. In this Section, we provide quantitative comparisons between the flc and drc methods.
We adopt the flc photometry from the main text and the drc photometry is produced as follows. Drizzled image stacks are constructed using DrizzlePac (Fruchter & Hook 2002). We carefully selected ∼100 relatively bright sources in each CCD chip and used them to refine image alignment with the Tweakreg task; the mean residual rms for the X and Y shifts determined with Tweakreg were smaller than 0.1 pixel. We then used Astrodrizzle to make a combined drizzled image for each filter with final_pixfrac = 0.8 and final_scale = 0.03 arcsec pixel−1. The output drizzled images have stellar FWHMs of ∼3 pixels, corresponding to ∼009. PSF photometry on the drizzled images and standard calibration were performed following the method described in the main text with the exception of the PSF modeling. We generated empirical PSFs with DAOPHOT that were constructed from ∼25 bright isolated stars in each of the F606W and F814W images. The F814W source catalog is used as the "master catalog" and the two frames are simultaneously photometered using ALLFRAME (Stetson 1994). The magnitudes are calibrated identically as described in the main text (Section 2.2).
Figures 7(a) and (b) provide star-by-star comparisons of the flc and drc photometry in the F606W and F814W filters, respectively. Bright stars with F606W ≲ 24 mag and F814W ≲ 23 mag are in excellent agreement with median offsets smaller than 0.01 mag for both filters. However, we measure small systematic offsets for the fainter stars. At the TRGB magnitude (F814W ≈ 27.4 mag and F606W ≈ 28.7 mag), median offsets are measured to be 0.04 mag in F606W and 0.03 mag in F814W. The precise origin of the offsets for fainter sources remains unclear, but could be due to (i) the relatively small number of sources used to determine the empirical PSF11 or (ii) documented differences between the Tiny Tim and empirical magnitudes for faint sources that were described by Krist et al. (2011). For sources in the range 27.34 < F814W < 27.40 mag the median magnitude uncertainty is 0.07 mag for F814W and 0.13 mag for F606W (the latter measurement is for the same stars in the F814W range). Thus, the differences identified in Figures 7(a) and (b) for the fainter sources are within the magnitude uncertainties.
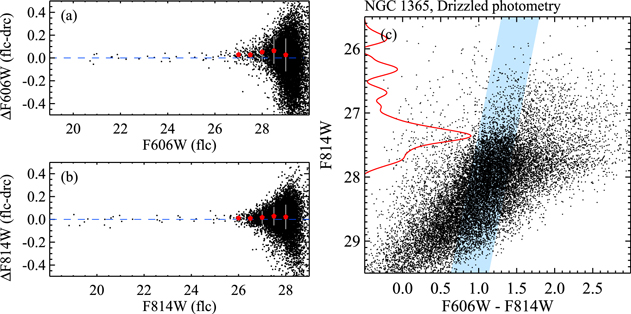
Figure 7. Comparison of PSF magnitudes in F606W (a) and F814W (b) between individual frame photometry with Tiny Tim PSFs (flc) and drizzled photometry with empirical PSFs (drc). Median offsets and standard deviations at each magnitude bin are marked by red pentagons and error bars, respectively. (c) CMD of F814W vs. F606W – F814W of resolved stars in NGC 1365 from drizzled photometry (drc). An edge detection response (solid line) for stars in the shaded region shows a strong peak at F814W = 27.36 ± 0.03 mag, which is statistically identical to that determined in the main text.
Download figure:
Standard image High-resolution imageWhile some star-to-star differences are demonstrated in Figures 7(a) and (b), a more relevant question is the results from the TRGB detection. Thus, we apply the same techniques described in the main text to the drc photometry. The result is given in Figure 7(c). The CMD shows a well-defined RGB with a visible discontinuity due to the TRGB at F814W ∼ 27.4 mag. A visual comparison to Figure 2 reveals that the drizzle-based CMD looks more well populated (i.e., more complete) and this is consistent with having performed PSF photometry on a higher-S/N image. We select stars in the shaded region (identical to that of Figure 2 in the main text), construct an LF, apply the GLOESS smoothing, and lastly apply the [−1, 0, 1] Sobel filter. The edge detection response is shown in red in Figure 7(c) and the maximal response occurs at F814W = 27.36 ± 0.03 mag. The derived TRGB magnitude is statistically consistent with the value from the individual frame photometry, F814W = 27.37 ± 0.03 mag (Table 2).
From the comparisons given in the panels of Figure 7, we conclude that the two reduction procedures are statistically identical both for their output photometry and in their TRGB measurements. Thus, the choice to use individual frame photometry for the CCHP project, motivated by the need for a homogeneous image processing strategy for both nearby and distant SNe Ia hosts, is entirely consistent with the body of work derived from drizzled photometry (e.g., Jang & Lee 2017a).
A.2. Rectified TRGB Magnitudes
A great benefit of the TRGB as a distance indicator is that the metallicity sensitivity of the absolute magnitude is projected into the color of the star. Furthermore, for metal-poor stars that populate the "blue" edge of the TRGB,  , the I magnitude of the TRGB is relatively insensitive to metallicity (i.e., it is flat with color; see Lee et al. 1993; Rizzi et al. 2007; Madore et al. 2009; Jang & Lee 2017b, among others). Thus, with only an optical color-cut (as is done in Figure 2), the I, and by proxy the TRGB in F814W, requires no correction for metallicity to convert to an absolute magnitude system.
The color dependence of the TRGB in I, however, is not negligible everywhere; in particular, for the color range  the I magnitude becomes noticeably fainter. Madore et al. (2009) presented an empirical technique to rectify or transform the TRGB magnitudes for metal-rich sources to the metal-poor (flat) portion of the TRGB. The general form of a transformation into the
  (or TRGB) magnitude system is defined as

where  is the initial magnitude corrected for the Milky Way extinction and
  is the slope of the TRGB to a fiducial color,
  . In the standard Johnson–Cousins system used in Madore et al. (2009), the slope is
  and the fiducial color was
  to produce
  magnitudes from I photometry. The parameter values were determined from a linear approximation to the TRGB predicted by theoretical models described by Bellazzini et al. (2001, 2004). A standard edge detection algorithm can be applied to the rectified CMD and the distance modulus is computed as
  , where MTRGB is defined at the fiducial color,
  .
.
For use in this work, we convert the T magnitude system of Madore et al. (2009) into the ACS/WFC system for  with
with  and
and  , utilizing the photometric transformations from the flight magnitude system to the Johnson–Cousins system given in Sirianni et al. (2005, their Section 8.3 and Table 22). We find
  and the fiducial color is
  , and
, and  and the fiducial color is
  . The uncertainties associated with this transformation are not well constrained. Sirianni et al. (2005) mention differences at the level of 3%–4% for stars with V – I > 1.0 between the calibrating photometry. More specifically, the authors write that the transformations "can be applied to main-sequence and giant stars without introducing errors of more than a few percent. However, it should not be expected that the 1%–2% accuracy of ACS photometry will be preserved in the transformed data." Because we have transformed the
  terms into
  terms, the full impact of these systematics is difficult to constrain, but it must be larger than 4% (e.g., double the accuracy quoted by Sirianni et al. (2005) for their ACS absolute calibration).
Jang & Lee (2017b) investigated the color dependence of the TRGB from the HST/ACS photometry of eight nearby galaxies and find that the run of the I TRGB with the V – I color can be described with two components: a flat one for the blue color range ( ) and a steep one for the red color range (
 ). From this, they introduced the QT magnitude, a quadratic form of the TRGB magnitude corrected for the color dependence of the TRGB.
  is given by
where  ,
,  , and
, and  . Unlike the T conversion described previously, the QT transformation was measured in the ACS native photometry system. We estimate that the systematic uncertainty from the QT transformation is approximately 0.02 mag from propagation of the slope uncertainties through the constant terms in Equation (2).
We applied the  and
and  magnitude transformations to the flc photometry of NGC 1365, and the resulting CMDs are shown in Figures 8(a) and (b), respectively. To construct an LF, we apply the color–magnitude restriction indicated by the blue shading in Figures 8(a) and (b), which is identical to that applied in Figures 2 and 5(a) in the main text. We use GLOESS smoothing with our idealized
  and use the Sobel filter, [−1, 0, +1]. The edge detection response function is shown in Figures 8(a) and (b) and has strong peaks at
  mag. The TRGB magnitude is derived by adopting the maximum edge detection response and the corresponding uncertainty is determined following the procedure outlined in Jang & Lee (2017a), which uses the results of bootstrap resampling. We obtain TRGB magnitudes
  mag and
  mag, which agree within their mutual uncertainties.
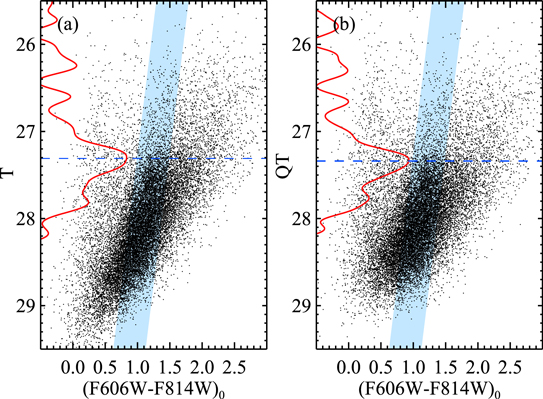
Figure 8. Color–magnitude diagrams for NGC 1365 using the rectified TRGB method in the systems (a)  and (b)
  described in the text. The edge detection response from the Sobel filter, [−1, 0, +1], applied to the GLOESS-smoothed LF is shown by a red solid line in each panel.
Download figure:
Standard image High-resolution imageComparing the  and
and  results to an extinction-corrected TRGB magnitude from the main text, F814W0 = 27.34 ± 0.03 mag, we find a good agreement within the quoted uncertainties. We note that our color–magnitude restrictions largely avoid the regions of F606W – F814W color where the
  and
and  magnitudes are expected to provide the most benefit by bringing these fainter TRGB sources to the same magnitude as the bluer TRGB. Thus, we conclude that our results from the raw F814W magnitudes are fully consistent with those determined with the rectified
  and
and  systems.
A.3. Comparison of Edge Detectors
The detection of the apparent magnitude of the TRGB is one of the most critical steps in estimating its distance. Broadly, two independent approaches have been developed for identifying the TRGB:
- 1.Direct edge detection algorithms as in Lee et al. (1993), Madore & Freedman (1995), Sakai et al. (1996), Méndez et al. (2002), Mager et al. (2008), Madore et al. (2009), and Jang & Lee 2017a that typically make use of a form of the Sobel filter that is an approximation to the first derivative of a discrete function. These can take on discrete (N) and continuous forms (Φ) based on the smoothing that is applied to the LF before application of the edge detection algorithm.
- 2.
Based on a review of the literature, we have selected seven forms of TRGB edge detection in addition to that adopted by the CCHP. These are similar to those applied in Appendix B of Paper II.
We have applied these eight Sobel filters to the LFs of the selected stars in NGC 1365 and plot them in Figure 9. We used a 0.06 mag bin to construct the LF for those edge detectors that operate directly on the histogram (e.g., Figures 9(a), (b), (e)–(g)). The bin width chosen here is larger than with other methods because no additional smoothing is applied to reduce statistical noise. In the case of the continuous forms of Sobel filters, we used a bin width of 0.01 mag for deriving the Gaussian-smoothed LFs (e.g., Figures 9(c) and (d)). Figure 9(h) is a re-visualization of the algorithm applied in the main text. The magnitude of the TRGB is determined by choosing the maximum edge detection response. Qualitatively, all eight edge detection responses in the panels of Figure 9 have peaks at F814W ∼ 27.4 mag.

Figure 9. F814W luminosity functions for RGB stars in NGC 1365 (blue histograms) and edge detection responses (red lines) obtained from several edge detection algorithms: (a) Lee et al. (1993), (b) Madore & Freedman (1995), (c) Sakai et al. (1996), (d) Méndez et al. (2002), (e) Mager et al. (2008), (f) Madore et al. (2009), (g) Jang & Lee (2017a), and (h) this study. The histograms are modified with either the binned LFs (labeled with N) or the smoothed LFs (labeled with Φ) considering the form of the edge detection algorithm used for the histogram in each panel. The TRGB magnitude as determined by the edge detector run on the LF is marked by a dashed line in each panel.
Download figure:
Standard image High-resolution image
The results in the quantitative tip detection in the panels of Figure 9 are as follows: F814W = 27.46 mag from Lee et al. (1993) algorithm (a), F814W = 27.46 mag from Madore & Freedman (1995) algorithm (b), F814W = 27.50 mag from Sakai et al. (1996) algorithm (c), F814W = 27.40 mag from Méndez et al. (2002) algorithm (d), F814W = 27.46 mag from Mager et al. (2008) algorithm (e), F814W = 27.40 mag from Madore et al. (2009) algorithm (f), F814W = 27.40 mag from Jang & Lee (2017a) algorithm (g), and F814W = 27.37 mag from the algorithm adopted in the main text (h). Our estimate in the main text, F814W = 27.37 mag, is 0.07 mag brighter than the mean of all other edge detectors tested here.
In each panel of Figure 9, the TRGB is indicated by the vertical dashed line in each panel. While there is broad agreement, the techniques produce results that vary over a range of 0.13 mag, which is four times larger than the quoted uncertainty on our measurement of 0.03 mag. For a more quantitative analysis, we estimated random (statistical) and systematic uncertainties of each TRGB detection via simulations of ASLFs as described in the main text. These results are summarized in Table 3. Derived random uncertainties range from 0.01 mag to 0.07 mag with a mean of 0.04 mag. We noted that the systematic uncertainties, which are mostly not quantitatively addressed in previous studies, are comparable with or sometimes even larger than the random uncertainties. Allowing for these additional uncertainties, all of these values are consistent with our measurement (Figure 9(h)).
Table 3. Comparison of TRGB Measurements from Different Edge Detectors
| Method | Figure | Bin | TRGB |

|

|
|---|---|---|---|---|---|
| Reference | Panel | Width | (mag) | (mag) | (mag) |
| Lee et al. (1993) | a | 0.06 | 27.46 | 0.07a | 0.05 |
| Madore & Freedman (1995) | b | 0.06 | 27.46 | 0.06a | 0.04 |
| Sakai et al. (1996) | c | 0.01 | 27.50 | 0.02 | 0.08 |
| Méndez et al. (2002) | d | 0.01 | 27.40 | 0.01 | 0.01 |
| Mager et al. (2008) | e | 0.06 | 27.46 | 0.04a | 0.03 |
| Madore et al. (2009) | f | 0.06 | 27.40 | 0.04a | 0.02 |
| Jang & Lee (2017a) | g | 0.06 | 27.40 | 0.04a | 0.05 |
| This study | h | 0.01 | 27.37 | 0.03 | 0.02 |
Note.
aFor larger bin size, 0.03 mag is added to the uncertainties.Download table as: ASCIITypeset image
In Paper II, a thorough discussion of the advantages and disadvantages of the wide range of edge detectors was presented, and for brevity we will discuss only the implications that can be interpreted from the panels of Figure 9. First, the use of large bins is sometimes problematic since the size of the bin has an effect on the quantitative Sobel response. Thus, in our binned LFs, an additional uncertainty of ∼0.03 (50% of a bin) should be added to the algorithmic measurement uncertainty. This additional uncertainty arises due to the inability to distinguish the location of the peak within the set binning strategy and this must be applied to the results in Figures 9(a), (b), (e)–(g). We note that some previous studies (Dalcanton et al. 2009; Jang & Lee 2017b) have undertaken Monte Carlo simulations to find a statistically more reliable TRGB magnitude and to minimize uncertainties associated with the bin size.
Second, many of the edge detection algorithms themselves employ smoothing directly in the algorithm itself. If applied to a "raw" LF, then this is not problematic, but many of the algorithms are applied to LFs that have already been smoothed. This is clearly evident in Figure 9(c), which has not only a heavily smoothed LF, but also a heavily smoothed algorithm. This "double smoothing" results in the most deviant of the TRGB values (27.50 mag) and the response of the edge detection is not a peak, but a plateau that reduces the precision of the tool. The bias in the algorithm of Sakai et al. (1996) is evident by comparing Figures 9(c) and (d), which, while having nearly identical LFs, have very different edge responses with a large systematic offset ( mag).
mag).
Lastly, there are algorithms that attempt to model the uncertainties in the data (both magnitude uncertainties and completeness), but these rely critically on the ability to assess these values well for a data set. After being modeled, these uncertainties are folded into the detection algorithm itself, instead of applying modifications to the LF directly. The difficulty with this approach is that it is not fully reproducible by an independent team. As has been shown in previous sections of this Appendix, there are quantitative differences at the level of 0.04 mag between photometry derived from the same underlying images due to subtle choices in the data processing. We have demonstrated that our algorithms for the LF and for the edge detection are robust to these differences, but algorithmic approaches that use the photometry characterizations directly from one's own photometry would not be reproducible by an independent process. This is particularly concerning for the template-fitting strategies that (i) rely on the input idealized model of the LF to be well matched to the actual intrinsic LF for the field of interest and (ii) are highly sensitive to the completeness in both bands of the photometry (not just the band used for the LF).
In conclusion, we see quantitative differences between our adopted strategies for smoothing the LF and for applying an edge detection algorithm (Figure 9). As we have shown, these differences can be understood within the true uncertainties of the various techniques. As discussed in depth in Paper II, our modeling of uncertainties is explicitly designed to minimize the total uncertainty from the photometric data, to address true uncertainties including the systematics, and to take into account the full scale of photometric uncertainties. Also, our edge detection algorithm combined with the LF binning is reproducible by others and independent from the uncertainty associated with the bin size. Indeed, our approach measures the TRGB with a total uncertainty of ∼0.05 mag, small enough to determine the value of the Hubble constant accurate to 2.5% (Section 4.3.2).
Footnotes
- ∗
Based in part on observations made with the NASA/ESA Hubble Space Telescope, obtained at the Space Telescope Science Institute, which is operated by the Association of Universities for Research in Astronomy, Inc., under NASA contract NAS 5-26555. These observations are associated with program #13691.
- 7
Data are available at https://sne.space/sne/SN2012fr/.
- 8
- 9
- 10
We refer the reader to that work for the full description of their anchoring process and tests thereof.
- 11
Using a small number of sources limits the ability of the DAOPHOT-based PSF model to properly account for the PSF variation across the frame due to residual distortion or true variation. Moreover, the PSF is more susceptible to non-stellar contaminants and other non-ideal features in the profile.