


Abstract
We recently presented coronal condensations, caused by magnetic reconnection (MR) between coronal loops from extreme ultraviolet observations, over the course of one day, on 2012 January 19. In this paper, by investigating the loops over an extended period of time from January 16 to 20, we present a case for repeated coronal condensations caused by repeated MR between them. In these five days, MR between higher-lying open loops and lower-lying closed loops occurs repeatedly, forming magnetic dips in the higher-lying open loops. During the MR process, cooling and condensation of coronal plasma occur repeatedly. Early on January 16, cooling, but not condensation, of coronal plasma happens. Later, condensation appears at the edge of the dips and falls down along the loops as coronal rains. On January 17, a similar condensation happens at the edge of the higher-lying dips and falls down along the loops. However, another condensation appears in the lower-lying dips and rains down across them. From January 18 to 19, multiple condensations mostly occur at the edge of the dips and fall down both along the loops and across the dips. On January 20, five condensations sequentially appear and rain down across the dips. Overall, 15 condensation events occur in five days, lasting from 0.5 to 15.6 hr. We suggest that the formation of coronal condensations by MR between loops is common in the solar corona. The repeated MR between loops thus plays an essential role in the mass cycle of coronal plasma by initiating repeated catastrophic cooling and condensation.
Export citation and abstract BibTeX RIS
1. Introduction
Magnetic reconnection (MR) is a fundamental process in all magnetized plasma systems, such as accretion disks, solar and stellar coronae, planetary magnetospheres, and laboratory plasmas, throughout the universe (Priest & Forbes 2000). It shows the reconfiguration of magnetic field topology and is considered to play an essential role in the rapid release of magnetic energy and its conversion to other forms, e.g., thermal and kinetic (Priest & Forbes 2000; Aschwanden 2002; Yamada et al. 2010). In solar physics, many theoretical studies of MR have been undertaken to explain various solar activities, such as flares (Hirayama 1974; Shibata 1999; Janvier et al. 2013), prominences (filaments; Pneuman 1983; Antiochos & Klimchuk 1991; Kaneko & Yokoyama 2017), coronal mass ejections (Forbes 1990; Chen & Shibata 2000; Lin & Forbes 2000), and jets (Yokoyama & Shibata 1995; Pariat et al. 2009; Sterling et al. 2015; Hou et al. 2017).
The process of MR is difficult to observe directly. In the solar corona, the plasma beta, that is, the ratio of the plasma pressure to the magnetic pressure, is below unity. Because of the high electrical conductivity, the magnetic flux is frozen into the coronal plasma (Priest & Forbes 2000; Priest 2014). The magnetic field topology is, therefore, often outlined by plasma trapped in coronal magnetic structures, e.g., coronal loops (Aulanier et al. 2007; Peter et al. 2013; Reale 2014; Chitta et al. 2017) and filament threads (Guo et al. 2010; Jiang et al. 2013; Li & Zhang 2013; Shen et al. 2014). The sudden or gradual change in the morphology of these coronal magnetic structures hence represents the evolution of the magnetic field topology.
Many observational evidences of MR have been reported using remote-sensing data. During the flare processes, cusp-shaped postflare loops have been detected separately in soft X-ray (Tsuneta et al. 1992) and extreme ultraviolet (EUV; Li & Zhang 2009b; Hong et al. 2016; Zhu et al. 2016; Yan et al. 2018) images. Above the postflare loops, supra-arcade downflows have been observed (McKenzie 2000; Innes et al. 2003; Savage et al. 2010; Li et al. 2016b), and hard X-ray loop-top (Masuda et al. 1994; Li & Zhang 2009b; Longcope et al. 2016) and coronal (Sui & Holman 2003; Su et al. 2013; Chen et al. 2016) sources have been identified. Between these two sources, X-type structures appear (Filippov 1999; Sun et al. 2012; Wang & Liu 2012; Yang et al. 2015). At the interface of the X-type structures, current sheets form (Ciaravella & Raymond 2008; Liu et al. 2010; Li et al. 2016a, 2016b, 2018c; Cheng et al. 2018; Huang et al. 2018; Warren et al. 2018; Xue et al. 2018), in which MR takes place. In the current sheets, plasmoids appear and propagate along them bidirectionally and then farther along the MR structures, e.g., loops and filament threads (Chen et al. 2016; Dai et al. 2018; Yang et al. 2018; Li & Yang 2019; Zhang & Ni 2019). MR inflows toward the current sheets (Yokoyama et al. 2001; Narukage & Shibata 2006; Li & Zhang 2009b; Takasao et al. 2012; Li et al. 2016b) and MR outflows out of the current sheets (Innes et al. 1997b; Wang et al. 2007; Savage et al. 2010; Liu et al. 2013; Tian et al. 2014; Li et al. 2016; Chen et al. 2018; Zhou et al. 2019) have been presented. Because of the MR, changes in the magnetic field topology happen, and newly reconnected magnetic structures appear (Kumar et al. 2010; Zhang et al. 2013; Li et al. 2014; Yang et al. 2015, 2017; Zheng et al. 2017).
MR is considered to play a key role in the formation of prominences. Based on MR theory, numerous models of prominence formation have been developed (Pneuman 1983; van Ballegooijen & Martens 1989; Antiochos & Klimchuk 1991; Moore et al. 2001). In these models, MR at the neutral line of sheared magnetic arcades leads to the formation of helical magnetic field lines with numerous dips above the MR region. Many observational evidences of these models have been reported, using multiwavelength images of the solar atmosphere (Yurchyshyn et al. 2006; Chen et al. 2014, 2018; Xue et al. 2017). After the formation of prominence magnetic field structures, rapid cooling and condensation of dense plasma, trapped inside the helical structures, take place, due to thermal instability, and supply mass to the prominence (Pneuman 1983; Kaneko & Yokoyama 2015). Here, the thermal instability in plasma occurs whenever the radiative losses locally overcome the heating input (Parker 1953; Field 1965). The evolution of the magnetic field, e.g., MR, and the thermal evolution, i.e., condensation, in these models are treated separately. An MR–condensation prominence formation model, however, suggests that MR can lead to flux rope formation and also to radiative condensation under certain conditions (Kaneko & Yokoyama 2017). Employing Solar Dynamics Observatory (SDO; Pesnell et al. 2012) Atmospheric Imaging Assembly (AIA; Lemen et al. 2012) multiwavelength images, cooling and condensation of coronal plasma have been observed separately in a loop system (Liu et al. 2012) and a coronal cavity (Berger et al. 2012) during the formation of prominences.
Thermal instability is considered to play an essential role in the formation of coronal rains. Owing to the cool and dense plasma, coronal rain drains down to the solar surface along loops from coronal heights (de Groof et al. 2005; Zhang & Li 2009; Antolin et al. 2012). In the scenarios of the heating–condensation cycle, heating events, concentrated at (near) the loop footpoints, result in chromospheric evaporation and direct mass ejection into the coronal loops, which rapidly become hotter and denser (Müller et al. 2003, 2004; Fang et al. 2013). The hotter and denser loops then rapidly cool, due to a loss of thermal equilibrium between the heat input, heat conduction, and radiative losses. Under the effect of gravity, the cool plasma condensation subsequently falls down along loops from the corona to the solar surface as coronal rain. Using multiwavelength images, the cooling and condensation of coronal plasma in active region loops have been identified in the formation of coronal rains (Schrijver 2001; Antolin et al. 2015; Vashalomidze et al. 2015; Kohutova & Verwichte 2016).
Coronal condensations caused by MR between coronal loops have been reported recently (Li et al. 2018a, 2018b, hereafter referred to as Papers I and II). Here we briefly summarize the key findings from these papers. On 2012 January 19, the higher-lying curved open loops, L1, move downward, and reconnect with the lower-lying closed loops, L2; see Figure 1(a) (see also Figure 6 in Paper I). As a consequence, magnetic dips form in loops L1, denoted by the red arrow in Figure 1(a). Two sets of newly reconnected loops, L3 and L4, then appear; see Figure 1(a). The MR process lasts for ∼22 hr, much longer than any other solar MR events, which typically last only a few minutes, e.g., explosive events (Innes et al. 1997a), EUV bursts (Peter et al. 2014), and jets (Shen et al. 2012), to a few hours, such as flares (Li & Zhang 2009a). Moreover, loops L1 and L2 are rooted in quiet-Sun regions, with weaker magnetic field. Much less magnetic flux reconnects over a much longer time, suggesting a much smaller MR rate. This is consistent with the observation that no significant heating, acceleration of plasma, and nonthermal emission is detected during the MR process. However, quasi-periodic fast propagating magnetoacoustic waves, with a peak period of 4 minutes, are generated at the MR region and move upward across the dips, with a mean speed of 200 km s−1; see Paper II. The magnetic field topological changes and fast propagating magnetoacoustic waves, generated during the MR process, perturb the plasma density in the dips. Thermal instability then occurs, resulting in the rapid cooling and condensation of coronal plasma in the dips. Here, coronal condensation is represented by the bright emission in the AIA 304 Å channel. Due to the successive MR processes, coronal condensations, without support from the lower-lying loops L1, flow downward along both legs of loops L4 to the solar surface as coronal rains. Our results emphasize that the magnetic field evolution, e.g., MR between loops, and the thermal evolution, i.e., coronal condensation, have to be treated together and not separately. Condensation of coronal plasma arises naturally during the MR process between loops. By analyzing three more cases, Mason et al. (2019) further supported our results from Paper I that the interchange MR between open and closed systems of coronal loops leads to condensations (see Figure 6 in Paper I).

Figure 1. Schematic diagrams of coronal loops observed by (a) SDO/AIA and (b) STEREO-A/EUVI. Panel (a) is adapted from Figure 6 of Paper I. The thick gray lines denote the solar limbs. The green, blue, and green-blue lines separately represent the magnetic field lines of loops L1, L2, and L3 (L4). The red arrows denote the direction of movement of loops L1 and also mark the magnetic dip in loops L1. The red stars show the MR between loops L1 and L2. The black plus and white minus signs represent the positive and negative magnetic fields. The diagrams are rotated counterclockwise (a) and clockwise (b), respectively. The portions of the solar limbs in the regions of interest are thus roughly horizontal, consistent with the AIA and EUVI-A images displayed below, e.g., in Figures 4, 6, 9, 12, 15, 17, and 19, and Figures 5, 8, 11, and 14. See Section 2 for details.
Download figure:
Standard image High-resolution imageIn our earlier studies (Papers I and II), we concentrated on one particular MR event followed by condensations (on January 19). In this study, we address the question of whether MR between loops is a common phenomenon and whether coronal condensations always take place during the MR process. In order to answer these questions, we investigate the evolution of loops that appear at the solar limb for almost a week, from 2012 January 16 to 20. Our choice of time frame is motivated by the clear traceability of the loops above the solar limb during these five days. Furthermore, we roughly check other similar events above the solar limb in the month of 2012 January. In short, we can summarize that coronal condensations are common and that they are related to repeated MR between loops. The observations and results are shown in Sections 2 and 3, and a summary and discussion are presented in Section 4.
2. Observations
AIA on board the SDO is a set of normal incidence imaging telescopes. It obtains full-disk solar atmospheric images at 10 wavelength channels, which show plasma with different characteristic temperatures. In this study, to investigate the evolution of MR between loops and condensations of coronal plasma, AIA 171 Å (Fe ix, ∼0.9 MK), 131 Å (Fe viii, ∼0.6 MK, and Fe xxi, ∼10 MK), and 304 Å (He ii, ∼0.05 MK) images, with a time cadence of 12 s and spatial sampling of 0 6 pixel−1, are employed. In order to better illustrate the evolution of loops, we mark the higher-lying open and lower-lying closed loops as L1 and L2, and the newly reconnected loops as L3 and L4, in the field of view (FOV) of the AIA (see Figure 1(a)), consistent with Papers I and II. On 2012 January 18, loops L1 are observed above the northwestern solar limb in AIA 171 Å images; see Figure 2(a). They are rooted in the quiet-Sun region and extend upward from southwest to northeast.

Figure 2. SDO and STEREO-A observations of the loops at 00:14 UT on 2012 January 18. (a) AIA and (b) EUVI-A 171 Å images. The red, green, purple, cyan, blue, and pink boxes in (a) represent the FOVs of Figures 4, 6, 9, 12, 15, and 17(19), and the red, green, purple, and cyan boxes in (b) show the FOVs of Figures 5, 8, 11, and 14, respectively. See Section 2 for details.
Download figure:
Standard image High-resolution imageBecause the loops are located above the northwestern solar limb in the FOV of the AIA, they are also observed by the EUV Imager (EUVI) on board Solar TErrestrial RElations Observatory (STEREO; Howard et al. 2008) A, rather than B, under a different viewing angle; see Figure 3. To study the evolution of MR between loops and coronal condensations from another viewpoint, EUVI-A 171 Å and 304 Å images, with a spatial sampling of 16 pixel−1 and time cadences of 2 hr and 10 minutes, respectively, are used. Figure 2(b) displays loops L1 above the northeastern solar limb in EUVI-A 171 Å images on 2012 January 18. Here, the orientations of loops are totally different from those in the AIA, e.g., loops L1 extend upward from southeast to northwest; see Figure 2(b). Similar to Figure 1(a), we mark the loops in the FOV of the EUVI-A as L1, L2, L3, and L4 in Figure 1(b).
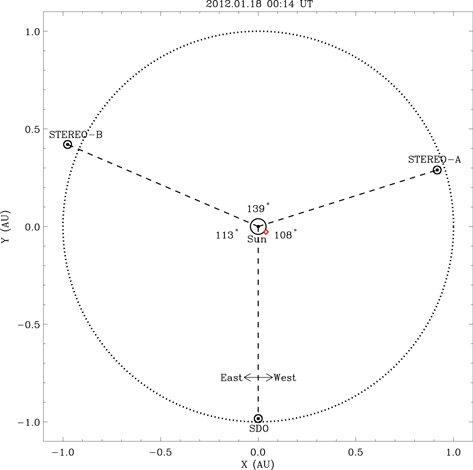
Figure 3. Positions of the SDO and STEREO-A and -B satellites at 00:14 UT on 2012 January 18. The angles between the three satellites are denoted by the numbers in the plot. The dotted circle at 1 au represents the Earth orbit. East and west show the east and west directions in the FOV of the SDO. The red diamond marks the general location of the loops displayed in Figure 2. See Section 2 for details.
Download figure:
Standard image High-resolution image3. Results
In order to better display the evolution of loops and coronal condensations, AIA and EUVI-A images are separately rotated counterclockwise and clockwise; see Figure 1. The portions of the solar limb in the regions of interest (see the colored boxes in Figure 2) are thus roughly horizontal in the AIA and EUVI-A images presented here, consistent with Figure 1. Depending on the evolution of the loops and condensations, the results, general information for which are listed in Table 1, are shown separately in Sections 3.1–3.3 and Appendices A–C. Furthermore, parameters associated with the MR between loops and the coronal condensations are obtained and listed in Table 2.
Table 1. General Information on Repeated Coronal Condensations and MRs between Loops from 2012 January 16 to 20
| AIA Emission | EUVI-A Emission | ||||||||
|---|---|---|---|---|---|---|---|---|---|
| Event | Section | Start Time | End Time | 171 Å | 131 Å | 304 Å | 171 Å | 304 Å | |
| 1 | 3.1 | Jan 16 | Jan 16 | Yes | Yes | No | Yes | No | |
| 04:00 UT | 20:00 UT | ||||||||
| 2 | 3.2 | Jan 16 | Jan 17 | Yes | Yes | Yes | Yes | Yes | |
| 20:30 UT | 04:30 UT | ||||||||
| 3 | 3.3 | Jan 17 | Jan 17 | Yes | Yes | Yes | Yes | Yes | |
| 07:00 UT | 22:00 UT | ||||||||
| 4 | A | Jan 17 | Jan 18 | Yes | Yes | Yes | Yes | Yes | |
| 22:00 UT | 10:00 UT | ||||||||
| 5 | B | Jan 19 | Jan 20 | Yes | Yes | Yes | No | No | |
| 01:00 UT | 02:30 UT | ||||||||
| 6 | C | Jan 20 | Jan 21 | Yes | Yes | Yes | No | No | |
| 03:00 UT | 03:00 UT | ||||||||
Note. Yes (No) means that there is an (no) associated emission in the corresponding SDO/AIA or STEREO-A/EUVI 171 Å, 131 Å, or 304 Å channels.
Download table as: ASCIITypeset image
Table 2. Measurements of Repeated Coronal Condensations and MRs between Loops from 2012 January 16 to 20
| Moving Speed | Cooling Times (minutes) | Coronal Condensations in AIA 304 Å Channel | |||||||
|---|---|---|---|---|---|---|---|---|---|
| Sections | of Loops L1 | 171 to 131 Å | 131 to 304 Å | Appearance | Position | Falling Speed | Path | Disappearance | Lifetime |
| 3.1 | 3.2 km s−1 | 6 | ⋯ | ⋯ | ⋯ | ⋯ | ⋯ | ⋯ | ⋯ |
| 3.2 | 2.3 km s−1 | 6 | 14 | Jan 17 | D1 | 40 km s−1 | P1 | Jan 17 | 1.3 hr |
| 02:50 UT | 04:10 UT | ||||||||
| 3.3 | 5.3 km s−1 | 45 | 59 | Jan 17 | D1 | 45 km s−1 | P1 | Jan 17 | 2.5 hr |
| 13:00 UT | 15:30 UT | ||||||||
| 4.0 km s−1 | 55 | 96 | Jan 17 | D2 | 60 km s−1 | P2 | Jan 17 | 5.0 hr | |
| 14:03 UT | 19:03 UT | ||||||||
| 4.5 km s−1 | 59 | 55 | Jan 17 | D1 | 72 km s−1 | P1 | Jan 17 | 57 minutes | |
| 19:03 UT | 20:00 UT | ||||||||
| 4.5 km s−1 | 6 | 3 | Jan 17 | D2 | 12 km s−1 | P2 | Jan 17 | 30 minutes | |
| 19:23 UT | 19:53 UT | ||||||||
| A | 8.0 km s−1 | 20 | 80 | Jan 18 | D2 | 15 km s−1 | P2 | Jan 18 | 30 minutes |
| 01:12 UT | 01:42 UT | ||||||||
| 23 | 78 | Jan 18 | D1 | 65 km s−1 | P1 | Jan 18 | 4.0 hr | ||
| 01:55 UT | 50 km s−1 | P2 | 05:55 UT | ||||||
| B | 2.5 km s−1a | 30a | 50a | Jan 19 | D1a | 100 km s−1a | P1a | Jan 19 | 15.6 hr |
| 05:05 UTa | 60 km s−1a | P2a | 20:40 UT | ||||||
| 6.5 km s−1 | 35 | 133 | Jan 19 | D1 | 75 km s−1 | P1 | Jan 19 | 7.7 hr | |
| 40 | 112 | 12:00 UT | 50 km s−1 | P2 | 19:40 UT | ||||
| 31 | 99 | ||||||||
| 2.6 km s−1 | 12 | 89 | Jan 19 | D2 | 60 km s−1 | P1 | Jan 20 | 6.8 hr | |
| 19:40 UT | 10 km s−1 | P2 | 02:30 UT | ||||||
| C | 3.5 km s−1 | 63 | 52 | Jan 20 | D1 | 30 km s−1 | P2 | Jan 20 | 4.7 hr |
| 04:27 UT | 09:10 UT | ||||||||
| 4.0 km s−1 | 20 | 190 | Jan 20 | D2 | 10 km s−1 | P2 | Jan 20 | 45 minutes | |
| 16:05 UT | 16:50 UT | ||||||||
| 71 | 33 | Jan 20 | D2 | 65 km s−1 | P2 | Jan 20 | 3.8 hr | ||
| 16:55 UT | 20:45 UT | ||||||||
| 3.0 km s−1 | ⋯ | ⋯ | Jan 20 | D2 | 20 km s−1 | P2 | Jan 20 | 1.6 hr | |
| 20:45 UT | 22:20 UT | ||||||||
| 44 | 92 | Jan 20 | D2 | 50 km s−1 | P2 | Jan 21 | 4.6 hr | ||
| 22:00 UT | 02:34 UT | ||||||||
Notes. Position D1 (D2) represents the position, i.e., the edge (bottom) of the dip in loops L1, in which the coronal condensations take place, and path P1 (P2) shows the falling path of coronal condensations, i.e., along the leg (across the dip) of loops L1.
aMeasurements from Paper I.Download table as: ASCIITypeset image
3.1. MR without Coronal Condensation Early on 2012 January 16
On 2012 January 16, loops L1 are observed in AIA 171 Å images; see Figure 4(a). They move down toward the solar surface several times, with mean speeds of several km s−1; see Figure 4(b) and the animated version of Figure 4. Dips of loops L1 form; see Figure 4(b). Along the AB direction in the blue box in Figure 4(b), we make a time slice of AIA 171 Å images and display it in Figure 4(d). Loops L1 move evidently with a mean speed of 3.2 km s−1; see the blue dotted line in Figure 4(d). Consistent with Papers I and II, the downward motions of loops L1 represent the MR process between loops L1 and L2, even though the whole MR magnetic structure is not totally identified, e.g., loops L2, L3, and L4.
Figure 4. MR between loops observed by SDO early on 2012 January 16. (a) and (b) AIA 171 Å and (c) 131 Å images. (d) Time slice of AIA 171 Å images along the AB direction in the blue box in (b). (e) Light curves of the AIA 171 Å (red line) and 131 Å (green line) channels in the green boxes in (a) and (c). The blue dotted line in (d) outlines the motion of loops L1 with a mean speed of 3.2 km s−1. The red and green dotted lines in (e) mark the peaks of the AIA 171 Å and 131 Å light curves, respectively. The FOV of (a)–(c) is denoted by the red box in Figure 2(a), and the AIA images here are rotated counterclockwise at an angle of 25°. An animation of the unannotated AIA 171 Å and 131 Å images (panels (a)–(c)) is available. It covers 16 hr starting at 04:00 UT on 2012 January 16, and the video duration is 1 minute. See Section 3.1 for details.
(An animation of this figure is available.)
Download figure:
Video Standard image High-resolution imageBright emission associated with the AIA 171 Å loops L1 is detected in AIA 131 Å images; see Figure 4(c). Same as in Papers I and II, no associated emission is observed in other AIA channels, e.g., 193 Å, 211 Å, 335 Å, and 94 Å, which show plasma with higher characteristic temperatures. Loops L1 in AIA 131 Å images thus show cooler (∼0.6 MK) rather than hotter (∼10 MK) plasma, which is cooler than the emitted plasma of AIA 171 Å (∼0.9 MK) loops. The light curves of the AIA 171 Å and 131 Å channels are calculated in the green boxes displayed in Figures 4(a) and (c), and shown in Figure 4(e) by the red and green lines, respectively. Both of them increase first, reach their peaks, and then decrease slowly. The AIA 171 Å light curve peaks at 05:19 UT (see the red dotted line in Figure 4(e)); the AIA 131 Å light curve, however, peaks 6 minutes later at 05:25 UT (see the green dotted line in Figure 4(e)). This indicates that the coronal plasma cools down from ∼0.9 MK, the characteristic temperature of the AIA 171 Å channel, to ∼0.6 MK, the lower characteristic temperature of the AIA 131 Å channel, in 6 minutes. Different from Papers I and II, no condensation of coronal plasma is detected in the AIA 304 Å images during the MR process.
The evolution of loops is also recorded by EUVI-A; see Table 1. Even with a much slower time cadence of only 2 hr, the MR process between loops L1 and L2 can still be isolated in the EUVI-A 171 Å data (see the animated version of Figure 5). Loops L1 move downward and interact with loops L2; see Figure 5(a). An X-type structure forms at the interface of these two loops; see the red and blue dotted lines in Figure 5(b). MR between loops L1 and L2 occurs, and two sets of newly reconnected loops L3 and L4 then appear; see Figure 5(c). The EUVI-A observations from another viewpoint further support that the downward motions of loops L1 represent the MR process between loops L1 and L2. As in the AIA 304 Å images, no associated coronal condensation is observed in the EUVI-A 304 Å images during the MR process.
Figure 5. MR between loops observed by STEREO-A early on 2012 January 16. (a) EUVI-A 171 Å and (b) and (c) 171 Å filtered images. The red and blue dotted lines in (b) and (c) outline loops L1 and L2, respectively. The FOV is indicated by the red box in Figure 2(b), and the EUVI-A images here are rotated clockwise at an angle of 35°. An animation of the unannotated 171 Å and 171 Å filtered images is available. It covers 16 hr starting at 04:14 UT on 2012 January 16, and the video duration is 2 hr. See Section 3.1 for details.
(An animation of this figure is available.)
Download figure:
Video Standard image High-resolution image3.2. Coronal Condensations Caused by MR Late on 2012 January 16
Similar to the observations in Section 3.1, in the data set from 2012 January 16 starting at ∼22:00 UT, another downward motion of loops L1 is identified in the AIA 171 Å images (see the animated version of Figure 6), with the formation of dips in loops L1; see Figure 6(a). The time slice of AIA 171 Å images in Figure 7(a) denotes the evident motion of loops L1 toward the solar surface—see the red dotted line—with a mean speed of 2.3 km s−1. Along with the downward motion of loops L1, an associated bright emission appears in the AIA 131 Å images; see Figures 6(c) and (d). As in Section 3.1, loops L1 in the AIA 131 Å channel show plasma with a lower characteristic temperature of ∼0.6 MK.
Figure 6. Coronal condensation caused by MR between loops observed by SDO late on 2012 January 16. (a) and (b) AIA 171 Å, (c) and (d) 131 Å, and (e) and (f) 304 Å images. The red and blue boxes AB and CD in (a) and (f) show the positions of the time slices of the AIA 171 Å and 304 Å images displayed in Figures 7(a) and (b), respectively. The green ellipses in (b), (d), and (e) enclose the condensation in (e). Position D1 and the purple arrow P1 in (b) denote the region where the condensation happens and the falling path of condensation, respectively. The green boxes in (b), (d), and (f) mark the regions for the light curves of the AIA 171 Å, 131 Å, and 304 Å channels, shown in Figure 7(c) separately by the red, green, and blue lines. The FOV is denoted by the green box in Figure 2(a), and the AIA images here are rotated counterclockwise at an angle of 30°. An animation of the unannotated SDO/AIA images is available. It covers 8 hr starting at 20:30 UT on 2012 January 16, and the video duration is 1 minute. See Section 3.2 for details.
(An animation of this figure is available.)
Download figure:
Video Standard image High-resolution image
Figure 7. Temporal evolution of the MR between loops and the coronal condensation late on 2012 January 16. Time slices of (a) AIA 171 Å and (b) 304 Å images separately along the AB and CD directions in the red and blue boxes in Figures 6(a) and (f). (c) Light curves of the AIA 171 Å (red line), 131 Å (green line), and 304 Å (blue line) channels in the green boxes in Figures 6(b), (d), and (f), respectively. The red and green dotted lines in (a) and (b) separately outline the motions of loops L1 and the condensation. The moving speeds are denoted by the numbers in (a) and (b). The red, green, and blue dotted lines in (c) mark the peaks of the AIA 171 Å, 131 Å, and 304 Å light curves, respectively. See Section 3.2 for details.
Download figure:
Standard image High-resolution imageDifferent from Section 3.1, a bright condensation appears in the AIA 304 Å images from ∼02:50 UT on 2012 January 17 (see Figure 6(e)) with the characteristic temperature of ∼0.05 MK. Cooling and condensation of coronal plasma take place. We overlay the condensation in Figure 6(e) on the AIA 171 Å and 131 Å images (see the green ellipses in Figures 6(b), (d), and (e)), and notice that it occurs at the right edge of the dips close to the loop footpoints, marked as position D1 (see Figure 6(b)). The condensation then falls down along the right leg of loops L1, marked by path P1 (see Figure 6(b)), to the solar surface as coronal rain; see Figure 6(f). Along the falling direction CD in the blue box in Figure 6(f), a time slice of the AIA 304 Å images is made and displayed in Figure 7(b). Several downflows of the condensation are identified, with a mean speed of ∼40 km s−1; see the green dotted line in Figure 7(b). The condensation, lasting for ∼1.3 hr, disappears after ∼04:10 UT.
In the green boxes in Figures 6(b), (d), and (f), light curves of the AIA 171 Å, 131 Å, and 304 Å channels are calculated, and plotted as the red, green, and blue lines in Figure 7(c), respectively. All three light curves first increase, reach the peaks, and then decrease. They, however, peak successively at 03:15, 03:21, and 03:35 UT on 2012 January 17; see the red, green, and blue dotted lines in Figure 7(c). The cooling and condensation process of coronal plasma is thus evidently detected. The coronal plasma cools down from ∼0.9 MK, the characteristic temperature of the AIA 171 Å channel, to ∼0.6 MK, the lower characteristic temperature of the AIA 131 Å channel, in 6 minutes, and then to ∼0.05 MK, the characteristic temperature of the AIA 304 Å channel, in another 14 minutes.
Coronal condensation caused by MR between loops late on 2012 January 16 is also observed by EUVI-A; see the animated version of Figure 8. The downward motion of loops L1 and the formation of dips are clearly detected in EUVI-A 171 Å images; see Figure 8(a). Observed from another viewpoint, the bright condensation appears in the EUVI-A 304 Å images at the left edge of the dips, position D1, and then falls down along the left leg of loops L1, path P1, to the solar surface; see Figures 8(a) and (b).
Figure 8. Coronal condensation caused by MR between loops observed by STEREO-A late on 2012 January 16. (a) EUVI-A 171 Å and (b) 304 Å images. Position D1 and the purple arrow P1 in (a) mark the region where the condensation happens and the falling path of condensation, respectively. The FOV is indicated by the green box in Figure 2(b), and the EUVI-A images here are rotated clockwise at an angle of 35°. An animation of the unannotated STEREO-A images is available. It covers 8 hr starting at 20:36 UT on 2012 January 16, and the video duration is 2 hr for the 171 Å channel and 10 minutes for the 304 Å channel. See Section 3.2 for details.
(An animation of this figure is available.)
Download figure:
Video Standard image High-resolution image3.3. Coronal Condensations Caused by MR on 2012 January 17
Similar to Sections 3.1 and 3.2, from ∼07:00 UT on 2012 January 17, loops L1 move toward the solar surface in the AIA 171 Å images. However, two dips in loops L1 form; see Figure 9(a). The red dotted line in the time slice of the AIA 171 Å images in Figure 10(a) outlines the downward motion of the higher-lying dips, with mean speed and acceleration of 5.3 km s−1 and 0.5 m s−2, respectively. As in Sections 3.1 and 3.2, an associated bright emission appears in the AIA 131 Å images and moves together with the AIA 171 Å loops toward the solar surface; see Figures 9(c) and (d).
Figure 9. Coronal condensations caused by MR between loops observed by SDO on 2012 January 17. (a) and (b) AIA 171 Å, (c) and (d) 131 Å, and (e)–(h) 304 Å images. The red, blue, green, and cyan boxes AB, CD, EF, and GH in (a), (f), and (g) separately mark the positions of the time slices of the AIA 171 Å, 304 Å, 304 Å, and 304 Å images displayed in Figures 10(a)–(d). The green and blue ellipses in (a), (c), and (e), and (b), (d), and (f) enclose the condensations in (e) and (f), respectively. Positions D1 and D2 and the purple arrows P1 and P2 in (a) and (b) mark the regions where the condensations happen and the falling paths of condensations, respectively. The blue boxes in (a), (c), and (e), and the pink boxes in (b), (d), and (f) separately show the regions for the light curves of the AIA 171 Å, 131 Å, and 304 Å channels displayed in Figures 10(e) and (f) by the red, green, and blue lines. The FOV is indicated by the purple box in Figure 2(a), and the AIA images here are rotated counterclockwise at an angle of 33°. An animation of the unannotated SDO/AIA images is available. It covers 15 hr starting at 07:00 UT on 2012 January 17, and the video duration is 1 minute. See Section 3.3 for details.
(An animation of this figure is available.)
Download figure:
Video Standard image High-resolution image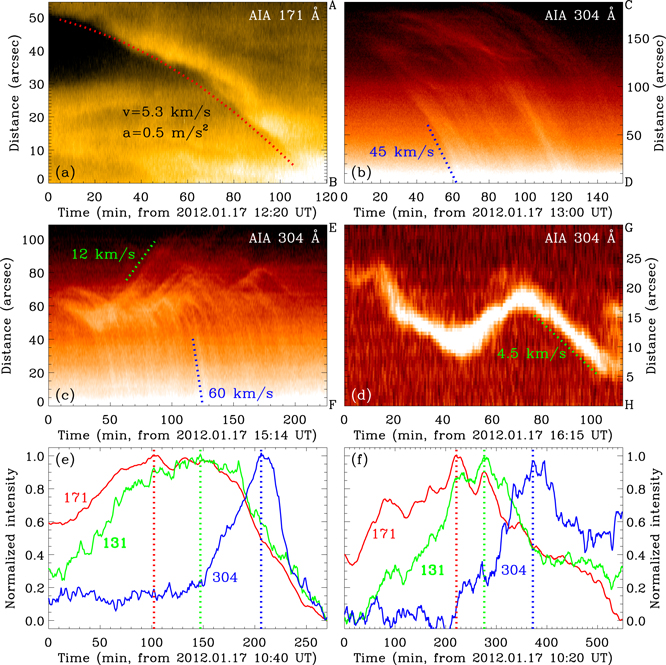
Figure 10. Temporal evolution of the MR between loops and the coronal condensations on 2012 January 17. Time slices of the (a) AIA 171 Å and (b)–(d) 304 Å images along the AB, CD, EF, and GH directions in the red, blue, green, and cyan boxes in Figures 9(a), (f), (g), and (g), respectively. Light curves of the AIA 171 Å (red line), 131 Å (green line), and 304 Å (blue line) channels in the blue (e) and pink (f) boxes separately in Figures 9(a), (c), and (e), and 9(b), (d), and (f). The red dotted line in (a) outlines the motion of loops L1. The blue and green dotted lines in (b)–(d) mark the motions of condensations. The moving speeds and acceleration are denoted by the numbers in (a)–(d). The red, green, and blue dotted lines in (e) and (f) denote the peaks of the AIA 171 Å, 131 Å, and 304 Å light curves, respectively. See Section 3.3 for details.
Download figure:
Standard image High-resolution imageA bright condensation appears in the AIA 304 Å images from ∼13:00 UT; see Figure 9(e) and the animated version of Figure 9. Similar to the observations in Section 3.2, it occurs at the right edge of the higher-lying dips, position D1 (see Figures 9(a) and (e)), and then falls down to the solar surface along the right leg of loops L1, path P1 (see Figures 9(a) and (f)). Multiple downflows of the condensation are identified, with a mean speed of ∼45 km s−1; see the blue dotted line in the time slice of the AIA 304 Å images in Figure 10(b). The condensation disappears after ∼15:30 UT, lasting for ∼2.5 hr.
From ∼14:03 UT, another bright condensation appears in the AIA 304 Å images, indicating another cooling and condensation process of coronal plasma; see Figure 9(f). We overlay this lower-lying condensation in Figure 9(f) on AIA 171 Å and 131 Å images (see the blue ellipses in Figures 9(b), (d), and (f)), and notice that the condensation takes place in the lower-lying dips, marked by position D2 (see Figure 9(b)). The condensation then falls down repeatedly to the solar surface, with a mean speed of ∼60 km s−1; see the blue dotted line in the time slice of the AIA 304 Å images in Figure 10(c). However, different from the higher-lying condensation in Figure 9(e), which moves along the right leg of loops L1, path P1, the lower-lying condensation penetrates through the dips, marked by path P2 (see Figures 9(b) and (g)). Moreover, the condensation moves upward with a mean speed of ∼12 km s−1; see the green dotted line in Figure 10(c). Aside from the downward and upward flows perpendicular to the solar surface, the condensation also moves parallel to the solar surface. Along the GH direction in the cyan box in Figure 9(g), we make another time slice of the AIA 304 Å images and illustrate it in Figure 10(d). The condensation sways back and forth, parallel to the solar surface, with a mean speed of ∼4.5 km s−1; see the green dotted line in Figure 10(d). It disappears after ∼19:03 UT, lasting for ∼5 hr.
After the disappearance of these two condensations, two other similar condensations take place at the right edge of the higher-lying dips, position D1, from ∼19:03 UT, and in the lower-lying dips, position D2, from ∼19:23 UT; see Figure 9(h). They then fall down to the solar surface separately along the right leg of loops L1, path P1, and across the dips, path P2, lasting for ∼57 and ∼30 minutes; see Table 2.
As in Section 3.2, the light curves of the AIA 171 Å, 131 Å, and 304 Å channels in Figure 10(e (f)) clearly show the cooling and condensation process of coronal plasma in the higher-lying (lower-lying) dips. They evolve similarly to those in Figure 7(c), but peak at 12:22 (14:01), 13:07 (14:56), and 14:06 (16:32) UT on 2012 January 17, respectively; see the red, green, and blue dotted lines in Figure 10(e (f)). The coronal plasma at the right edge (in the bottom) of the higher-lying (lower-lying) dips thus cools down from ∼0.9 MK to ∼0.6 MK in 45 (55) minutes, and then to ∼0.05 MK in another 59 (96) minutes.
Four coronal condensations caused by MR between loops on 2012 January 17 are also recorded by EUVI-A. From another viewpoint, similar evolutions of loops L1 and condensations are identified; see Figure 11 and its animated version.
Figure 11. Coronal condensations caused by MR between loops observed by STEREO-A on 2012 January 17. (a) and (b) EUVI-A 171 Å and (c) and (d) 304 Å images. Positions D1 and D2 and the purple arrows P1 and P2 in (a) mark the regions where the condensations happen and the falling paths of condensations, respectively. The FOV is denoted by the purple box in Figure 2(b), and the EUVI-A images here are rotated clockwise at an angle of 30°. An animation of the unannotated STEREO-A images is available. It covers 15 hr starting at 07:06 UT on 2012 January 17, and the video duration is 2 hr for the 171 Å channel and 10 minutes for the 304 Å channels, respectively. See Section 3.3 for details.
(An animation of this figure is available.)
Download figure:
Video Standard image High-resolution image3.4. Repeated Coronal Condensations Caused by MR from 2012 January 18 to 20
Similar to Sections 3.2 and 3.3, 10 more condensations caused by MR between loops repeatedly take place in the last three days from January 18 to 20. More details, e.g., the motions of loops L1, formations of dips, cooling and condensations of coronal plasma, and downflows of condensations, can be found in Table 2 and Appendices A–C.
On 2012 January 18, two condensations caused by MR occur (see more details in Appendix A). The first one appears in the lower-lying dips of loops L1, position D2; see Figures 12(a) and (g) in Appendix A. It is a weak one, and lasts a short ∼30 minutes. The second condensation takes place at the right edge of the higher-lying dips of loops L1, position D1; see Figures 12(b) and (h). It is a strong one, lasting ∼4 hr. Different from the condensations in Sections 3.2 and 3.3, the second condensation here falls down to the solar surface first along the right leg of loops L1, path P1, and then moves down toward the lower left across the dips, path P2; see Figures 12(b) and (i). From ∼06:00 UT on 2012 January 18, a lower-lying prominence erupts and pushes the higher-lying loops upward. The MR between loops and the condensations are then interrupted (see the animated version of Figure 12).
Figure 12. Coronal condensations caused by MR between loops observed by SDO on 2012 January 18. (a)–(c), (f) AIA 171Å, (d) and (e) 131Å, and (g)–(i) 304 Å images. The green and pink ellipses in (a), (d), and (g), and (b), (e), and (h) enclose the condensations in (g) and (h), respectively. Positions D2 and D1, and the blue and pink arrows P2 and P1 in (a) and (b), mark the regions where the condensations happen and the falling paths of the condensations, respectively. The red, blue, and green boxes AB, CD, and EF in (b) and (i) separately mark the positions of the time slices of the AIA 171 Å, 304 Å, and 304 Å images displayed in Figures 13(a)–(c). The blue boxes in (b), (e), and (h) show the regions for the light curves of the AIA 171 Å, 131 Å, and 304 Å channels displayed in Figure 13(d) by the red, green, and blue lines, respectively. The FOV is denoted by the cyan box in Figure 2(a), and the AIA images here are rotated counterclockwise at an angle of 35°. An animation of the unannotated SDO/AIA images is available. It covers 12 hr starting at 22:00 UT on 2012 January 17, and the video duration is 1 minute. See Appendix A for details.
(An animation of this figure is available.)
Download figure:
Video Standard image High-resolution imageThree condensations caused by MR happen on 2012 January 19 (see Appendix B for more details), among which the first one has been investigated in detail in Papers I and II. Different from the observations in previous sections, entire MR magnetic structures, i.e., loops L1, L2, L3, and L4, are clearly observed in the AIA 171 Å images; see Figure 15(a) in Appendix B. The second condensation occurs at the right edge of the higher-lying dips of loops L1, position D1, above the first condensation; see Figures 15(a) and (e). It then falls down to the solar surface both along the right leg of loops L1 and across the dips, paths P1 and P2; see Figures 15(a) and (g). Moreover, three peaks are evidently identified for each light curve of the AIA 171 Å, 131 Å, and 304 Å channels; see the black, purple, and pink diamonds in Figure 16(b). Three cooling and condensation processes of coronal plasma are thus observed. The third condensation appears in the dips of loops L1, position D2—see Figures 15(b) and (f)—and also moves along both paths P1 and P2 to the solar surface (see the animated version of Figure 15).
On 2012 January 20, five condensations caused by MR take place (see more details in Appendix C). The first one appears at the right edge of the dips in loops L1, position D1 (see Figures 17(a) and (c)) in Appendix C. It rains down across the dips, path P2, see Figures 17(a) and (d). It also floats to the right and then to the left parallel to the solar surface, due to the evolution of loops L1 (see the animated version of Figure 17). Four other condensations occur in the dips of loops L1, position D2, and rain down to the solar surface across the dips, path P2; see Figures 19(a) and (c) in Appendix C. Among these four condensations, the first and third ones are weak ones, while the second and fourth ones are large ones. These two large condensations fall down along a curved trajectory, see Figures 19(i) and (l). Aside from the downflows, the two condensations also move upward and then fall back; see the blue dotted and dashed lines in Figure 20(b) in Appendix C. Moreover, several upward ejections are also detected, one of which is marked by a cyan arrow in Figure 20(b).
4. Summary and Discussion
In this study, we analyzed a structure of a loop system undergoing MR over the course of five days. In Sections 3.1–3.4 and Appendices A–C, we concentrated on six different periods to investigate the presence of dips forming in loops L1 that lead to MR and condensations. For these cases, we find the following features.
In all cases, we find that the open loops L1 form a dip, and the time evolution shows an MR with the closed loops L2, as worked out in Papers I and II. These dips move down with a projected speed of 2 km s−1 to 8 km s−1; see Table 2. These speeds are smaller than the inflow speeds to the MR region found by Narukage & Shibata (2006), Li & Zhang (2009b), and Takasao et al. (2012). This might be indicative of a smaller MR rate for the data sets we investigated here. Often, we also see indications of an X-type structure (e.g., Figure 5(b)), which further supports the MR scenario. But we clearly do not see the lower-lying loops L2 below the MR region or loops L3 and L4, which result from the MR in the AIA, in all cases. In some cases where we could not identify loops L2 to L4 in the AIA, we turned to STEREO observations to trace them (see Table 1).
We find condensations in almost all cases except for one (Sections 3.2–3.4 and Appendices A–C; see Table 2). The condensation in that exceptional case (Section 3.1) might be prohibited by one or more of the following reasons: (1) the MR between loops stops, interrupting the cooling process, or (2) the cooling plasma flows to the solar surface along loops, before the plasma further cools and condenses to ∼0.05 MK, the characteristic temperature of the AIA 304 Å channel, or (3) the emission from the condensing plasma is not sufficient enough to be observed in the AIA 304 Å images, even if the plasma cools down to ∼0.05 MK.
Coronal condensation preferentially occurs at two positions (see Table 2), namely, at the edge of the dips (D1), close to the loop endpoints (Sections 3.2–3.4 and Appendices A–C), and directly in the dips (D2; Sections 3.3 and 3.4 and Appendices A–C). At these two positions, the plasma is denser and can be disturbed easily by the MR through magnetic field topological changes and propagating disturbances. Then, it is gathered and catastrophically cools. The cooling plasma can be easily supported at these two positions by their dipped magnetic structures. The condensations at the edge of the dips, position D1, appear to be larger than those within the dips, position D2 (Sections 3.3 and 3.4 and Appendix A). This reveals that more mass is distributed at the edge of the dips close to the endpoints of loops.
Cooling of plasma is found in all cases. By investigating the light curves, we find in all cases that the increased brightening peaks first in the AIA 171 Å channel (∼0.9 MK), then in the AIA 131 Å channel (∼0.6 MK), and finally in the AIA 304 Å channel (∼0.05 MK). Even in the case where we do not see the condensation in the AIA 304 Å images, we still see the AIA 131 Å channel peaking after the AIA 171 Å channel; see Section 3.1. Although the time delays between the channels in the different cases are different and the shape of the light curves is not the same, we find a consistent pattern of the ordering in time from AIA 171 Å to 131 Å and 304 Å, showing the cooling of the plasma. The cooling time (or time delays between peaks of different channels) ranges from 6 minutes to more than 60 minutes from AIA 171 Å to 131 Å (i.e., 0.9 MK to 0.6 MK) and from 3 minutes to 190 minutes to then cool from AIA 131 Å to 304 Å (i.e., to 0.05 MK); see Table 2. This is comparable to our Papers I and II and to Vashalomidze et al. (2015), but smaller than that in Berger et al. (2012) and Liu et al. (2012). A wide range of timescales is to be expected, in particular because of the density and temperature around the condensation regions.
The condensations that form in association with the MR process fall down along the field lines, mostly in repeated downflows with speeds of the order of 10 km s−1 to 100 km s−1 (see Table 2), which is consistent with previous observations (Schrijver 2001; de Groof et al. 2005; Zhang & Li 2009; Antolin et al. 2012, 2015; Vashalomidze et al. 2015). In at least one case (Figure 10(d)), we also find that field lines channeling these downflows sway back and forth, producing Alfvénic disturbance. The amplitude of this swaying in real space is of the order of 10'' with a velocity amplitude of the order of 5 km s−1.
The coronal condensation falls down repeatedly to the solar surface along two paths (see Table 2), namely, along the legs of the loops (P1; Sections 3.2–3.4 and Appendices A and B) and across the dips (P2; Sections 3.3 and 3.4 and Appendices A–C). The condensations are also channeled into both paths in the same event (Appendices A and B). Path P1 is similar to that of the coronal rain forming in closed loops (Schrijver 2001; Müller et al. 2003, 2004; Antolin et al. 2012; Fang et al. 2013), and the combination of both paths P1 and P2 is consistent with Paper I, i.e., along the two legs of the newly reconnected loops L4. The falling path depends on the position where the coronal condensation occurs and the evolution of the field lines supporting the condensation. Because the MR between loops leads to the condensation of hotter coronal plasma and its downflows, it plays a significant role in the mass cycle of coronal plasma.
In Paper I, we proposed a new and alternative formation mechanism for coronal rain due to MR along open field lines, quite different from the concept of loss of thermal equilibrium suggested for magnetically closed loops (Schrijver 2001; Müller et al. 2003, 2004; Antolin et al. 2012; Fang et al. 2013). In this study, we find further support for this alternative formation mechanism playing a role, too. Most recently, Mason et al. (2019) studied three more cases of coronal condensations caused by interchange MR that further supports our new coronal rain formation mechanism.
Aside from downflows, other kinetics of the coronal condensation are observed. Upward motions of the condensation are detected in the dips in loops L1, with mean speeds of 9 km s−1 to 15 km s−1; see Sections 3.3 and 3.4 and Appendix C. These upflows may represent the condensations of coronal plasma appearing sequentially from lower- to higher-lying dips. Moreover, aside from downward and upward motions perpendicular to the solar surface, motions of the condensation parallel to the solar surface are identified; see Sections 3.3 and 3.4 and Appendix C. The motions of these condensations parallel to the solar surface may be guided by the evolution of the field that supports the condensation.
Transient prominences form repeatedly due to MR between loops. Because of the downward motions toward the MR region, magnetic dips in the higher-lying loops form; see Sections 3.1–3.4 and Appendices A–C. The magnetic field topological changes, and also the propagating disturbances, caused by MR trigger the thermal instability in the plasma in the dips, where cooling and condensation of coronal plasma then take place. Coronal condensations supported by dipped magnetic structures indicate the formation of prominences. However, different from previous prominence formation models (Pneuman 1983; van Ballegooijen & Martens 1989; Kaneko & Yokoyama 2015, 2017), only magnetic dips, rather than helical structures, are formed due to the MR between loops. The condensations in the dips in the loops, therefore, may be similar to the normal-polarity prominences with a sheared arcade magnetic configuration, rather than to the inverse-polarity prominences with a flux rope configuration (Ouyang et al. 2017). The condensations fall down to the solar surface as coronal rains and last for 30 minutes to 15 hr in the corona; see Sections 3.2–3.4, Appendices A–C, and Table 2. They thus represent transient prominences.
Aside from our results in Papers I and II and the extended analyses presented in this work, 79 similar events of coronal condensations caused by MR between loops are identified in the month of 2012 January alone at different positions and times above the solar limb; see Appendix D and Table 3 in the Appendix. Among them are three cases displayed in Figure 21; see Appendix D for more details. More studies are needed in the future. Furthermore, similar events in 2013 October above the southeastern solar limb are investigated (L. Li et al. 2019, in preparation), which also illustrate repeated coronal condensations and MR between loops. Based on these results, we suggest that the condensations initiated by the interchange MR of the legs of long (open) loops with more compact (closed) loops are a common feature in the corona. These dips and MRs resulting in the formation of condensations represent a general process commonly seen in the solar corona. This has an impact on our understanding of the formation of solar prominences and coronal rains.
Table 3. Other Similar Events of Coronal Condensations Caused by Magnetic Reconnection between Loops above the Solar Limb in 2012 January
| Number | Date | Time (UT) | Position |
|---|---|---|---|
| 1 | Jan 1 | 00:30 | N20 E90 |
| 2 | Jan 1 | 18:36 | S05 W90 |
| 3 | Jan 1 | 19:10 | N30 W90 |
| 4 | Jan 1 | 20:30 | S10 W90 |
| 5 | Jan 2 | 00:30 | S05 W90 |
| 6 | Jan 2 | 04:05 | N30 E90 |
| 7 | Jan 2 | 09:05 | N20 E90 |
| 8 | Jan 2 | 14:00 | S05 W90 |
| 9 | Jan 3 | 01:30 | N20 E90 |
| 10 | Jan 3 | 11:10 | N00 E90 |
| 11 | Jan 3 | 13:55 | S20 E90 |
| 12 | Jan 4 | 04:20 | N20 E90 |
| 13 | Jan 4 | 15:05 | S15 E90 |
| 14 | Jan 4 | 18:10 | S10 W90 |
| 15 | Jan 5 | 00:30 | N10 W90 |
| 16 | Jan 5 | 07:40 | S10 W90 |
| 17 | Jan 5 | 09:06 | S05 W90 |
| 18 | Jan 5 | 14:10 | S05 W90 |
| 19 | Jan 6 | 05:02 | N05 W90 |
| 20 | Jan 6 | 08:38 | S10 W90 |
| 21 | Jan 6 | 13:40 | S05 W90 |
| 22a | Jan 7 | 02:44 | S10 W90 |
| 23 | Jan 7 | 05:25 | S20 W90 |
| 24 | Jan 7 | 13:24 | S05 W90 |
| 25 | Jan 7 | 17:14 | N40 W90 |
| 26 | Jan 7 | 19:59 | S10 W90 |
| 27 | Jan 8 | 01:40 | S10 W90 |
| 28 | Jan 8 | 11:30 | S40 W90 |
| 29 | Jan 9 | 03:35 | S40 W90 |
| 30 | Jan 9 | 07:40 | S30 W90 |
| 31 | Jan 10 | 05:30 | N40 E90 |
| 32 | Jan 10 | 07:26 | N40 E90 |
| 33 | Jan 10 | 10:18 | S10 E90 |
| 34 | Jan 10 | 14:08 | S10 E90 |
| 35a | Jan 10 | 14:40 | N40 E90 |
| 36 | Jan 10 | 22:30 | N60 W90 |
| 37 | Jan 11 | 03:20 | N60 W90 |
| 38a | Jan 11 | 12:18 | N30 W90 |
| 39 | Jan 11 | 21:33 | S15 W90 |
| 40 | Jan 12 | 11:58 | N40 W90 |
| 41 | Jan 12 | 17:05 | S10 W90 |
| 42 | Jan 13 | 00:43 | N40 W90 |
| 43 | Jan 13 | 11:58 | S05 W90 |
| 44 | Jan 14 | 00:00 | N40 W90 |
| 45 | Jan 14 | 21:47 | N49 E90 |
| 46 | Jan 15 | 10:18 | N40 E90 |
| 47 | Jan 15 | 22:31 | S10 E90 |
| 48 | Jan 16 | 22:30 | N10 E90 |
| 49 | Jan 17 | 11:30 | S30 E90 |
| 50 | Jan 17 | 22:02 | S50 W90 |
| 51 | Jan 18 | 05:45 | S50 W90 |
| 52 | Jan 19 | 13:40 | S20 W90 |
| 53 | Jan 19 | 18:10 | S10 E90 |
| 54 | Jan 20 | 10:18 | S10 E90 |
| 55 | Jan 20 | 10:46 | N05 E90 |
| 56 | Jan 20 | 15:48 | S20 W90 |
| 57 | Jan 21 | 03:50 | N05 E90 |
| 58 | Jan 21 | 05:30 | S20 W90 |
| 59 | Jan 21 | 11:30 | S10 E90 |
| 60 | Jan 22 | 03:50 | N40 E90 |
| 61 | Jan 22 | 16:17 | S10 E90 |
| 62 | Jan 22 | 15:05 | S20 W90 |
| 63 | Jan 23 | 11:26 | S20 W90 |
| 64 | Jan 23 | 12:52 | N60 W90 |
| 65 | Jan 23 | 17:25 | N20 W90 |
| 66 | Jan 24 | 12:56 | S10 W90 |
| 67 | Jan 24 | 17:44 | N05 E90 |
| 68 | Jan 25 | 21:47 | N80 E90 |
| 69 | Jan 26 | 06:43 | N20 W90 |
| 70 | Jan 27 | 15:46 | S10 E90 |
| 71 | Jan 28 | 23:14 | N40 E90 |
| 72 | Jan 28 | 23:44 | N15 W90 |
| 73 | Jan 29 | 05:14 | N45 E90 |
| 74 | Jan 29 | 08:14 | S20 E90 |
| 75 | Jan 29 | 08:44 | N10 W90 |
| 76 | Jan 30 | 01:20 | S55 E90 |
| 77 | Jan 30 | 19:29 | N02 E90 |
| 78 | Jan 31 | 02:00 | N20 W90 |
| 79 | Jan 31 | 02:45 | N60 E90 |
Notes. The third column shows the time when loops L1 and coronal condensations are simultaneously observed in AIA 171 Å and 304 Å images, respectively.
aThe events displayed in Figure 21.We thank the anonymous referee for helpful comments. The authors are indebted to the SDO and STEREO teams for providing the data. The work is supported by the National Natural Science Foundations of China (11673034, 11533008, 11790304, and 11773039) and the Basic Frontier Scientific Research Programs (ZDBS-LY-SLH013) and Key Programs (QYZDJ-SSW-SLH050) of the Chinese Academy of Sciences. L.P.C. received funding from the European Union's Horizon 2020 Research and Innovation Programme under the Marie Skłodowska-Curie grant agreement No. 707837. This project is supported by the Specialized Research Fund for Shandong Provincial Key Laboratory.
Appendix A: Coronal Condensations Caused by MR on 2012 January 18
From ∼22:00 UT on 2012 January 17, loops L1 move downward, and dips in loops L1 form; see Figure 12(a) in the Appendix. Along the AB direction in the red box in Figure 12(b), a time slice of AIA 171 Å images is made and shown in Figure 13(a) in the Appendix. It indicates that loops L1 move toward the solar surface, with a mean speed of 8 km s−1; see the red dotted line in Figure 13(a). The moving loops L1 meet the lower-lying loops L2, and reconnect with them; see Figure 12(c). Two sets of newly reconnected loops L3 and L4 then appear; see the animated version of Figure 12. Associated with the motion of AIA 171 Å loops, bright emission appears in the AIA 131 Å images and moves together with the loops; see Figures 12(d) and (e). As in Sections 3.1–3.3, the AIA 131 Å emission shows plasma cooler cooler (∼0.6 MK) than the plasma of the AIA 171 Å (∼0.9 MK) loops.
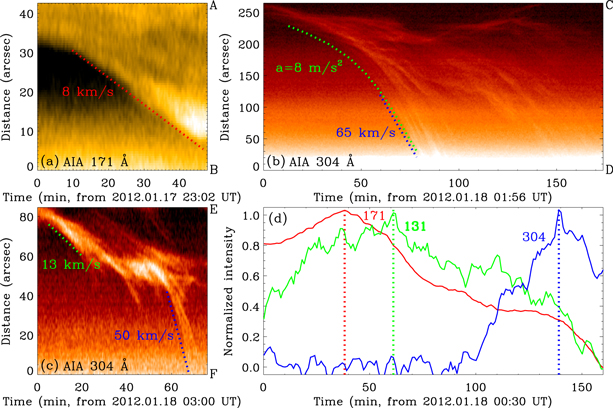
Figure 13. Temporal evolution of the MR between the loops and coronal condensations on 2012 January 18. Time slices of the (a) AIA 171 Å and (b) and (c) 304 Å images along the AB, CD, and EF directions separately in the red, blue, and green boxes in Figures 12(b), (i), and (i). (d) Light curves of the AIA 171 Å (red line), 131 Å (green line), and 304 Å (blue line) channels in the blue boxes in Figures 12(b), (e), and (h). The red dotted line in (a) outlines the motion of loops L1, and the green and blue dotted lines in (b) and (c) illustrate the motions of the condensations. The moving speeds and acceleration are denoted by the numbers in (a)–(c). The red, green, and blue dotted lines in (d) mark the peaks of the AIA 171 Å, 131 Å, and 304 Å light curves, respectively. See Appendix A for details.
Download figure:
Standard image High-resolution imageA weak bright condensation appears from ∼01:12 UT on 2012 January 18 (see Figure 12(g)) and lasts for a short ∼30 minutes. It takes place in the lower-lying dips of loops L1, position D2 (see Figure 12(a)); see the green ellipses in Figures 12(a), (d), and (g). Later, from ∼01:55 UT, another large bright condensation appears in the AIA 304 Å images (see Figure 12(h)) at the right edge of the higher-lying dips, position D1 (see Figure 12(b); see the pink ellipses in Figures 12(b), (e), and (h)). It first falls down to the solar surface along the right leg of loops L1, path P1 (see Figure 12(b)), and then moves down toward the lower left, penetrating through the dips, path P2 (see Figure 12(a); see the blue and green boxes CD and EF in Figure 12(i), respectively). Along the CD direction in the blue box in Figure 12(i), a time slice of AIA 304 Å images is made, displayed in Figure 13(b). It shows that the condensation falls repeatedly along loops L1 with mean acceleration and speed of ∼8 m s−2 and ∼65 km s−1, respectively; see the green and blue dotted lines in Figure 13(b). We make another time slice of the AIA 304 Å images along the EF direction in the green box in Figure 12(i) and illustrate it in Figure 13(c). Here, the condensation first moves slowly with a mean speed of 13 km s−1, and then falls rapidly with a mean speed of 50 km s−1; see the green and blue dotted lines in Figure 13(c). It disappears after ∼05:55 UT, lasting for ∼4 hr.
In the blue boxes in Figures 12(b), (e), and (h), we calculate the light curves of the AIA 171 Å, 131 Å, and 304 Å channels and display them separately in Figure 13(d) with the red, green, and blue lines. Similar to previous results in Sections 3.2 and 3.3, these three light curves increase first, reach their peaks, and then decrease. They, however, peak at 01:08, 01:31, and 02:49 UT on 2012 January 18, respectively; see the red, green, and blue dotted lines in Figure 13(d). The cooling and condensation process of coronal plasma is thus clearly identified. The coronal plasma cools down from ∼0.9 MK to ∼0.6 MK in 23 minutes, and then to ∼0.05 MK in another 78 minutes.
From ∼06:00 UT on 2012 January 18, a lower-lying prominence slowly erupts, with a mean speed of ∼15 km s−1. The erupting prominence pushes the higher-lying loops, and also the dips, upward; see Figure 12(f). The MRs between the loops and the coronal condensations are then interrupted.
Coronal condensations caused by MR between loops on 2012 January 18 are also detected in EUVI-A images. Loops L1, with dips, move downward; see Figures 14(a) and (b) in the Appendix. A weak condensation appears in the lower-lying dips, position D2, and another large condensation occurs at the left edge of loops L1, position D1 (see Figure 14(a) and Figure 14(c)). The large condensation falls down to the solar surface, first along the left leg of loops L1, path P1 (see Figure 14(b)), and then across the dips, path P2 (see Figure 14(b)); see Figure 14(d). The eruption of lower-lying prominence is also observed, interrupting the MR between the loops and the coronal condensations; see the animated version of Figure 14.
Figure 14. Coronal condensations caused by MR between loops observed by STEREO-A on 2012 January 18. (a) and (b) EUVI-A 171 Å and (c) and (d) 304 Å images. Position D1 in (a) marks the region where the condensation happens, and the pink arrows P1 and P2 in (b) denote the falling paths of the condensations, respectively. The FOV is denoted by the cyan box in Figure 2(b), and the EUVI-A images here are rotated clockwise at an angle of 30°. An animation of the unannotated STEREO-A images is available. It covers 12 hr starting at 22:06 UT on 2012 January 17, and the video duration is 2 hr for the 171 Å channel and 10 minutes for the 304 Å channels, respectively. See Appendix A for details.
(An animation of this figure is available.)
Download figure:
Video Standard image High-resolution imageAppendix B: Coronal Condensations Caused by MR Late on 2012 January 19
In Papers I and II, coronal condensations caused by MR between loops on 2012 January 19 have been reported, and more details from 00:00 UT to 10:00 UT are described; see Table 2. In this paper, we pay more attention to the MR between the loops and the coronal condensations after 10:00 UT.
From ∼10:00 UT, the higher part of loops L1 moves downward, forming higher-lying dips, and reconnects with loops L2. Two sets of newly reconnected loops, L3 and L4, then form; see Figure 15(a) in the Appendix. Associated bright emission is detected in the AIA 131 Å images; see Figure 15(c). As in Sections 3.1–3.3 and Appendix A, the AIA 131 Å emission shows plasma with a lower characteristic temperature (∼0.6 MK). From ∼12:00 UT, a higher-lying bright condensation appears (see Figure 15(e)) above the lower-lying condensation, which occurs from ∼05:05 UT; see Paper I. It takes place at the right edge of the higher-lying dips, position D1 (see Figure 15(a); see the green ellipses in Figures 15(a), (c), and (e)). Cooling and condensation of coronal plasma thus happen. The condensation falls down along both legs of loops L4, paths P1 and P2 (see Figure 15(a); see the blue box AB and cyan arrow in Figure 15(g)). It disappears after ∼19:40 UT, lasting for ∼7.7 hr. Thereafter, the lower-lying condensation (Figures 15(e) and (g)) disappears after ∼20:40 UT, lasting for ∼15.6 hr.
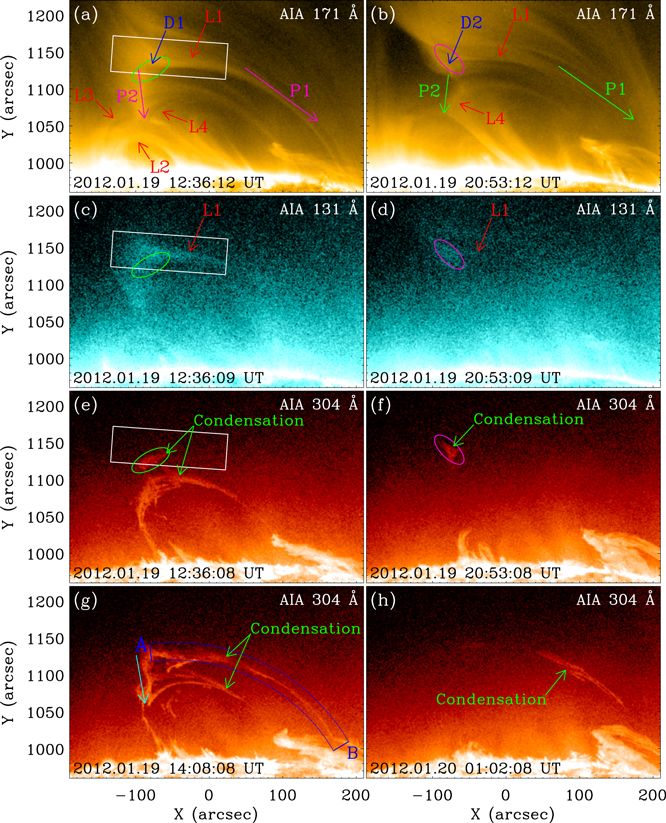
Figure 15. Coronal condensations caused by MR between loops observed by SDO late on 2012 January 19. (a) and (b) AIA 171 Å, (c) and (d) 131 Å, and (e)–(h) 304 Å images. The green and pink ellipses separately in (a), (c), and (e), and (b), (d), and (f) enclose the condensations in (e) and (f). Positions D1 and D2 and the pink and green arrows P1 and P2 in (a) and (b) mark the regions where the condensations happen and the falling paths of condensations, respectively. The white boxes in (a), (c), and (e) mark the regions for the light curves of the AIA 171 Å, 131 Å, and 304 Å channels displayed in Figure 16(b) with the red, green, and blue lines, respectively. The blue box AB in (g) shows the position of the time slice of the AIA 304 Å images displayed in Figure 16(a). The cyan arrow in (g) denotes the direction of movement of the condensation. The FOV is marked by the blue box in Figure 2(a), and the AIA images here are rotated counterclockwise at an angle of 42°. See Appendix B for details.
Download figure:
Standard image High-resolution imageAlong the AB direction in the blue box in Figure 15(g), a time slice of the AIA 304 Å images is made and displayed in Figure 16(a) in the Appendix. It indicates that the condensation falls down repeatedly with a mean speed of ∼75 km s−1; see the green dotted line in Figure 16(a). In the white boxes in Figures 15(a), (c), and (e), the light curves of the AIA 171 Å, 131 Å, and 304 Å channels are calculated and shown separately in Figure 16(b) with the red, green, and blue lines. Similar to the previous results, the three light curves increase first, reach their peaks, and then decrease. However, three peaks are identified for each light curve, i.e., the AIA 171 Å, 131 Å, and 304 Å light curves separately peak at 11:03, 11:39, and 12:19 UT, 11:38, 12:19, and 12:50 UT, and 13:51, 14:11, and 14:29 UT; see the black, purple, and pink diamonds in Figure 16(b) in Appendix B. Three cooling and condensation processes are hence identified. The coronal plasma at the right edge of the higher-lying dips thus cools from ∼0.9 MK to ∼0.6 MK in 35, 40, and 31 minutes, and then to ∼0.05 MK in another 133, 112, and 99 minutes, respectively.
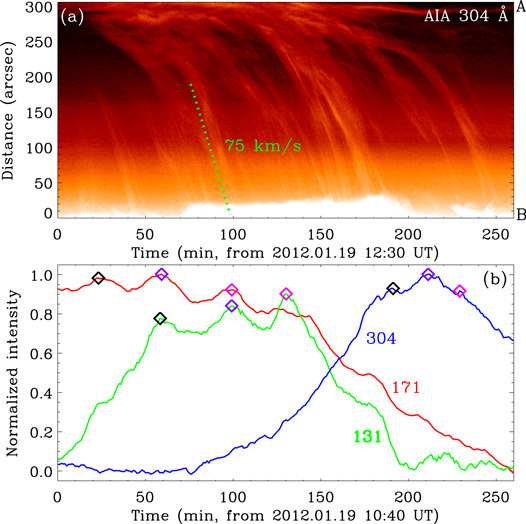
Figure 16. Temporal evolution of the coronal condensation late on 2012 January 19. (a) Time slice of AIA 304 Å images along the AB direction in the blue box in Figure 15(g). (b) Light curves of the AIA 171 Å (red line), 131 Å (green line), and 304 Å (blue line) channels in the white boxes in Figures 15(a), (c), and (e). The green dotted line in (a) outlines the motion of condensation, with a mean speed of 75 km s−1. The black, purple, and pink diamonds in (b) separately mark three peaks of the AIA 171 Å, 131 Å, and 304 Å light curves. See Appendix B for details.
Download figure:
Standard image High-resolution imageFrom ∼19:40 UT, another condensation, enclosed by a pink ellipse in Figure 15(f), appears in the dips of loops L1, position D2 (see Figure 15(b); see the pink ellipses in Figures 15(b) and (d)). It falls down repeatedly along both legs of loops L4, paths P1 and P2 (see Figures 15(b) and (h)), similar to the previous condensation in Figures 15(e) and (g). The condensation disappears after ∼02:30 UT on 2012 January 20, lasting for ∼6.8 hr.
Appendix C: Coronal Condensations Caused by MR on 2012 January 20
From ∼03:00 UT on 2012 January 20, loops L1 move down toward the solar surface, forming dips in loops L1; see Figure 17(a). Along the AB direction in the red box in Figure 17(a), a time slice of the AIA 171 Å images is made and shown in Figure 18(a) in the Appendix. Two evident motions of loops L1 are identified, with mean speeds of 3.5 km s−1; see the red dotted lines in Figure 18(a). Along with the downward motions of loops L1, associated bright emission appears in the AIA 131 Å images, showing plasma with the lower characteristic temperature of ∼0.6 MK; see Figure 17(b). It moves downward together with the AIA 171 Å loops.
Figure 17. Coronal condensation caused by MR between loops observed by SDO early on 2012 January 20. (a) AIA 171 Å, (b) 131 Å, and (c) and (d) 304 Å images. The green ellipses in (a)–(c) enclose the condensation in (c). Position D1 and the cyan arrow P2 in (a) mark the region where the condensation happens and the falling path of condensation, respectively. The red and green boxes AB and CD in (a) and (d) separately mark the positions of the time slices of AIA 171 Å and 304 Å images displayed in Figures 18(a) and (b). The pink boxes in (a)–(c) show the regions for the light curves of the AIA 171 Å, 131 Å, and 304 Å channels displayed in Figure 18(c) with the red, green, and blue lines, respectively. The FOV is denoted by the pink box in Figure 2(a), and the AIA images here are rotated counterclockwise at an angle of 43°. An animation of the unannotated SDO/AIA images is available. It covers 6.5 hr starting at 03:00 UT on 2012 January 20, and the video duration is 1 minute. See Appendix C for details.
(An animation of this figure is available.)
Download figure:
Video Standard image High-resolution image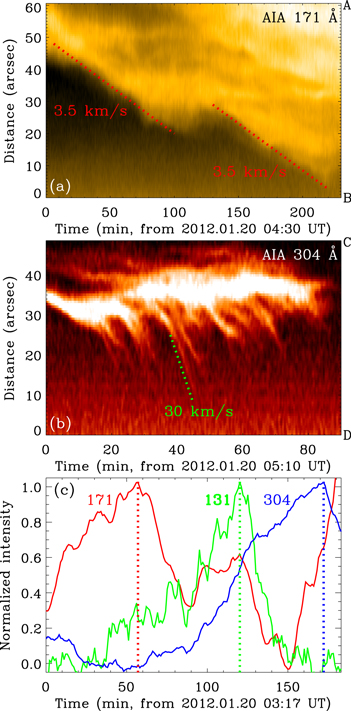
Figure 18. Temporal evolution of the MR between loops and the coronal condensation early on 2012 January 20. Time slices of the (a) AIA 171 Å and (b) 304 Å images separately along the AB and CD directions in the red and green boxes in Figures 17(a) and (d). (c) Light curves of the AIA 171 Å (red line), 131 Å (green line), and 304 Å (blue line) channels in the pink boxes in Figures 17(a)–(c). The red and green dotted lines in (a) and (b) outline motions of the loops L1 and the condensation. The moving speeds are denoted by the numbers in (a) and (b). The red, green, and blue dotted lines in (c) mark the peaks of the AIA 171 Å, 131 Å, and 304 Å light curves, respectively. See Appendix C for details.
Download figure:
Standard image High-resolution imageFrom ∼04:27 UT, a bright condensation is observed in the AIA 304 Å images; see Figure 17(c). It appears at the right edge of the dips, position D1 (see Figure 17(a); see the green ellipses in Figures 17(a)–(c)). Cooling and condensation of coronal plasma happen. The condensation rains down (Figure 17(d)) and floats to the right and then to the left parallel to the solar surface, with a mean speed of 9 km s−1, due to the evolution of loops L1. Along the CD direction in the green box in Figure 17(d), a time slice of AIA 304 Å images is made, and it is displayed in Figure 18(b). It shows many coronal rains with a mean speed of ∼30 km s−1; see the green dotted line in Figure 18(b). The condensation disappears after ∼09:10 UT, lasting for ∼4.7 hr; see the animated version of Figure 17.
In the pink boxes in Figures 17(a)–(c), light curves of the AIA 171 Å, 131 Å, and 304 Å channels are calculated and illustrated in Figure 18(c) by the red, green, and blue lines, respectively. Similar to previous results, the three light curves first increase, reach their peaks, and then decrease. They peak separately at 04:14, 05:17, and 06:09 UT; see the red, green, and blue dotted lines in Figure 18(c). The cooling and condensation process of coronal plasma is evidently identified. The coronal plasma cools down from ∼0.9 MK to ∼0.6 MK in 63 minutes, and then to ∼0.05 MK in another 52 minutes.
Loops L1 continue to move downward, with the formation of dips, and reconnect with loops L2; see Figure 19(a) The appearance of two sets of newly reconnected loops, L3 and L4, is then identified in the AIA 171 Å images; see Figure 19(b) and the animated version of Figure 19. Along the AB direction in the green box in Figure 19(b), we make a time slice of the AIA 171 Å images and show it in Figure 20(a) in the Appendix. Multiple motions of loops L1 are identified, with a mean speed of 4 km s−1; see the red dotted lines in Figure 20(a). Bright emission, associated with the AIA 171 Å loops, is detected in the AIA 131 Å images (see Figures 20(d)–(f)), showing plasma with the lower characteristic temperature of ∼0.6 MK.
Figure 19. Coronal condensations caused by MR between loops observed by SDO late on 2012 January 20. (a)–(c) AIA 171 Å, (d)–(f) 131 Å, and (g)–(l) 304 Å images. The red, green, pink, and cyan ellipses in (a), (c), (d), (f), (g), (h), (j), and (k) enclose the condensations in (g), (h), (j), and (k), respectively. Positions D2 and the purple arrows P2 in (a) and (c) mark the regions where the condensations happen and the falling paths of condensations, respectively. The pink, red, and green boxes in (a), (d), and (g); (b), (e), and (h); and (c), (f), and (k) separately enclose the regions for the light curves of the AIA 171 Å, 131 Å, and 304 Å channels shown in Figures 20(c), (d), and (e) by the red, green, and blue lines. The green and blue boxes AB and CD in (b) and (i) mark the positions of the time slices of the AIA 171 Å and 304 Å images displayed in Figures 20(a) and (b). The FOV is denoted by the pink box in Figure 2(a), and the AIA images here are rotated counterclockwise at an angle of 43°. An animation of the unannotated SDO/AIA images is available. It covers 17.5 hr starting at 09:30 UT on 2012 January 20, and the video duration is 1 minute. See Appendix C for details.
(An animation of this figure is available.)
Download figure:
Video Standard image High-resolution image
Figure 20. Temporal evolution of the MR between loops and the coronal condensations late on 2012 January 20. Time slices of (a) AIA 171 Å and (b) 304 Å images separately along the AB and CD directions in the green and blue boxes in Figures 19(b) and (i). (c)–(e) Light curves of the AIA 171 Å (red line), 131 Å (green line), and 304 Å (blue line) channels in the (c) pink, (d) red, and (f) green boxes in Figures 19(a), (d), and (g); 19(b), (e), and (h); and 19(c), (f), and (k), respectively. The red, blue, and green dotted and dashed lines in (a) and (b) outline motions of loops L1 and the condensations. The moving speeds are denoted by the numbers in (a) and (b). The red, green, and blue dotted lines in (c)–(e) separately mark the peaks of the AIA 171 Å, 131 Å, and 304 Å light curves. The black ellipses in (b) and (e) mark the evolution of the condensation in Figure 19(j). The pink diamond in (e) shows the peak of the AIA 304 Å light curve associated with the condensation in Figure 19(j). See Appendix C for details.
Download figure:
Standard image High-resolution imageFrom ∼16:05 UT, a small bright condensation appears in the AIA 304 Å images; see Figure 19(g). It takes place in the dips of loops L1, position D2 (see Figure 19(a); see the red ellipses in Figures 19(a), (d), and (g)), and floats to the left, lasting for ∼45 minutes. In the pink rectangles in Figures 19(a), (d), and (g), light curves of the AIA 171 Å, 131 Å, and 304 Å channels are calculated and displayed in Figure 20(c) separately by red, green, and blue lines. Similar to the previous results, these three light curves increase first, reach the peaks, and then decrease. They peak at 13:00, 13:20, and 16:30 UT, respectively; see the red, green, and blue dotted lines in Figure 20(c). The cooling and condensation process of coronal plasma is evidently detected. The coronal plasma in the dips of loops L1 hence cools down from ∼0.9 MK to ∼0.6 MK in 20 minutes, and then to ∼0.05 MK in another 190 minutes.
From ∼16:55 UT, a large higher-lying condensation appears in the AIA 304 Å images (see Figure 19(h)) in the dips of loops L1, position D2 (see Figure 19(a); see the green ellipses in Figures 19(a), (d), and (h)). It falls down to the solar surface along a curved trajectory across the dips, path P2 (see Figure 19(a) and Figure 19(i)). Along the CD direction in the blue box in Figure 19(i), a time slice of AIA 304 Å images is made and displayed in Figure 20(b). It shows many downflows of the condensation with a mean speed of ∼65 km s−1; see the green dotted line in Figure 20(b). Aside from the downflows, the condensation also moves upward with a mean speed of ∼15 km s−1 (see the blue dotted line in Figure 20(b)), and then falls back. Several upward ejections are also detected, with a mean speed of ∼15 km s−1, one of which is denoted by a cyan arrow in Figure 20(b). The condensation disappears after ∼20:45 UT, lasting for ∼3.8 hr. In the red boxes in Figures 19(b), (e), and (h), light curves of the AIA 171 Å, 131 Å, and 304 Å channels are measured and shown in Figure 20(d) by the red, green, and blue lines, respectively. They increase first, reach the peaks, and then decrease. However, these three light curves peak separately at 16:13, 17:24, and 17:57 UT; see the red, green, and blue dotted lines in Figure 20(d). The cooling and condensation process of coronal plasma is clearly identified. The coronal plasma in the dips cools down from ∼0.9 MK to ∼0.6 MK in 71 minutes, and then to ∼0.05 MK in another 33 minutes.
From ∼20:45 UT, another small condensation takes place in the AIA 304 Å images (see Figure 19(j)) in the dips of loops L1, position D2 (see Figure 19(c); see the pink ellipses in Figures 19(c), (f), and (j)). It rains down to the solar surface across the dips, path P2 (see Figure 19(c)), and lasts for ∼1.6 hr. The black ellipse in Figure 20(b) encloses the time distance diagram of the condensation in Figure 19(j) in the AIA 304 Å channel. From ∼22:00 UT, another large condensation appears in the AIA 304 Å images (see Figure 19(k)) in the dips of loops L1, position D2 (see Figure 19(c); see the cyan ellipses in Figures 19(c), (f), and (k)). Similar to the previous large condensation in Figure 19(h), it falls down along a curved trajectory to the solar surface across the dips, path P2 (see Figure 19(c) and Figure 19(l)), with a mean speed of ∼50 km s−1; see the green dashed line in Figure 20(b). It also moves upward with a mean speed of ∼9 km s−1; see the blue dashed line in Figure 20(b). The condensation disappears after ∼02:34 UT on 2012 January 21, lasting for ∼4.6 hr.
In the green rectangles in Figures 19(c), (f), and (k), light curves of the AIA 171 Å, 131 Å, and 304 Å channels are measured and shown in Figure 20(e) by the red, green, and blue lines, respectively. They increase first, reach their peaks, and then decrease, similar to the previous results. The red, green, and blue dotted lines in Figure 20(e) mark the peaks of the AIA 171 Å, 131 Å, and 304 Å light curves separately at 21:33, 22:17, and 23:49 UT. They show that the coronal plasma in the dips cools down from ∼0.9 MK to ∼0.6 MK in 44 minutes, and then to ∼0.05 MK in another 92 minutes. The black ellipse in Figure 20(e) encloses the light curves of the AIA 304 Å channel associated with the condensation in Figure 19(j), with a peak at 21:22 UT; see the pink diamond in Figure 20(e). However, no peak of the AIA 171 Å and 131 Å light curves associated with the condensation is identified, which may be influenced by the successive MR between loops and coronal condensations.
Appendix D: Other Similar Events of Coronal Condensations Caused by MR in 2012 January
Employing the JHelioviewer software (Müller et al. 2017), we roughly checked the AIA 171 Å, 131 Å, and 304 Å images with a much slower time cadence of 14 minutes in 2012 January. Aside from the 15 events we displayed above in this paper, 79 similar coronal condensation events caused by MR between loops are identified out of the solar limb at different positions and times in the month alone and listed in Table 3 in the Appendix. Among them, three cases on 2012 January 7, 10, and 11 are shown separately in Figures 21(a1)–(a2), (b1)–(b2), and (c1)–(c2) in the Appendix. Here, each row of Figure 21 shows the AIA 171 Å and 304 Å images at the same location and time side by side. These three events happen at completely different regions at the solar limb; see the green rectangles on the white circles in Figures 21(a2)–(c2). They are independent from each other, despite being within a few days.

Figure 21. Three similar events of coronal condensations caused by MR between loops in 2012 January. (a1)–(c1) AIA 171 Å and (a2)–(c2) 304 Å images on 2012 January (a1)–(a2) 7, (b1)–(b2) 10, and (c1)–(c2) 11, respectively. The red solid arrows in (a1)–(c1) denote the dips of loops L1. The green rectangles on the white circles in (a2)–(c2) indicate the locations of the FOV with respect to the full Sun. N and W denote the north and west directions. The AIA images here are separately rotated counterclockwise (a1)–(a2), clockwise (b1)–(b2), and counterclockwise (c1)–(c2) at angles of 98°, 45°, and 55°. See Appendix D for details.
Download figure:
Standard image High-resolution image