


Abstract
We present findings of the detection of Magnesium II (Mg ii, λ = 2796, 2803 Å) absorbers from the early data release of the Dark Energy Spectroscopic Instrument (DESI). DESI is projected to obtain spectroscopy of approximately 3 million quasars (QSOs), of which over 99% are anticipated to be at redshifts greater than z > 0.3, such that DESI would be able to observe an associated or intervening Mg ii absorber illuminated by the background QSO. We have developed an autonomous supplementary spectral pipeline that detects these systems through an initial line-fitting process and then confirms the line properties using a Markov Chain Monte Carlo sampler. Based upon a visual inspection of the resulting systems, we estimate that this sample has a purity greater than 99%. We have also investigated the completeness of our sample in regard to both the signal-to-noise properties of the input spectra and the rest-frame equivalent width (W0) of the absorber systems. From a parent catalog containing 83,207 quasars, we detect a total of 23,921 Mg ii absorption systems following a series of quality cuts. Extrapolating from this occurrence rate of 28.8% implies a catalog at the completion of the five-year DESI survey that will contain over eight hundred thousand Mg ii absorbers. The cataloging of these systems will enable significant further research because they carry information regarding circumgalactic medium environments, the distribution of intervening galaxies, and the growth of metallicity across the redshift range 0.3 ≤ z < 2.5.
Export citation and abstract BibTeX RIS

Original content from this work may be used under the terms of the Creative Commons Attribution 4.0 licence. Any further distribution of this work must maintain attribution to the author(s) and the title of the work, journal citation and DOI.
1. Introduction
In the years since the discovery of the first quasars (e.g., Matthews & Sandage 1963; Schmidt 1963), these objects have become crucial cosmological tracers, helping to map the underlying mass distribution and history of structure formation across cosmic time (e.g., Croom et al. 2005; Springel et al. 2005; Shen et al. 2007, 2009; Ross et al. 2009; White et al. 2012; Eftekharzadeh et al. 2015; Zarrouk et al. 2018; Neveux et al. 2020). Shortly after their discovery, it was observed that the spectra of some quasars have absorption line systems at redshifts distinct from their emission. It was first proposed by Wagoner et al. (1967) and Bahcall & Spitzer (1969) that these absorption lines may be caused by gas excitation in the extended halos, or circumgalactic medium (CGM), of intervening galaxies in the line of sight to the more distant quasar (see Tumlinson et al. 2017 for an overarching review of the study of the CGM).
The host galaxies of these absorption systems are frequently too dim to be otherwise observed, particularly those at redshifts beyond z = 1 (e.g., Frank et al. 2012; Corlies & Schiminovich2016; Corlies et al. 2020; Wijers & Schaye 2022). However, the detectability of absorption systems associated with these hosts is not affected by the luminosity of the host system, nor by its redshift. As such, these absorption systems allow us to query the gas content of a diverse set of galactic environments that would otherwise be difficult or impossible to survey.
Although a range of absorption species are commonly found in quasar spectra, including Fe ii, Al iii, C iv, and S iv, the analysis in this paper will focus on Mg ii because it produces a distinct doublet shape, and can be detected at rest-frame wavelengths between Mg ii emission near 2800 Å and Lyα emission near 1215 Å. It becomes significantly more challenging to reliably detect absorption systems blueward of Lyα emission because they will often blend with lines in the Lyα Forest (e.g., Kim et al. 2007).
The detection and characterization of Mg ii absorbers allows for the study of their distribution across redshift space. Since these absorbers are inherently associated with galaxies, they can be used as mass tracers and their density informs the formation of cosmic structure (e.g., Bergeron & Boissé 1991; Chen et al. 2010b). The determination of rest-frame equivalent width (EW) values can also provide insight into the physical scale of circumgalactic media and their variation as a function of redshift (e.g., Bordoloi et al. 2011; Dutta et al. 2023). Additionally, as galaxies evolve, the composition and physical properties of their CGM environments change, causing certain absorption species to become more or less detectable (e.g., Daddi et al. 2005; Tumlinson et al. 2017). Therefore, the detection of Mg ii absorbers can inform our understanding of galaxy evolution because only certain CGM environments can result in Mg ii absorption.
Absorption systems also enable studies of the nature and kinematics of outflowing gas in their host galaxies (e.g., Prochaska et al. 2004; Bordoloi et al. 2011; Nestor et al. 2011; Bouché et al. 2012; Kacprzak et al. 2012; Lan & Mo 2018), as well as the covering fractions and relative metallicities of the absorbing material (e.g., Steidel et al. 1994; Aracil et al. 2004; Chen et al. 2010a; Lan 2020). By first detecting Mg ii, it is possible to detect other metal lines arising from the same CGM and do so with greater certainty, even at lower EW values.
Numerous catalogs of Mg ii absorbers have been constructed, dating back over 40 years. These include those based on early purpose-built surveys with samples of dozens to hundreds of systems (e.g., Lanzetta et al. 1987; Tytler et al. 1987; Sargent et al. 1988; Caulet 1989; Steidel & Sargent 1992; Churchill et al. 1999), to high-resolution surveys with large telescopes (e.g., Nielsen et al. 2013; Chen et al. 2017), to catalogs based on the large number of quasars available from the Sloan Digital Sky Survey (SDSS; e.g., Nestor et al. 2005; Prochter et al. 2006; York et al. 2006; Lundgren et al. 2009; Quider et al. 2011; Seyffert et al. 2013; Zhu & Ménard 2013; Raghunathan et al. 2016; Anand et al. 2021; Zou et al. 2021). SDSS is responsible for the bulk of quasar observations to date, having observed ∼750,000 (e.g., Schneider et al. 2010; Pâris et al. 2017; Lyke et al. 2020).
The Dark Energy Spectroscopic Instrument (DESI) began its main survey of the sky in 2021 May. The DESI survey represents a significant improvement over the SDSS in terms of both the raw data observed and the data quality (DESI Collaboration et al. 2016a). DESI is mounted on the 4 m Mayall telescope, which constitutes a roughly 250% increase in light collecting area compared to the 2.5 m telescope utilized in the SDSS (DESI Collaboration et al. 2016b). DESI is also ∼160% more efficient at passing light from the telescope to its spectrographs (DESI Collaboration et al. 2016b).
Over its five-year mission, DESI will observe approximately three million quasars (Chaussidon et al. 2023). These quasars, along with DESI's other target classes, will enable studies of baryon acoustic oscillations and redshift-space distortions with the goal of determining new constraints on dark energy density and other cosmological parameters (DESI Collaboration et al. 2016a). With these objectives in mind, DESI quasars can be divided into two classes: those observed as direct tracers (z < 2.15) and those observed to detect the foreground Lyα forest (z > 2.15) (DESI Collaboration et al. 2023).
DESI uses a combination of three optical bands (g, r, and z), as well as WISE W1 and W2 band infrared photometry to select quasars based upon their infrared excess. The main quasar selection, as detailed in Chaussidon et al. (2023), results in a selection of more than 200 deg−2 quasars in the magnitude range 16.5 < r < 23. Of these, approximately 70% are projected to be direct tracer quasars, with the remaining 30% being Lyα forest quasars.
DESI will have the capability to produce catalogs of absorbers that are significantly larger than those from any prior campaign. This will deepen our understanding of the innate distributions of Mg ii absorbers and their rest-frame EWs, and will also enable more precise analyses of galactic and CGM evolution (Zou et al. 2023), structure formation (Pérez-Ràfols et al. 2015), and relative metallicity evolution (Lan & Fukugita 2017) than has previously been possible.
This paper is organized as follows. In Section 2, we will describe our techniques for detecting absorption systems, as well as our methods for determining the purity and completeness of the absorber sample. In Section 3, we will present our results, including the redshift distribution of detected systems and their rest-frame EWs. In Section 4, we will discuss some possible applications of our absorber catalog—in particular as a novel check on DESI pipeline redshifts and as a marker that can be used to locate other species in absorption. We present our conclusions in Section 5.
2. Data and Methods
In this section, we will describe the nature of the DESI data and the construction of our catalog. We will then discuss how we have estimated the purity and completeness of our sample through the combined use of visual inspection, reanalysis of individual observations, and simulations of Mg ii absorbers.
2.1. DESI Data Construction
DESI spectra are observed using three spectrographs, which are commonly referred to as "b," "r," and "z" due to their wavelength coverage, that together span a wavelength region of 3600–9824 Å. The three spectrographs have approximately constant wavelength resolutions of Δλ ≈ 1.7 Å (DESI Collaboration et al. 2016b, 2022). The flux values associated with a DESI observation are extracted using a linear wavelength grid in 0.8 Å wavelength steps (Guy et al. 2023).
In this paper, we will use data from DESI's early data release (EDR). These data are separated into three stages of survey validation, which we refer to as "sv1," "sv2," and "sv3." These surveys are distinct from each other, both in time frame and targeting implementation, and are detailed in Myers et al. (2023) and DESI Collaboration et al. (2023). Each of these stages, as well as the main survey, are further divided into bright-time and dark-time programs.
The typical effective exposure time DESI aims to achieve during dark-time observations is 1000 s. This timing is set by the need to classify and obtain redshifts for the luminous red galaxy sample that is observed concurrently with the quasar sample during dark-time (see Section 4 of Zhou et al. 2023). The relationship between effective exposure time and signal-to-noise is detailed in Section 4.1.4 of Guy et al. (2023). Note that quasars are only intended to be targeted during dark-time, see Myers et al. (2023) for further discussion of the distinction between DESI's bright-time and dark-time programs.
DESI will, over the course of its survey, reobserve targets to improve the quality of its data. During the main survey, Lyα forest quasars are scheduled, at high priority, to be observed with four times the exposure time at which direct tracers quasars are typically observed, although all quasars can ultimately be reobserved at low priority (see Section 5.3.3 of Schlafly et al. 2023, for details). During survey validation, all quasars at redshifts z > 1.6 were observed for four times the typical exposure time (e.g., Chaussidon et al. 2023). This distinction carries implications for our completeness with respect to redshift, we comment on this further in Section 2.4.
To perform our search for absorbers in the most robust fashion, we chose to use spectra that coadd all observations of a given target. We will refer to these spectra as being "healpix coadded" because this is how they are grouped within the DESI spectral reduction file structure (Górski et al. 2005). We will also make use of the spectra that coadd a subset of observations, i.e., all observations from a single night, to determine the completeness of our sample (see Section 2.4).
Observations of the same target made during different survey validation stages are not coadded, and as such it is possible that a target could be present in several of these surveys. In such cases, we will only consider the results of our absorber search for only the healpix coadded spectrum from the survey, which has the highest squared template signal-to-noise (TSNR2; see Section 4.14 of Guy et al. 2023 for a full description of this statistic).
TSNR2 is calculated for different target classes (i.e., emission line galaxies, luminous red galaxies, and quasars) according to their expected spectral properties and redshift distribution. This results in a more informed statistic that better weights relevant spectral features, such as emission lines and the Lyα Forest. Notably, TSNR2 values for different target classes cannot be fairly compared, so when we refer to TSNR2 generically throughout this paper we will be referring to the TSNR2_QSO statistic.
2.2. Pipeline Construction
Our analysis relies on parent quasar catalogs generated via three tools: Redrock (RR; S. Bailey et al. 2023, in preparation), 31 which is a PCA-based template classifier that is part of the main DESI spectroscopic pipeline (Guy et al. 2023); QuasarNet (QN; Busca & Balland 2018), 32 which is a neural network based quasar classifier (see also Farr et al. 2020); and an Mg ii-emission-based code, which is designed to identify AGN-like spectra that show both strong galactic emission features and broad Mg ii emission. The results from the visual inspection of quasar spectra informed the need for, and use of, these tools (Alexander et al. 2023).
Initial spectral types (QSO or non-QSO for our purposes) as well as initial redshifts are determined by RR. QN and the Mg ii-emission code are then run as afterburners. The outputs of the two afterburners can result either in RR being re-run with adjusted redshift priors, or in the case of the Mg ii-emission code the spectral type being changed to QSO when a broad Mg ii-emission line is detected. Notably, redshifts are always ultimately determined by RR. A more complete overview of the application of these tools to construct quasar catalogs, as well as the verification of the completeness and purity of this approach, can be found in Chaussidon et al. (2023). The resulting catalog has a purity greater than >99% and a median redshift of z = 1.72, with 68% of quasars having redshifts between 1.07 < z < 2.46 (Chaussidon et al. 2023).
We search these spectra for absorption doublets by first applying a Gaussian smoothing kernel with a standard deviation of two, as described in the Astropy documentation (Astropy Collaboration et al. 2022). This smoothing is performed to reduce the effect of noisy regions/pixels on the background quasar continuum that we estimate in the following step. We estimate this continuum from the smoothed flux values of the spectra using a combination of median filters. Specifically, we choose to weight the combination of a 19 and 39 pixel filter such that the contribution of the narrower 19 pixel filter is strongest at low wavelengths and decreases across the wavelength space, whereas the opposite is true for the 39 pixel filter, which contributes to the estimated continuum value most strongly at high wavelengths.
These pixel values were informed by a preliminary set of Mg ii absorptions that were detected using more rudimentary methods. The precise values have been chosen to ensure that the two absorption lines of the Mg ii doublet are cleanly separated into individual absorption lines by the estimated continuum. We find that this combination reliably models the broad emission features that are observed in DESI quasar spectra, but not any narrow absorption features that may be present. The choice to effectively broaden the filter at high wavelengths accounts for the broadening of Mg ii systems due to redshift.
An example of both the smoothing process and the estimated continuum can be seen in the central panel of Figure 1. The bottom panel of Figure 1 demonstrates that emission features are not retained in a residual obtained by subtracting the median-filter-estimated continuum from the Gaussian-smoothed data, but any absorption features remain as positive features in the residual. Also evident is the increased residual noise beyond our search limit in the Lyα forest, which makes it evident why it is difficult to resolve metal lines in this region.
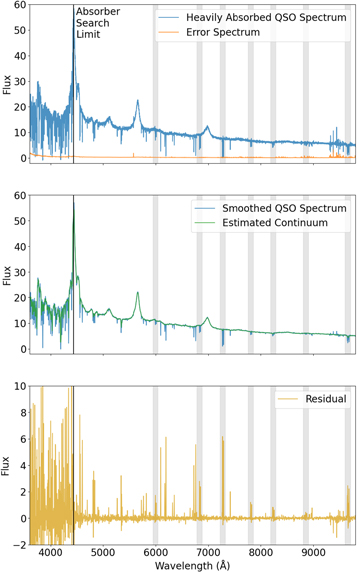
Figure 1. A visualization of the doublet-detection step of our pipeline. Detected Mg ii systems are shown in the gray-outlined boxes and the search limit of our approach is shown by the vertical-black line. Top: A sample spectrum from DESI that features seven separate Mg ii absorption systems. The flux and error spectrum coadded at the boundaries of the three DESI spectrographs are shown. Middle: The same spectrum now shown with an applied Gaussian smoothing kernel (blue) and estimated median-filter continuum (green). Bottom: A residual taken from subtracting the median-filter-estimated continuum from the Gaussian-smoothed data. Note that the seven Mg ii absorption systems appear as positive lines.
Download figure:
Standard image High-resolution imageTo detect doublets, we find every group of consecutive positive residuals and calculate a signal-to-noise ratio as:
where C and F are the continuum and flux values, respectively, σ2 is the variance of the spectrum, and p1 and p2 are the first and last indices of a particular group of consecutive positive residuals. We additionally fit a preliminary Gaussian model to each set of residuals, which allows us to estimate the line center, and the determined values for line amplitude and width are later used to inform the initial state of the Markov Chain Monte Carlo (MCMC) sampler. If two absorption lines are found to have S/N values greater than 2.5 and 1.5, respectively, and a rest-frame wavelength separation of 7.1772 ± 1.5 Å, where 7.1772 Å is the laboratory separation of Mg ii (e.g., Pickering et al. 1998), then this doublet is regarded as being a likely candidate.
A similar detection method was used in Raghunathan et al. (2016); however, we find that our approach improves the detection of relatively low-signal absorption systems in high-signal QSO spectra. Note that our rest-frame line separation uncertainty value, 1.5 Å, has been chosen to consider as many candidate absorbers as possible without encompassing the rest-frame separation of Si iv, which is another absorber doublet that is commonly strong in QSO spectra.
To further verify these systems, we next perform an MCMC analysis using the emcee software (Foreman-Mackey et al. 2013). The decision to use MCMC to fit the relatively simple model of a doublet absorption line was made in the interest of fully understanding the posterior distributions of our parameters, as well as increasing the likelihood of recovering low-signal absorbers.
To ensure that the full signal of the absorber is recovered, we use a different continuum in fitting the systems than the one previously described and used in the initial detection step. The continuum used in detection is designed to ensure that the individual lines of the Mg ii doublet are detected separately, in the case of particularly strong or broad absorbers this can result in some of the absorption signal being lost in the residual. However, when fitting the absorber, we instead construct a continuum to ensure that the the full signal is retained.
We first attempt to calculate an appropriate QSO continuum using the NonnegMFPy tool as implemented in Zhu & Ménard (2013) and Anand et al. (2022). NonnegMFPy utilizes nonnegative matrix factorization (NMF, see Lee & Seung 1999) to determine a basis set of eigen-spectra and through their reconstruction estimate an observed quasar continuum.
In cases where the NMF tool is unable to estimate a continuum due to an inability to converge, or the chi-squared value of the estimated continuum is greater than 4 (approximately 32 % of DESI EDR QSOs) we estimate a secondary continuum using a wide, 85 pixel median filter. In cases where this median-filter continuum provides a spectra fit with a lower chi-squared value, we instead use this continuum. The width of this median filter is informed by the previously referenced preliminary sample of detected Mg ii absorbers and ensures that no signal is lost in estimating the continuum, even for the broadest absorption systems.
For each absorber candidate, we consider a region of 80 pixels, or 64 Å, around the detected doublet. This value allows the sampler to explore a region of redshift space that will ultimately be much larger than the redshift uncertainty for a high quality fit, while simultaneously allowing for the detection of multiple Mg ii systems in a single spectrum. We then fit a five-parameter model of the form:
where the two Gaussian line profiles are defined by their center C, width σ and amplitude A. Note that C1 and C2 are both set by the same underlying redshift parameter, i.e., C1 = (z + 1) × 2796.3543 Å.
The only prior attached to this model is the redshift range implied by the 80 pixel region around the suspected doublet. Initial values for our parameters are informed by the results of the detection step, with the minimum value in the group of residuals informing the line amplitude and the number of consecutive negative pixels informing the standard deviation.
We use 32 walkers and run the model for 15,000 steps. We then discard the first 1000 steps as a burn-in period and store the remaining 14,000 steps for each candidate MCMC feature. Finally, we select only those models that have high mean acceptance fractions (>0.45) and estimated integrated autocorrelation times 33 that are less than 1 per cent of the chain length, indicating that the majority of proposed steps were accepted and that the model was well fitted by the MCMC process.
After running this pipeline on our parent sample of 83,207 DESI QSOs, we find a total of 29,797 systems in 18,219 individual healpix coadded spectra that meet our criteria.
In this sample there are a small number of entries with Mg ii absorption redshifts greater than the background quasar redshift, which may initially seem to suggest that the absorber is more distant than the quasar, 34 In analyzing the physical interpretation of this scenario, it is standard to work in velocity rather than redshift space, and to define a velocity offset as:

Velocity offset values within approximately ±6000 km s−1 are indicative of an associated absorption system, wherein the QSO emission and metal line absorption arise from the same galaxy or galaxy cluster (Shen & Ménard 2012). However, in systems with larger velocity offset values, it must be true that one of the redshifts is poorly determined—because it is physically impossible for a system that is absorbing the light from a quasar to lie behind that quasar.
From a brief visual inspection of these systems we find a number of true Mg ii systems in quasar spectra with incorrect redshifts. Additionally, we find a number of false Mg ii systems, which are often detected in star or galaxy spectra that have been misidentified as quasars or spectra with unusual error features. We therefore decide to group those systems with velocity offsets greater than 5000 km s−1 into a separate catalog of physically impossible absorbers for the purpose of diagnosing spectra that have been misclassified as quasars or assigned an incorrect redshift. We will comment on this separate catalog further in Section 4.1. Removing the 374 entries with voff > 5000 km s−1 results in a preliminary sample of 29,423 suspected Mg ii absorbers.
2.3. Visual Inspection
In the interest of both assessing and potentially improving our catalog purity, we next conducted a visual inspection of 1000 randomly selected systems that pass the MCMC process and do not have physically impossible redshifts, as described above. This process involves several steps: confirming that the background spectrum is indeed that of a quasar, verifying that two absorption lines have been well fitted by the MCMC process, and determining if additional metal lines can be fitted at the same redshift. Note that the presence of additional metal lines is considered only in confirming borderline cases where the fit absorption lines are weak.
Visually inspecting 1000 randomly selected Mg ii absorbers, following the steps outlined above, we find 808 that constitute true Mg ii absorption and 192 which do not. This suggests an initial purity of 80.8%. Based upon the statistics of these systems, we have developed a series of quality cuts to improve the purity of our detected sample with minimal effect on completeness.
The first cut that we perform is to remove systems for which one or both of the fit Gaussians have a positive amplitude. This outcome is not disallowed by the MCMC priors to facilitate a full exploration of the parameter space but is clearly not indicative of an absorption feature. Note that in such a case, the initial line amplitude values were given as negative; however, the MCMC process has converged on a positive line solution in the course of fitting. There are 77 such systems in the visual inspection set, all of which were identified as false Mg ii systems and as such we impose a cut that all systems are required to have negative amplitudes for both fit line profiles.
We can next consider another class of possible contaminants, systems in which two Gaussians with negative amplitude can be fitted at the proper separation of Mg ii but whose line amplitudes and/or widths are not characteristic of Mg ii. To determine an appropriate selection, we must consider both the physical nature of Mg ii absorption and the Gaussian line parameter posteriors of our visually inspected sample. To visualize these posteriors, we have plotted the ratio of line amplitudes against the ratio of line widths in Figure 2. In both cases, we consider the statistic of the leading 2796 Å line divided by the statistic of the 2803 Å line.
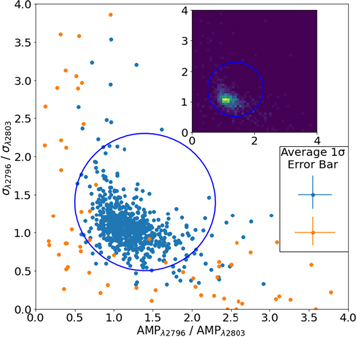
Figure 2. Visualization of Equation (4). The ratios between the widths and amplitudes of the two lines of the Mg ii doublet are plotted for all systems in the visually inspected set following the removal of any systems with positive amplitudes. True Mg ii systems are shown in blue and false systems are shown in orange. Note that not all points are shown. Top Right-hand Inset: Density plot indicating that the distribution is highly concentrated around [1.1, 1.1].
Download figure:
Standard image High-resolution imageFrom the inset panel of this figure, we observe that the distribution of our visual inspection set in this space is tightly clustered around a value of roughly [1.1, 1.1], which indicates (empirically) that the 2796 Å line of the Mg ii doublet tends to have a slightly larger amplitude and be slightly wider than the second.
The innate flux ratio of the 2796–2803 Å lines is determined by the ratio of their collisional rate coefficients or equivalently by their quantum degeneracy factors. This ratio for Mg ii is F2796/F2803 = 2, and has been experimentally verified (e.g., Mendoza 1981; Sigut & Pradhan 1995). However, because the majority of systems observed here are saturated, the observed ratio of absorption line area approaches 1.
When visually inspecting these systems, we observe some true Mg ii absorbers where the amplitude and/or width of the 2803 Å line is greater than that of the 2796 Å line. This should not be possible theoretically; however, the systematic uncertainties inherent to observation can produce this result. With this in mind, we can draw a selection in this parameter space that includes the region of highest density/physical likelihood and allows for slight variation due to observational uncertainties, while still maximizing the purity of the post-cut selection. The selection takes the form of a circle and is described by:

where AMP is the amplitude of the fit line and σ the width. Note that all points with amplitude and width ratios between 1.0 and 2.0 are included in this selection. After applying a cut to our sample according to the boundaries of this circle, we remove 50 true positives and 108 false positives.
After imposing these cuts, the visual inspection sample contains 758 true positive Mg ii systems and seven false positives for a nominal 99.1% purity. Presuming Gaussian noise on this measurement, we assign a ±3.16% error on this purity. Applying these cuts to our pre-visual inspection sample of 29,423 absorber candidates leaves a population of 23,921 absorbers.
2.4. Sample Completeness
In this section, we will investigate the completeness of our sample. We will first determine its dependence on the quality of input spectra by using nightly data reductions. We then consider its relationship with the rest-frame EW of absorption systems as determined by the creation of simulated absorbers.
2.4.1. Reanalysis of Nightly Reduction
The healpix coadded spectra that we search for absorbers are created by combining multiple individual observations, as described in Section 2.2. These individual observations have lower S/Ns, which makes recovering absorption features more challenging. This allows for a natural test of the completeness of our approach with respect to the TSNR2 of input spectra.
By searching the nightly coadded spectra, generally composed of a few individual observations, for a known Mg ii absorber, we can quantify the performance of our pipeline as a function of absorber redshift and spectral S/N. We chose to use the nightly coadded spectra rather than individual observations because this spans the region of relevant TSNR2 values more fully. Additionally, in rare cases where a target is observed on only a single night, we do not consider the results of its reanalysis because the healpix coadded and nightly coadded spectra are the same.
Figure 3 shows the TSNR2 distribution of healpix coadded quasar spectra. Results are shown for both targets with any number of observations and those targets with at least four observations. Note that we have grouped quasars with a TSNR2 value >140 because above this threshold we find that Mg ii detection is not sensitive to the TSNR2 of the background quasar. Additionally, we note that this final bin happens to contain only entries with at least four observations and accounts for approximately one-third of the full healpix coadded sample.
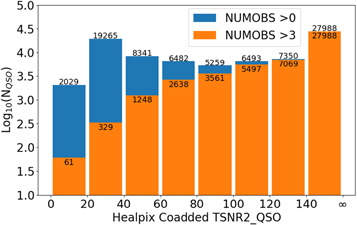
Figure 3. The population of healpix coadded quasar spectra TSNR2 values. The numbers above/below the blue/orange bars indicate population size. The right-hand bin includes all spectra with TSNR2 > 140.
Download figure:
Standard image High-resolution imageHaving determined the population of TSNR2 values, we can now determine the performance of our pipeline in recovering known Mg ii absorbers as a function of TSNR2. To do so, we consider all 23,921 detected absorbers and recover the spectra of their nightly coadded observations. We then run the doublet-finder portion of our pipeline on these observations, recording whether the known Mg ii doublet can be recovered in these lower-TSNR2 spectra. The results of this search are displayed in Figure 4—as can be readily seen, our percentage of recovered absorbers decreases with TSNR2, as anticipated. The percentage of recovered absorbers is also noticeably worse in the lowest redshift bin. This happens because the DESI instrument has a lower throughput at the blue end (DESI Collaboration et al. 2022).

Figure 4. Nightly coadded QSO spectra grouped by Mg ii absorption redshift and TSNR2 value. Bins are colored according to the completeness, i.e., the number of Mg ii doublets recovered compared to the number of expected absorbers. Within each bin, the completeness is quoted as P and the number of expected absorbers is quoted as N. Note that, as in Figure 3, the highest bin groups all spectra with a TSNR2 exceeding 140.
Download figure:
Standard image High-resolution imageWe can next consider the average completeness per TSNR2 bin, averaging across redshift space. By multiplying the number of quasars in each bin of TSNR2, i.e., Figure 3, by this average completeness per bin, we can determine the number of quasars in each bin for which we would expect to be able to recover Mg ii absorbers. We determine the expected completeness by summing these results across TSNR2 bins and normalizing by the total number of quasars. By doing so for the results shown in Figure 4, we recover an expected completeness of 88.0% for QSOs with any number of observations and 92.8% for QSOs with at least four observations.
2.4.2. Injection of Synthetic Absorbers
In addition to determining our completeness with respect to the quality of searched spectra, it is also informative to determine our ability to recover absorbers with different innate absorption strengths, described by the rest-frame EW of the 2796 Å line ( ). To do so, we follow the approach of Zhu & Ménard (2013)—see their Section 3.3 and Figure 7—and generate synthetic absorber systems at a wide range of values of
  .
.
These mock absorbers are generated by first setting  equal to a random value between 0 and 4 Å. This upper limit has been chosen as systems with
  Å account for less than 3% of our sample. The rest-frame EW of the second line of the doublet,
  , is then determined by drawing a value from the posterior of doublet ratio values (
 /
/ ) found in our sample. In the same fashion, we determine a value for the rest-frame Gaussian standard deviation of both lines. This sets the line amplitudes, such that the determined values of W0 are representative.
We have chosen to inject these systems in real DESI quasar spectra, specifically those quasars from the parent catalog used in this study in which no real Mg ii absorbers were detected. This ensures that these spectra have realistic error properties. For quasars with z < 2.15, synthetic absorbers are injected at every pixel that corresponds to an absorber redshift between z = 0.3 and z = 2.5. For quasars with z > 2.15, to avoid the Lyα forest region, injection starts at the first pixel red-ward of the Lyα emission line.
After constructing the absorber model, as detailed above, the model is resampled into the DESI wavelength coverage. The flux values of pixels that lie within the absorption lines are then replaced by the model values. The model is then scaled by the average flux values in the pixels it is replacing and noise is added, with values being drawn from a normal distribution centered on the error spectrum values of the pixels being replaced. The resulting spectrum is then run through the doublet-finder portion of our pipeline to test whether the injected absorber is recovered.
The results of this test, for a sample of 6000 randomly selected quasars, are shown in Figure 5. The heatmap in the left-hand panel clearly shows that our completeness decreases rapidly for systems below  = 0.8 Å. Regions of decreased completeness at constant absorber redshift are also visible. These are associated with common skylines, such as the high pressure sodium bump at ∼5900 Å or OH lines at ∼9200 Å (e.g., Zhu & Ménard 2013).
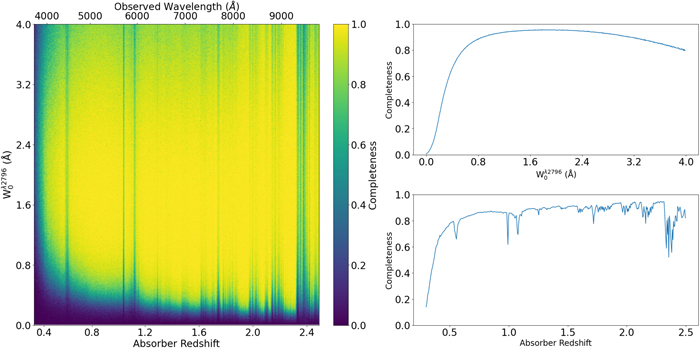
Figure 5. Left-hand panel: Heatmap of synthetic absorber recovery results. Decreases in completeness at low values of  as well as at low redshift, and at certain redshifts corresponding to known skylines can clearly be seen. Top Right-hand Panel: Average completeness as a function of
  Bottom Right-hand Panel: Average completeness as a function of absorber redshift.
Download figure:
Standard image High-resolution imageThe marginalized distributions shown at the right-hand side of Figure 5 shows that in addition to decreasing rapidly at low values of  , our completeness also slowly decreases at
  Å. We suspect this may be a result of the lines of these very strong absorbers blending together, such that they cannot be separately resolved by our code. We will seek to address this issue in future catalog releases.
Considering the completeness with respect to redshift, we can see that it slowly increases with redshift, and is generally lower at the far red and blue ends of the wavelength coverage. Dips in completeness at z ∼ 1.1 and z ∼ 1.7 are likely to be related to the DESI spectrograph crossover regions (DESI Collaboration et al. 2022), where noise values tend to be higher. Completeness increasing with redshift is a notable difference when compared to the results of Zhu & Ménard (2013), and demonstrates that absorber searches performed with DESI will be more complete to absorbers at higher redshift because of its wavelength coverage and the depth of its observations.
It will be necessary to re-evaluate our completeness when considering observations taken during the DESI Main Survey because direct tracer quasars with redshifts 1.6 < z < 2.15 are unlikely to have been observed for four times the typical exposure time, as they were for survey validation observations.
Having outlined how the completeness of our sample is related to the S/N properties of the spectra analyzed, as well as the redshift and absorbing strength of the intervening systems, we will now consider the properties of the systems that were detected.
3. Results
From an initial sample of 83,207 quasars, we find a total sample of 29,797 probable Mg ii systems. Following the cuts described in Section 2.3, we reduce this sample to a total of 23,921 physically possible Mg ii systems in 16,707 unique quasar spectra. This suggests that at least one absorber is detected in 20.1% of quasar spectra and the overall occurrence rate of absorbers considering multi-absorber systems is 28.8%. These results are in reasonable agreement with similar studies using SDSS data, which found at least one absorber in 10%–20% of quasar spectra (e.g., York et al. 2006; Raghunathan et al. 2016; Anand et al. 2021). In this section, we will consider the statistics of this sample and will also describe the structure of the catalog that we generate from them.
Figure 6 displays the distribution of all detected absorption systems in both background quasar and absorber redshift space. The overlaid contour lines are kernel density estimates and span 10%–90% of the distribution in steps of 10%. The overlaid black lines represent two natural "boundaries" for Mg ii systems. The lower boundary indicates the associated absorber case, in which the redshift of the quasar and absorption system are similar. As previously discussed, this suggests that the absorption is occurring within the same galaxy, or galaxy cluster, that is host to the quasar. The upper boundary indicates the redshift of an absorber that would correspond to the wavelength of a quasar's Lyα emission line. As discussed in Section 2, we exclude this region of redshift space from our search due to contamination by the Lyα Forest.
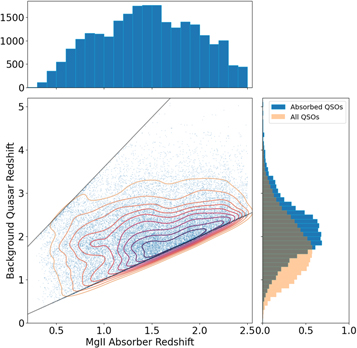
Figure 6. Redshift-space distributions of all of the detected absorbers. Contours are kernel density estimates of the distribution. Marginalized histograms of each redshift population are also presented. The quasar redshift histogram is plotted alongside the redshift histogram of all DESI QSOs for reference, and both are scaled by density.
Download figure:
Standard image High-resolution imageFigure 6 also presents marginalized histograms of the quasar and absorber redshifts. We can observe that the absorber redshift distribution peaks between redshifts of 1.3 and 1.5, and declines in both directions from this peak. The precise physical interpretation of this histogram is complicated by redshift selection effects that are not yet well-characterized for the DESI survey, coupled with the true quasar and galaxy redshift distribution functions.
The background quasar redshift distribution peaks in the redshift range 2.0 < z < 2.4. This is in disagreement with the general DESI quasar distribution, which peaks around z = 1.7. A likely physical interpretation here is that the likelihood of passing through an absorbing cloud is smaller for shorter lines of sight, and therefore absorption is more likely to be found in higher redshift quasars. The decline at z ≳ 2.4 is likely to be due to the overall reduction in the density of the quasar population at higher redshifts.
Figure 7 presents the distribution of measured rest-frame EWs for both lines of the Mg ii doublet. The overlaid contour lines follow the same scheme as in Figure 6. We observe that the region of highest density corresponds to absorbers with EWs between ∼0.4 and 1.0 Å. Additionally, we note a slight skew to the contours, suggesting that the leading, 2796 Å, line of the Mg ii doublet generally has a larger EW value. This result is to be expected given the underlying atomic physics, as discussed in Section 2.3.
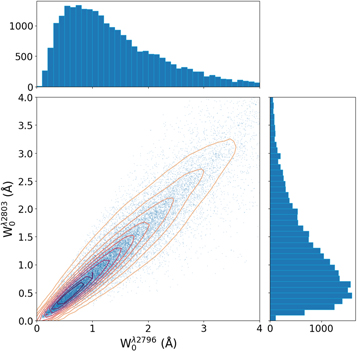
Figure 7. Distribution of rest-frame EW values for the (2796 Å) and (2803 Å) Mg ii lines. Contours are kernel density estimates of the distribution. Marginalized histograms are also presented.
Download figure:
Standard image High-resolution imageIn the marginalized distributions of W0 values, populations of detected systems generally increase with decreasing W0, until W0 ∼ 0.8 Å at which point they flatten and then decrease rapidly at values <0.4 Å. Considering this alongside the completeness relationship that we determined in Section2.4.2, we can infer that true absorber population sizes continue to increase with decreasing W0, as has been seen in previous studies.
3.1. Catalog Format and Access
We describe the data columns that we catalog for each detected absorption system in the Appendix. We will now give a brief overview of these columns and their use.
We first retain sufficient information to uniquely identify each analyzed healpix coadded spectrum, specifically the DESI TARGETID (see Myers et al. 2023), R.A., decl., and phase of the DESI survey. We additionally store the Redrock ZWARN bitmask, which details possible redshift warnings, as well as various TSNR2 values of each spectrum, and the best quasar redshift for each spectrum (derived from the parent quasar catalogs, as discussed in Section 2.2).
We also record the rest-frame EWs of both lines, as well as the central posterior distribution values for all five MCMC fit parameters, as described in Section 2.2. For the EWs, as well as the fit parameters, we also provide lower and upper error bars, as determined from the 16th and 84th percentiles of their posterior distributions.
The created Mg ii absorber catalogs are available online. 35 We have also retained the full 14,000-step MCMC chains for each detected absorber, which will be made available upon request.
4. Discussion
In this section, we will consider the applications of our secondary catalog composed of physically impossible absorption systems. We will also examine the possibility of using Mg ii systems to detect other metal lines.
4.1. Physically Impossible Absorbers
As discussed in Section 2.2, we have detected a small number of systems that have an offset velocity that suggests the absorber is behind the quasar, which is physically impossible. In total, there are 374 such systems, which we will refer to as "PI" absorbers. These PI systems comprise roughly 1.3% of our initial pre-quality-cuts sample of 29,797 absorbers. To improve the utility of this PI subset, we first apply the same quality cuts as for the main sample, which reduces the PI absorber sample to 108 systems in 84 unique spectra. Inspecting these spectra, we find 34 entries where the Mg ii absorption is clearly real, and the QSO redshift poorly determined. Nineteen of these systems are Lyα forest quasars and two illustrative spectra are shown in Figure 8. We additionally find two instances of misidentified star spectra, and one instance of a QSO that has been redshifted at a value greater than that which we find in visual inspection; note that in these three cases the Mg ii absorption is not real.

Figure 8. Two example spectra showing genuine Mg ii absorption systems that appear to be physically impossible due to poor pipeline redshifts. The detected Mg ii absorption is indicated by the gray-outlined area. The associated error spectrum is shown in orange.
Download figure:
Standard image High-resolution image
The relatively low number of true PI absorbers that are found demonstrates the extremely high accuracy of the DESI redshift schema. Extrapolating from these results to the full five-year DESI sample, we would anticipate finding only 1200 true PI absorbers. Given these numbers, it may be worthwhile to occasionally visually inspect these systems and reclassify any Lyα forest quasars with true PI absorbers such that they can be reobserved to improve the signal of the observation. We leave this consideration to future work.
4.2. Detection of Additional Metal Lines
Once an Mg ii absorption system has been identified at a particular redshift, we can search for other common metal lines, such as Fe ii, C iv, and Si iv, knowing precisely where in the spectrum these lines should appear. This enables the detection of these lines at relatively lower S/N.
A pilot analysis that involved the visual inspection of 1000 randomly selected Mg ii absorbers to search for Fe ii, C iv, and Si iv at the same redshift yielded the results in Table 1. The "Id. Rate" column in Table 1 shows the raw percentage of inspected Mg ii absorption systems in which the additional line could be identified, the "Vis. Rate" column shows the percentage of inspected absorption systems in which the non-Mg ii absorption species would be found at a wavelength > 4000 Å such that it would be readily visible to the DESI instrument. 36 Finally, the "Scaled Id. Rate" column scales the Id. Rate by [100/Vis.Rate] to give the percentage of the time the line was identified when expected to be visible. We choose to use 4000 Å because this tends to be the region where the noise in the DESI spectra reaches a consistent level (being noisier at lower wavelengths).
Table 1. Additional Absorption Line VI Results
| Line | Id. Rate | Vis. Rate | Scaled Id. Rate |
|---|---|---|---|
| Fe ii | 83.2% | 91.3% | 91.1% |
| C iv | 27.9% | 38.3% | 72.8% |
| Si iv | 16.2% | 24.4% | 66.4% |
Download table as: ASCIITypeset image
These results imply that (when visible) Fe ii is identifiable in 91.1% of systems and C iv and Si iv are similarly identifiable in 72.8% and 66.4% of systems, respectively. These results are promising and suggest that an algorithmic approach could reliably characterize additional absorption features when seeded with a redshift derived from a certain absorption doublet, such as Mg ii.
5. Conclusion
In this paper, we have presented the methods by which we detect and verify a sample of Mg ii absorption systems in the data collected during the survey validation phase of the DESI survey. We model these absorption systems by first identifying possible systems in smoothed residuals and then characterizing them using Gaussian lines profiles in an MCMC process. In total, we have characterized 23,921 absorption systems in 16,707 unique quasar spectra. The parent quasar catalogs utilized in this study contain 83,207 entries, implying that 20.1% of DESI quasars will contain an identifiable Mg ii absorber. The total number of expected identifiable absorbers will then be equal to 28.8% the total number of observed quasars (accounting for spectra with multiple absorbers). Assuming that DESI ultimately obtains spectra for three million quasars, our pilot study implies that DESI will eventually compile a sample of over 800,000 Mg ii absorption systems across ∼560,000 quasar spectra—by far the largest such sample ever constructed.
The statistics of this catalog, a 99.1% purity, and 82.6% completeness have been verified through the visual inspection of a subset of absorbers, as well as the reanalysis of lower S/N spectra of objects for which absorption systems have been detected.
The estimated purity of this catalog (99.1%), as well as the various factors affecting its completeness, have been characterized through the visual inspection of a subset of absorbers, as well as the reanalysis of lower S/N spectra, and the construction of mock Mg ii absorbers. In future catalog releases, we will aim to increase the completeness of this sample, either by reducing the doublet S/N threshold or by introducing an additional detection step that can recover Mg ii absorbers that currently escape detection due to high noise or unusual features, such as the high  systems potentially missed due to line blending. This goal will of course require the careful balancing of completeness and purity—for this first catalog release, we have chosen to favor a catalog with high purity.
Additionally, we have made the choice at this time to group absorbers that appear to have physically impossible redshifts, i.e., those that would suggest the absorption system to be farther from the observer than the quasar, into a separate catalog. Such systems account for roughly 1.3% of detected absorbers. From a visual inspection of such systems, we find that after applying the purity cuts described in Section 2.3 around 40% of these systems are true Mg ii absorbers with incorrect background quasar redshifts. We anticipate exploring the possibility of using these systems to improve DESI quasar redshifts.
We detect Mg ii absorbers in the redshift range 0.3 ≲ z ≲ 2.5 with a peak in the distribution of absorbers between z ∼ 1.3 and z ∼ 1.5. The exact interpretation of the redshift distribution of possible absorbers is difficult to disentangle from various selection effects. The background quasars that enable the observations of these systems are found at 0.4 ≲ z ≲ 5.8 and, as can be seen in Figure 6, are generally at higher redshifts than the full DESI quasar population.
The physical properties of the absorption systems cataloged here, such as relative metallicities, ionization temperatures, and physical densities, can be determined by further analysis. To do so, we plan to automate the detection and characterization of additional metal lines. As noted in Section 4.2, we identify at least one additional line in >91.1% of Mg ii absorbers. The EWs of the Mg ii absorption systems discussed in this paper are generally similar between the two lines of the Mg ii doublet and can be found at levels well below 1 Å, suggesting that even weak absorbers can be readily detected.
The sample of absorbers collected here is already sufficiently large to facilitate a variety of studies, including the nature of the CGM environments from which these absorption systems arise, the clustering of underlying dark matter traced by the three-dimensional locations of the absorbers, or the use of these Mg ii systems to find additional species in absorption.
Acknowledgments
We thank Guangtun Zhu for sharing the NMF eigen-spectra of SDSS quasars. We thank the referee for their valuable feedback that has helped us improve the quality of the paper.
L.N. and A.D.M. were supported by the U.S. Department of Energy, Office of Science, Office of High Energy Physics, under Award Number DE-SC0019022. L.N. was also partially supported by Wyoming NASA Space Grant Consortium award #80NSSC20M0113. A.P. was supported by the University of Wyoming Science Initiative Wyoming Research Scholars Program. T.W.L. was supported by the Ministry of Science and Technology (MOST 111-2112-M-002-015-MY3), the Ministry of Education, Taiwan (MOE Yushan Young Scholar grant NTU-110VV007), National Taiwan University research grants (NTU-CC-111L894806, NTU-111L7318).
This research is supported by the Director, Office of Science, Office of High Energy Physics of the U.S. Department of Energy under Contract No. DE-AC02-05CH11231, and by the National Energy Research Scientific Computing Center, a DOE Office of Science User Facility under the same contract; additional support for DESI is provided by the U.S. National Science Foundation, Division of Astronomical Sciences under Contract No. AST-0950945 to the NSF's National Optical-Infrared Astronomy Research Laboratory; the Science and Technologies Facilities Council of the United Kingdom; the Gordon and Betty Moore Foundation; the Heising-Simons Foundation; the French Alternative Energies and Atomic Energy Commission (CEA); the National Council of Science and Technology of Mexico (CONACYT); the Ministry of Science and Innovation of Spain (MICINN), and by the DESI Member Institutions: https://www.desi.lbl.gov/collaborating-institutions.
The authors are honored to be permitted to conduct scientific research on Iolkam Du'ag (Kitt Peak), a mountain with particular significance to the Tohono O'odham Nation.
The data used to construct Figures 1, 2, 6, 7, and 8 is available in Zenodo at DOI:10.5281/zenodo.7826591.
Appendix
We provide two catalogs containing the results of our Mg ii absorber search. Both catalogs share the common format denoted in Table 2.
Table 2. Format of the Mg ii Absorber Catalog
| Column | Name | Format | Description |
|---|---|---|---|
| 1 | TARGETID | INT | Unique DESI Target Designation |
| 2 | RA | DOUBLE | R.A. in decimal degrees (J2000) |
| 3 | DEC | DOUBLE | decl. in decimal degrees (J2000) |
| 4 | SURVEY | STR | Survey validation stage (sv1, sv2, or sv3) of analyzed spectrum |
| 5 | ZWARN | INT | Redrock redshift warning bitmaska |
| 6 | TSNR2_QSO | DOUBLE | Quasar template signal-to-noise value squared |
| 7 | TSNR2_LYA | DOUBLE | Lyα quasar template signal-to-noise value squared |
| 8 | TSNR2_LRG | DOUBLE | Luminous red galaxy template signal-to-noise value squared |
| 9 | Z_QSO | DOUBLE | Redshift value from input quasar catalog |
| 10 | EW_2796 | DOUBLE | Central posterior value for 
|
| 11 | EW_2803 | DOUBLE | Central posterior value for 
|
| 12 | EW_2796_ERR_LOW | DOUBLE | Lower error bar for 
|
| 13 | EW_2803_ERR_LOW | DOUBLE | Lower error bar for 
|
| 14 | EW_2796_ERR_HIGH | DOUBLE | Upper error bar for 
|
| 15 | EW_2803_ERR_HIGH | DOUBLE | Upper error bar for 
|
| 16 | Z_MGII | DOUBLE | Central posterior value for the redshift of the Mg ii absorption feature |
| 17 | AMP_2796 | DOUBLE | Central posterior value for the amplitude of the 2796 Å line |
| 18 | AMP_2803 | DOUBLE | Central posterior value for the amplitude of the 2803 Å line |
| 19 | STDDEV_2796 | DOUBLE | Central posterior value for the standard deviation of the 2796 Å line |
| 20 | STDDEV_2803 | DOUBLE | Central posterior value for the standard deviation of the 2803 Å line |
| 21 | Z_MGII_ERR_LOW | DOUBLE | Lower error bar for the redshift of the Mg ii absorption feature |
| 22 | AMP_2796_ERR_LOW | DOUBLE | Lower error bar for the amplitude of the 2796 Å line |
| 23 | AMP_2803_ERR_LOW | DOUBLE | Lower error bar for the amplitude of the 2803 Å line |
| 24 | STDDEV_2796_ERR_LOW | DOUBLE | Lower error bar for the standard deviation of the 2796 Å line |
| 25 | STDDEV_2803_ERR_LOW | DOUBLE | Lower error bar for the standard deviation of the 2803 Å line |
| 26 | Z_MGII_ERR_HIGH | DOUBLE | Upper error bar for the redshift of the Mg ii absorption feature |
| 27 | AMP_2796_ERR_HIGH | DOUBLE | Upper error bar for the amplitude of the 2796 Å line |
| 28 | AMP_2803_ERR_HIGH | DOUBLE | Upper error bar for the amplitude of the 2803 Å line |
| 29 | STDDEV_2796_ERR_HIGH | DOUBLE | Upper error bar for the standard deviation of the 2796 Å line |
| 30 | STDDEV_2803_ERR_HIGH | DOUBLE | Upper error bar for the standard deviation of the 2803 Å line |
| 31 | CONTINUUM_METHOD | STR | Method by which QSO continuum was determined while fitting ("NMF" or "Medianfilter") |
| 32 | LINE_S/N_MIN | DOUBLE | Minimum S/N value of the two Mg ii lines, used in initial detection |
| 33 | LINE_S/N_MAX | DOUBLE | Maximum S/N value of the two Mg ii lines, used in initial detection |
Note.
a Documented at https://github.com/desihub/redrock/blob/0.17.0/py/redrock/zwarning.py.Download table as: ASCIITypeset image
MgII-Absorbers-EDR.fits: Primary catalog containing 23,921 identified absorbers that appear physically possible, i.e., have velocity offsets less than 5000 km s−1 relative to the QSO redshift.
MgII-Absorbers-EDR-PI.fits: Secondary catalog containing 108 identified absorbers that appear physically impossible, i.e., have velocity offsets greater than 5000 km s−1 relative to the QSO redshift.
: Catalog Format
Footnotes
- 31
- 32
- 33
- 34
Note that quasar redshifts are commonly determined using broad emission features, which naturally have a higher uncertainty than the redshifts determined using narrow absorption features.
- 35
- 36
I.e., since Si iv has a wavelength of ∼1394 Å, the Vis. Rate would be equal to the fraction of absorption systems at z ≳ 1.87.