


Abstract
We report findings from a long-term photometric variability study of M dwarfs carried out at the SMARTS 0.9 m telescope at the Cerro Tololo Inter-American Observatory. As part of a multi-faceted effort to investigate the range of luminosities of M dwarfs of a given color on the Hertzsprung–Russell Diagram, 76 M dwarfs have been observed for 3–17 years in the Johnson–Kron–Cousins V band. We find that stars elevated above the center of the main sequence distribution tend to have higher levels of variability, likely caused by magnetic activity, than their fainter counterparts below the center. This study provides insight into how the long-term magnetic activity of these stars may be affecting their sizes, luminosities, and thus positions on the H-R Diagram.
Export citation and abstract BibTeX RIS
1. Introduction
M dwarfs represent at least 75% of stars in the solar neighborhood (Henry et al. 2006) and span larger ranges in luminosity and color than any other main sequence spectral type. These cool stars have main sequence lifetimes longer than the known age of the universe, and M dwarfs are prime candidates for habitable planet hosts. Although each M dwarf has a traditional habitable zone narrower and closer to the star than do solar-type stars, their ubiquity leads to them providing more aggregate habitable real estate than any other type of star (Cantrell et al. 2013). For instance, the closest star, the red dwarf Proxima Centauri, was recently discovered to have an orbiting terrestrial planet (Anglada-Escudé et al. 2016), and many other nearby red dwarfs are known to harbor planets as well (Bonfils et al. 2013).
As shown on the Hertzsprung–Russell (H-R) diagram in Figure 1, the main sequence significantly widens in the vertical (luminosity) direction for dwarfs of spectral class M1V through M5V. Figure 1 is the result of he RECONS8
(REsearch Consortium On Nearby Stars) effort to measure and compile parallaxes and high-quality UBVRIJHKs photometry values for more than 3000 stars within 25 pc using both RECONS data and values from the literature. The data provide a precise representation of the observational H-R diagram shown in Figure 1, using absolute V magnitudes versus  colors, and a zoom-in of the region of interest for this study is shown in Figure 2. The V magnitudes were obtained from our own work and various carefully vetted sources, primarily from Bessel (1990), Weis (1994, 1996), and Koen et al. (2010). The K magnitudes are Ks (hereafter, simply K) from 2MASS (Skrutskie et al. 2006). Distances are calculated using the weighted mean trigonometric parallaxes from the CTIOPI (Cerro Tololo Inter-American Observatory Parallax Investigation) project and additional references listed in Table 1.

Figure 1. RECONS 25 pc sample H-R diagram created using stars with accurate parallaxes, V magnitudes, and 2MASS Ks magnitudes from both the literature and RECONS observations. Our target Boxes 4, 5, and 6 (left to right), corresponding to their centers on the  axis, are outlined. The gray line through the main sequence is our polynomial fit to the data from
  , excluding outlier, young, and subdwarf stars, and is our reference for a star's vertical distance from the center of the distribution. The errors here are smaller than the points, and are thus not displayed on the plot.
Download figure:
Standard image High-resolution image
Figure 2. RECONS 25 pc sample H-R diagram from Figure 1 focused on the M dwarf region and our targets for this project. Our target Boxes 4, 5, and 6 (left to right), corresponding to their centers on the  axis, are outlined. The gray line through the main sequence is our polynomial fit to the data from
  , excluding outlier, young, and subdwarf stars, and is our reference for a star's vertical distance from the center of the distribution. The sample horizon of 25 pc for the nearest stars (circles) is extended to 50 pc for our young (squares) and subdwarf (triangles) stars to increase the number of stars available for those samples. Filled points (red for main sequence/unknown stars) indicate the 76 stars investigated in this study of long-term variability; most fall into Box 5.
Download figure:
Standard image High-resolution imageTable 1. Properties of the Target Stars
| Name | R.A. | Decl. | V | I | V − K | dist. | dist. | MV |

|
Obs. Date | Obs. Date | Duration | # Frames | Var. | Notea |
|---|---|---|---|---|---|---|---|---|---|---|---|---|---|---|---|
| (pc) | ref. | First | Last | (years) | (mmag) | ||||||||||
| (1) | (2) | (3) | (4) | (5) | (6) | (7) | (8) | (9) | (10) | (11) | (12) | (13) | (14) | (15) | (16) |
| SCR 0017–6645 | 00:17:23 | −66:45:12 | 12.45 | 10.00 | 4.75 | 39.0 | Rie14 | 9.49 | −1.97 | 2010 Jul 07 | 2015 Jul 24 | 5.05 | 70 | 34.8 | Y |
| G 266-089A | 00:19:37 | −28:09:46 | 14.27 | 11.44 | 4.80 | 31.8 | Jao11 | 11.76 | +1.23 | 2000 Nov 15 | 2005 Sep 12 | 4.83 | 62 | 7.6 | (S) |
| GJ 2006A | 00:27:50 | −32:33:06 | 12.95 | 10.29 | 4.94 | 33.2 | Rie14 | 10.34 | −1.61 | 2000 Jul 27 | 2010 Oct 27 | 10.25 | 69 | 76.8 | Y |
| GJ 2006B | 00:27:50 | −32:33:24 | 13.25 | 10.48 | 5.13 | 31.5 | Rie14 | 10.76 | −1.67 | 2000 Jul 27 | 2010 Oct 27 | 10.25 | 69 | 36.2 | Y |
| GJ 1025 | 01:00:56 | −04:26:56 | 13.36 | 10.55 | 5.14 | 11.4 | Jao05 | 13.08 | +0.63 | 2000 Jul 28 | 2015 Oct 31 | 15.26 | 80 | 18.5 | |
| GJ 105B | 02:36:04 | +06:53:12 | 11.71 | 8.88 | 5.14 | 7.2 | vLe07 | 12.42 | +0.05 | 2010 Dec 19 | 2015 Dec 18 | 15.00 | 40 | 12.5 | |
| L 174-028 | 02:37:52 | −58:45:11 | 12.47 | 9.76 | 4.96 | 15.0 | vLe07 | 11.59 | −0.35 | 2012 Dec 15 | 2016 Aug 17 | 3.67 | 33 | 15.8 | |
| LP 993-115A | 02:45:10 | −43:44:32 | 12.38 | 9.61 | 5.11 | 11.2 | Rie14 | 12.13 | −0.24 | 1999 Aug 16 | 2016 Aug 14 | 17.0 | 87 | 21.1 | Y |
| LP 771-095A | 03:01:51 | −16:35:36 | 11.22 | 8.66 | 4.72 | 7.0 | vLe07 | 11.99 | +0.61 | 1999 Aug 21 | 2015 Dec 17 | 16.32 | 211 | 17.7 | |
| LHS 1491 | 03:04:04 | −20:22:43 | 12.84 | 10.13 | 5.09 | 14.8 | Rie10 | 11.99 | −0.35 | 1999 Sep 15 | 2016 Jan 24 | 16.36 | 86 | 17.7 | |
| LHS 178 | 03:42:29 | +12:31:34 | 12.87 | 10.78 | 3.99 | 24.3 | YPC95 | 10.94 | +1.32 | 2009 Dec 04 | 2015 Sep 04 | 15.75 | 64 | 9.4 | S |
| GJ 1065 | 03:50:43 | −06:05:10 | 12.82 | 10.04 | 5.07 | 9.5 | Dav15 | 12.93 | +0.66 | 2004 Nov 01 | 2015 Oct 27 | 8.99 | 111 | 15.9 | |
| LHS 1610 | 03:52:41 | +17:01:04 | 13.85 | 10.66 | 5.80 | 9.9 | Hen06 | 13.87 | −0.11 | 1999 Sep 18 | 2016 Jan 17 | 16.33 | 183 | 29.0 | |
| GJ 166C | 04:15:22 | −07:39:35 | 11.24 | 8.31 | 5.28 | 5.0 | vLe07 | 12.75 | −0.04 | 2012 Sep 12 | 2015 Jan 27 | 6.36 | 54 | 24.9 | |
| LP 776-025 | 04:52:24 | −16:49:21 | 11.63 | 9.12 | 4.74 | 16.2 | Shk12 | 10.58 | −0.87 | 2004 Sep 23 | 2008 Feb 15 | 3.39 | 55 | 15.6 | Y |
| LHS 1731 | 05:03:20 | −17:22:25 | 11.69 | 9.16 | 4.75 | 9.2 | Jao05 | 11.87 | +0.39 | 1999 Dec 22 | 2015 Dec 20 | 15.99 | 215 | 13.6 | |
| BD 21-01074A | 05:06:50 | −21:35:09 | 10.41 | 8.45 | 4.29 | 18.3 | Rie14 | 9.10 | −1.20 | 2000 Jan 24 | 2012 Feb 29 | 12.10 | 72 | 52.9 | Y |
| GJ 203 | 05:28:00 | +09:38:38 | 12.47 | 9.80 | 4.93 | 9.7 | vLe07 | 12.53 | +0.57 | 2009 Dec 08 | 2015 Dec 18 | 6.03 | 76 | 15.1 | |
| LHS 1767 | 05:31:04 | −30:11:44 | 13.11 | 10.45 | 4.92 | 15.3 | Rie10 | 12.19 | +0.28 | 2003 Dec 15 | 2016 Jan 07 | 12.06 | 88 | 14.0 | |
| GJ 213 | 05:42:09 | +12:29:21 | 11.54 | 8.74 | 5.15 | 5.8 | vLe07 | 12.72 | +0.18 | 2010 Mar 01 | 2015 Dec 05 | 5.76 | 62 | 13.3 | |
| G 099-049 | 06:00:03 | +02:42:23 | 11.31 | 8.43 | 5.27 | 5.2 | Dav15 | 12.73 | −0.06 | 1999 Nov 27 | 2016 Mar 04 | 16.25 | 406 | 17.1 | |
| AP Col | 06:04:52 | −34:33:36 | 12.97 | 9.60 | 6.10 | 8.4 | Rie11 | 13.35 | −1.23 | 2004 Sep 28 | 2016 Jan 17 | 11.30 | 223 | 21.1 | Y |
| GJ 1088 | 06:10:52 | −43:24:17 | 12.28 | 9.61 | 4.97 | 11.4 | Rie10 | 12.00 | −0.05 | 2000 Nov 16 | 2016 Jan 21 | 15.18 | 105 | 20.9 | |
| L 032-008 | 06:33:46 | −75:37:30 | 11.43 | 8.82 | 4.87 | 9.0 | vLe07 | 11.66 | −0.12 | 2003 Dec 13 | 2016 Jan 21 | 12.11 | 197 | 15.0 | |
| GJ 273 | 07:27:24 | +05:13:32 | 9.85 | 7.17 | 4.99 | 3.8 | Gat08 | 11.95 | −0.11 | 2010 Jan 03 | 2016 Mar 13 | 6.19 | 81 | 14.4 | |
| LHS 1932 | 07:36:12 | −51:55:21 | 12.48 | 9.92 | 4.73 | 16.1 | Rie10 | 11.37 | +0.04 | 2000 Nov 15 | 2003 Feb 19 | 2.26 | 93 | 10.4 | |
| L 034-026 | 07:49:12 | −76:42:06 | 11.31 | 8.79 | 4.73 | 10.6 | Rie14 | 11.18 | −0.23 | 2006 Mar 16 | 2012 Nov 18 | 6.67 | 94 | 18.0 | Y |
| SCR 0757–7114 | 07:57:32 | −71:14:54 | 12.45 | 9.77 | 5.03 | 22.1 | Rie14 | 10.73 | −1.45 | 2008 Feb 14 | 2012 Nov 17 | 4.76 | 63 | 7.1 | Y |
| GJ 299 | 08:11:58 | +08:46:23 | 12.86 | 9.91 | 5.20 | 6.8 | YPC95 | 13.70 | +1.08 | 2010 Feb 28 | 2015 Dec 20 | 5.81 | 83 | 16.5 | (S) |
| LHS 2010 | 08:27:11 | −44:59:21 | 11.86 | 9.19 | 4.99 | 13.7 | Rei10 | 11.18 | −0.90 | 2001 Feb 21 | 2015 Mar 19 | 14.08 | 173 | 11.0 | |
| GJ 1123 | 09:17:05 | −77:49:23 | 13.15 | 10.16 | 5.70 | 9.0 | Jao05 | 13.38 | −0.40 | 2002 Mar 24 | 2015 Apr 23 | 13.08 | 132 | 20.3 | |
| GJ 358 | 09:39:46 | −41:04:03 | 10.78 | 8.27 | 4.72 | 9.5 | vLe07 | 10.89 | −0.50 | 2004 Dec 27 | 2015 Jan 23 | 10.07 | 143 | 30.2 | |
| GJ 1128 | 09:42:46 | −68:53:06 | 12.74 | 9.65 | 5.70 | 6.5 | Lur14 | 13.68 | −0.11 | 2000 Mar 24 | 2015 Jan 21 | 14.83 | 197 | 16.9 | |
| LHS 272 | 09:43:46 | −17:47:06 | 13.16 | 10.87 | 4.29 | 13.5 | Jao11 | 12.51 | +2.22 | 2001 Feb 22 | 2016 Jan 20 | 14.91 | 93 | 12.5 | S |
| GJ 1129 | 09:44:47 | −18:12:48 | 12.46 | 9.67 | 5.20 | 10.6 | Jao11 | 12.33 | −0.29 | 2000 Jan 23 | 2015 Apr 17 | 15.23 | 90 | 14.0 | |
| GJ 402 | 10:50:52 | +06:48:29 | 11.70 | 8.85 | 5.33 | 6.8 | vLe07 | 12.54 | −0.33 | 2010 May 23 | 2015 Apr 24 | 4.92 | 59 | 15.0 | |
| LP 491-051 | 11:03:21 | +13:37:57 | 12.96 | 10.24 | 5.05 | 15.4 | Shk12 | 12.02 | −0.25 | 2009 Apr 26 | 2016 Mar 15 | 6.05 | 52 | 12.9 | |
| LHS 2401 | 11:23:57 | −18:21:48 | 13.10 | 10.54 | 4.78 | 18.3 | Rei10 | 11.79 | +0.24 | 2001 Feb 23 | 2009 Apr 28 | 8.18 | 76 | 13.5 | |
| TWA 8A | 11:32:41 | −26:51:56 | 12.23 | 9.79 | 4.80 | 46.9 | Rie14 | 8.87 | −2.72 | 2000 Feb 21 | 2011 Feb 28 | 11.02 | 65 | 78.6 | Y |
| TWA 8B | 11:32:41 | −26:52:09 | 15.22 | 11.76 | 6.21 | 47.1 | Rie14 | 11.85 | −2.94 | 2000 Feb 21 | 2011 Feb 28 | 11.02 | 65 | 124.1 | Y |
| GJ 438 | 11:43:19 | −51:50:25 | 10.35 | 8.27 | 4.03 | 10.8 | Rie10 | 10.18 | +0.51 | 2000 Jan 25 | 2012 Feb 08 | 12.04 | 97 | 7.9 | |
| LHS 2520 | 12:10:05 | −15:04:16 | 12.09 | 9.30 | 5.23 | 12.8 | Rie10 | 11.55 | −1.12 | 2000 Jan 25 | 2015 May 25 | 15.33 | 95 | 15.0 | |
| SCR 1214–2345 | 12:14:08 | −23:45:17 | 13.96 | 10.78 | 5.73 | 10.9 | Rie14 | 13.77 | −0.07 | 2010 Feb 26 | 2015 May 29 | 5.26 | 82 | 23.1 | |
| GJ 1154 | 12:14:16 | +00:37:26 | 13.64 | 10.31 | 6.10 | 8.4 | YPC95 | 14.02 | −0.58 | 2010 May 26 | 2015 Apr 24 | 4.91 | 65 | 14.4 | |
| GJ 1156 | 12:18:59 | +11:07:34 | 13.80 | 10.34 | 6.23 | 6.5 | YPC95 | 14.73 | −0.11 | 2010 May 22 | 2015 May 26 | 5.01 | 60 | 17.4 | |
| GJ 1157 | 12:23:01 | −46:37:08 | 13.59 | 10.71 | 5.23 | 16.0 | Rie10 | 12.57 | −0.11 | 2001 Feb 21 | 2015 Mar 21 | 14.08 | 112 | 13.3 | |
| GJ 480.1 | 12:40:46 | −43:33:59 | 12.24 | 9.58 | 4.83 | 8.0 | vLe07 | 12.72 | +1.07 | 2003 Jul 05 | 2015 Apr 25 | 11.80 | 102 | 8.7 | (S) |
| GJ 486 | 12:47:56 | +09:45:05 | 11.40 | 8.68 | 5.04 | 8.4 | vLe07 | 11.78 | −0.40 | 2010 May 22 | 2015 May 30 | 5.02 | 69 | 11.6 | |
| LHS 346 | 13:09:20 | −40:09:27 | 12.86 | 10.24 | 4.87 | 16.1 | Jao05 | 11.83 | +0.04 | 2001 Feb 21 | 2004 Jun 11 | 3.31 | 71 | 8.3 | |
| LHS 2718 | 13:20:03 | −35:24:44 | 12.84 | 10.24 | 4.86 | 13.6 | Rie10 | 12.17 | +0.41 | 2001 Feb 23 | 2005 May 30 | 4.27 | 70 | 10.7 | |
| GJ 545 | 14:20:07 | −09:37:13 | 12.84 | 10.15 | 4.86 | 14.0 | Jao05 | 12.11 | +0.35 | 2000 Feb 21 | 2003 Apr 20 | 3.16 | 48 | 9.4 | |
| LHS 2899 | 14:21:15 | −01:07:19 | 13.12 | 10.39 | 5.03 | 13.3 | Rie10 | 12.50 | +0.31 | 2000 Feb 22 | 2015 Apr 25 | 15.17 | 94 | 17.0 | |
| GJ 581 | 15:19:26 | −07:43:20 | 10.55 | 8.04 | 4.71 | 6.2 | Lur14 | 11.59 | +0.20 | 2000 Jul 29 | 2015 Jul 19 | 14.97 | 279 | 14.6 | |
| GJ 609 | 16:02:50 | +20:35:21 | 12.58 | 9.73 | 5.21 | 10.0 | YPC95 | 12.58 | −0.03 | 2010 May 26 | 2015 Jul 18 | 5.14 | 69 | 11.9 | |
| LHS 3169 | 16:14:21 | −28:30:36 | 12.95 | 10.29 | 4.84 | 18.7 | Rie10 | 11.59 | −0.10 | 2000 Jul 30 | 2010 Mar 13 | 9.62 | 67 | 10.9 | |
| GJ 628 | 16:30:18 | −12:39:45 | 10.07 | 7.37 | 5.00 | 4.3 | Dav15 | 11.90 | −0.17 | 2003 Jul 05 | 2014 Jun 09 | 10.93 | 160 | 11.5 | |
| GJ 643 | 16:55:25 | −08:19:21 | 11.77 | 9.05 | 5.05 | 6.5 | Cos05 | 12.70 | +0.50 | 2003 Jul 09 | 2015 Apr 23 | 11.79 | 142 | 9.4 | |
| GJ 1207 | 16:57:05 | −04:20:56 | 12.25 | 9.43 | 5.13 | 8.7 | Hen06 | 12.55 | +0.13 | 1999 Aug 16 | 2014 Jun 14 | 14.83 | 247 | 18.4 | Y |
| LHS 3295 | 17:29:27 | −80:08:57 | 12.18 | 9.53 | 4.95 | 12.5 | Rie10 | 11.70 | −0.11 | 2000 Jul 27 | 2004 Mar 31 | 3.68 | 74 | 8.9 | |
| GJ 2130A | 17:46:12 | −32:06:09 | 10.50 | — | 4.25 | 14.1 | Hen06 | 9.75 | −0.43 | 1999 Aug 21 | 2005 Sep 15 | 6.07 | 73 | 11.8 | |
| GJ 693 | 17:46:34 | −57:19:08 | 10.77 | 8.20 | 4.75 | 5.8 | vLe07 | 11.95 | +0.48 | 2003 Jul 06 | 2015 Apr 25 | 11.80 | 191 | 11.1 | |
| LTT 07419A | 18:43:12 | −33:22:31 | 10.25 | 8.28 | 3.92 | 15.2 | Cos06 | 9.34 | −0.07 | 2000 Jul 27 | 2003 Apr 19 | 2.73 | 53 | 9.5 | |
| GJ 729 | 18:49:49 | −23:50:10 | 10.50 | 7.68 | 5.13 | 3.0 | Dav15 | 13.11 | +0.71 | 1999 Aug 16 | 2014 Aug 29 | 15.04 | 134 | 10.6 | |
| LHS 3443 | 19:13:07 | −39:01:53 | 12.39 | 9.85 | 4.73 | 20.5 | Rie10 | 10.83 | −0.60 | 2000 Jul 29 | 2009 Sep 29 | 9.17 | 69 | 9.4 | |
| LHS 475 | 19:20:54 | −82:33:16 | 12.69 | 10.00 | 5.00 | 12.0 | Jao11 | 12.29 | +0.17 | 2000 Jul 27 | 2015 May 29 | 14.84 | 158 | 10.8 | |
| LHS 499 | 20:51:41 | −79:18:39 | 11.81 | 9.64 | 4.15 | 17.5 | Jao11 | 10.59 | +0.65 | 2003 Dec 14 | 2007 Oct 02 | 3.80 | 62 | 6.3 | |
| LP 816-060 | 20:52:33 | −16:58:29 | 11.50 | 8.64 | 5.30 | 5.7 | vLe07 | 12.72 | −0.04 | 2003 Jul 08 | 2014 Aug 25 | 11.13 | 164 | 19.0 | |
| LHS 512 | 21:38:43 | −33:39:55 | 12.55 | 9.89 | 4.98 | 12.1 | Jao05 | 12.14 | +0.08 | 2000 Jul 27 | 2015 May 27 | 14.83 | 94 | 11.2 | |
| G 188-038 | 22:01:13 | +28:18:24 | 12.05 | 9.17 | 5.27 | 9.0 | vLe07 | 12.28 | −0.41 | 2009 Jul 22 | 2015 Jul 20 | 5.99 | 66 | 19.0 | |
| LHS 3746 | 22:02:29 | −37:04:51 | 11.76 | 9.04 | 5.04 | 7.4 | Hen06 | 12.41 | +0.19 | 1999 Sep 16 | 2015 Jul 18 | 15.84 | 335 | 13.2 | |
| GJ 849 | 22:09:40 | −04:38:26 | 10.38 | 7.87 | 4.79 | 9.0 | Lur14 | 10.61 | −0.94 | 2003 Jul 09 | 2015 Oct 26 | 12.30 | 148 | 12.7 | |
| LHS 3799 | 22:23:07 | −17:37:01 | 13.30 | 10.04 | 5.98 | 7.4 | Rie14 | 13.95 | −0.38 | 2003 Jul 08 | 2014 Sep 03 | 11.15 | 131 | 13.2 | Y |
| GJ 876 | 22:53:16 | −14:15:49 | 10.18 | 7.40 | 5.17 | 4.7 | Lur14 | 11.82 | −0.69 | 2003 Jul 09 | 2014 Oct 21 | 11.28 | 76 | 28.1 | |
| GJ 1277 | 22:56:24 | −60:03:49 | 14.00 | 10.79 | 5.89 | 10.2 | Jao11 | 13.96 | −0.23 | 2001 Nov 15 | 2015 Oct 28 | 13.95 | 120 | 10.4 | |
| GJ 1284 | 23:30:13 | −20:23:27 | 11.12 | 8.59 | 4.79 | 16.1 | Rie14 | 10.13 | −1.29 | 2003 Jul 05 | 2011 Jul 06 | 8.00 | 95 | 27.1 | Y |
| LHS 4058 | 23:59:51 | −34:06:42 | 12.84 | 10.08 | 5.09 | 15.8 | Rie10 | 11.85 | −0.49 | 2000 May 30 | 2015 Nov 04 | 15.43 | 84 | 11.5 |
Note.
aNotes in Column 16: Y—known young stars, S—known subdwarf stars, (S)—suspected, but unconfirmed subdwarf stars.References. (Cos05) Costa et al. (2005), (Cos06) Costa et al. (2006), (Dav15) Davison et al. (2015), (Gat08) Gatewood (2008), (Hen06) Henry et al. (2006), (Jao05) Jao et al. (2005), (Jao11) Jao et al. (2011), (Lur14) Lurie et al. (2014), (Rie10) Riedel et al. (2010), (Rie11) Riedel et al. (2011), (Rie14) Riedel et al. (2014), (Shk12) Shkolnik et al. (2012), (vLe07) van Leeuwen (2007), (YPC95) van Altena et al. (1995).
From Figures 1 and 2 and other H-R diagram representations, such as the MI versus  representation in Figure 3, it is clear that the main sequence drastically widens in luminosity for M dwarfs for various colors selected in the optical and near-infrared. The width in luminosity is ∼4 mag9
through much of the M dwarf region, corresponding to a factor of ∼40. This implies that M dwarfs with similar spectral energy distributions (SEDs) vary by more than a factor of 6 in radius. The causes of this widening are still not fully explored nor understood.
representation in Figure 3, it is clear that the main sequence drastically widens in luminosity for M dwarfs for various colors selected in the optical and near-infrared. The width in luminosity is ∼4 mag9
through much of the M dwarf region, corresponding to a factor of ∼40. This implies that M dwarfs with similar spectral energy distributions (SEDs) vary by more than a factor of 6 in radius. The causes of this widening are still not fully explored nor understood.

Figure 3. RECONS 25 pc sample H-R diagram created using stars with accurate parallaxes, I magnitudes, and 2MASS Ks magnitudes from both the literature and RECONS observations. Filled red points indicate targets from the complete sample of 657 stars with reliable I photometry, located within the three boxes on Figures 1 and 2. This serves to confirm the observed broadening of the main sequence for M0V to M5V stars using various color indices.
Download figure:
Standard image High-resolution imageOur goal is to use observational techniques to investigate M dwarfs of similar colors/SEDs/temperatures with different luminosities to provide a framework in which to understand the effects of various characteristics on low-mass stars. In Section 2 we describe how we are mapping the properties of M dwarfs at different absolute magnitudes above, on, and below the main sequence and discuss possible astrophysical causes of the widening of the main sequence.
In this paper, we examine the influence of magnetic field activity on the observed broadening of the main sequence using an observable proxy for magnetic fields, long-term photometric variability, as outlined in Section 3. The sample for this paper is described in Section 4, where we focus on long-term photometric monitoring of 76 red dwarfs of spectral type M0V to M5V with various values of vertical location,  , from the fitted center of the main sequence. Observations and data reduction are detailed in Section 5. Results are discussed in Section 6, and a summary of our conclusions is given in Section 7. Ultimately, careful study of the stars described here lays the groundwork for continuing efforts to understand the details of which properties are important in setting the luminosities and temperatures of the smallest stars, thereby providing information for more accurate models for the most abundant stars in the universe.
2. This Project: A Study of the Wide Main Sequence
The RECONS 25 pc list, which contains more than 3000 stars within 25 pc, has been used to extract nearby red dwarfs for our study. Each star in this list has a trigonometric parallax of at least 40 mas with error less than 10 mas, reliable V and K magnitudes, and is believed to be a single star given current data, or is a member of a wide multiple (separation ≥4'') for which each component can be resolved and observed individually. This sample has been augmented with additional known young stars and cool subdwarfs out to 50 pc (with comparable errors to the 25 pc sample) in order to boost the number of these candidates for observations.
Three specific regions of the observational H-R diagram to be investigated are outlined in Figures 1 and 2. We refer to these as Boxes 4–6, relative to the  values corresponding to their centers on the x-axis. Each is 0.6 magnitudes wide in
  color. These target regions have been carefully chosen to focus observing programs while providing robust samples of the different types of M dwarf stars bright enough for our observations: young stars, main sequence stars, and subdwarfs—stars of each type are present in all three boxes. In addition, stars with radiative cores (early-type M dwarfs) are found in Box 4, those that are fully convective (late-type M dwarfs) are in Box 6, and those located in the "transition region" are in Box 5. The transition region between stars with radiative cores and those that are fully convective is expected to occur near 0.35 M⊙ (Chabrier & Baraffe 1997), which corresponds to
  and
and  . Thus, the selection of these three regions enables us to compare the observational effects resulting from different methods of energy transfer in the stars. Ultimately, comparing the photometric variability of stars in both the luminosity and color axes will allow us to better understand the role convection plays in the magnetic field activity of M dwarfs. By examining Figures 1–3, we can already conclude that the spread in luminosity is not remarkably different in the three regimes because of different energy transport mechanisms. Despite a sampling bias that results in fewer stars in Box 6, the magnitude spread for stars of the same
  is still more than 4 magnitudes.
The notable widening of the main sequence illustrated in Figures 1–3 for spectral classes M0V to M5V is a recognized, yet poorly understood, characteristic of the red dwarf population. There are several properties of these red dwarf stars that are likely contributing to this observed width, and it is our goal to better understand the role each of these properties plays.
- 1.Age. Young red dwarfs with ages less than ∼200 Myr (Bell et al. 2015) are much brighter than their older counterparts of the same color. This is due primarily to their larger sizes, as they have not yet completed gravitational contraction to their final equilibrium radii (David et al. 2016). Stars with masses of 0.6 M⊙ take ∼120 Myr to reach the zero age main sequence, while those with masses of only 0.1 M⊙ take ∼1.5 Gyr (D'Antona & Mazzitelli 1985; Baraffe et al. 2015). In addition, red dwarfs remain in an elevated state of activity longer than the higher-mass stars (West et al. 2008), which may also contribute to higher flux and/or variability levels. The opposite is true for older stars, known as cool subdwarfs, which have reached their ultimate size (at least for eons) and are typically less active (Jao et al. 2011).
- 2.Magnetic Fields. The magnetic properties of early-type red dwarfs are generally correlated with age, but late-type red dwarfs exhibit the characteristic spots and flares due to magnetic activity presumably long after they have stopped contracting (West et al. 2004, 2008). For example, cluster surveys targeting the age–activity relation in low mass stars—such as those carried out by Stauffer et al. (1991) and Prosser (1992)—have produced various results. The work done by Stauffer on the Pleiades and Hyades found through Ca ii K and Hα emission measurements that activity decay timescales increase toward lower-mass stars, while Prosser's work on Alpha Perseids found that Hα emission strength in M0V to M4.5V type stars decreases toward older systems, but with no mention of timescales for activity decay. Surveys of M dwarf stars in the solar neighborhood have found that there is no age–activity relation for stars later than type M5V (Hawley 1993), at least on short observational timescales. Magnetic fields affect stellar brightnesses, and thus vertical locations relative to the main sequence, in several ways, each of which can be observed over different timescales: (1) short-term effects can be seen via brightness changes due to solar flares over minutes to hours, (2) mid-term effects can be detected by measuring the rotation periods of stars as spots rotate in and out of view over hours to months, and (3) long-term effects of starspot cycles are studied via steady changes in brightness as the number of spots increases or decreases over years. A comprehensive study of long-term activity in M dwarfs that does not suffer from short-term sampling effects is needed, and is a reason for the variability study presented here that explores magnetic field activity.
- 3.Metallicity. Often, the main sequence widening for M dwarfs has been solely attributed to varying metallicities in these stars. However, metallicity alone is not a complete solution to the issue, as illustrated in the H-R diagram for the Hyades in Figure 4. Data have been gathered from Goldman et al. (2013) and compiled using photometric data from the 2MASS and UCAC4 (Zacharias et al. 2013) catalogs for stars with membership probabilities of at least 50% from van Altena (1969), Hanson (1975), or Reid (1993) (V photometry from Reid 1993 were used when UCAC4 values were not available). It is generally assumed that each Hyad formed at the same time from the same interstellar material with a metallicity of [Fe/H] = +0.107, and there is no evidence of an [Fe/H] difference between Hyades dwarfs and giants (Taylor 1994); a modest abundance dispersion of 0.021 ± 0.003 dex (Liu et al. 2016) cannot account for the observed broadening of the main sequence. The current accepted age for the Hyades is 625 ± 50 Myr (Perryman et al. 1998), and a modest spread in age cannot explain the ∼2.5 mag spread in the central Box shown, which mimics our central Box 5 outlined for our sample in Figures 1 and 2. However, two Hyads with the same color, age, and metallicity, and presumably mass, do not necessarily have the same magnetic field properties, which can be indirectly studied by measuring photometric variability.Metallicity variations are undoubtedly an important contributor to the widening of the main sequence for the heterogeneous sample of low-mass stars within 25 pc. The stellar population in the solar neighborhood is a mixture of star formation events, resulting in significantly more low-metallicity M dwarf stars than low-metallicity, high-mass stars, which have relatively short stellar lifetimes and in many cases have joined the nearby white dwarf population. For a given mass, sub-solar metallicities result in bluer M dwarf stars, moving them significantly to the left and slightly up on the H-R diagram, and thus below the main sequence (Jao et al. 2008). Extremely high metallicity values could account for some of the spread above the main sequence, but this has not yet been confirmed for stars several magnitudes above the center of the distribution. Our work for this project (to be presented in a future paper) includes a spectroscopic assessment of metallicity across the luminosity spread for stars in the sample. There have been several spectroscopic efforts to assess the metallicity of M dwarfs, such as those of Bonfils et al. (2005), Rojas-Ayala et al. (2012), and Neves et al. (2014), each of which has its own strengths, and we will compare our results to these previous efforts in our future work.
- 4.Multiplicity. Unresolved companions will certainly elevate points on an observational H-R diagram, boosting the location by 0.7 mag for an equal-luminosity binary. However, the samples of 25 pc stars and supplemental samples of young stars and subdwarfs in Figures 1–3 have been carefully vetted by the RECONS team for close multiples. While there will be a few close systems not yet resolved, the vast majority of stars plotted are known to be single; all known unresolved multiples have been removed from our sample and any newly resolved stars will be removed as they are discovered. Even if the sample had not been vetted carefully, the overall M dwarf multiplicity fraction is only ∼28% (Winters 2015), which is insufficient to account for the dispersions seen in Figures 1–3.
- 5.Miscellaneous Properties. Other properties that may contribute to the wide dispersion in brightness and radius of these stars include the depth of the convection zone (i.e., mixing length) and rotational velocity (v sin i). In the latter case, inclination may affect the brightness measured for the star, such as in the case for higher-mass stars (McAlister et al. 2005). To date, no studies have been carried out to explore these properties and their relation to vertical main sequence position for a large number of M dwarf stars. The spectroscopy component of our work will aim to take a closer look at the influence of rotational velocities, in particular.

Figure 4. Members of the Hyades are shown on an H-R diagram created using accurate apparent V magnitudes and 2MASS Ks magnitudes from the literature for 400 high probability Hyades members. For comparison, the plot uses variables from the same filters as Figure 1, and our sample boxes are adjusted for apparent magnitudes and included. The Hyades main sequence begins to slightly widen past spectral type M0, despite the uniform metallicity and age throughout the star cluster. The data used to create this figure were gathered from the references described in Section 2.
Download figure:
Standard image High-resolution image3. Photometric Variability and Magnetic Fields
For this study we define photometric variability as the standard deviation in the flux of a target star, in milli-magnitudes (mmag), when compared to a set of reference stars in the same field. Here we focus on the contributions of magnetic fields to the width of the main sequence through the analysis of long-term photometric variability of nearby M dwarfs in the V band. Measuring the brightness of a star over many years reveals its long-term photometric variability and, by proxy, information about manifestations on the stellar surface, e.g., spots, faculae, and flares, caused by interior magnetic activity (Messina & Guinan 2002). Our goal is to examine a sample of M dwarfs for three years or more10 to detect changes in brightness in the V band that are indicative of magnetic activity and cycles like the Sun's 11 year sunspot cycle. With three to five images taken over ∼30 min several times per year, we also obtain limited information on the short-term timescales of flares and mid-term timescales mentioned above and discussed briefly below. Each of the long-, mid-, and short-term timescale indicators of magnetic fields uses a photometric technique, but each requires a different cadence of observations. Our data set is most suited to the long-term cycle study.
Short-term photometric variability studies investigate immediate activity such as flares and coronal mass ejections that are correlated with strong magnetic field strengths at stellar surfaces. Studies such as those done from space with Kepler (Walkowicz et al. 2011) and from the ground at Apache Point (Kowalski et al. 2013) and Mt. Hopkins (Chang et al. 2015) spot short-duration and/or large stellar flares, giving clues to the current starspot activity and surface level magnetic field strengths. These flares are caused by the release of large amounts of magnetic energy from the quick breaking and reconnecting of magnetic field lines. These lines become twisted because of the different rotation rates of the stellar core, where the magnetic field is produced, and the surface of the star, where the magnetic field lines emerge (Kopp & Pneuman 1976). This type of activity tends to be more extreme in younger stars, though the information available for stars cooler than the fully convective limit near spectral type M3.5V (Shulyak et al. 2014) is sparse, so they are not well understood. In addition to the long-term study described here, we are collecting data to study the short-term variability of these stars for this project.
Mid-term photometric variability studies are those that investigate brightness changes on timescales of days to months due to starspots, which are the result of magnetic field activity moving into and out of view. Thus, such studies reveal the rotation periods of stars, which for M dwarfs range from a few hours to several months (e.g., Irwin et al. 2011; Newton et al. 2016). Such studies fall between our short-term and long-term studies, providing an ideal complement to our efforts, though our work does not focus on this timescale.
Long-term photometric variability is the focus of this paper. Here we use data sets on 76 M dwarfs spanning up to 17 years that have been acquired at the CTIO/SMARTS 0.9 m telescope as part of the RECONS astrometry/photometry program. Monitoring the variability over years gives insight into the stellar activity of these stars, revealing (a) whether or not any cycle is evident above the threshold of the observations, and (b) the degree to which changes are seen. It is our hypothesis that stars that are more variable over the long-term will be more luminous than their less active counterparts. Our supposition is that high activity levels caused by strong magnetic fields may buoy the layers of a star and make it larger. By monitoring the stars for years we can hope to not only detect the overall levels of activity, but in some cases measure the periods of brightness increasing and decreasing due to the interior magnetic activity. As in the Sun, for M0V–M2V stars with radiative zones, cycles are likely the result of dynamo waves produced in the convection zones migrating from the poles to the equators of the stars. As the dynamo waves migrate, star spot production is increased near the equator, and the time it takes to complete these migrations is directly proportional to the period of a stellar activity cycle (Parker 1955). Magnetism in M4V–M5V fully convective stars is not completely understood, as no fully satisfactory theories have been proposed.
Short-, mid-, and long-term variability are all important tools for understanding the magnetic activity of low-mass stars. Because each requires a different observational program over a different time period, we will report results for our short-term and long-term studies separately. Here we present the results of relative photometry gathered over many years for M dwarfs and assess the relationship between long-term activity levels and vertical positions of stars on the H-R diagram.
4. M Dwarf Sample Characterization and Selection
4.1. Stars Relative to the Main Sequence
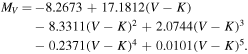
The observational H-R diagrams in Figures 1–3 were created using data gathered by the RECONS team. The solid, gray curved line in Figures 1 and 2 represents a fit to points that are not known young stars (pink squares) or subdwarfs (green triangles), and deviations for target stars were calculated as offsets from this fit curve. The curve was derived using the IDL procedure poly_fit with a fifth-order polynomial fit to points on the lower main sequence from spectral types ∼K5V to M6V ![$[(V-K)=3\mbox{--}7]$](https://content.cld.iop.org/journals/1538-3881/154/3/124/revision1/ajaa8464ieqn14.gif) that lie within one magnitude of the central distribution of points along the main sequence. Thus, extreme outliers did not drive the fit, but the slight curve in the bulk distribution of points is maintained in the fit. This fit is described by the fifth-order polynomial equation:
that lie within one magnitude of the central distribution of points along the main sequence. Thus, extreme outliers did not drive the fit, but the slight curve in the bulk distribution of points is maintained in the fit. This fit is described by the fifth-order polynomial equation:
The region of the main sequence for the G and K spectral classes has an average width in luminosity of ∼1 mag in MV, as shown in Figure 1, so, for this work, we define an M dwarf to be "on" the main sequence if it lies within half a magnitude above or below this central fit of the distribution. The deviation, or distance, from the main sequence is determined by calculating an MV value on the fit for the  value of a given star, then subtracting the MV of the fit from the known MV of the star. For the sample of 657 stars in the three boxes for this study, 421 (64.1%) are within 0.5 mag of the fit, 590 (89.8%) are within 1.0 mag of the fit, and 622 (94.7%) are within 1.5 mag of the fit. Overall, stars in this study span the region from 3.5 mag above (negative
  ) to 2.5 mag below (positive
  ) for the most extreme young stars and subdwarfs, respectively.
4.2. M Dwarf Sample for the Long-term Variability Study
Our target pool of 657 M dwarfs lies within the three boxes outlined in Section 2 and shown in Figures 1 and 2, and is comprised of three samples of stars.
- 1.A total of 204 stars within 25 pc that form the bulk of points in the H-R diagram. We consider these stars as being "on the main sequence" because they lie within 0.5 mag of the fit shown in Figure 2.
- 2.A total of 385 stars within 25 pc more than 0.5 mag from the central fit that are not known to be young or subdwarf stars.
- 3.A total of 31 stars within 50 pc that are elevated in the H-R diagram and show indications that they are younger than ∼200 Myr. These M dwarfs were identified as nearby, young stars in Riedel et al. (2014) and references therein by (1) astrometric methods to determine moving cluster associations with young moving groups such as TW Hydra and β Pictoris, and/or (2) spectroscopy for the detection of the presence of lithium. By "young" we mean pre-main sequence stars with ages of 200 Myr or less (Bell et al. 2015), even though M dwarfs may remain active for much longer than this—∼1 Gyr for spectral type M0 and ∼7 Gyr for M5 according to West et al. (2008). Young stars are elevated above the main sequence due to their larger radii because they have not yet finished contracting.
- 4.A total of 37 stars within 50 pc classified as M-type subdwarfs that lie below the main group of stars on the H-R diagram.11 Subdwarfs are relatively rare and are difficult to identify because they are intrinsically faint and high-resolution spectra are typically required. These stars have low metallicities of
![$[m/H]\leqslant -0.5$](data:image/png;base64,iVBORw0KGgoAAAANSUhEUgAAAAEAAAABCAQAAAC1HAwCAAAAC0lEQVR42mNkYAAAAAYAAjCB0C8AAAAASUVORK5CYII=) and high space velocities due to their advanced ages (see e.g., Jao et al. 2011). Because of their low metallicities, M subdwarfs have lower atmospheric opacities than main sequence stars, revealing deeper, hotter layers that consequently move subdwarfs to bluer, hotter locations on the H-R diagram. Almost all of the subdwarf stars in our sample lie between 1 and 4 mag below the fit in Figure 2, but we note that this range is primarily caused by a temperature displacement and is not necessarily a result of smaller radii.
and high space velocities due to their advanced ages (see e.g., Jao et al. 2011). Because of their low metallicities, M subdwarfs have lower atmospheric opacities than main sequence stars, revealing deeper, hotter layers that consequently move subdwarfs to bluer, hotter locations on the H-R diagram. Almost all of the subdwarf stars in our sample lie between 1 and 4 mag below the fit in Figure 2, but we note that this range is primarily caused by a temperature displacement and is not necessarily a result of smaller radii.
![$[m/H]\leqslant -0.5$](https://content.cld.iop.org/journals/1538-3881/154/3/124/revision1/ajaa8464ieqn19.gif)
The long-term photometric observations of the 76 stars listed in Table 1 are concentrated on stars in Box 5 for observational reasons. Brighter stars were typically not targeted in the astrometry program because parallaxes were already available and/or exposures were too short to provide good centroids for astrometric positions. Fainter stars were typically observed in the R or I filters, rather than V, which is used for the current study. In total, eight stars are found in Box 4, including one known young star and three known subdwarfs. There are 57 stars in Box 5, including 10 young stars and three suspected subdwarfs. In the reddest region, Box 6, there are 11 observed stars, including three known young stars, but no subdwarf stars.
5. Observations and Data Reduction
All relative photometry data used here were obtained during the RECONS astrometric/photometric program carried out on the Small & Moderate Aperture Research Telescope System (SMARTS) 0.9 m telescope at CTIO near La Serena, Chile. Hundreds of stars within 25 pc have been observed several times a year for up to 17 years. This effort has revealed stellar flares, stellar cycles, and even steady, long-term brightness changes for red dwarfs.
Observations were made using the 2048 × 2046 Tektronix CCD detector, with a scale of 401 mas pixel–1, which has been used routinely since 1999 in a configuration that utilizes the central quarter of the chip, providing a field 6 8 on a side. Astrometric and photometric results for various populations of stars can be found in the papers in this series (subdwarfs in Jao et al. 2005, 2011, 2014; nearby stars in Henry et al. 2006; white dwarfs in Subasavage et al. 2009; young stars in Riedel et al. 2011, 2014; brown dwarfs and very low mass stars in Dieterich et al. 2014; large photometric survey results in Winters et al. 2011, 2015), where additional details of the observing protocol and data reduction can be found. The first long-term study of M dwarf photometric variability was published in Hosey et al. (2015), which includes variability of red dwarfs in each of the VRI bands.
Only observations taken in the V filter are included in this study, as a result of past experiments showing that variability is more easily detected in V than at R or I for these stars (Hosey et al. 2015) and because these red dwarfs are generally too faint for efficient monitoring in the U or B bands at the CTIO 0.9 m. Images were taken through one of two Johnson V filters that peak at 5438 and 5475 Å. The two filters are photometrically identical to ∼7 mmag, as described in detail in Jao et al. (2011), where three non-pulsating white dwarfs with rich data sets in both V filters were tested and found to differ by less than ∼7 mmag. As shown below, several red dwarfs observed with both V filters are found to vary by 6–8 mmag, so the filters are effectively identical for red dwarfs as well.
The 76 M dwarfs in the current study are listed in Table 1, with 2000.0 coordinates, V and I magnitudes (range 7–16), and V − K colors (range 3.92–6.23). If the star is known or believed to be young (Y) or a subdwarf (S), it is noted as such in the final column. Exposure times generally ranged from 30 to 300 s, depending on seeing, which was typically 0 8 to 20. The target star is almost always the brightest star in the field, and its position is adjusted so that there are five to ten reference stars surrounding the target star that are within ∼4 mag in V. These reference stars are used to calculate the relative changes in both position (for astrometry) and magnitude (for variability) of the target star(s). The distances to the stars and references are listed in columns 7 and 8; these are used to provide the MV values (column 9) needed to calculate the listed
  offsets (column 10) from the fits shown in Figures 1 and 2.
The first and last dates of observation are given in columns 11 and 12 in Table 1, as well as the duration of the observations and the number of frames (columns 13 and 14). Each star was observed on 2–4 different nights a year, with typically five consecutive exposures per observation, over time periods of 3–17 years. Figure 5 illustrates the time coverage for the sample of 76 stars.

Figure 5. Histogram demonstrating the coverage, from 3–17 years, of the 76 stars included in this study. Solid blue represents main sequence or stars not confirmed to be young or subdwarfs. Pink represents known young stars. Blue and white lined represents subdwarfs. The bin sizes are 2 years, starting at 2 years and ending at 18 years.
Download figure:
Standard image High-resolution imageFollowing initial processing, which includes flat-fielding and bias subtraction using frames acquired nightly, the relative photometric comparisons are carried out according to the methods outlined in Jao et al. (2011) and Hosey et al. (2015). This process uses a combination of IDL and IRAF procedures to calculate the photometric changes of the target star relative to the grid of reference stars, resulting in the overall variability values given in column 15 of Table 1. During data reduction, each frame is checked for saturated target and reference stars, as well as other abnormalities that may affect the quality of the results—very poor seeing, high image ellipticity, star trailing, high background, heavy clouds, or filter problems. Frames in which the target star is saturated are removed. If a reference star is saturated, the frame is still used but the reference star is dropped. Reference stars found to be variable by more than the instrumental magnitude standard deviation (typically ∼10 mmag) are discarded and the variability calculations are run again using only the "quiet" reference stars. The fluxes of reference stars are compared to the flux of the target star as an ensemble, resulting in a single magnitude difference between the target and reference field for each frame. Because this technique uses relatively bright stars, modest cloud coverage and seeing up to ∼20 can be tolerated.
6. Results
6.1. Individual Stars
Before discussing the overall results of the survey, we provide context by showing our findings for 12 stars in Figures 6 and 7. Each panel shows the changing brightness at V in mag over time; as stars grow brighter, points move up in the panels. As we found in Hosey et al. (2015), we consider stars varying by less than 20 mmag to be relatively quiescent as this represents a ∼3-σ detection of variability given our floor of 7 mmag.

Figure 6. Each panel shows a light curve for the title star with the change in apparent V magnitude vs. time in years. In the upper right corner of each plot is the calculated value for the overall variability of each star. These light curves show a sample of our relatively inactive targets, a few of which still show evidence of low-level cyclic activity. The stars are numbered 1 through 6 and are noted as such in Figure 10 and detailed in Section 6.1.
Download figure:
Standard image High-resolution image
Figure 7. Each panel shows a light curve for the title star with the change in apparent V magnitude vs. time in years. In the upper right corner of each plot is the calculated value for the overall variability of each star. These light curves show active targets that are of particular interest. The stars are numbered 7 through 12 and are noted as such in Figure 10 and detailed in Section 6.1.
Download figure:
Standard image High-resolution imageIn Figure 6 we show the light curves for six relatively quiet stars showing minimal activity, or perhaps low-level photometric cycles. These stars range from being far below to just slightly above the main sequence—consistent with our hypothesis that such stars would show little to no activity.
The top two panels of Figure 6 show GJ 480.1 and GJ 64312
with effective baseline variability values of only 8.7 mmag and 9.4 mmag, respectively. Given their positions below the main sequence at  mag and +0.50 mag, respectively, these light curves are predictably flat.
The middle panels of Figure 6 show results for G 099-049 and L 032-008, both of which show low-level cyclic activity even though their overall photometric variabilities of 17.1 mmag and 15.0 mmag, respectively, are in the regime below 20 mmag for quiescent stars. At  , G 099-049 is located almost directly on the main sequence fit, despite its high activity status as a flare star with spectral type M3.5Ve (Davison et al. 2015). L 032-008 is the secondary to L 032-009, separated by 23''. At
  , it is on the main sequence, and the tentative cycle we find here warrants further observations to better map the activity for a star in the midst of the distribution of M dwarfs in Box 5 of our sample. We note that, although with V − K = 4.58, L 032-009 falls between Boxes 4 and 5, it varies by an amount similar to that of L 032-008 (13.9 mmag at V).
In the lower two panels of Figure 6 we show results for LHS 2010 and LHS 3746, neither of which shows any significant activity. These two stars are virtually identical in color  and 5.04, respectively, and on opposite sides of the main sequence at
  and +0.19, yet they both show almost no activity nor evidence of periodicity.
Figure 7 shows six of the most interesting light curves, five of which exhibit activity levels ( mmag) beyond our threshold for relatively quiescent stars.
LHS 1610 is located on the main sequence at  and shows significant variability (29.0 mmag) with a flux decrease of ∼10% from 2003–2008. This star also exhibits large short-term variations that are superimposed on the longer cycle, likely indicative of large spots on its surface.
AP Col is the nearest (8.4 pc) known pre-main sequence star (Riedel et al. 2011), with an estimated age of 12–50 Myr. With  , this star lies well above the main sequence and appears to have a cycle lasting longer than the 11 years over which we have data, and measured variability of 21.1 mmag. What is somewhat surprising is that it is not more variable on short timescales, as might be expected if the star consistently exhibited a few large spots. Alternatively, it could be that its surface typically has many spots, so that short-term variations are muted.
GJ 299 shows a long-term decrease over six years of observations from 2010–2016, although the formal variability measurement of 16.5 mmag is not large. It is located far below the main sequence at  and is likely a subdwarf, so we do not expect extreme variability. Nonetheless, the long-term fading that is observed is worthy of continued monitoring.
GJ 2006B is part of a young binary separated by 18''. At  , this star is well above the main sequence and the large observed photometric variations (36.2 mmag) are consistent with its elevated H-R diagram location. In the 11 years of observations in-hand, we do not detect an obvious periodicity or trend. A similar result is observed for its primary GJ 2006A (
 ), though with more than twice the variability value at 76.8 mmag.
GJ 358 exhibits strong cyclic activity, for which we measure a variability of 30.2 mmag and a possible period on the order of 10 years. It lies above the main sequence at  .
.
GJ 1284 is a known young star well above the main sequence, with  , for which we find a variability of 27.1 mmag. The brightness at V changed rather abruptly by ∼5% from late 2006 to late 2007 and the star has continued to gradually get brighter.
6.2. Variability Results
Results for the variability measurements at V for the 76 stars in Table 1 are illustrated in Figures 8–10. As shown in Figure 8, we confirm with our current data set the lower observational limit for variability of ∼7 mmag described in Jao et al. (2011) and Hosey et al. (2015). As in Hosey et al. (2015), we consider stars varying by less than 20 mmag to be relatively quiescent, which is the case for 60 of 76 stars, or 78.9%, illustrated by the histogram in Figure 9, which outlines the shape of the variability distribution for M dwarfs at V over the long term. There are certainly stars that are variable at a level lower than this threshold, e.g., G 099-049 in Figure 6 and GJ 299 in Figure 7; these stars continue to be observed to determine if low-level photometric cycles are maintained.

Figure 8. Scatter plot of stellar variability in the V filter vs. offset from the fit to the distribution of stars in the H-R diagram of Figure 2. Almost all stars within 1 magnitude of the fit are shown with solid black points, unless they are known to be young (pink triangles) or subdwarfs (green asterisks). The dashed line is at our lower detection threshold of 7 mmag and the dashed–dotted line is at our lower limit of 20 mmag for non-quiescent variability. The high values for long-term variability for stars above the main sequence, but not below, support our hypothesis that the elevated stars are more magnetically active.
Download figure:
Standard image High-resolution image
Figure 9. Histogram showing our range of long-term variability values. The bins are 5 mmag in width, from 5–10 mmag to 120–125 mmag. A majority of stars vary by less than our adopted threshold for a clearly variable star, 20 mmag.
Download figure:
Standard image High-resolution image
Figure 10. Stars plotted on an H-R diagram where point sizes are scaled to indicate each star's variability in V. Reference points for variability of 10, 25, and 50 mmag are given in the legend. Numbers correspond to stars with light curves presented in Figures 6 and 7. The largest point at MV = 11.85 and (V − K) = 6.21, is TWA 8B, for which we measure a variability of 124 mmag.
Download figure:
Standard image High-resolution imageFigure 8 shows the magnitudes of the variability (in mmag) of our targets plotted against their distance above or below the main sequence (in MV mag), where stars below the fit in Figure 2 are to the left of the plot (subdwarfs with positive offsets) and those above the fit are to the right (young stars at negative offsets). This plot reveals several important points.
- 1.Confirmed young stars above the fit of Figure 2 by more than 1 mag nearly always vary photometrically at V by more than 20 mmag. There is only one exception among nine stars.
- 2.Stars within 1 mag of the fit are generally quiescent, with very few reaching the 20 mmag threshold, including the handful of stars identified as young.
- 3.All M dwarfs at or below the fit in Figure 2 vary by less than 20 mmag.
- 4.Confirmed subwarfs are always quiescent, although we caution that only five stars are currently in this class.
Figure 10 illustrates this point further by plotting each of our stars on an H-R diagram where the symbol size reflects the variability for each star, as shown in the legend. On this diagram we see the point sizes increasing from below to above the main sequence.
Together, Figures 8 and 10 support our hypothesis that photometric variability is correlated with position relative to the mean main sequence, in the sense that stars above the main sequence are typically variable whereas stars below the mean main sequence show no detectable photometric changes. On an 11 year timescale the Sun exhibits photometric variability that is known to be linked to the presence of spots (Willson et al. 1981), which in turn are caused by magnetic fields. Our supposition is that over the long term, for the M dwarfs studied here there is a similar link between variability, spots, and magnetic field strengths (Johns-Krull & Valenti 1996). Because young stars are more magnetically active than their main sequence counterparts, we conclude that there is a correlation between photometric variability and age, e.g., young stars found above the mean main sequence tend to be highly variable, and the old subdwarfs below the main sequence are quiescent.
To illustrate the quality of our variability values we have run a comparison of the apparent magnitude of each star against its variability value, to ensure that these values are not noise driven. Our results are shown in Figure 11 where we see no trend in the comparison these two parameters. We expect such results because observation integration times are increased to up to 300 s for fainter stars to ensure consistent peak counts among the targets.

Figure 11. Random scatter of the apparent magnitude of each star vs. its variability. This provides further evidence of the quality of our variability calculations and results.
Download figure:
Standard image High-resolution imageWe have also run our variability data through one of the equations derived in Stetson (1996) to assess the variability of a target using photometric data. For our work we determined the best index to use would be the Welsh/Stetson variability index I, which uses the deviation of the photometry in an individual frame from the average for two filters (if only one filter is used, as in our case, then the frames are compared to each successive frame) and the error of each photometric value. We do not have distinct errors for each image because relative photometric techniques were used, so we used our floor of 7 mmag as our error. The equation from Stetson (1996) and the method in which we used it are as follows:
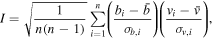
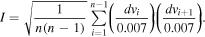
In both equations n is the number of frames in each filter. In the original I-index equation b and v represent the photometric value of each frame in one of two filters,  and
and  are the average of the photometric values of all frames in each filter, and the σ values are the errors for each frame. For our modification only one filter is used, the V filter. Because we have used relative photometry, we apply the difference between the value of the frame and the average (dv) and use 0.007 mag as our error. The results are shown in Figure 12 as our variability values versus the Welsh/Stetson I-index and we see a clear increase in the values as the variability increases, confirming that our variability measurements are due to true stellar variability.

Figure 12. Results of our Welsh/Stetson I-index calculations described in Section 6.2. This shows a distinct and steady increase in the I-index as the variability increases, confirming that our variability measurements are due to true stellar variability. TWA 8B is an outlier with an I-index value of 214.7 and a variability of about 24 mmag, though this star system is known to be very young and active.
Download figure:
Standard image High-resolution image6.3. ROSAT Study
Stellar variability and flare activity are strongest and more easily observed at short wavelengths such as X-rays than in the V band that we have used for this study. Ideally, we would observe these stars at X-ray wavelengths to measure stellar activity levels, but such a program would need to be done from space where a long-term effort on a large number of red dwarfs would be observationally prohibitive. Nonetheless, we have cross-matched our 76 stars with data available from the ROSAT All-Sky Bright Source Catalog (Voges et al. 1999) to determine if any of our variable stars exhibit high X-ray flux levels. For our search we used a detection radius of 1' and all sources were matched within 20'' of the target star and confirmed visually. The ROSAT fluxes are presented in Table 2.
Table 2. ROSAT Detection Data
| Star Name | ROSAT Flux | LX-ray |

|
Variability | Star Type |
|---|---|---|---|---|---|

|
( ) ) |
(mmag) | |||
| SCR 0017–6645 | 1.68 | 3.07 | −1.97 | 34.8 | Young |
| GJ 2006AB | 2.56 | 3.39 | −1.61 | 76.8 | Young |
| LP 776-025 | 3.08 | 0.97 | −0.87 | 15.6 | Young |
| BD 21-01074A | 8.62 | 3.46 | −1.20 | 52.9 | Young |
| G 099-049 | 2.93 | 0.10 | −0.06 | 17.1 | |
| AP Col | 3.70 | 0.31 | −1.23 | 21.1 | Young |
| L 032-008 | 0.340 | 0.03 | −0.12 | 15.0 | |
| L 034-026 | 4.25 | 0.57 | −0.23 | 18.0 | Young |
| GJ 358 | 1.17 | 0.13 | −0.50 | 30.2 | Flare |
| LP 491-051 | 1.53 | 0.44 | −0.25 | 12.9 | |
| TWA 8AB | 2.71 | 7.15 | −2.72 | 78.6 | Young |
| SCR 1214–2345 | 0.932 | 0.13 | −0.07 | 23.1 | |
| GJ 1154 | 0.697 | 0.06 | −0.58 | 14.4 | Flare |
| GJ 1156 | 0.913 | 0.05 | −0.11 | 17.4 | Flare |
| GJ 1207 | 2.20 | 0.20 | +0.13 | 18.4 | Young |
| GJ 729 | 5.68 | 0.06 | +0.71 | 10.6 | Flare? |
| G 188-038 | 2.85 | 0.28 | −0.41 | 19.0 | Flare |
| LHS 3799 | 1.27 | 0.08 | −0.38 | 13.2 | Young |
| GJ 1284 | 3.65 | 1.14 | −1.29 | 27.1 | Young |
Download table as: ASCIITypeset image
We find that 19 of the 76 stars can be matched to ROSAT detections, including 10 out of the 14 known young stars in our study. There were no ROSAT detections for SCR 0757-7114 or LP 993-115A, but there was for its companion (not in this study) LP993-116(B), in Voges et al. (1999), and GJ 2006B and TWA 8B appear not to have separate values from their A components. Two of the 19 stars are known flare stars (GJ 0358 and GJ 1154) that are half a magnitude or more above the main sequence. Of the remaining seven stars, three are known flare stars, but their positions relative to the main sequence differ: G 188-038 is 0.41 mag above the main sequence, GJ 1156 is on the main sequence, and GJ 729 is, curiously, 0.7 mag below the main sequence. We measure only 11 mmag of variability in V over 15 years for GJ 729, and the X-ray luminosity for this star is much lower than those of the other targets that are located above the main sequence. Therefore we consider this a marginal detection.
Figure 13 illustrates the results of this X-ray search, where the X-ray luminosity is plotted versus the  value and the point size is indicative of our variability results presented here. The X-ray luminosity (denoted as LX-ray) was calculated using the published ROSAT stellar flux values (f), given in
  and converted to
  using the distances (D) given in Table 1 via the equation:


Figure 13. ROSAT All-Sky Bright Source Catalog data for 19 of our stars. The X-ray luminosity on the y-axis is derived from the published ROSAT fluxes using the distances in Table 1. The luminosity is plotted against the  values (also in Tables 1 and 2), and the point sizes represent the long-term variability for each target, as in Figure 10, with reference points for variability of 10, 25, and 50 mmag given in the legend.
Download figure:
Standard image High-resolution imageFigure 13 shows that the X-ray luminosity increases for stars located above the main sequence. We also find a correlation between X-ray luminosity and our V photometric variability values, indicating a clear link between X-ray flux levels and rather more easily obtained V band variability measurements.
7. Conclusions
Overall, we find that the long-term brightness of all M dwarfs located on or below the central part of the distribution about the main sequence ( from +2.5 to 0.0 mag) vary over the long-term by less than 20 mmag in V. For stars above the main sequence (
 from 0.0 to −3.5 mag), we observe a clear increase in long-term variability, as illustrated in Figures 8 and 10, primarily for stars that are known to be young. These results support our hypothesis that over-luminous red dwarfs are more photometrically variable in V over the long-term than their main sequence counterparts. We propose that this variability is due to activity caused by magnetic fields that result in spots and flares on the stars. We infer that these stars' radii are larger than their lower-luminosity counterparts due to strong magnetic fields that support the outer layers of the star, consequently resulting in higher luminosities. Finally, we find a link between our long-term photometric variability measurements at V made from the ground and X-ray fluxes measured from space. Thus, we have discovered a relatively straightforward method for identifying young red dwarfs in the solar neighborhood: V band photometric measurements over the long term. We are unable to draw any conclusions about the role of the method of energy transport (e.g., convection) in the level of observed activity at this time, due to our limited samples in Boxes 4 and 6 where comparisons need to be made. When more long-term data are available in these regions, we will explore the role of the effects of convection on position relative to the main sequence.
The long-term RECONS effort at the CTIO/SMARTS 0.9 m has been supported by the National Science Foundation through grants AST 05-07711, AST 09-08402, and AST 14-12026. We also thank the members of the SMARTS Consortium and the CTIO staff, who enable the operations of the small telescopes at CTIO. This research has made use of results from the SAO/NASA Astrophysics Data System Bibliographic Services, as well as the SIMBAD database (Wenger et al. 2000) and the Vizier catalog access tool, operated at CDS, Strasbourg, France (Ochsenbein et al. 2000). Data products from the Two Micron All Sky Survey, which is a joint project of the University of Massachusetts and the Infrared Processing and Analysis Center/California Institute of Technology, funded by NASA and the NSF, have been used extensively.
Facility: CTIO:0.9m. -
Footnotes
- 8
- 9
In places, the widening extends to ∼6 mag, or a factor of ∼250 in luminosity.
- 10
Two stars were observed for only two–three years with final frames in 2003; we did not re-initiate observations for these stars.
- 11
We note that three suspected, but not yet confirmed, subdwarf stars included in this study are denoted as "(S)" in Table 1 These suspected subdwarfs are marked as such due to their positions more than one full magnitude below the main sequence and their metallicity values near or below
in one or more of the metallicity surveys mentioned in Section 2. - 12
GJ 643 is one of five red dwarfs in the GJ 643/644 system, and is separated from the close triple GJ 644 ABD by 72
2.
![$[m/H]-0.5$](https://content.cld.iop.org/journals/1538-3881/154/3/124/revision1/ajaa8464ieqn18.gif)