


Abstract
We have used the Atacama Large Millimeter/submillimeter Array to measure precise absolute astrometric positions and detect the astrometric wobble of dwarf planet Orcus and its satellite Vanth over a complete orbit. We also place upper limits to the astrometric wobble induced by Dysnomia on dwarf planet Eris around its orbit. From the Vanth–Orcus barycentric motion, we find a Vanth–Orcus mass ratio of 0.16 ± 0.02—the highest of any known planet or dwarf planet. This large ratio is consistent with the hypothesis that Vanth is a largely intact impactor from a giant collision in the system and that the system has likely evolved to a double synchronous state. We find only an upper limit of the barycenter motion of Eris, which implies a 1σ upper limit to the Dysnomia–Eris mass ratio of 0.0085, close to the modeled transition region between giant impact generated satellites, which are largely intact remnants of the original impactor and those which form out of reaccreted disk material left over postimpact. The low albedo of Dysnomia leads us to marginally favor the intact impactor scenario. We find that Dysnomia has a density of <1.2 g cm−3, significantly lower than the 2.4 g cm−3 of Eris.
Export citation and abstract BibTeX RIS

Original content from this work may be used under the terms of the Creative Commons Attribution 4.0 licence. Any further distribution of this work must maintain attribution to the author(s) and the title of the work, journal citation and DOI.
1. Introduction
Satellites are ubiquitous around dwarf planets in the Kuiper Belt, with satellites known around at least 8 of the 10 largest dwarf planets. Smaller Kuiper Belt objects (KBOs) are often found as nearly equal-sized binaries of similar color on eccentric orbits (Noll et al. 2020), and their orbital properties have led to the hypothesis that they are formed from direct collapse via gravitational instabilities (Nesvorný et al. 2019). Dwarf planet satellites, in contrast, are frequently found to be significantly smaller than their primaries and are often found on circular or near-circular orbits, suggesting a separate formation mechanism for these systems (Brown et al. 2006).
Giant impacts have long been discussed as a likely formation mechanism for dwarf planet satellites. A giant impact origin for Pluto's satellite Charon was proposed by McKinnon (1989), and Canup (2005) showed that a relatively large and high-density satellite such as Charon could indeed be formed through an oblique giant impact, where the impactor is captured largely intact after the collision.
Arakawa et al. (2019) modeled a wider range of dwarf planet collisions and found that most of the known dwarf planet satellite systems appear consistent with formation via a giant impact that occurred at close to the escape velocity, followed by the retention of the largest fragment from the impactor. Depending on the impact angle, this largest captured fragment can range from a nearly intact original impactor (as in the case of Pluto–Charon) to a low-density icy fragment containing only a small fraction of the mass of the original impactor. The requirement that the impact occur at close to the escape velocity is a strong indicator that these collisions happened early in solar system history before the dynamical excitation of the Kuiper Belt.
Two critical parameters for understanding the formation of dwarf planet satellites and for testing models such as these giant impact scenarios are the satellite-primary mass ratio and the density of the satellite compared to the primary. Such parameters are known for only two systems—Pluto–Charon and Haumea–Hi'iaka–Namaka—which span a wide range of parameter space.
The Charon–Pluto mass ratio is 0.12—the largest measured for any planet or dwarf planet—and was determined by detecting the motion of Pluto and Charon around their common barycenter (Young et al. 1994; Null & Owen 1996; Foust et al. 1997; Olkin et al. 2003; Buie et al. 2006). The densities of Pluto and Charon are 1.85 and 1.7 g cm−3, respectively, approximately equal and typical for objects of their sizes.
In contrast, the Haumea system has a (total) satellite-primary mass ratio of 0.0045, where the mass of the satellites was determined by detecting their mutual perturbations (Ragozzine & Brown 2009). The sizes of the satellites have not been measured directly, but with their low masses and surface spectra that resemble pure water ice (Barkume et al. 2006; Fraser & Brown 2009), it appears likely that the objects are icy fragments with densities of ≲1 g cm−3, in marked contrast to the 1.8–2.0 g cm−3 density of Haumea (Ortiz et al. 2017; Dunham et al. 2019).
For both of these systems, the measurement of their mass ratios relies on the presence of multiple satellites. Measuring the mass of dwarf planet satellites that have no additional satellite companions is more difficult. The only plausible method to measure satellite mass is through the detection of the barycenter motion of the primary determined against an absolute astrometric background. Barycenter motion has not been possible to measure with high-resolution optical or infrared imaging to date owing to insufficient astrometric references in the same field of view as the target moves against the background stars.
Unlike high-resolution optical or infrared imaging, radio interferometric observations routinely measure positions in an absolute astrometric reference frame during the process of phase calibration, usually using extragalactic radio sources that define the standard celestial reference frame (Fey et al. 2015; Petrov et al. 2019). There is a well-established history of obtaining precise positions of sources over time from such observations (Reid & Honma 2014). We use the extraordinary ability of the Atacama Large Millimeter/submillimeter Array (ALMA) to provide absolute astrometry to allow us to search for the barycentric motion of Eris and Orcus caused by their satellites.
Eris is the most massive dwarf planet known and has a single known satellite in a circular orbit at a distance of a/Rp ≈ 32 from the primary, where a is the radius of the orbit and Rp is the radius of the primary. ALMA observations give a diameter of Dysnomia of 700 ± 115 km (Brown & Butler 2018, hereafter BB18), making it the second largest known satellite of a dwarf planet, and suggesting that the Dysnomia–Eris mass ratio could be anywhere from below 0.01 to 0.03, depending on whether or not Dysnomia has a density below 1.0 g cm−3—as appears typical for KBOs of this size—or has a density more similar to the 2.4 g cm−3 value derived for Eris (Sicardy 2011). The Eris–Dysnomia system appears in a regime different from either that of Pluto or that of Haumea.
The Orcus–Vanth system, in contrast, appears like a scaled-down version of the Pluto–Charon system. Vanth orbits on a circular orbit at a distance of a/Rp
≈ 20 from the primary (compared to ∼16.5 for Pluto–Charon), and ALMA observations have measured diameters of 910 and 475 ± 75 km for Orcus and Vanth (BB18), a size ratio of 1.6 ± 0.3 (comparable to the value of 2.0 for Pluto–Charon). The ALMA-derived effective diameter of Vanth is consistent with that measured from a stellar occultation and an assumed spherical shape of 443 ± 10 km (Sickafoose et al. 2019), though we will conservatively use the ALMA result for consistency between Orcus and Vanth. Assuming identical densities, the Vanth–Orcus mass ratio would be 0.142 ± 0.02, a value even higher than the 0.12 of Pluto–Charon.
These observations will expand the range of dwarf planet and satellite sizes, ratios, and orbital distances with fully characterized systems, allowing us to continue to explore formation mechanisms for these ubiquitous satellite systems.
2. Observations and Data Reduction
The Orcus–Vanth system was observed four times in 2016 Oct/Nov. The Eris–Dysnomia system was observed three times in 2015 Nov/Dec. A complete description of the observations, including the method for obtaining final flux densities, is contained in BB18. We describe here only the further steps in the data reduction required to obtain the astrometric positions and errors.
To measure the positions of the detected objects, we perform direct fits to the interferometric visibilities. In the case of Orcus and Vanth, we use a model of two point sources, with initial position estimates given by Gaussian fits to the images. In the case of Eris, we use a model of a slightly limb-darkened disk, with diameter 1163 km (Sicardy 2011), also with an initial position estimate given by Gaussian fits to the images.
We assume three sources of astrometric error: formal fitting uncertainties ("ff error"), systematic fitting uncertainties ("sf error"), and overall celestial frame uncertainties ("cf error"). Formal fitting uncertainties are simply the errors returned in the visibility fits. We estimate the systematic fitting uncertainties by differencing the positions returned by the visibility fitting with those returned by the Gaussian image fits. Our methodology for finding the celestial frame error is described below. We then take the total error in either direction (R.A. or decl.) as the root sum squared (rss) of those three values.
The most difficult error term to determine is the overall celestial frame uncertainty. Fortunately, astrometric observations with ALMA always contain at least two "check sources," which are sources near the science target source that have well-determined positions. Additionally, we used a primary phase calibrator that also has a well-determined position for both sets of observations. The positions of these sources are either taken from the International Celestial Reference Frame (ICRF), or the Radio Fundamental Catalog (RFC; Fey et al. 2015; Petrov et al. 2019). For the Eris observations, the primary phase calibrator was J0125-0005 (ICRF; 5.2 degrees distant) and the two check sources were J0141-0928 (ICRF; 6 5) and J0115-0127 (RFC; 70). Unfortunately, J0141-0928 was sufficiently far from Eris that phases did not transfer from the primary phase calibrator well, so we did not use it. For the Orcus and Vanth observations, the primary phase calibrator was J1048-1909 (ICRF; 130), and the two check sources were J1022-1037 (RFC; 22) and J0942-0759 (RFC; 60). Both were sufficiently close to Orcus and Vanth that they could be used. On each date, we made an image of the check sources and did a Gaussian fit to find the offsets of those sources from their expected positions (which should be at the phase center, or the image center, if everything worked perfectly). For Eris we took the offset of J0115-0127 as the frame uncertainty; for Orcus and Vanth we took the average of the offsets of J1022-1037 and J0942-0759 as the frame uncertainty.
Table 1 shows the final positions, all contributions to the error, and the final error. For Eris, the errors are of order a few milliarcseconds; for Orcus and Vanth they are a factor of roughly 2 to 3 higher on two of the days, but much larger for the two others. The observation on October 13 was impacted by poor observing conditions, and that on November 7 was taken when antennas had been moved into a more compact configuration. Normally, neither of these would happen for ALMA observations, as they are scheduled purposefully when conditions and resolution are appropriate to the proposed science. However, for these observations, there were very tight time constraints—both because observations must be taken at separated orbital phases (which means a few days apart), and because the time spent in each configuration is limited. If all observations had been taken under ideal circumstances, the errors would almost certainly all be as they are for Eris, a few milliarcseconds. This uncertainty agrees with the expected astrometric accuracy of ALMA (Warmels et al. 2018).
Table 1. Astrometric Positions and Errors (Milliarcseconds)
| R.A. | Decl. | |||||||||||
|---|---|---|---|---|---|---|---|---|---|---|---|---|
| Bodies | Date | Beam a | Offset | ff error b | sf error c | cf error d | total error | Offset | ff error | sf error | cf error | total error |
| Eris | 2015-Nov-09 | 17 X 15 @ 78° | −82.5 | 1.5 | 1.8 | 0.1 | 2.4 | −123.8 | 1.5 | 0.2 | 0.2 | 1.5 |
| Eris | 2015-Nov-13 | 22 X 14 @ 51° | −88.8 | 1.5 | 1.5 | 0.9 | 2.3 | −121.6 | 1.5 | 0.7 | 0.3 | 1.6 |
| Eris | 2015-Dec-04 | 37 X 22 @ 63° | −90.9 | 2.3 | 1.1 | 0.1 | 2.6 | −120.8 | 2.2 | 0.8 | 1.8 | 3.0 |
| Orcus | 2016-Oct-11 | 98 X 90 @ −56° | −43.5 | 1.7 | 0.4 | 2.8 | 3.3 | −24.0 | 1.6 | 2.7 | 4.0 | 5.1 |
| Vanth | 2016-Oct-11 | 98 X 90 @ −56° | +145.4 | 6.6 | 7.7 | 2.8 | 10.5 | +137.9 | 6.2 | 0.3 | 4.0 | 7.4 |
| Orcus | 2016-Oct-13 | 107 X 93 @ −47° | −26.8 | 3.7 | 9.9 | 32.3 | 34.0 | +25.3 | 3.5 | 2.1 | 36.0 | 36.2 |
| Vanth | 2016-Oct-13 | 107 X 93 @ −47° | +178.2 | 14.4 | 2.2 | 32.3 | 35.4 | −101.6 | 14.0 | 27.2 | 36.0 | 47.3 |
| Orcus | 2016-Oct-15 | 123 X 103 @ 69° | +16.3 | 1.8 | 0.4 | 7.8 | 8.0 | +22.1 | 1.7 | 1.6 | 4.0 | 4.6 |
| Vanth | 2016-Oct-15 | 123 X 103 @ 69° | −96.6 | 5.8 | 2.7 | 7.8 | 10.1 | −205.1 | 5.5 | 5.8 | 4.0 | 8.9 |
| Orcus | 2016-Nov-07 | 197 X 163 @ 55° | −2.6 | 2.3 | 6.7 | 16.5 | 18.0 | −24.6 | 2.3 | 7.7 | 20.0 | 21.6 |
| Vanth | 2016-Nov-07 | 197 X 163 @ 55° | −60.1 | 6.8 | 2.1 | 16.5 | 18.0 | +165.6 | 6.7 | 17.2 | 20.0 | 27.2 |
Notes.
a Synthesized beam FWHM axes and position angle (north through east, or counterclockwise (CC) with a robust weighting parameter of 0. b Formal error from fitting visibilities. c Systematic fitting error. d Celestial frame error.Download table as: ASCIITypeset image
Figures 1 and 2 show the astrometric measurements of Orcus and Vanth, and of Eris, respectively. Dysnomia is too faint to be detected in the individual images. The barycentric motion of the Orcus–Vanth system can clearly be seen in the data. For Eris some barycenter deviation is apparent, but it is much smaller and less regular than that of Orcus–Vanth.
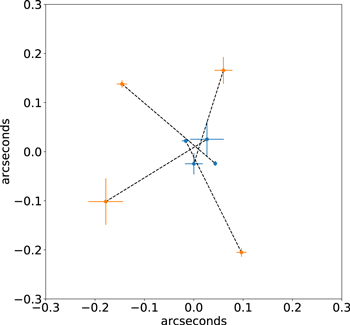
Figure 1. Astrometric positions of Orcus (blue) and Vanth (orange) at four positions in the orbit of Vanth, referenced to an absolute astrometric reference, corrected for the predicted motion of the Orcus system through the sky, and with the mean offset from the ephemeris prediction removed. The dashed lines connect the positions of Orcus and Vanth measured simultaneously. The barycentric motion of Orcus about the center of mass can be seen in the motion of Orcus opposite that of Vanth.
Download figure:
Standard image High-resolution image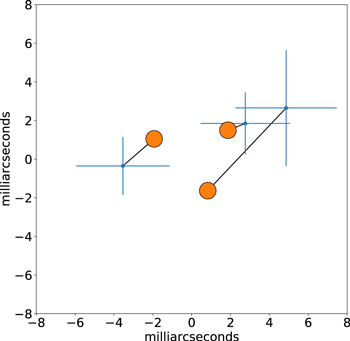
Figure 2. Astrometric positions of Eris at three separate positions in the orbit of Dysnomia, referenced to an absolute astrometric frame, corrected for the predicted motion of the Eris system through the sky, and with the mean offset from the ephemeris prediction removed, shown as blue points with uncertainties. The orange points show the maximum likelihood fits to the barycenter motion, which is only detected at the 1.5σ level. The barycentric motion is much smaller than Eris itself, which subtends 33 mas. Dysnomia is between 330 and 540 mas away during these observations.
Download figure:
Standard image High-resolution image3. Analysis
3.1. Orcus–Vanth
To determine the center of mass of the Orcus–Vanth system, we fit the deviations of Orcus and Vanth from the expected system ephemeris position to a six parameter likelihood model that consists of the following (Figure 3): (1) an orbital phase offset to the position of Vanth from that determined in BB18 to allow for the uncertainty in the decade-old orbital phase measurement from the Hubble Space Telescope (HST; note that uncertainties in the other orbital parameters are significantly smaller and would not affect the results here); (2) a satellite-primary mass ratio; (3–4) a constant ephemeris offset from the expected position of the pair to the center of mass; and (5–6) a constant offset between the center of light observed with ALMA and the center of light measured at optical wavelength. This last parameter could be significant if, for example, enhanced thermal emission was coming from a sunward-facing pole offset from the projected center of the body. At the projected size of Orcus of nearly 28 mas, this parameter could be large.
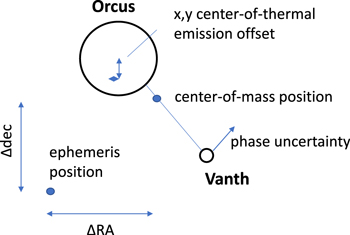
Figure 3. The six free parameters to be fit in the Orcus–Vanth maximum likelihood model are a phase offset of Vanth in its orbit (the other orbital parameters are unconstrained by the ALMA data), the Orcus–Vanth mass ratio, which uniquely defines R.A. and decl. offsets to Orcus and Vanth from the center of mass, an R.A., and decl. offset from the predicted ephemeris position to the actual ephemeris position, accounting for the poorly known position of the system (and assumed to be constant over the short timescale of the observations), and a potential R.A. and decl. offset between the center of light of Orcus (measured during the HST observations defining the orbit of Vanth) and the center of thermal emission (measured by ALMA). Note that this final parameter, which could have been significant, is found to be consistent with zero.
Download figure:
Standard image High-resolution imageWe evaluate this six parameter model using the Markov Chain Monte Carlo (MCMC) method implemented in emcee (Foreman-Mackey et al. 2019). After an initial burn-in, we collect 100,000 samples of the MCMC for analysis. The distributions of the parameters are nearly Gaussian, so we report the median and the 15.9% and 84.1% intervals as the results and uncertainties. Table 2 gives the retrieved values of all parameters. Figure 4 shows the predicted positions of Orcus and Vanth using the median of all parameters. We find that the center of light measured with ALMA and at optical wavelengths is the same (measured offsets of 2 ± 3 mas both east–west and north–south compared to the 14 mas projected radius of Orcus). Such a measurement, along with the nearly pole-on orbit of Vanth and the lack of a significant light curve for Orcus (Galiazzo et al. 2016), suggests that we are viewing Orcus pole on.
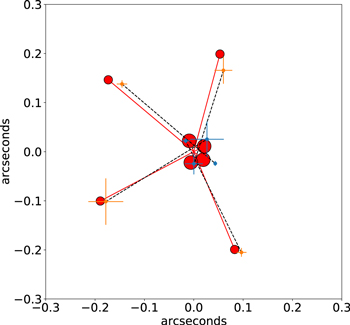
Figure 4. The best-fit model to the barycentric motion of Orcus and Vanth, compared to the astrometric measurements. The astrometric measurements are the points with uncertainties reproduced from Figure 1, while the model shows the predicted positions of Orcus and of Vanth for each observation (again, with observations at the same epoch connected by a dashed line). The model provides an excellent fit to the data, with a reduced χ2 of 0.95 and most of the data points within ∼1σ of their predicted positions and the barycentric offset angular sizes of Orcus and of Vanth. Note that, like the Pluto–Charon system, the barycenter of the Orcus–Vanth system, seen at the intersection of the four orange lines, lies exterior to the primary.
Download figure:
Standard image High-resolution imageTable 2. Parameters of the Primary-satellite Systems
| Orcus–Vanth | Eris–Dysnomia | |
|---|---|---|
| Measured values | ||
| ΔR.A. (mas) | 15 ± 4 | −87 ± 1 |
| Δdecl. (mas) | 3 ± 5 | −123 ± 1 |
| Phase offset (deg) | 0.2 ± 1.7 | ⋯ |
| Mass ratio |

| 0.0050 ± 0.0035 |
| x offset (mas) | 1 ± 4 | ⋯ |
| y offset (mas) | 1 ± 4 | ⋯ |
| Derived values | ||
| Sat. mass (kg) | 8.7 ± 0.8 × 10¹⁹ | <1.4 × 10²⁰ |
| Sat. density (g cm−3) |

| <1.2 |
| Mean anomaly (deg) | 54.2 ± 1.7 | ⋯ |
| Epoch (JD; defined) | 2 457 699.935 69 | ⋯ |
Download table as: ASCIITypeset image
The phase of Vanth is advanced by 4.3 degrees from the prediction using the earlier orbit. An updated mean anomaly and epoch for the satellite is given in Table 2. The center of mass of the Orcus–Vanth system is situated 0.137 ± 0.013 of the way toward Vanth, outside of the body of Orcus.
This 10σ detection of barycenter motion directly shows that Vanth contains 13.7% ± 1.3% of the mass of the system, for a Vanth–Orcus mass ratio of 0.16 ± 0.02. For diameters of Orcus and Vanth of  and 475 ± 75 km and a system mass of 6.32 × 10²⁰ kg, the densities of Orcus and Vanth are 1.4 ± 0.2 and
  g cm−3, respectively.
3.2. Eris–Dysnomia
Dysnomia is not detected in the individual images, so we must determine the center of mass using only the ephemeris deviations of the position of Eris itself. In this case, the ephemeris offset and center-of-light offset are degenerate, so we solve only for their combination, yielding no useful information. We use the Dysnomia ephemeris from BB18, which has uncertainties of only 2 mas at the epoch of observation. Our model thus only has three parameters, the barycenter offset and the two-dimensional ephemeris offset. We again evaluate this model with an MCMC analysis. Figure 2 shows the fitted model to the data. We find a 1.5σ detection of a barycenter motion of Eris corresponding to a mass ratio of 0.0050 ± .0035, or a barycenter motion of approximately ±2 mas. The predicted positions of Eris for the maximum likelihood solution to this model can be seen in Figure 2. The predictions are moderately consistent with the data, with a reduced χ2 value of 1.8. While this barycentric motion may represent a true detection, we chose to instead report the derived mass ratio as a 1σ upper limit of 0.0084, also corresponding to a 3σ upper limit of 0.015. Dysnomia is a small fraction of the mass of Eris; for a system mass of 1.65 × 10²² kg (Holler et al. 2021) the 1σ upper limit to the mass of Dysnomia is 1.4 × 10²⁰ kg.
3.3. The Size and Density of Dysnomia
In BB18 we reported a 3.5σ detection of a source when all three observations were stacked at the predicted position of Dysnomia, corresponding to a body with a diameter of 700 ± 115 and low albedo. Because of the unexpected nature of this result, the modest statistical significance, and the need to stack multiple data sets from different days to obtain a detection, we reobserved the Eris–Dysnomia system with ALMA on 2018 October 11. We obtained a single epoch in Band 6 (center frequency ∼233 GHz), in configuration C43-6 (the resulting resolution 0.15 × 0.12 arcsec), with an on-source integration time of 78 minutes. That observation should have sufficient sensitivity to detect a large Dysnomia, and sufficient resolution to separate it from Eris. We reduced the data in an identical manner to that described in BB18, using the QSO J0006-0623 for pointing, atmosphere, bandpass, and flux density scale calibration, and the QSO J0141-0202 for complex gain as a function of time calibration. The image resulting from these data is shown in Figure 5, where Dysnomia is clearly visible to the north and east of Eris, in its expected position. We fit visibilities to a two-source model and find flux densities of 390 ± 7μJy for Eris and 45 ± 7 μJy for Dysnomia. The flux density for Dysnomia (a 6.5σ detection) is close to that expected for a large Dysnomia, similar to what we found in BB18. We note that the errors in fitting the flux density for Eris are reduced significantly when adding the second model source for Dysnomia (rather than having a single source for Eris) and that the final fitted positions for Eris and Dysnomia are insensitive to their positions in the initial model provided to the fit. We add this Band 6 flux density of Dysnomia (and the simultaneously measured flux density of Eris) to our thermal model from BB18 and derive a new size for Dysnomia of  km, with an albedo of 0.05 ± 0.01. Figure 6 shows an updated version of Figure 7 of BB18 where we add the Band 6 flux densities for Eris and Dysnomia at 1280 μm.
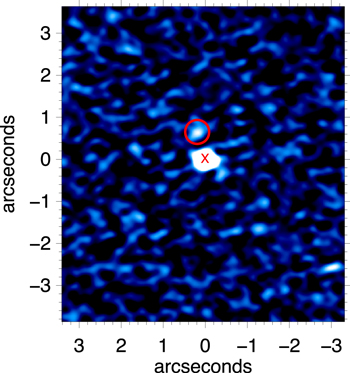
Figure 5. Image of Eris and Dysnomia from ALMA Band 6 observations on 2018 October 11. The measured position of Eris is marked with a cross, while the predicted position of Dysnomia with respect to the measured position of Eris is circled in red. Dysnomia is the second-brightest source in the field and appears at its predicted position as a 6.5σ detection.
Download figure:
Standard image High-resolution image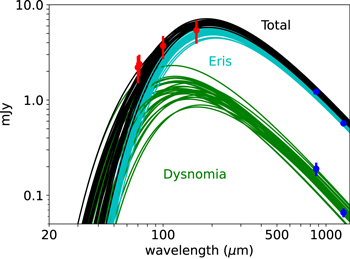
Figure 6. Unresolved flux densities measured from the Spitzer and Herschel observatories (red), along with resolved measurements from ALMA (black), from BB18, with the current data points added at 1280 μm. Random samples of the MCMC model of BB18 with the new flux density measurements added are also shown.
Download figure:
Standard image High-resolution image
For a system mass of 1.65 × 10²² kg, the density of Dysnomia is 0.7 ± 0.5 g cm−3 (1σ upper limit of 1.2 g cm−3). The density of Eris is 2.4 g cm−3 (Holler et al. 2021). To high confidence, the density of Dysnomia is significantly smaller than that of Eris.
Recent observations have found that the spin period of Eris is consistent with the orbital period of Dysnomia, i.e., that Eris is phase-locked to the orbit of Dysnomia (Bernstein et al. 2023; Szakáts et al. 2023). Szakáts et al. (2023) suggest that for tidal evolution to produce this state within the age of the solar system requires a Dysnomia with a density >1.8 g cm−3, a uniquely high value for any known object this size. They predict a Dysnomia–Eris mass ratio of 0.01–0.03, which is between 1.4σ and 7σ above our measured value. Bernstein et al. (2023), in contrast, considered the tidal evolution of Dysnomia with a mass more consistent with our new measurement and concluded that Dysnomia could become phase-locked if Eris were unusually dissipative. Such high dissipation could have important consequences for the internal structure of Eris.
4. Discussion
The Vanth–Orcus mass ratio of 0.16 ± 0.02 is larger than that even of Charon–Pluto, which has a ratio of 0.12, making the Vanth–Orcus mass ratio the highest of any known planet or dwarf planet. Like Pluto and Charon, Orcus and Vanth have a similar density (although the uncertainty on the Vanth density is sufficiently large that future refinement could change this conclusion) and lie on a circular or nearly circular orbit. Such a system is an expected outcome in the simulations of Arakawa et al. (2019) for either differentiated or undifferentiated bodies impacting at near the escape velocity at an impact angle greater than about 45°. In this scenario, Vanth would be a nearly intact body, having lost little mass in the collision. The separation of Orcus and Vanth is close to that expected for creation through a giant impact and full tidal evolution to a double synchronous state (Canup et al. 2021). It appears likely that, like Pluto–Charon, Orcus–Vanth has achieved this state. The major difference between the two systems is the apparent lack of a system of small satellites outside the orbit of Vanth, though satellites with the same fractional brightness as the small ones of Pluto are still beyond the observational limits of any search (Brown 2008).
The Eris–Dysnomia system, with an upper limit to the mass ratio of 0.0085, lies close to the transition region in Arakawa et al. (2019) between low mass ratio satellites formed out of a reaccreted disk material and a small intact fragment. In both cases, the moon is predicted to have an ice fraction near 100%, consistent with the very low density of Dysnomia. An important clue is perhaps the low albedo of Dysnomia. If the very low mass ratio of small satellites of Pluto and of Haumea can be used as representatives of disk reaccretion—which is far from certain—their high albedos are perhaps the signature of processing through a disk and removal of whatever volatile materials lead to space-weathered darkening. A large intact fragment could retain its complement of darkening material and lead to the typical low albedo that Dysnomia appears to have. Understanding whether or not this process occurs requires a significantly greater understanding of icy disk processing and the causes of the low albedos of the Kuiper Belt. The Eris–Dysnomia system is in a range of parameter space poorly sampled in the Arakawa et al. (2019) simulations, so more insight could also be gained by attempting to simulate this system specifically.
Giant impact appears the most likely formation for these dwarf planet satellite systems, but inconsistencies in the picture remain. No model has successfully generated Pluto's small moon system at its current distance from the primary (Canup et al. 2021), Haumea and the low mutual velocity of its collisional family remain unexplained, and the near 100% occurrence of satellites to these dwarf planets is surprising. Dwarf planet satellite systems yield unique insights into early solar system history and icy collisional physics, and continued study will provide an important window into these processes.
Acknowledgments
This paper makes use of ALMA data: ADS/JAO.ALMA#2018.1.00929.S, ADS/JAO.ALMA#2015.1.00810.S, and ADS/JAO.ALMA#2016.1.00830.S. ALMA is a partnership of ESO (representing its member states), NSF (USA) and NINS (Japan), together with NRC (Canada), MOST and ASIAA (Taiwan), and KASI (Republic of Korea), in cooperation with the Republic of Chile. The Joint ALMA Observatory is operated by ESO, AUI/NRAO and NAOJ. The National Radio Astronomy Observatory is a facility of the National Science Foundation operated under cooperative agreement by Associated Universities, Inc.