Article

Estimating the Risk of River Flow under Climate Change in the Tsengwen River Basin

1
National Science and Technology Center for Disaster Reduction, New Taipei City 23143, Taiwan
2
Department of Civil Engineering in National Chiao Tung University, Hsinchu 300, Taiwan
3
National Science and Technology Center for Disaster Reduction, New Taipei City 23143, Taiwan
*
Author to whom correspondence should be addressed.
Water 2016, 8(3), 81; https://doi.org/10.3390/w8030081
Submission received: 26 November 2015 / Revised: 23 February 2016 / Accepted: 24 February 2016 / Published: 3 March 2016
(This article belongs to the Special Issue Water Resource Variability and Climate Change)

Abstract

:
This study evaluated the overflow risk of the Tsengwen River under a climate change scenario by using bias-corrected dynamic downscaled data as inputs for a SOBEK model (Deltares, the Netherlands). The results showed that the simulated river flow rate at Yufeng Bridge (upstream), Erxi Bridge (midstream), and XinZong (1) (downstream) stations are at risk of exceeding the management plan’s flow rate for three projection periods (1979–2003, 2015–2039, 2075–2099). After validation with the geomorphic and hydrological data collected in this study, the frequency at which the flow rate exceeded the design flood was 2 in 88 events in the base period (1979–2003), 6 in 82 events in the near future (2015–2039), and 10 in 81 events at the end of the century (2075–2099).

1. Introduction

Extreme typhoon precipitation events frequently result in socioeconomic impacts and loss of human life. Increased incidences of extreme rainfall events indicate one of the common features signaling climate change worldwide. The International Panel on Climate Change [1] reported that on average, precipitation has increased globally by approximately 8%. According to Liu et al. [2], scientists have contended that the increase in global temperature over the past decade has prompted an increase in extreme precipitation events and a decrease in moderate and mild precipitation events. The 2010 Taiwan Climate Change Projection and Information Platform (TCCIP) Project Report II included statistical data regarding the frequency of extreme typhoon precipitation events in Taiwan from 1970 to 2009. The statistical results indicated that prior to 2000, the frequency of extreme typhoon precipitation events was approximately once every 2 years; however, this frequency increased to at least once a year after 2000 [3]. Because of river flow changes caused by extreme rainfall, discharge control structures (culverts, flap gates, weirs, and sluice gates) in river basins are at a high risk of destruction.
The main scientific tool used in long-term climate simulations is the general circulation model (GCM), the main purpose of which is to project global climate characteristics and trends. However, GCM projections (e.g., rainfall, temperature, and humidity) cannot provide adequate and effective information for simulating small areas. In past decades, scientists have developed downscaling methods to increase the spatial resolution, providing more information for correcting the error margin from the GCM simulations and presenting the influence of topographic distribution in local areas. Currently, high-resolution climate data can be obtained through high-resolution GCM, dynamical downscaling, and statistical downscaling. Although numerous recent studies have attempted to increase the spatial resolution of the output from the GCM, for example, by using statistical and dynamical downscaling, the results typically yield only certain points of information that are inadequate for resolving the climate characteristics of small areas with complex terrain such as in Taiwan.
The present study used the Tsengwen River as the study area. High-resolution dynamical downscaling data were used to simulate changes in the hourly flow rate of typhoon events. Based on the selection criteria [4], the number of extreme typhoon events selected from the base period (1979–2003), near future (2015–2039), and end of the century (2075–2099) were 88, 82, and 81, respectively. The high-resolution dynamical downscaling data were used as the input for a SOBEK river channel routing model to simulate changes in the river flow rate under climate change. Results were further compared with the design flow rate, as well as recorded river water levels of the most severe typhoon events in history, to evaluate the risk of river flooding under climate change.

2. Literature Review

The GCM is the main tool for simulating future climate conditions; however, it has a relatively low resolution (approximately 200–500 km) [5], which is inadequate for detailed assessments of land surface processes and climate change effects at local to regional scales, particularly in regions with varied topography [6,7,8]. Chen et al. [9] observed that the GCM has been widely applied in simulating future climate scenarios; however, GCM data have a relatively low spatial resolution and cannot be used for detailed discussions on climate scenarios for small areas. Present-day regional climate models (RCM) are most often used for simulating the climate of more local spatial regions. Over the past few decades, dynamical downscaling has mainly been performed using high-resolution GCM or RCM data, with a spatial resolution less than 100 km. Recently, a high-resolution atmospheric GCM model with a resolution of approximately 20 km was developed by the Meteorological Research Institute (MRI) of Japan (hereafter, MRI-AGCM) [10] to include explicitly simulated extreme weather events, such as tropical storms and meso-scale systems, in long-term climate simulations. Although the MRI-AGCM showed marked improvements in simulating extreme precipitation events, the details of local rainfall over complex terrain may still be difficult to simulate. However, a 20-km resolution remains insufficient for describing the local weather and climate characteristics in some areas of Taiwan because of the complex terrain.
In recent years, hydrologic and hydraulic models such as Hydrologic Engineering Centers River Analysis System, Mike-11, SOBEK, and the integrated flood analysis system (IFAS) have been applied to predict potential disasters by using future climate data. Linde et al. [11] used a SOBEK model to simulate low-probability flood-peak events in the Rhine basin. The results showed a basin-wide increase of 8%–17% in the peak discharge of the Rhine basin in 2050 for probabilities between 1/10 and 1/1250. Kimura et al. [12] applied the IFAS to simulate the peak discharges in Tsengwen reservoir watershed in Taiwan from extreme rainfall events (TP1–10) during three periods: the present (1979–2003), near future (2015–2039), and future (2075–2099). The peak discharges during the future climate change period were higher than those during the present climate change period. Lenderink [13] discussed the discharge of the Rhine during future climate change by investigating two periods: the present (1960–1989) and future (2070–2099). A Rhineflow method was employed to simulate discharges for the UK Met Office RCM HadRM3H [14,15,16]. The mean discharge in the present (1960–1989) and future (2070–2099) climate change periods increased by approximately 30% in winter and decreased by approximately 40% in summer. This model estimated the effect of climate change on river discharges. Climate data such as temperature, precipitation, and evapotranspiration were used as inputs for the hydrologic and hydraulic models of the river basin; the outputs were for typical river discharge structures [13,17].
Previous studies have rarely focused on hydrological changes in Taiwan because of the low resolution of GCM data. Taiwan can currently generate its own high-resolution data for future climate scenarios, which were employed in the present study for hydraulic and hydrologic routing to project future flow rates under climate change. This study directly compared the river flow and water level determined through hydraulic and hydrologic routing. In addition, the risk of flood protection facilities under climate change was evaluated.

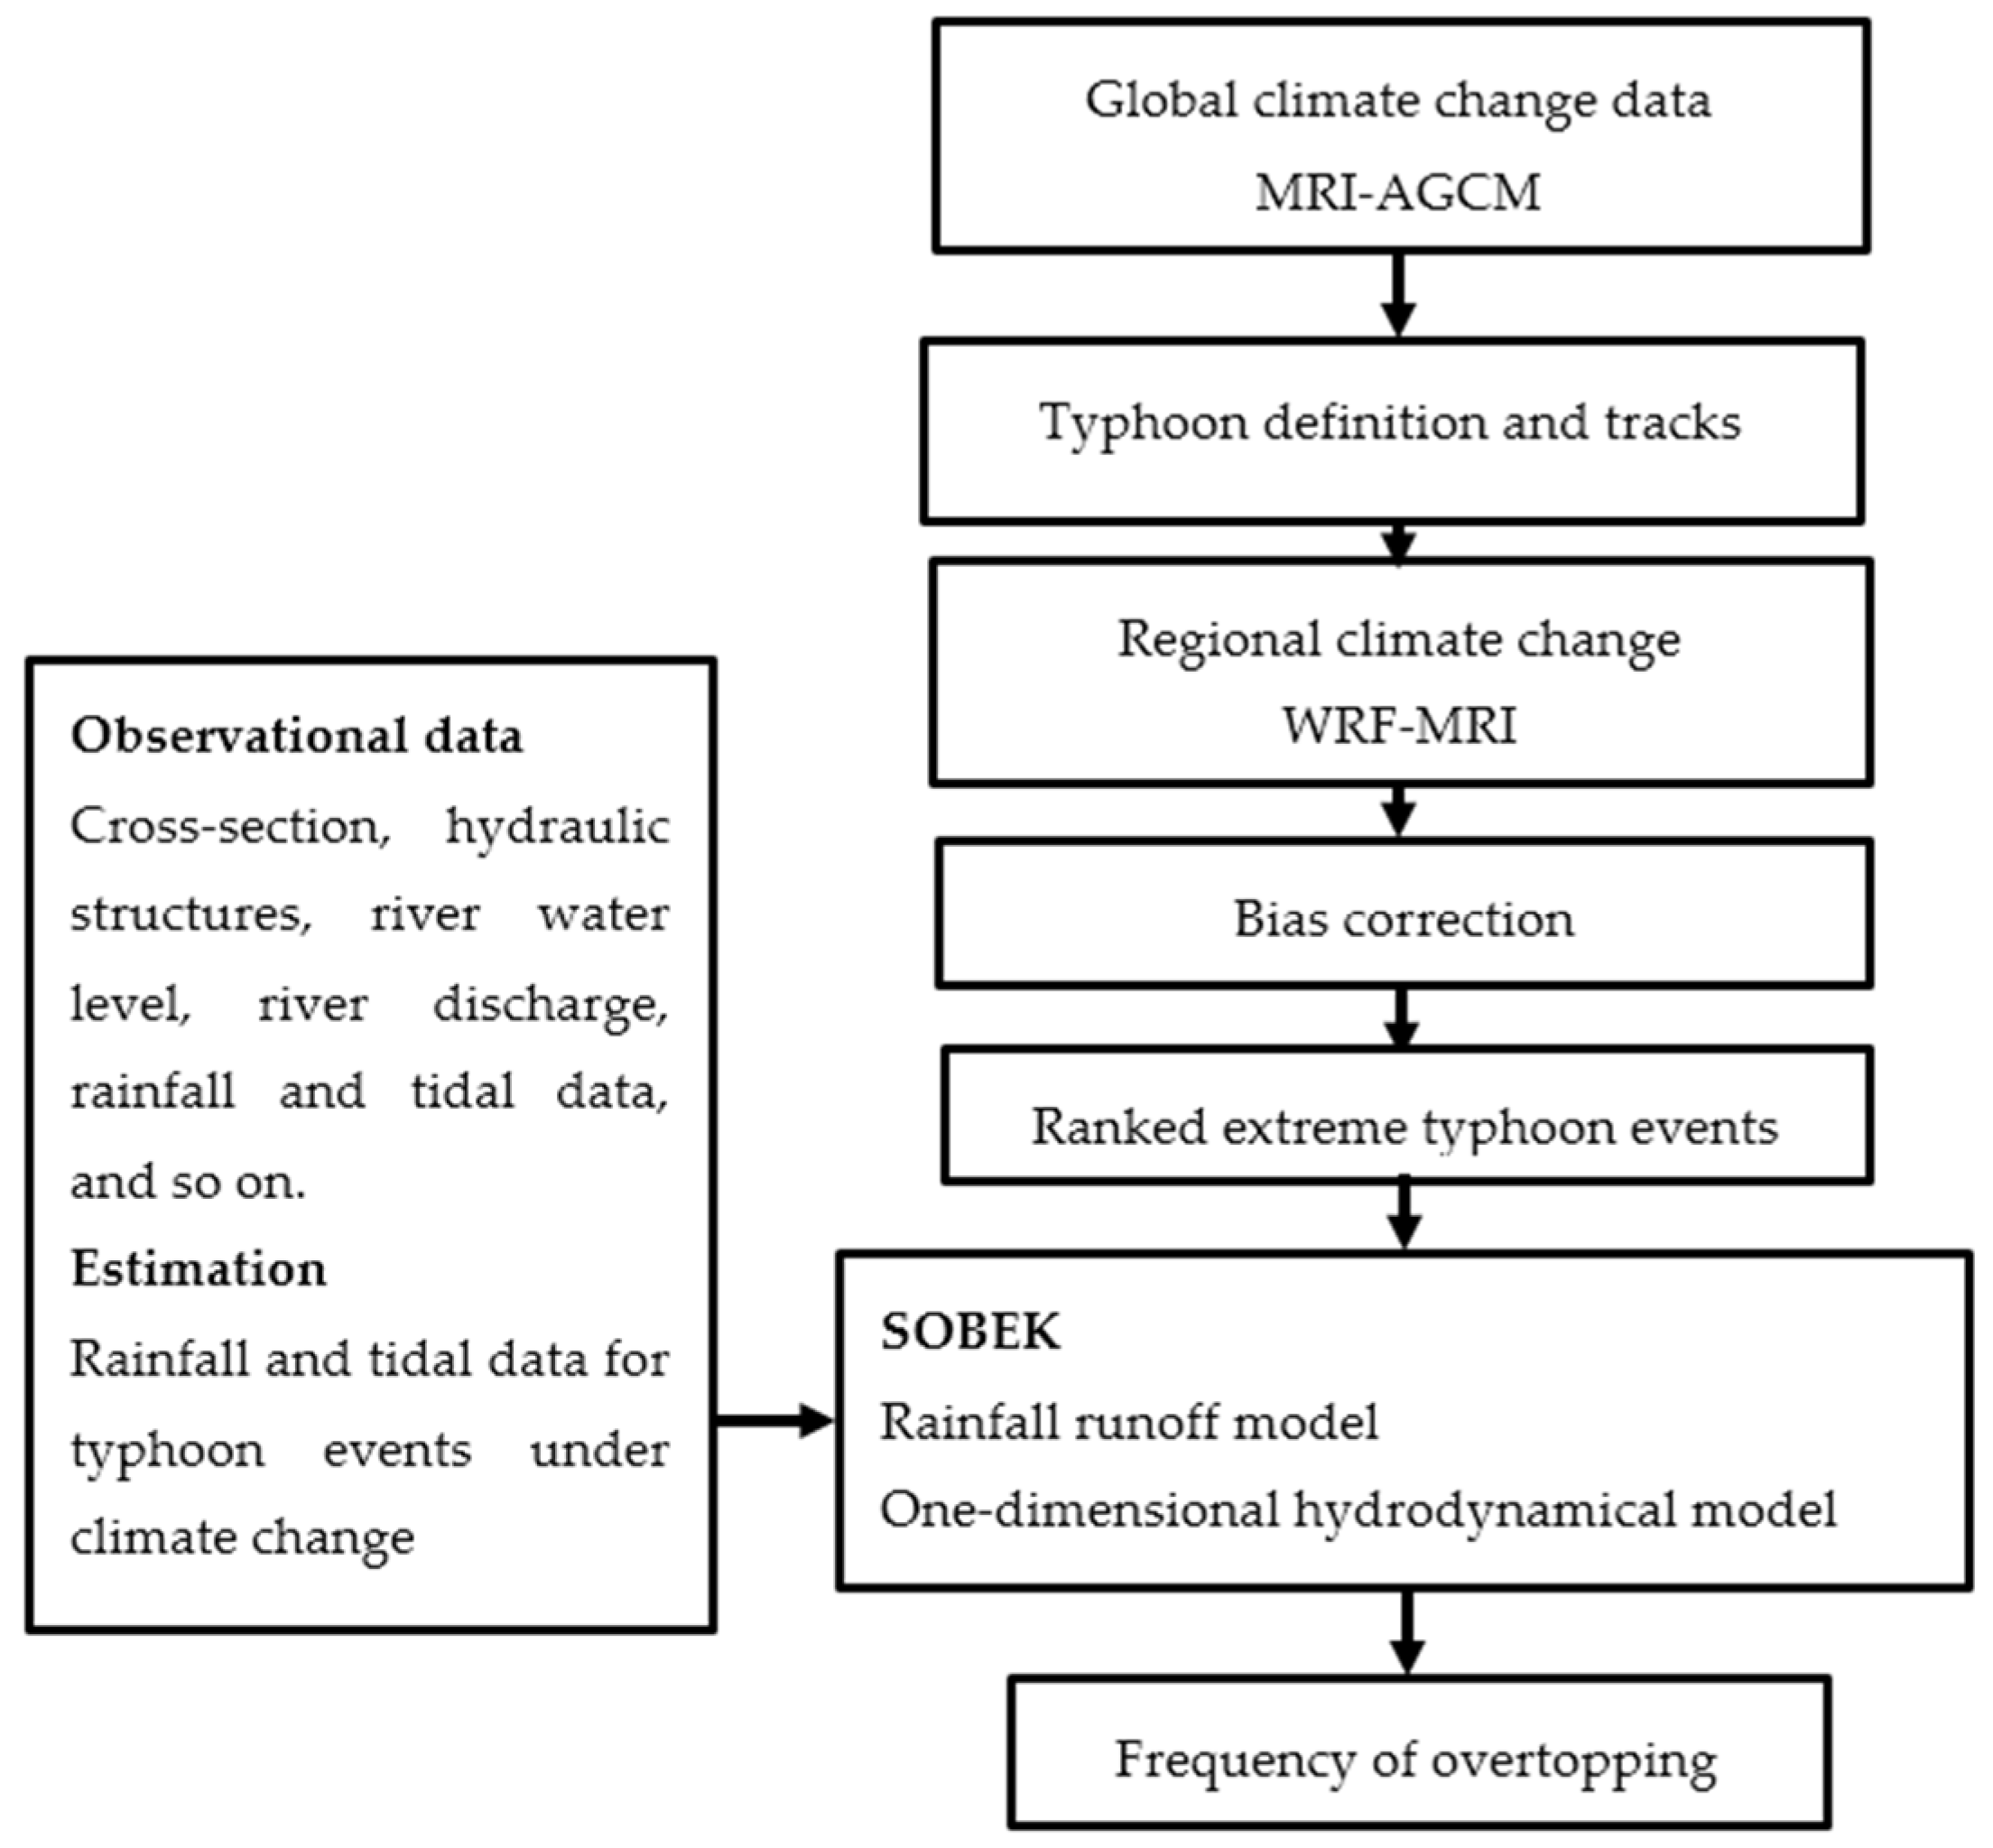
3. Research Methodology
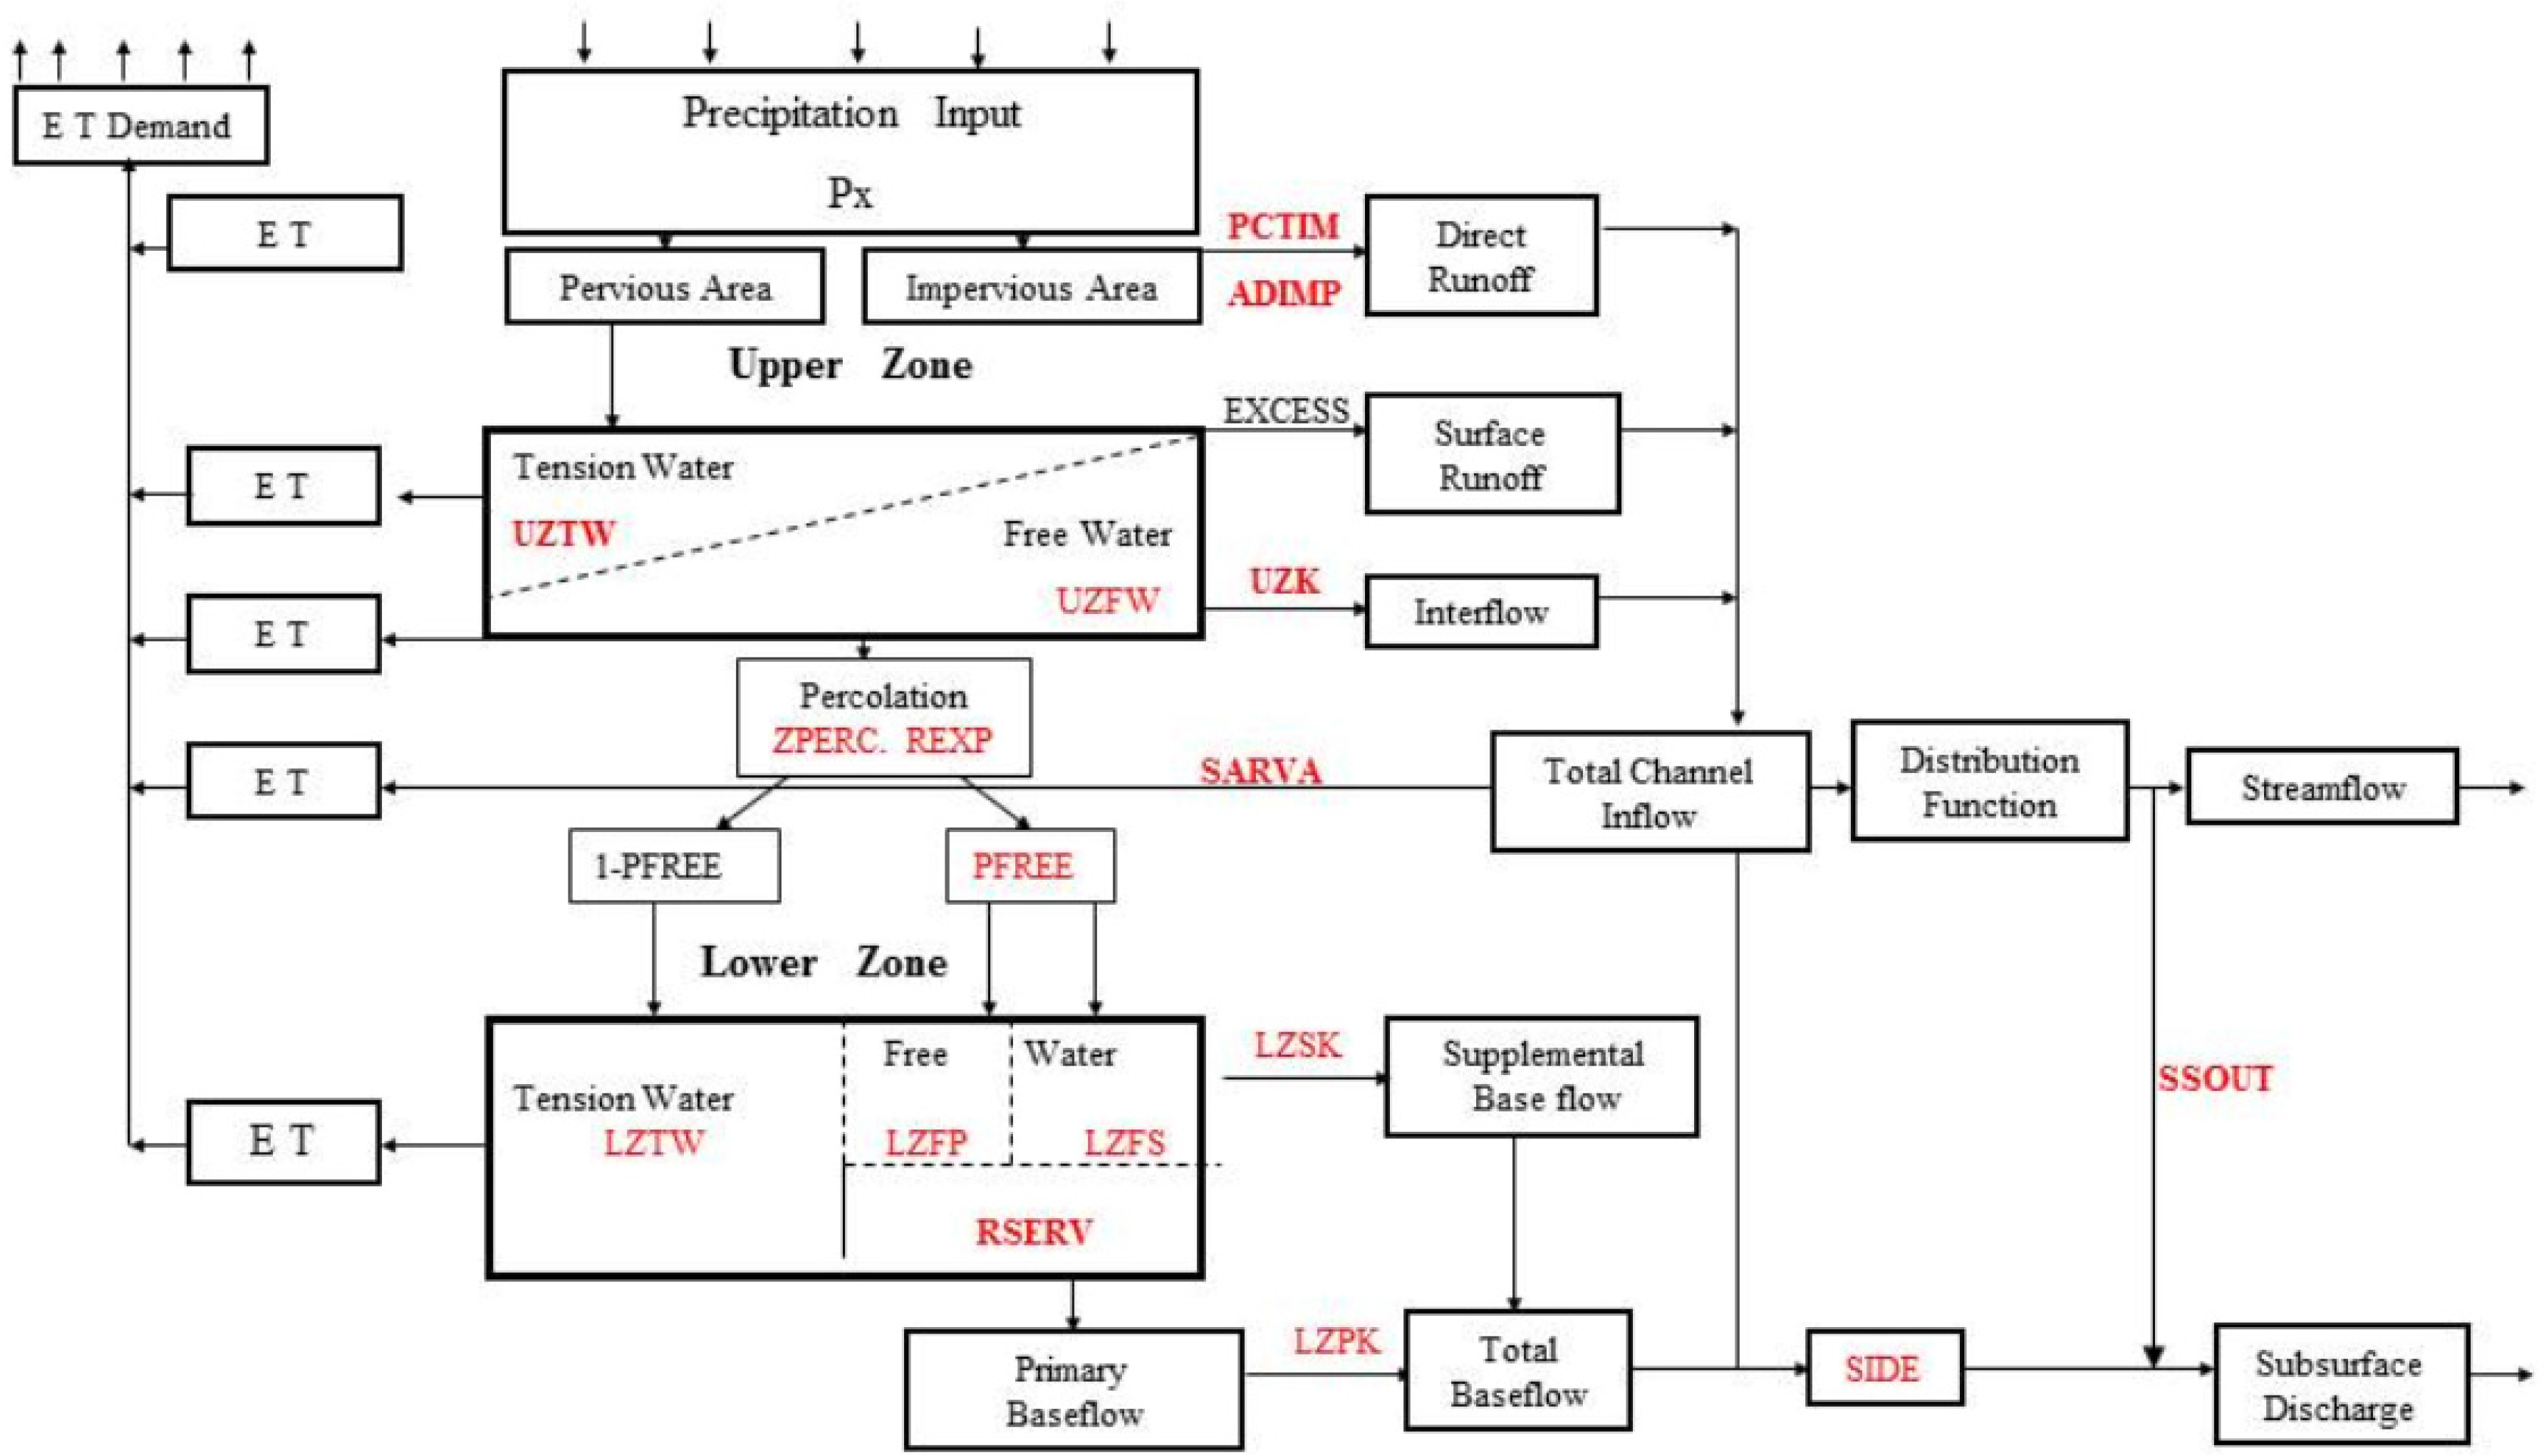
This study was aimed at quantifying the effects of climate change in the Tsengwen catchment area. A flowchart of the research process employed in this study is shown in Figure 1. The first stage focused on introducing related climate change data. For the second stage, the major focus was developing a hydrodynamic model, including its calibration and validation. In the final stage, river discharge changes and river bank overtopping-frequency results were evaluated.

3.1. SOBEK Model

The SOBEK model, which is in the SOBEK modeling suite developed by Deltares (formerly WL Delft Hydraulics), the Netherlands, integrates the commercial hydrologic and hydrodynamic programs of urban drainage systems along with river and regional drainages. The present study used the SOBEK channel-flow (CF) module along with the rainfall-runoff (RR) module for river channel simulations. The estimated RR volume was calculated as the lateral inflow (node) that converges in the main stream when calculating the unsteady flow of the river channel [18].

3.1.1. Rainfall Runoff

The SOBEK model incorporates the Sacramento RR model for simulating the process of rainfall forming runoff, including evaporation, infiltration, subsurface runoff, and underground water. The concept is to convert effective rainfall at the surface through a unit hydrograph into surface runoff, and to then add soil surface moisture, intermediate flow, and ground water discharge (base flow) to obtain the total runoff [19]. The Sacramento model defines a mathematical equation that accounts for each process in the transformation of rainfall into outflow toward a river. The concept of the Sacramento model and its parameters are shown in Figure 2. According to the Sacramento model, the soil column is divided into two soil zones: upper and lower [18]. The model has 17 parameters, the values of which must be specified [18]. Table 1 lists all the Sacramento parameters [19] and parameter ranges used in this study [20].

3.1.2. River Hydraulics

River flood routing is based on the dynamic wave transfer theory for one-dimensional (1D) varied flow; that is, de Saint Venant’s gradually varied flow equation for describing water flow in rivers. This study used the nonlinear implicit difference method for calculating the depth and flow rate for each period. Water depth and flow rate at each cross-section point where main and branch streams converge were determined on the basis of conditions that the main and branch streams have the same water level, and inflow equals outflow. Equations of continuity (1) and motion (2) were considered for flood routing on the basis of de St. Venant’s 1D gradually varied flow equation, which is the dynamic wave model. River simulations included the simulation of bridges, reservoirs, and cross-river structures such as weirs, culverts, orifices, and pump stations.
A f t + Q x = q lat
Q t + x ( Q 2 A f ) + g A f h x + g Q | Q | C 2 R A f w f τ wind ρ w = 0
where Q is the discharge (m3/s), h is the water depth (m), R is the hydraulic radius (m), q lat is the lateral discharge per unit length (m2/s), A f is the wetted area (m2), w f is the flow width (m), τ wind is the wind shear stress (N = m2), ρ w is the density of water (kg/m3), t denotes time (s), x refers to distance (m), and g denotes acceleration due to gravity (m/s2) ( 9.81).
When the SOBEK CF module processes the equation of motion, the influence of wind shear is considered, and wind force and direction are set to a fixed value or time sequence. Moreover, the SOBEK model can account for the influence of wind on the water level, which is not considered in the urban drainage and flood model. When considering the lateral inflow of a unit length of a river, including culverts, pumps, and weirs, the flow rate can be computed using the stage–discharge relationship of the hydraulic structures.

3.2. Indicators for Model Error Analysis
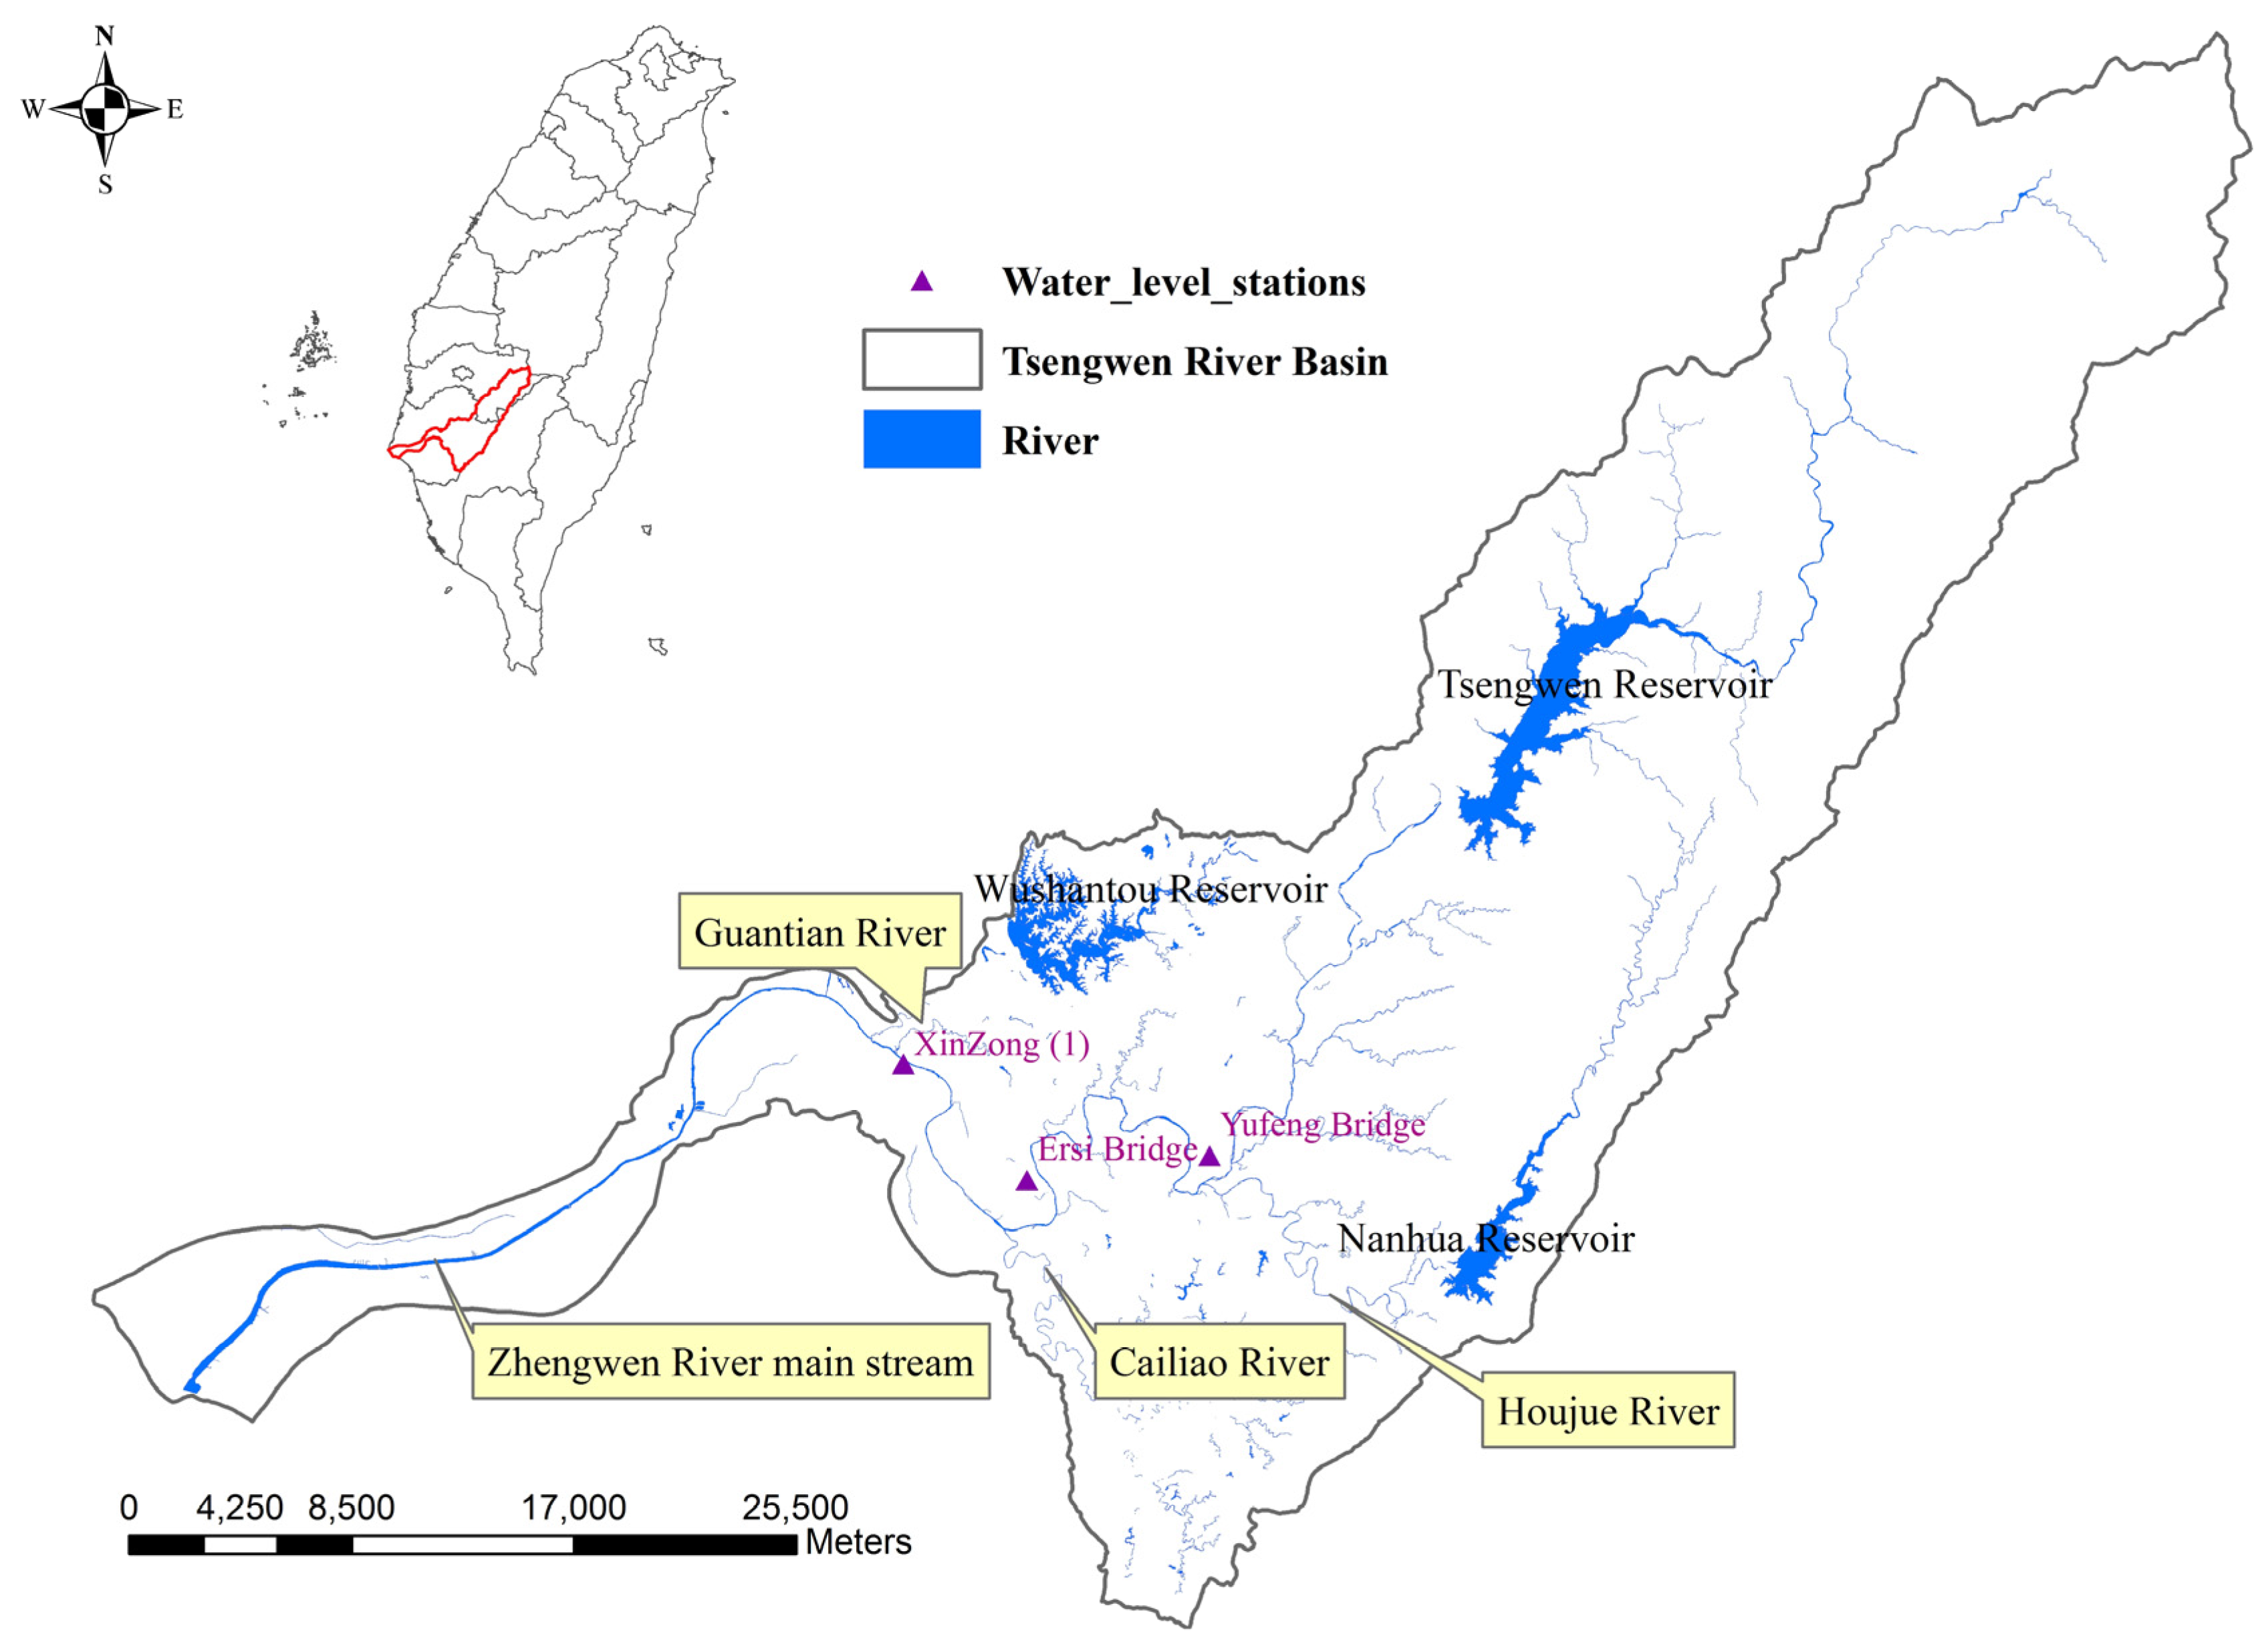
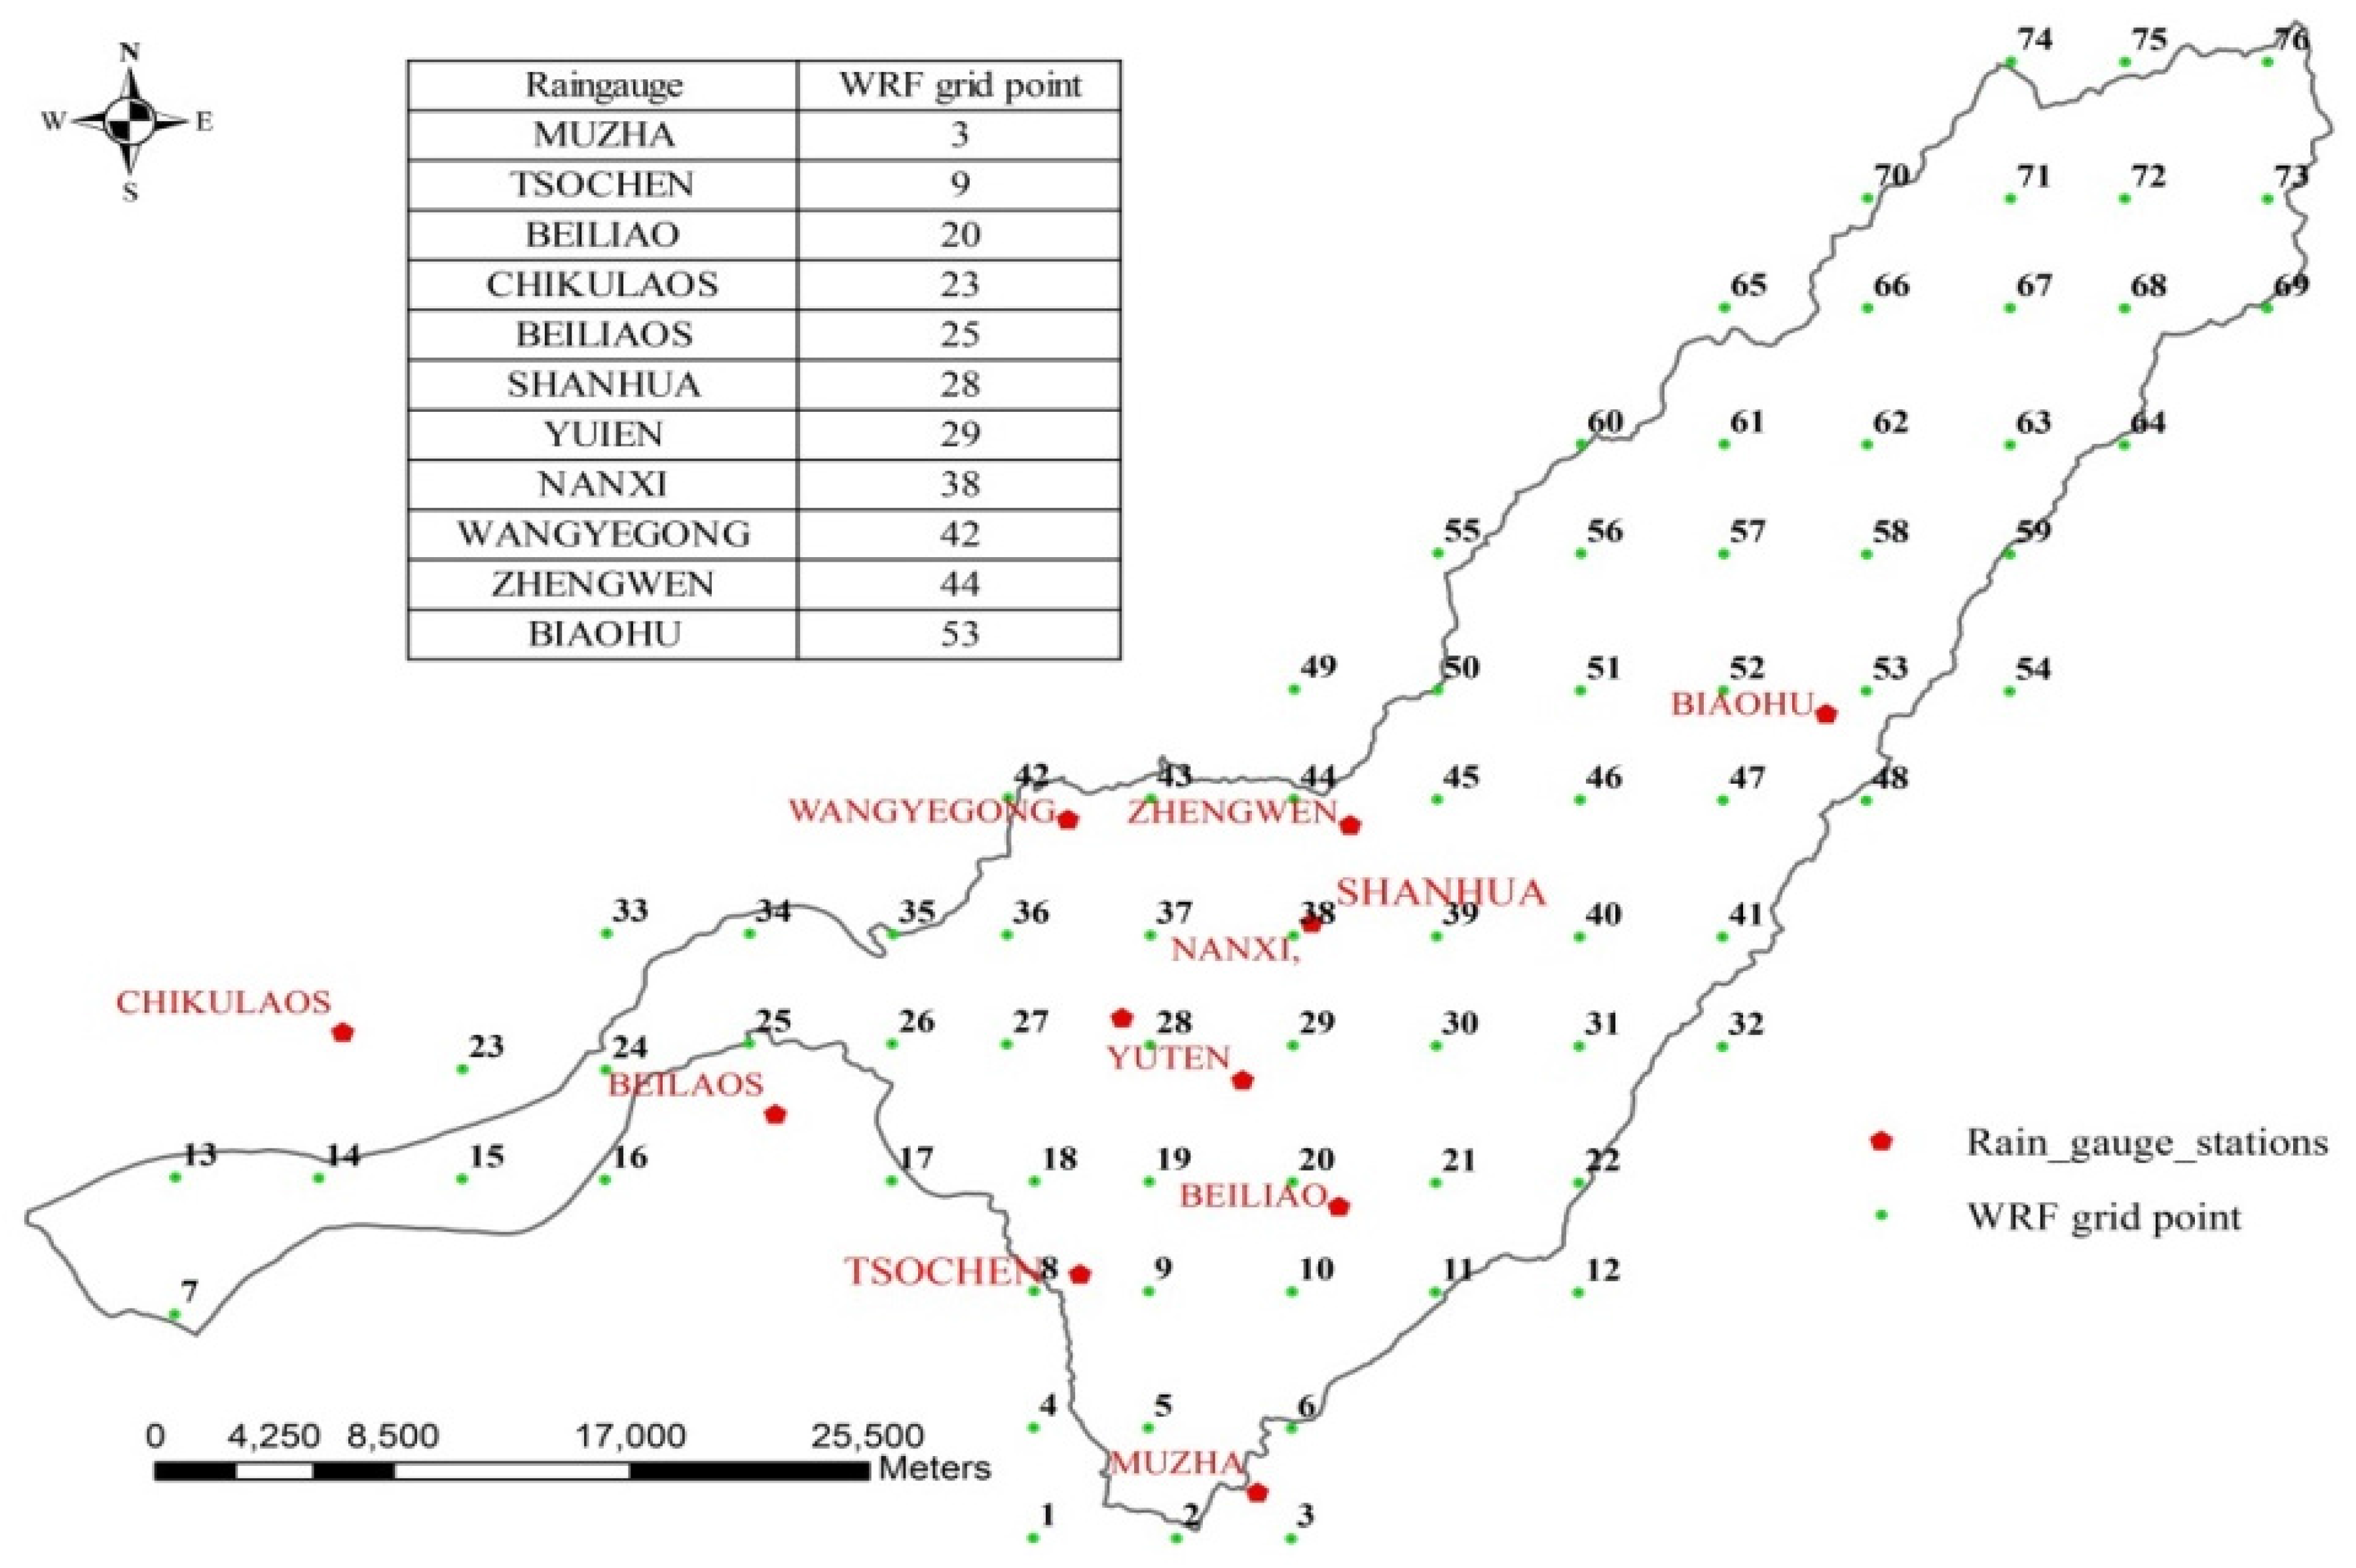
To validate the simulation model, the simulated and observed water level values were compared, and three statistical indices, namely, the coefficient of efficiency (CE), error of peak water level ( E L P ), and error of the time to peak ( E TP ), were calculated. The three indices are computed as follows:
C E = 1 i = 1 n ( L obs L est ) 2 i = 1 n ( L obs L ¯ obs ) 2
E L P = L est L obs L obs
E TP = T est T obs
where L est denotes the estimated flood discharge (cm), L obs represents the observed flood discharge (cm), and L ¯ obs is the mean value of the observed flood discharge (cm); L est and L obs are the observed and estimated peak water levels of the flood, respectively; and T est and T obs denote the estimated and observed time to peak discharges, respectively.

3.3. Study Area

We selected the Tsengwen River basin as the study area, which covers an area of approximately 1176.7 km2. The Tsengwen river basin is complex; the mountains are over 3000 m high, and the valley is narrower than 20 km. The average annual rainfall received by the drainage basin is 2643 mm. The Tsengwen River basin comprises the Tsengwen, Nanhua, and Wu Shantou Reservoirs. The Tsengwen Reservoir is located upstream of the Tsengwen Creek, and is the largest reservoir in Taiwan and the major source of water supply for downstream irrigation systems in Chiayi and Tainan Counties. The Tsengwen Reservoir has a large net water storage capacity (approximately 0.5 billion m3). The mean annual inflow to the reservoir is approximately 1.1 billion m3 [21]. The Tsengwen River Basin includes the Tsengwen River main stream, Cailiao River, Guantian River, and Houjue Creek. The location of the Tsengwen River Basin is shown in Figure 3.

3.4. Hydrologic and Geomorphic Data

Hydrologic and geomorphic data must be collected before simulating the river flow rate and water depth for different scenarios. River cross-sections, hydraulic structures, rainfall in future climate, land use, river flow, and water level data are the basic data.
Rainfall data include observations from historical typhoon events and simulated rainfall data of extreme typhoon events under future climate change. The water level data include those of gauging stations along the river and tidal stations near the estuary (120°06′43″ E, 23°01′25″ N). Hourly water level data from current gauging stations were collected to validate hydraulic routing. Tide levels at the estuary were considered downstream boundary conditions in the model. The finite volume coastal ocean model (FVCOM) was employed to project changes in the astronomical tide at the estuary under a future climate change scenario. Chen and Liu [22] provided a detailed description of the FVCOM structure and parameters. River cross-sectional data of 2010 were provided by the projects of the WRA’s Sixth River Management Office and Water Resources Planning Institute, and these include data of the cross-sections of the Tsengwen main stream, Cailiao River, Guantian River, and Houku Creek. The reservoir data include data of the Tsengwen, Nanhua, and Wushantou Reservoirs. The SOBEK model is based on reservoir operations [23,24,25], in which settings for the reservoir include reservoir area, volume, and contributing area, and settings for the dam include spillway, water gate, power plant discharge, and emergency spillway. Discharge functions were set according to reservoir operation rules.
This study used the atmospheric general circulation model MRI-AGCM; the climate during three periods over a total of 75 years was simulated: base period (1979–2003), near future (2015–2039), and end of the century (2075–2099), developed by Japan Meteorological Agency (JMA) and Meteorological Research Institute (MRI); and ECHAM5, the climate model developed by the German research institute MPI, for climate projections. Simulation results were used as the initial field and boundary conditions for dynamical downscaling in the WRF modeling system, which was developed by the U.S. National Center for Atmospheric Research (please refer to the report of TCCIP (2010) for details).
This study adopted the high-resolution MRI-AGCM (20 km) to define typhoon events. MRI-AGCM revises the definition of typhoon provided by Vitart et al. [4], and uses the conditions of 850-hpa vorticity, sea-level pressure, presence or absence of warm-core structure near the typhoon center, and maximum local thickness to detect typhoons. Moreover, the wind speed at the bottom layer of typhoons must reach at least 17 m/s for 1.5 days or more. The process of selecting typhoon events can be divided into two steps: screening typhoon events and tracing typhoon routes [4]. The number of typhoon events determined using the aforementioned definition for the three periods and MRI-AGCM are 88, 82, and 81.
We ranked extreme typhoon rainfall events from each of the three 25-year periods based on the total rainfall over 24 h in the Tsengwen River basin. Although the TCCIP (2/3) reported that projections must be revised, this study bias-corrected the rainfall data by using the cumulative distribution function model [26] for the extreme typhoon rainfall events during the three periods. Figure 4 shows the average rainfall of the TOP1–20 events during the base period, near future, and end of the century. Moreover, we observed that the rainfall of the typhoon events at the end of the century (2075–2099) is higher than that of the base period and near future. Table 2 shows the statistical values for the TOP1–20 extreme events during the three periods. The Central Weather Bureau of Taiwan defines 24-h accumulated rainfall of 250 mm as extremely torrential rain. After observing rainfall characteristics that resulted in floods in Taiwan, Yu et al. [27] defined 3-h accumulated rainfall of 130 mm as short-duration disastrous rain. Table 1 shows that the TOP1–2 events in the base period, TOP1–5 in the future and the TOP1–12 events at the end of the century are extremely torrential rain events. The TOP2 event in the near future and the TOP1-3, TOP5, and TOP6 events at the end of the century are short-duration disastrous rainfall events.
In 2009, typhoon Morakot induced long-duration continuous rainfall, and the total rainfall received was approximately equal to the rainfall received during the most extreme typhoon event at the end of the century. However, the maximum rainfall induced by typhoon Morakot after continuously raining for 3 and 24 h was lower than the rainfall induced by the top few extreme typhoon events at the end of the century. In other words, rainfall distribution during extreme typhoon events during the future climate will be high over a short period.
Because the weather research and forecasting (WRF) climate data are grid data, this study collected the rainfall data from WRF grid points of the WRA’s rainfall stations nearby, and used the data as input for the SOBEK model. The location of rainfall stations and WRF grid points are shown in Figure 5. Because of the historical rainfall data length and data acquisition constraints, this study selected 11 rainfall stations: MUZHA, TSOCHEN, BEILIAO, CHIKULAOS, BEILIAOS, SHANHUA, YUTEN, NANXI, WANGYEGONG, ZHENGWEN, and BIAOHU.

4. Case Analysis

This study used 88 extreme typhoon rainfall events for the base period, 81 for the near future, and 82 for the end of the century periods. The data were used as inputs for the SOBEK routing model, which is used for simulating changes in the river flow rate during future climate change.

4.1. River Hydraulic Structure Impact Assessment

Common hydraulic structures in rivers include weirs, piers, dams, embankments, and groundsills. When a river channel requires hydraulic structures, which can be for various purposes (flood disaster prevention or hydraulic design), the flow rate and flood stage of the river channel must first be estimated to protect the hydraulic structures as well as the lives and assets of residents.
Conventional river flood prevention plans incorporate the concept of a return period when considering risk [28]; the design standard of river flood prevention facilities in Taiwan considers return periods of 50, 100, or 200 years. Hydrological data used for return period analysis are obtained through statistical analysis of historical data (20–60 years). During flood prevention facility planning and designing, the flow rate is projected on the basis of the hydrological data of the return period and geomorphic data of the river channel, along with a safety factor to reduce the uncertainty. The projected flood stage is calculated using a hydraulic model test or 1D hydraulic model based on the river’s physical characteristics. Table 3 shows the design flow rate and flood stage at XinZong (1), Erxi Bridge, and Yufeng Bridge, as well as the highest water level observed in the past.

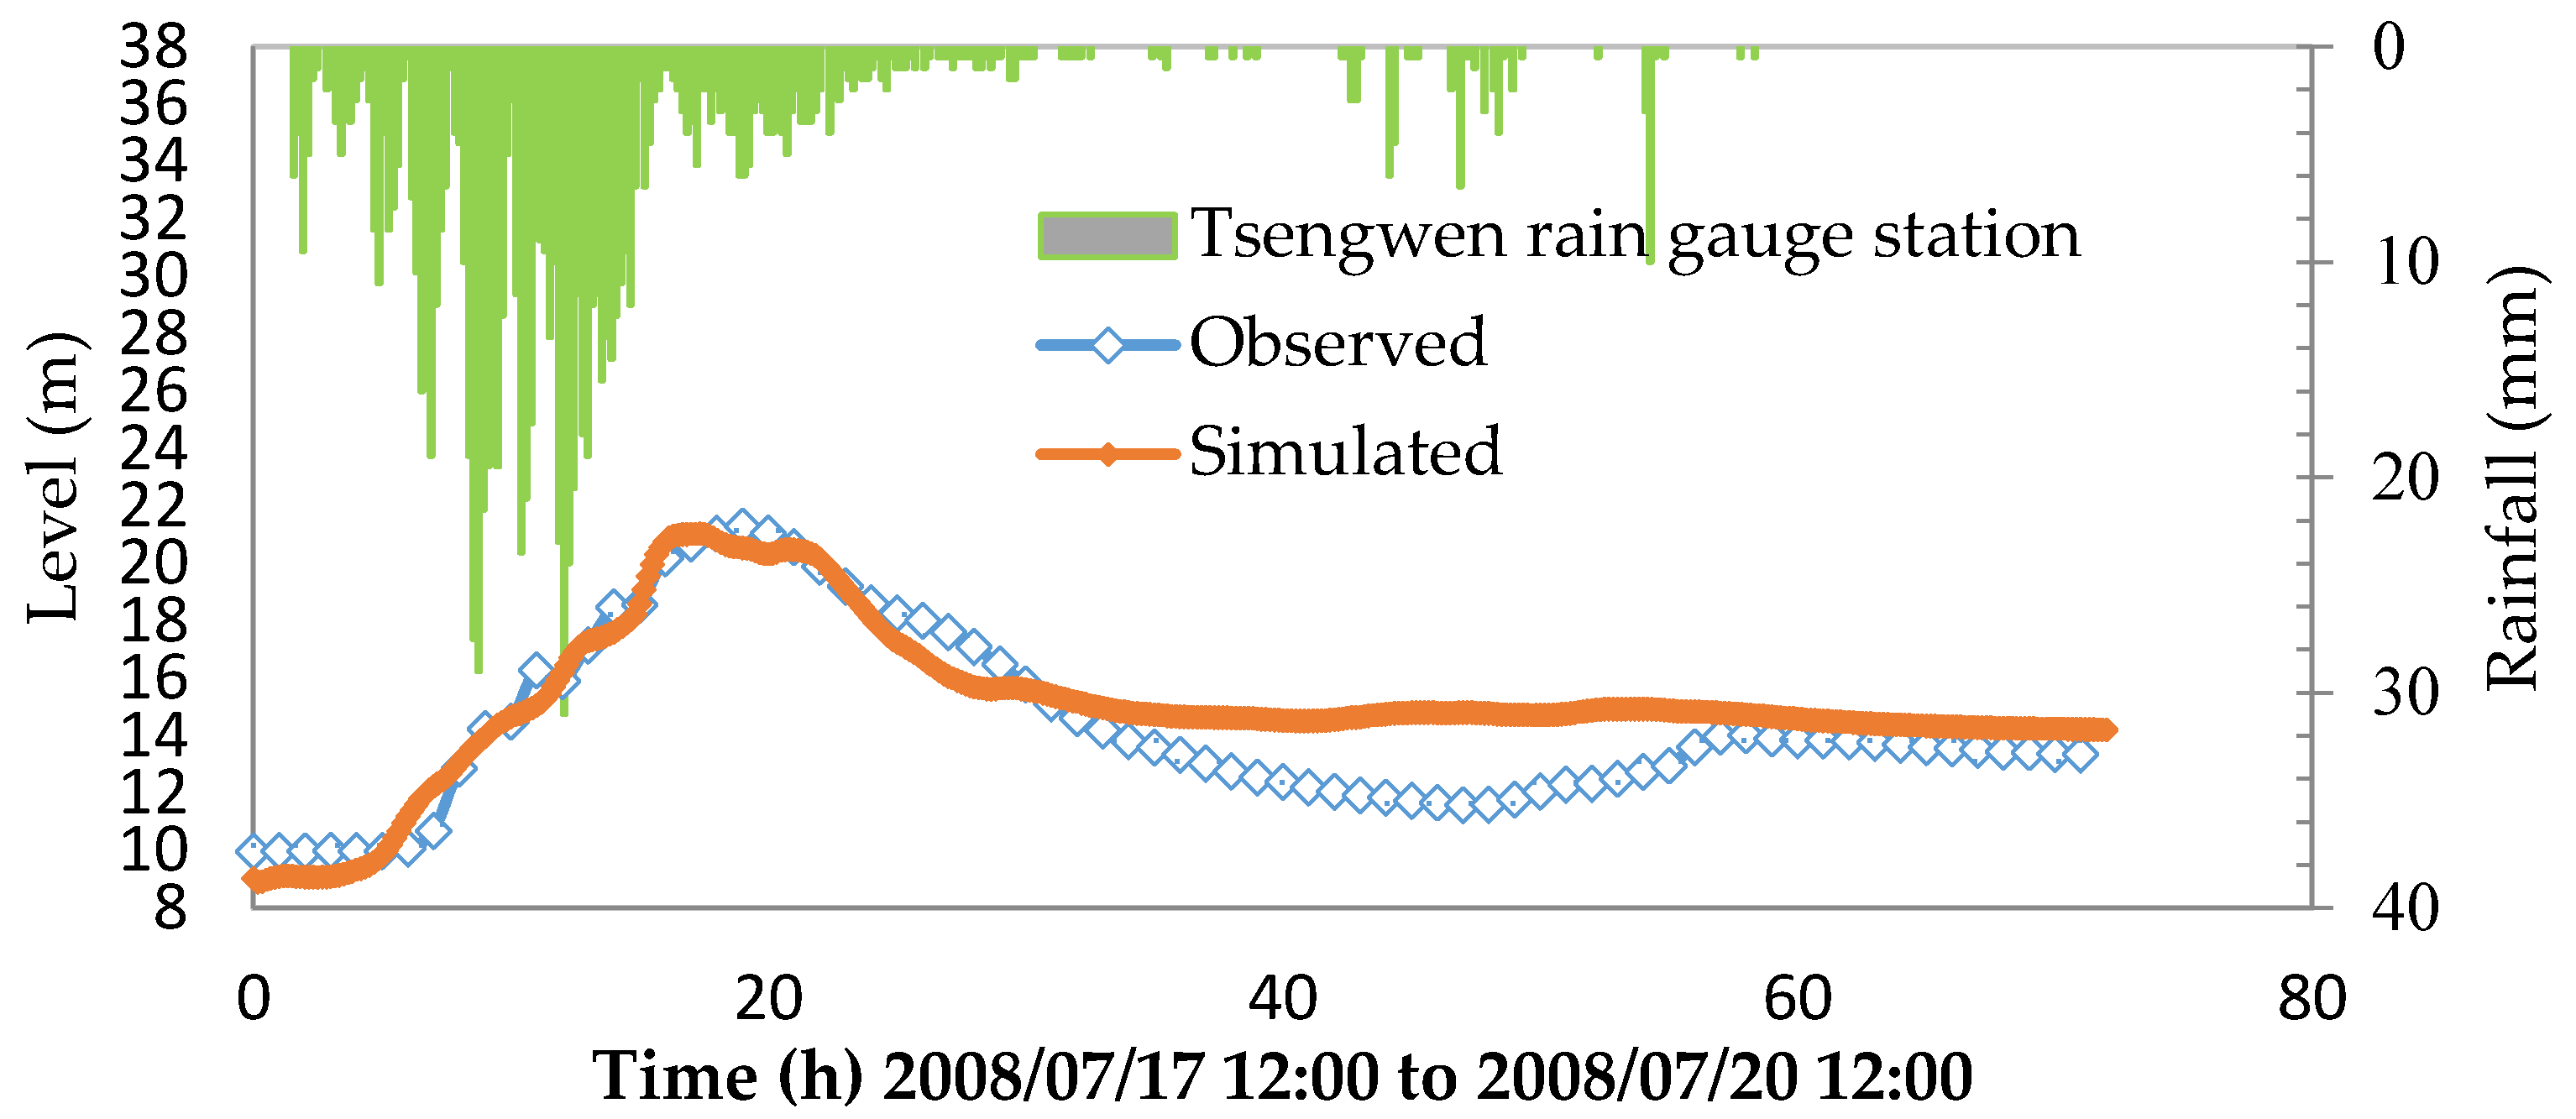
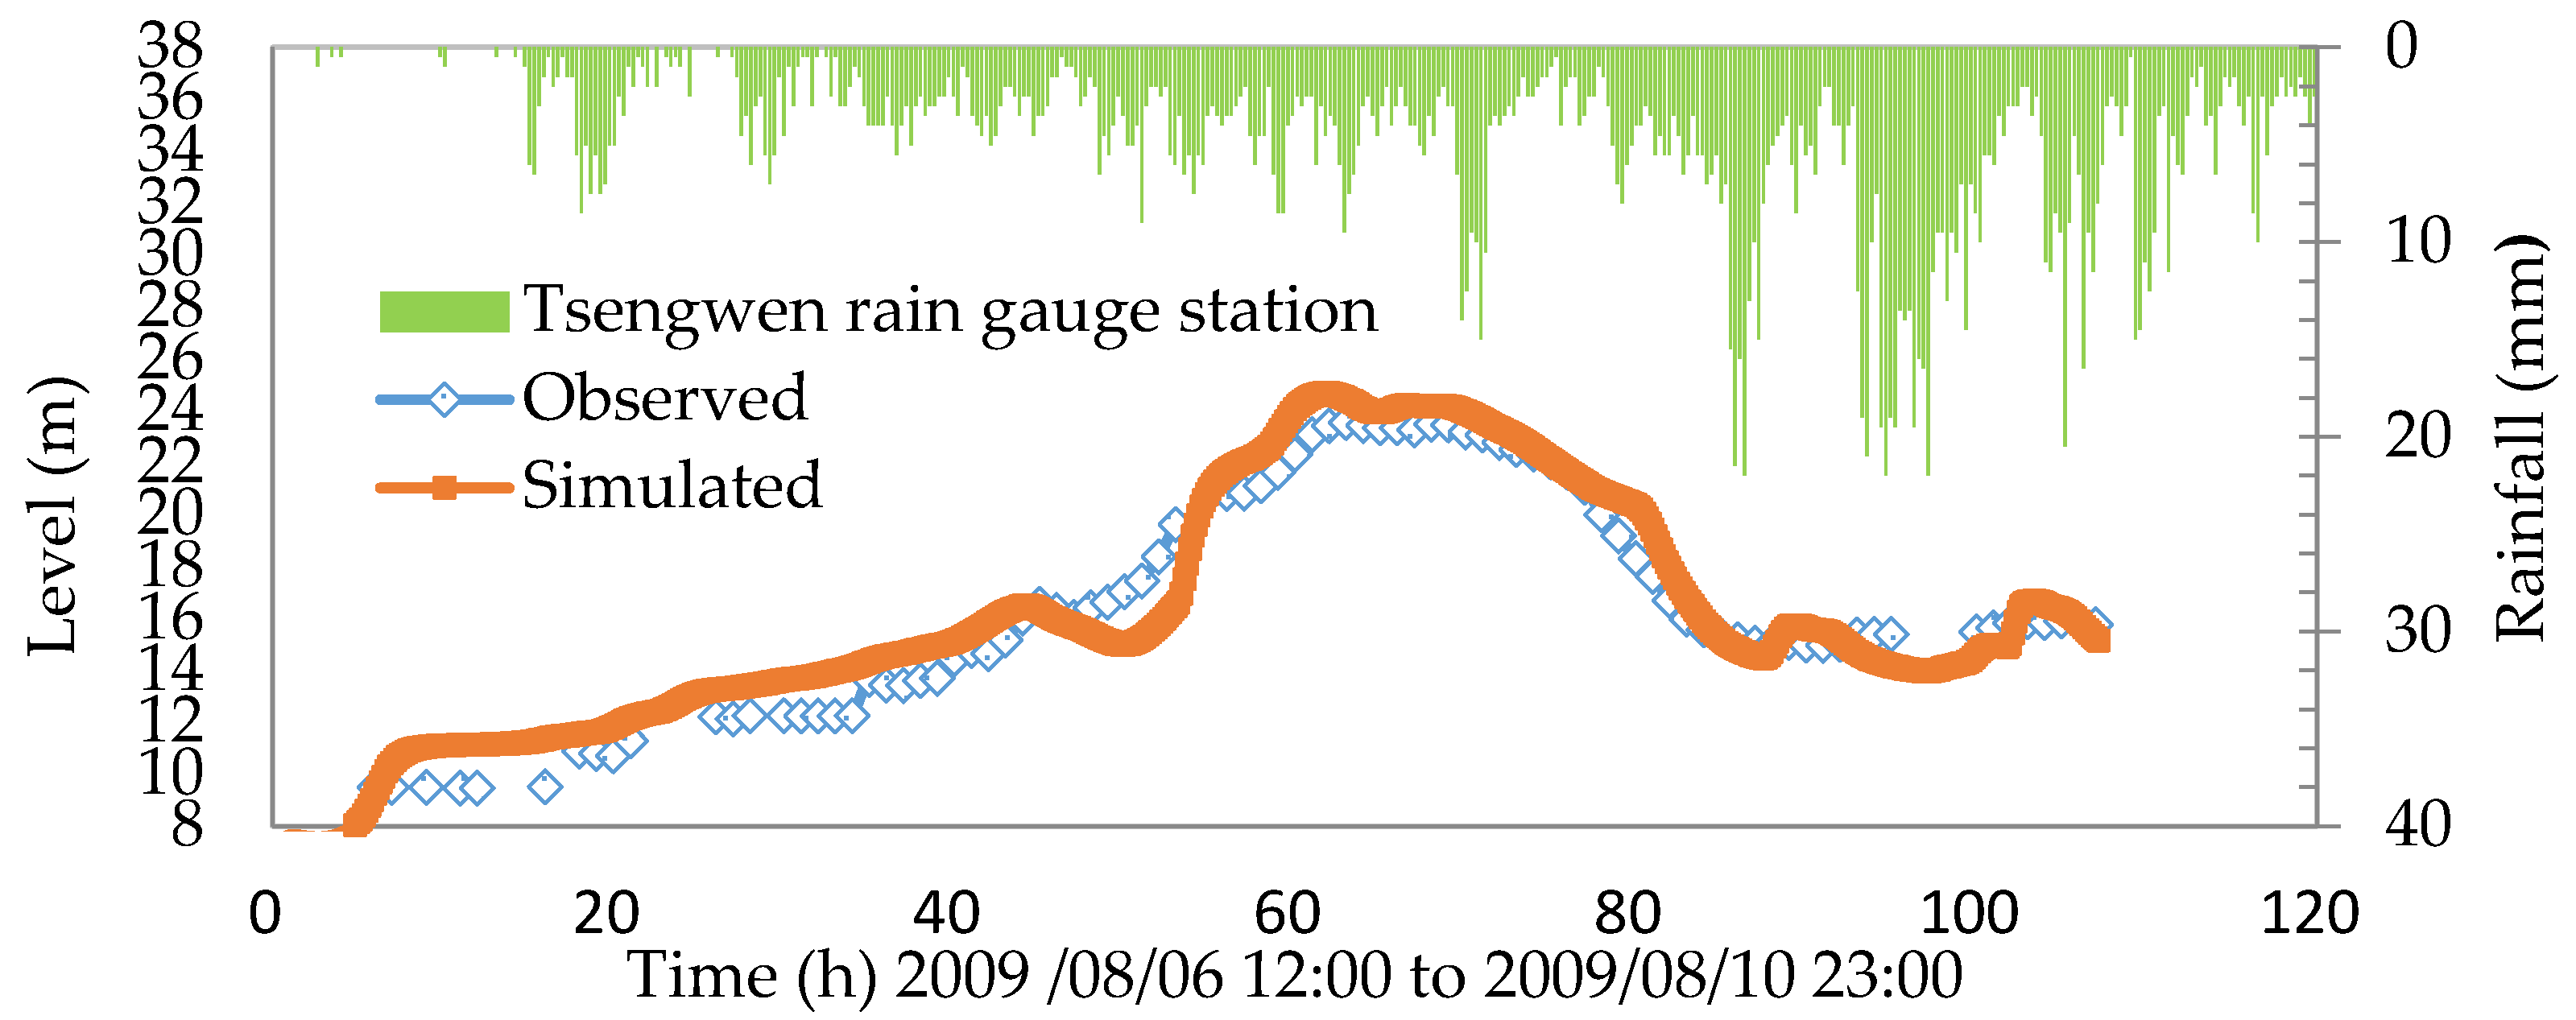
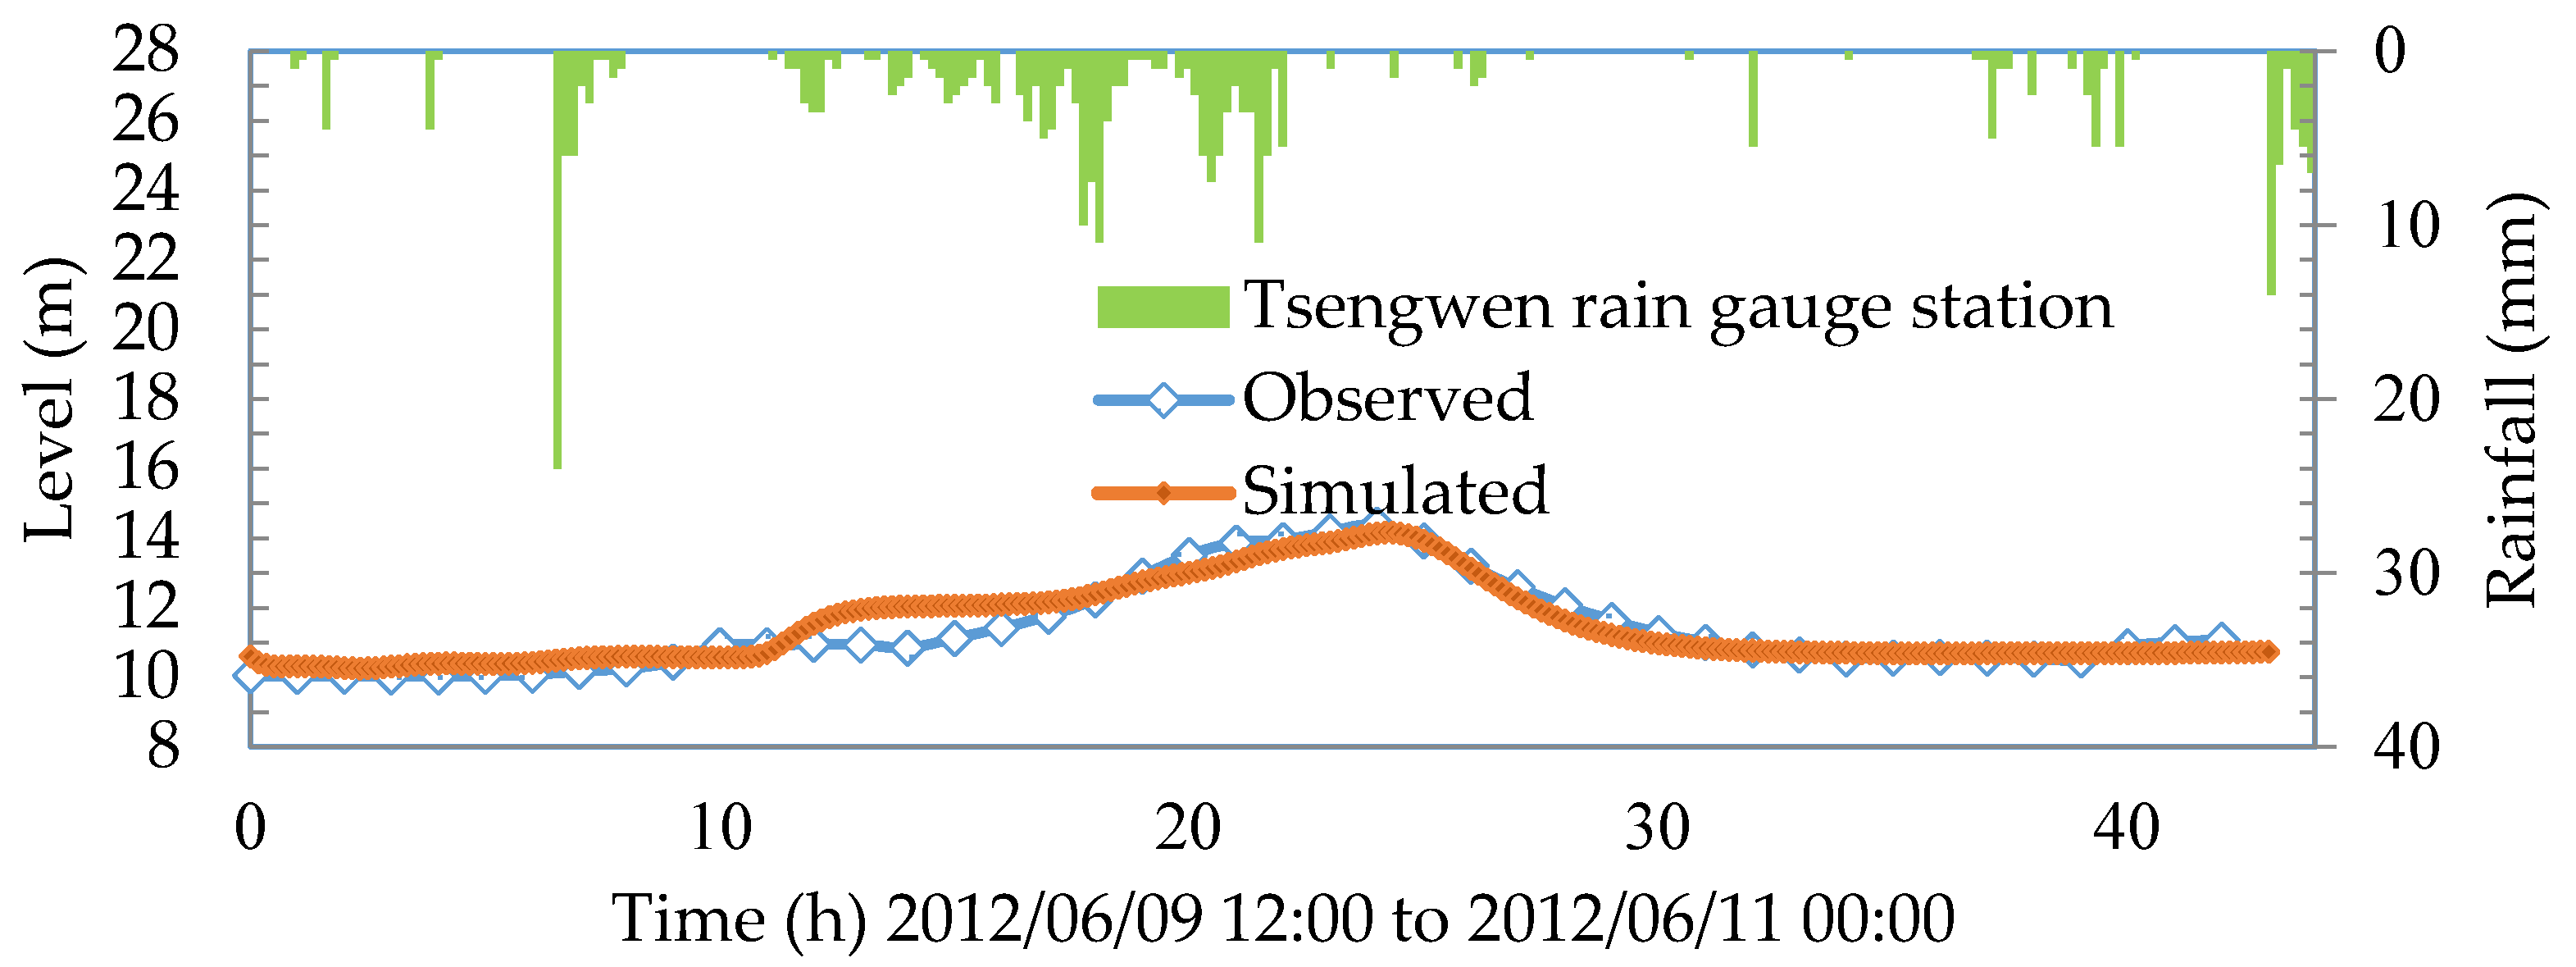
4.2. Model Calibration and Validation

This study used the data of the rainfall for Typhoon Kalmaegi (2008) and Typhoon Morakot (2009) to calibrate the SOBEK model parameters and rainfall of 0610 torrential rains to validate the model parameters. Figure 6, Figure 7 and Figure 8 compare the water levels measured at the XinZong Bridge No. 1 station in the Tsengwen River basin by using the SOBEK model. The figures show that the SOBEK simulations match the measured water levels.
To discuss the performance of the model, this study used CE, ELp, and ETP as a basis for the model validation. A CE approximating 1 indicates that the routing model has a higher goodness of fit, an ELp greater than 0 indicates that the peak water level projected by the model is higher than the observed peak water level, an ELp less than 0 indicates that the peak water level projected by the model is lower than the observed peak water level, and a lower ETP indicates that the model is more accurate when projecting the time to peak. The results in Table 4 show that the simulated water level approximated the observed water level.

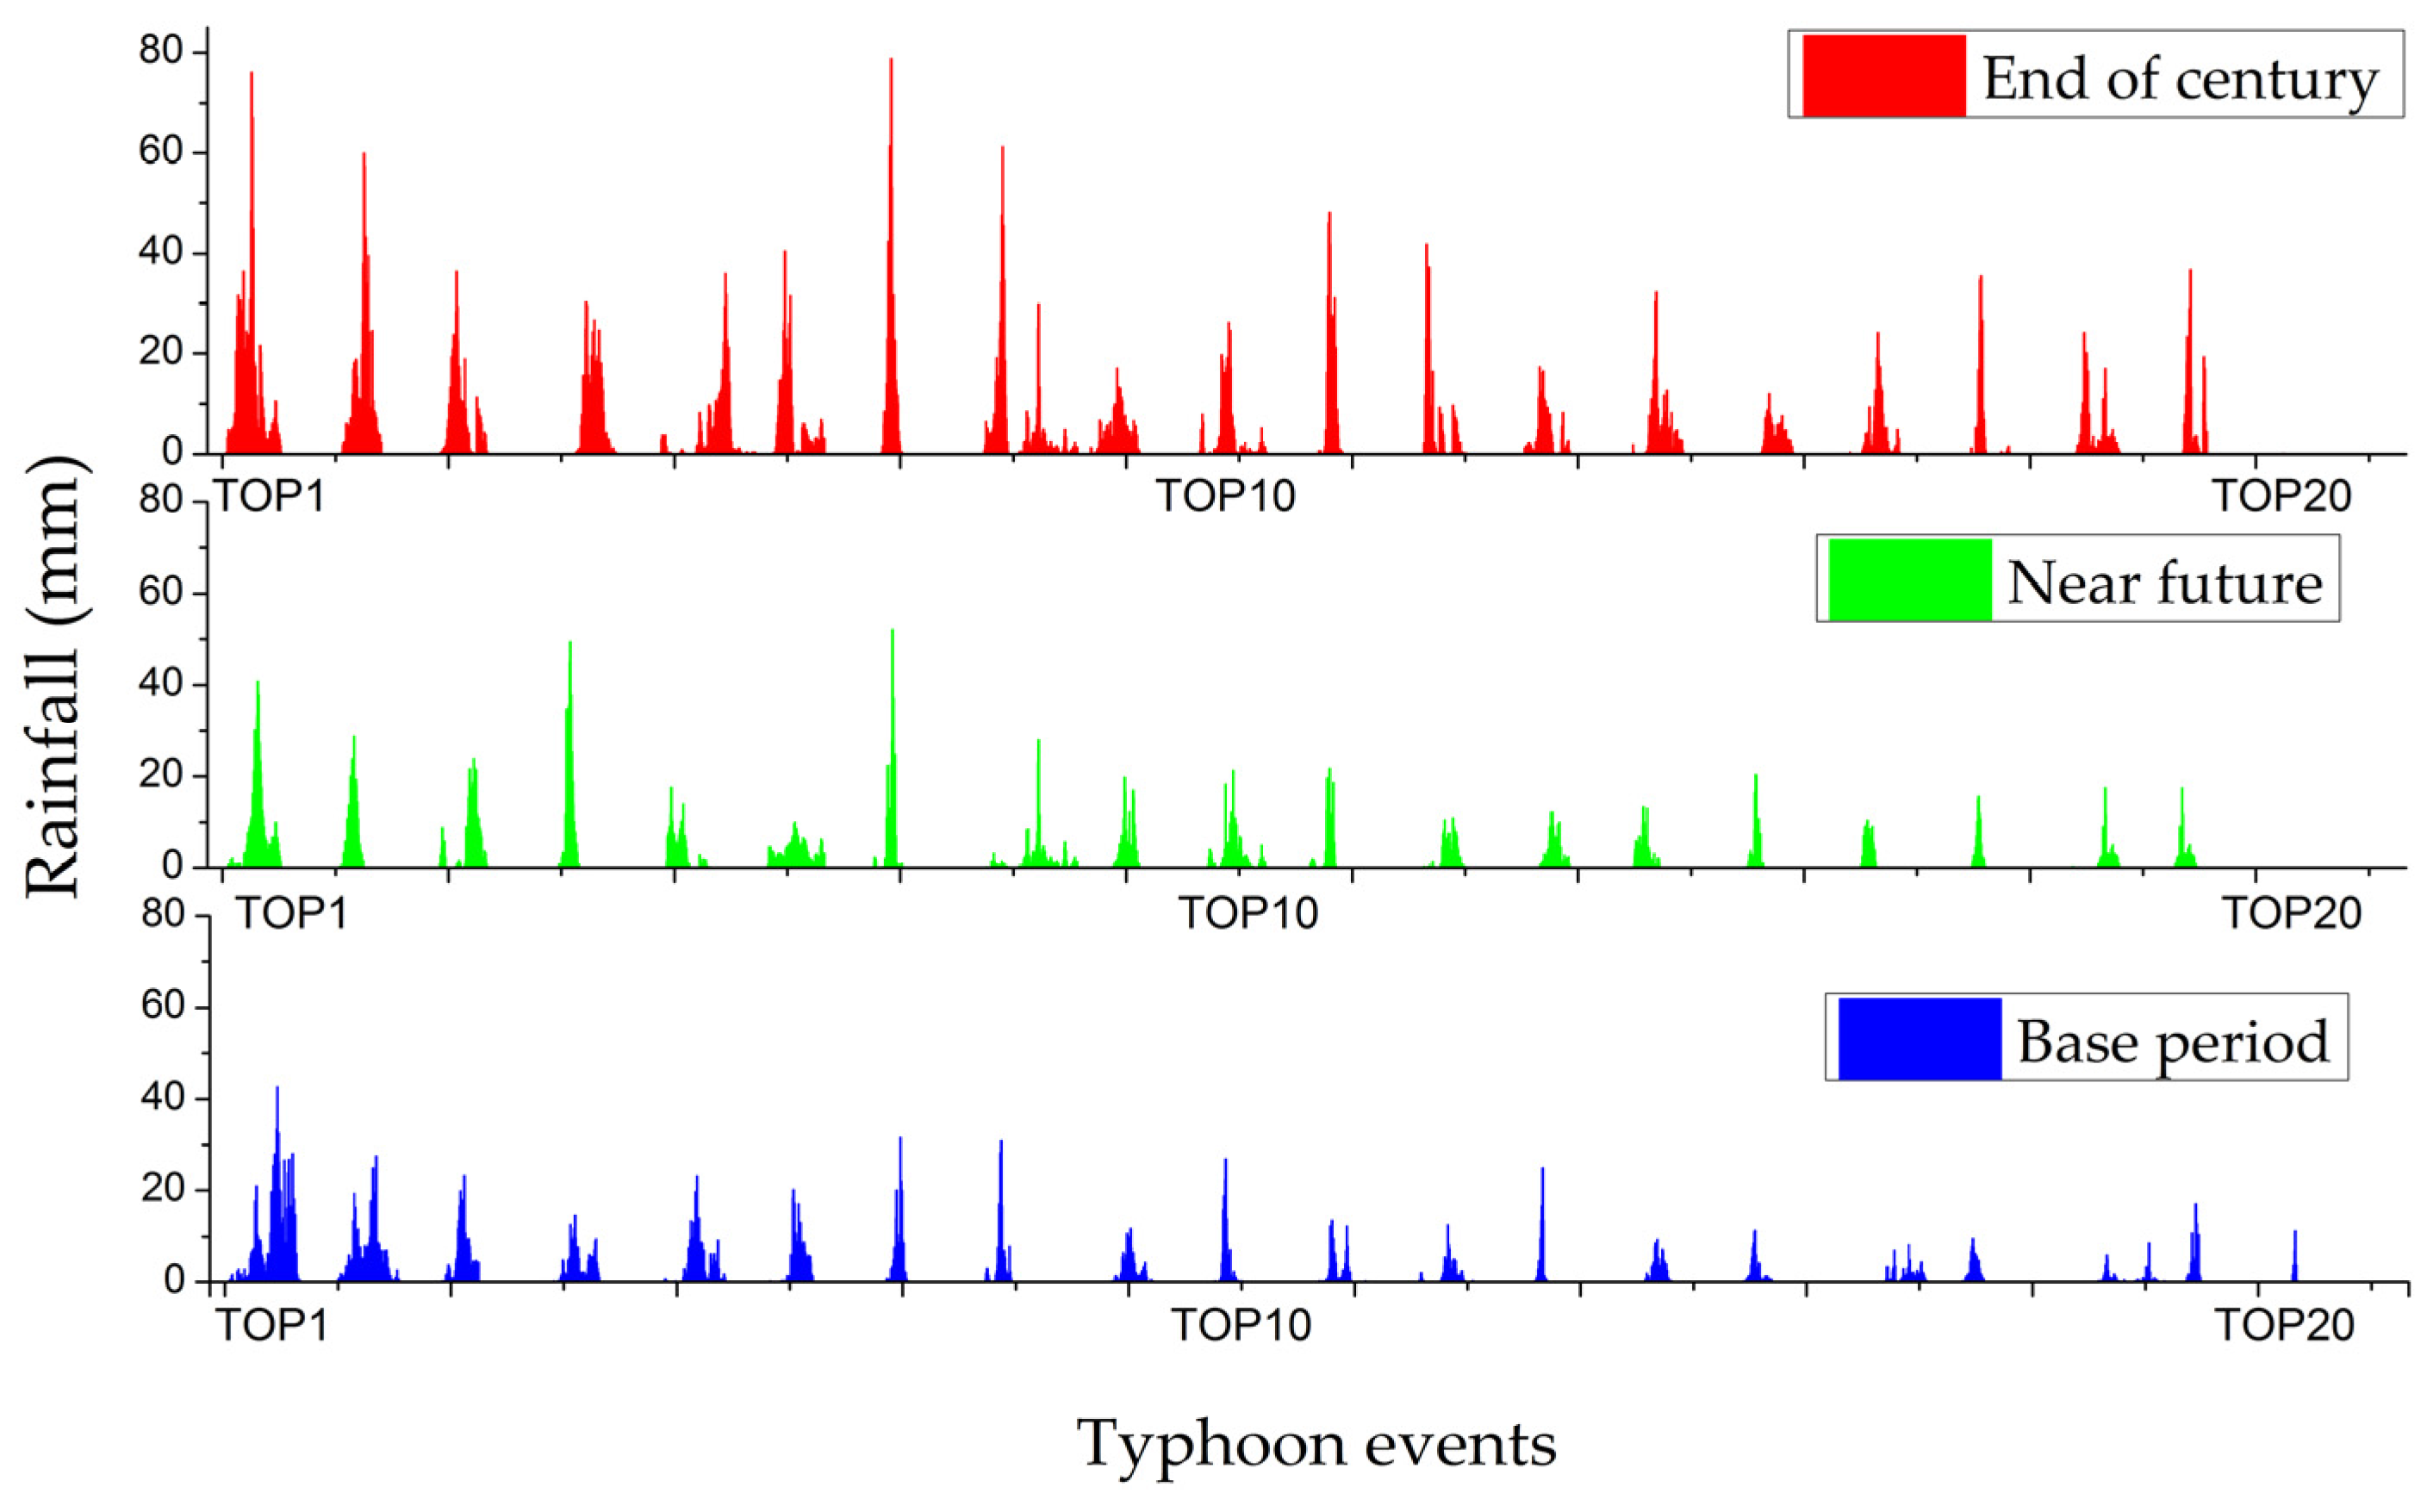
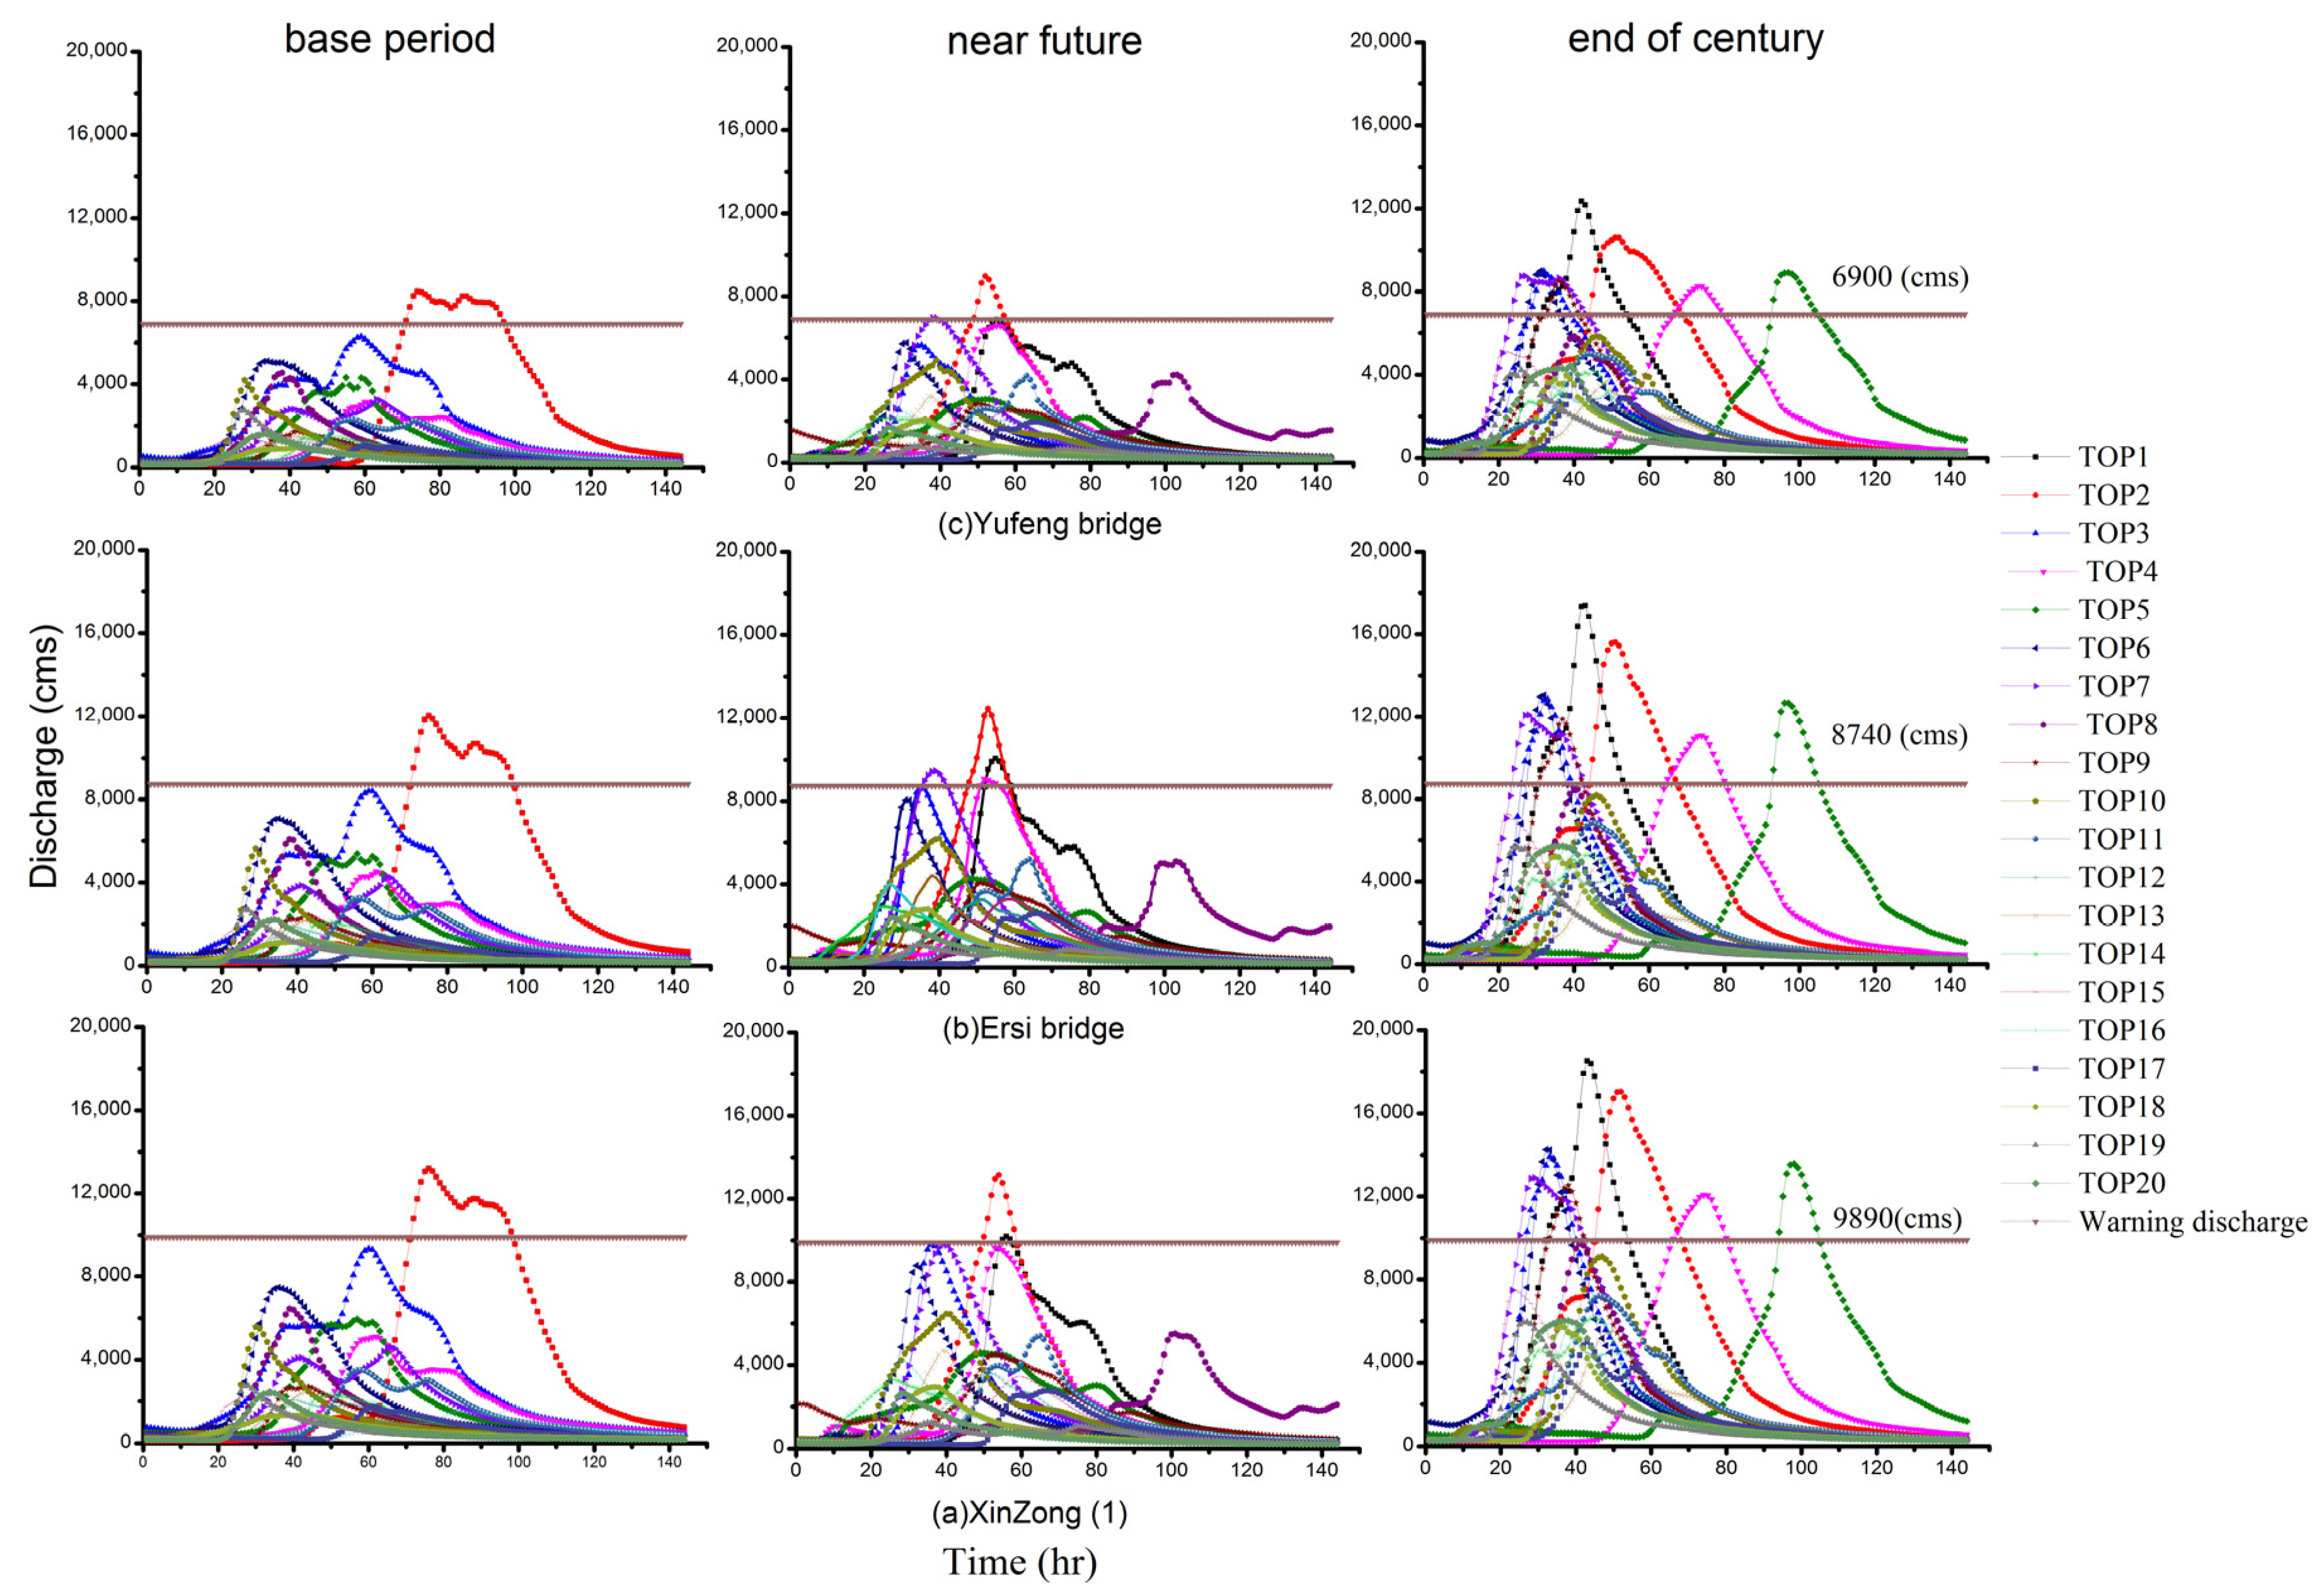
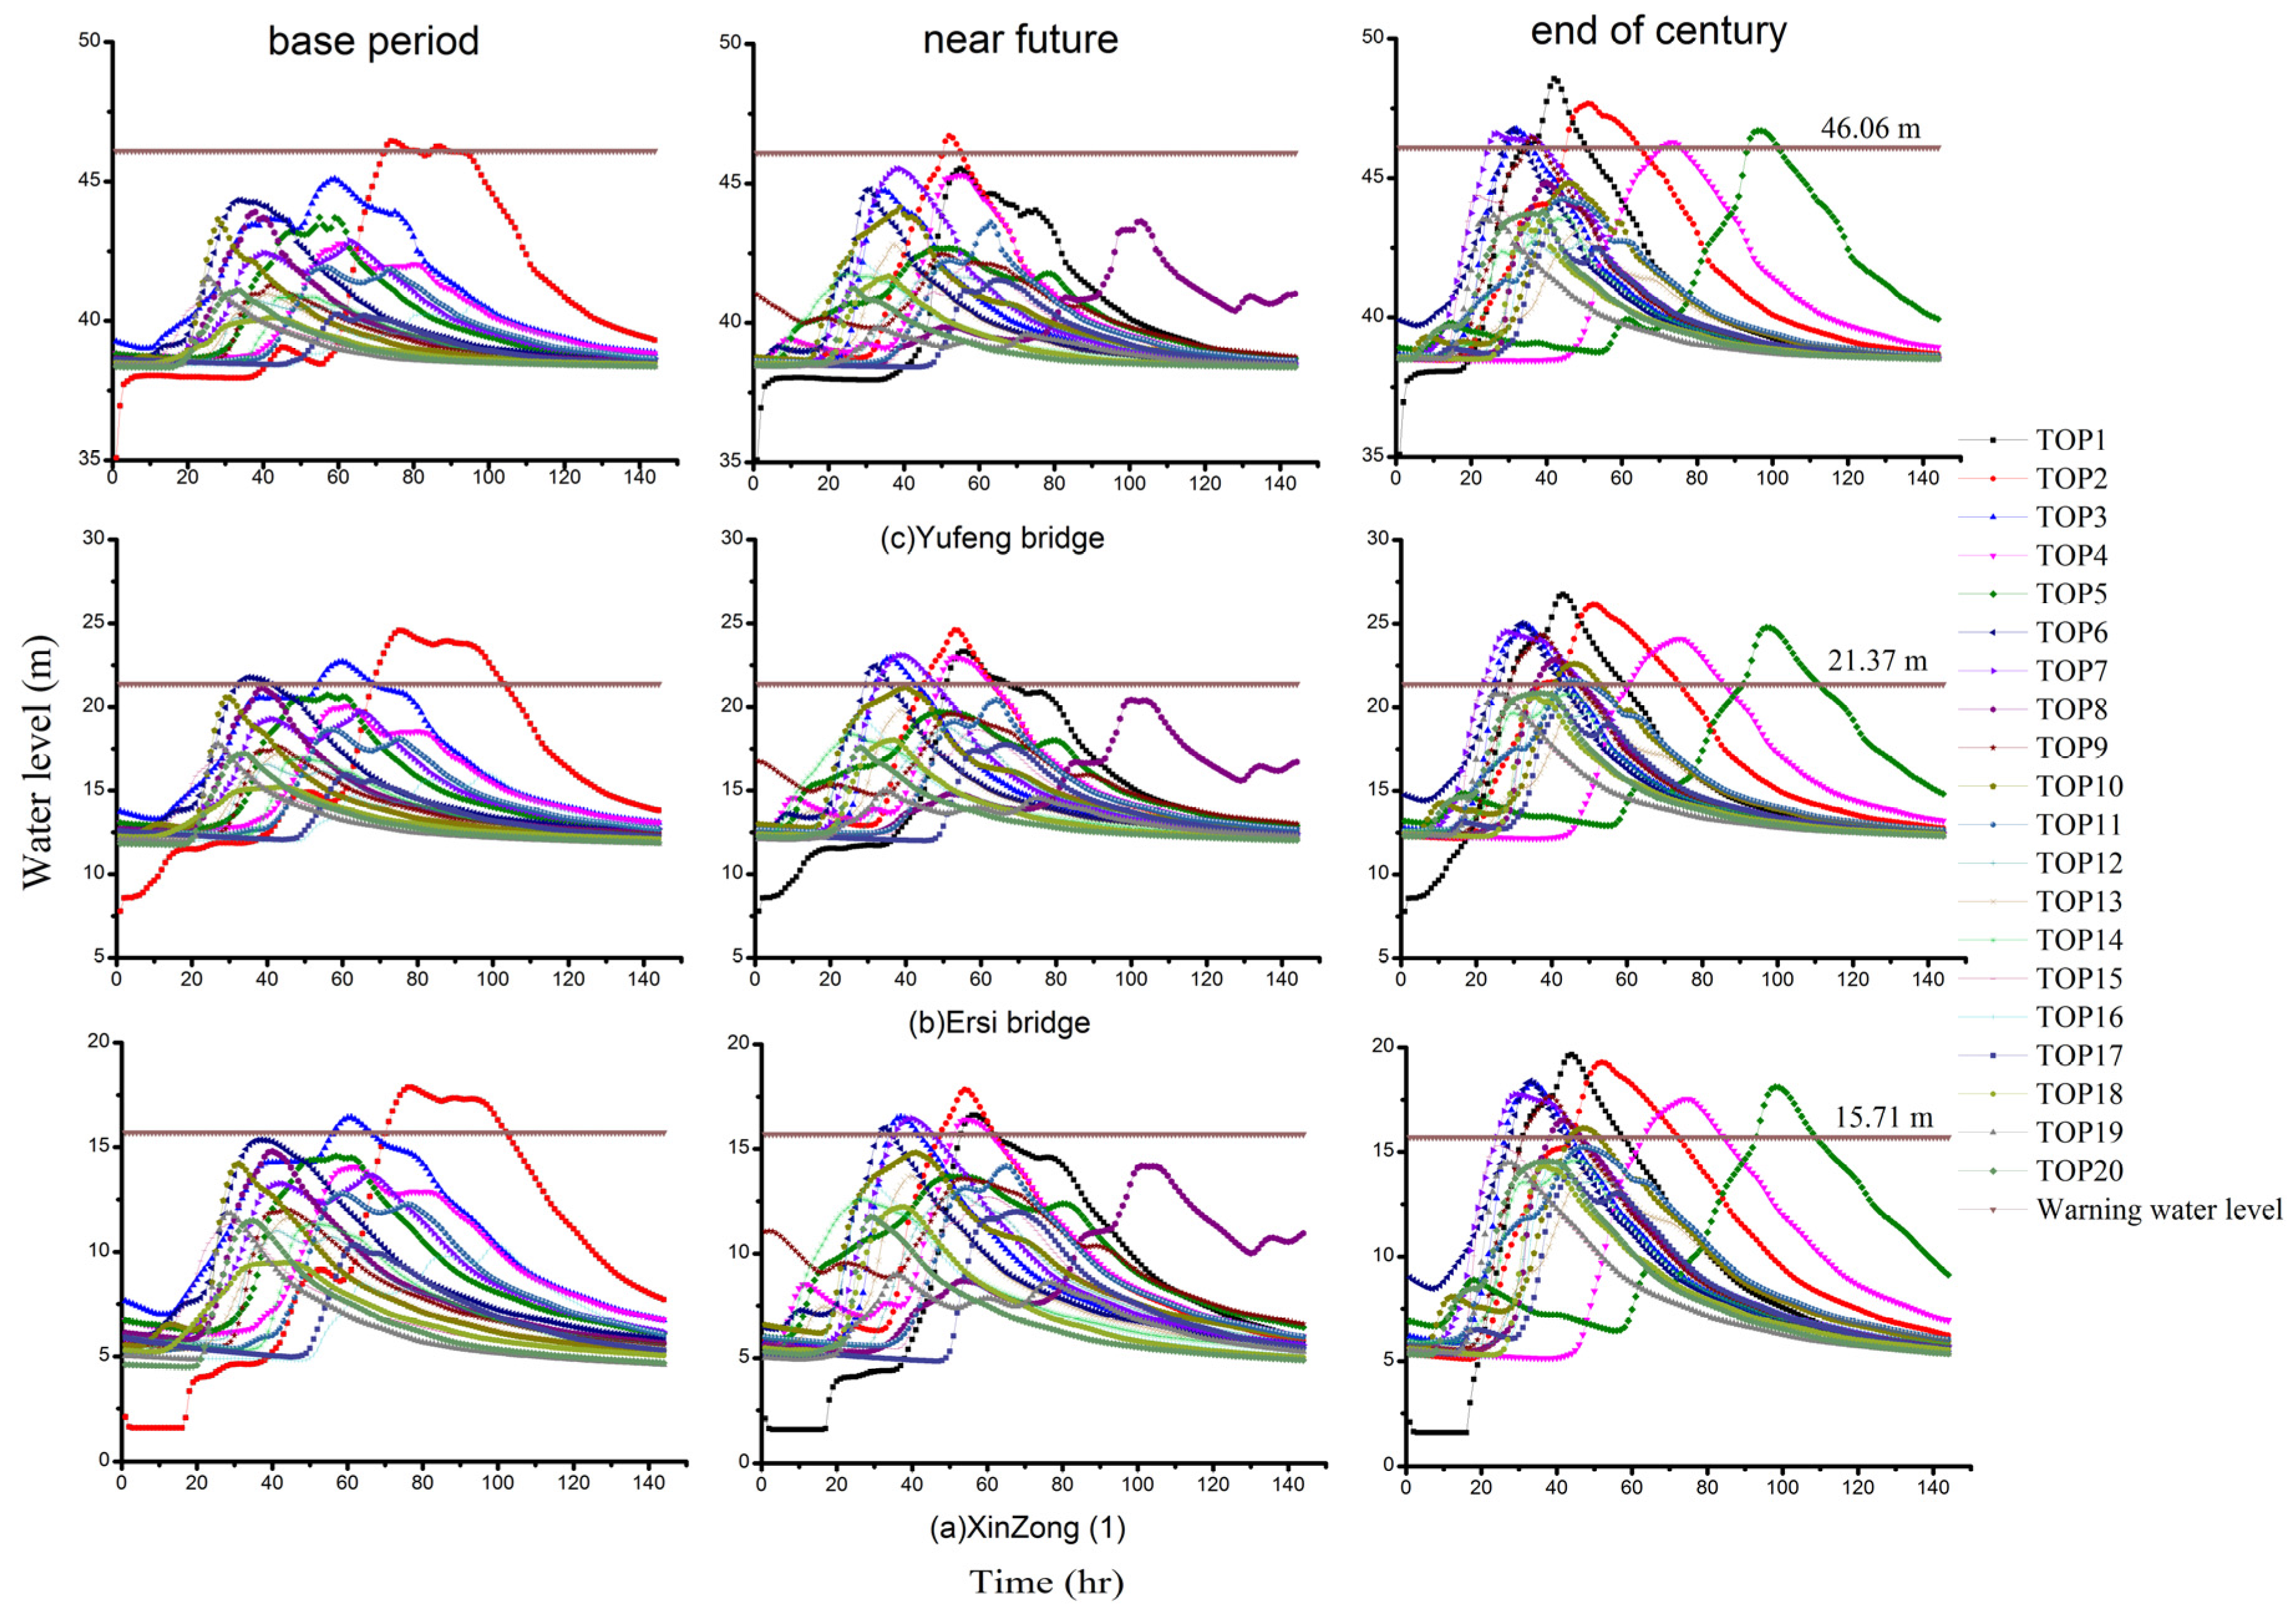
4.3. Simulation Results

Figure 9 and Figure 10 show the simulated discharge and water level hydrograph for the TOP1–20 extreme typhoon events during the base period, near future, and end of the century at the XinZong (1), Erxi Bridge, and Yufeng Bridge. According to these figures, the peak discharge and water level for the end of the century is higher than those for the base period and near future.
The design flood stages at XinZong (1), Erxi Bridge, and Yufeng Bridge gauging stations are 15.71, 21.37, and 46.06 m, respectively. Table 5 shows the water levels that exceeded the design values for extreme typhoon events in the base period, near future, and end of the century at XinZong (1), Erxi Bridge, and Yufeng Bridge. The simulated water levels at these three gauging stations exceeded the design values for the water levels in the three periods. In the base period, the peak flows at XinZong 1, Erxi Bridge, and Yufeng Bridge exceeded the management plan flow rate in 2 of 88, 3 of 88, and 1 of 88 events, respectively. For the near future, the corresponding peak flow rates exceeded the design discharge in 6 of 82, 6 of 82, and 1 of 82 events, and at the end of the century, the corresponding flow rates exceeded the flow rate in 10 of 81, 12 of 81, and 8 of 81 events. At the end of the century, extreme peak flow events were forecasted to increase in both frequency and intensity. The simulation results show that the upstream area of the Tsengwen River is already at risk of flooding at the end of the century.
The highest water levels measured at Erxi Bridge during the TOP1 and TOP2 extreme typhoon events at the end of the century were 24.55 and 24.32 m, respectively, which are higher than the highest water level of 23.56 m during typhoon Morakot. This simulation result indicates that a severe flood could reoccur under climate change.

5. Conclusions and Recommendations

This study used dynamic downscaling data produced by the TCCIP project for river flow rate simulation, and the results highlight the risk of overflow in the Tsengwen River in the future under a climate change scenario.
In 2009, Typhoon Morakot induced continuous rainfall over a long period, and the total rainfall received was lower than that received during the most extreme typhoon events forecasted for the end of the century. Furthermore, the maximum total rainfall received in 3 and 24 h during the top extreme typhoon events at the end of the century was higher than that received at those times during typhoon Morakot, indicating that extreme typhoon events under future climate change will induce strong rainfall over a short period.
Based on the flow rate simulation results, the flow rate at Yufeng Bridge (upstream,) Erxi Bridge (midstream), and XinZong. (1) (downstream) will potentially exceed the management plan at the end of the century. At XinZong (1), the number of times that the flow rate exceeded the management plan rate was 2 in 88 events in the base period, 6 in 82 events in the near future, and 10 in 81 events at the end of the century; that for the end of the century was 5-fold higher than that of the near future and 3-fold higher than that of the base period. At the end of the century, extreme peak flow events will increase in frequency and intensity. Simulation results show that the peak flow rate at the end of the century will be higher than that during Typhoon Morakot. Therefore, a severe flood could reoccur in the future.
In this study, the river cross-section was assumed to be the same when simulating flow rates for future climate change. In future, we will consider the influence of erosion and land use change on the river cross-section when carrying out simulations for future climate change.

Acknowledgments

The authors thank Akio Kitoh of the Meteorological Research Institute, Japan, for providing the MRI data. The authors also thank the Taiwan Central Weather Bureau and Water Resources Agency for providing the observational data. This project was funded by the National Science Council of Taiwan. The authors thank Yuan-Fong Su and Wei-Bo Chen for allowing use of their data in our research.

Author Contributions

Hsiao-Ping Wei executed the model simulations and discussed the results with Keh-Chia Yeh, Jun-Jih Liou, Yung-Ming Chen, and Chao-Tzuen Cheng.

Conflicts of Interest

The authors declare no conflict of interest.

References

  1. Intergovernmental Panel on Climate Change (IPCC). Climate Change 2007: The Physical Science Basis. Contribution of Working Group I to the Fourth Assessment Report of the Intergovermental. Panel on Climate Change; Cambridge University Press: Cambridge, UK, 2007. [Google Scholar]
  2. Liu, K.F.; Li, H.C.; Hsu, Y.C. Debris flow hazard assessment with numerical Simulation. Nat. Hazards 2009, 49, 137–161. [Google Scholar] [CrossRef]
  3. National Science and Technology Center for Disaster Reduction (NCDR): Introduction of Taiwan Climate Change Projection and Information Platform Project (TCCIP). NCDR Rep. 2010, 7, 2010–2054. (In Chinese)
  4. Vitart, F.; Anderson, J.L.; Stern, W.F. Simulation of the interannual variability of tropical storm frequency in an ensemble of GCM integrations. J. Clim. 1997, 10, 745–760. [Google Scholar] [CrossRef]
  5. Lenderink, G.; Buishand, A.; Deursen, W.V. Estimates of future discharges of the river Rhine using two scenario methodologies: Direct versus delta approach. Hydrol. Earth Syst. Sci. 2007, 11, 1145–1159. [Google Scholar] [CrossRef]
  6. Wilby, R.L.; Wigley, T.M.L.; Conway, D.; Jones, P.D.; Hewitson, B.C.; Main, J.; Wilks, D.S. Statistical downscaling of general circulation model output: A Comparison of Methods. Water. Resour. Res. 1998, 34, 2995–3008. [Google Scholar] [CrossRef]
  7. Wilby, R.L.; Charles, S.P.; Zorita, E.; Timbal, B.; Whetton, P.; Mearns, L.O. IPCC Task Group on Data and Scenario Support for Impact and Climate Analysis (TGICA). Guidelines for Use of Climate Scenarios Developed from Statistical Downscaling Methods; IPCC Data Distribution Centre: Geneva, Switzerland, 2004. [Google Scholar]
  8. Tabor, K.; Williams, J.W. Globally downscaled climate projections for assessing the conservation impacts of climate change. Ecol. Appl. 2010, 20, 554–565. [Google Scholar] [CrossRef] [PubMed]
  9. Chen, H.; Xu, C.Y.; Guo, S. Comparison and evaluation of multiple GCMs, statistical downscaling and hydrological models in the study of climate change impacts on runoff. J. Hydrol. 2012, 434–435, 36–45. [Google Scholar] [CrossRef]
  10. Mizuta, R.; Yoshimura, H.; Murakami, H.; Matsueda, M.; Endo, H.; Ose, T.; Kamiguchi, K.; Hosaka, M.; Sugi, M.; Yukimoto, S.; et al. Climate simulations using the improved MRI-AGCM with 20-km grid. J. Meteor. Soc. 2012, 90A. [Google Scholar] [CrossRef]
  11. Linde, A.H.T.; Aerts, J.C.J.H.; Bakker, A.M.R.; Kwadijk, J.C.J. Simulating low probability peak discharges for the Rhine basin using resampled climate modeling data. Water. Resour. Res. 2010, 46, 1–19. [Google Scholar] [CrossRef]
  12. Kimura, N.; Chiang, S.; Wei, H.P.; Su, Y.F.; Chu, J.L.; Cheng, C.T.; Liou, J.J.; Chen, Y.M.; Lin, L.Y. Tsengwen reservoir watershed hydrological flood simulation under global climate change using the 20 km mesh meteorological research institute atmospheric general circulation model (MRI-AGCM). Terr. Atmos. Ocean. Sci. 2014, 25, 449–461. [Google Scholar] [CrossRef]
  13. Lenderink, G.; Ulden, A.V.B.; van den Hurk, B.; Keller, F. A study on combining global and regional climate model results for generating climate scenarios of temperature and precipitation for the Netherlands. Clim. Dyn. 2007, 29, 157–176. [Google Scholar] [CrossRef]
  14. Jones, R.; Murphy, J.; Hassell, D.; Taylor, R. Ensemble mean changes in a simulation of the European climate of 2071–2100: Using the New Hadley Centre Regional Climate Modelling System HadAM3H/HadRM3H. Available online: http://prudence.dmi.dk/public/publications/hadley_200208.pdf (accessed on 6 October 2005).
  15. Jones, C.G.; Willen, U.; Ullerstig, A.; Hansson, U. The Rossby Centre Regional Atmospheric Climate Model (RCA). Part I: Model Climatology and Performance for the Present Climate over Europe. Ambio 2004, 33, 199–210. [Google Scholar] [CrossRef] [PubMed]
  16. Giorgi, F.; Bi, X.; Pal, J. Means, trends and interannual variability in a regional climate change experiment over Europe. PartI: Present-Day Climate (1961–1990). Clim. Dyn. 2004, 22, 733–756. [Google Scholar] [CrossRef]
  17. Linde, A.H.T.; Aerts, J.C.J.H.; Kwadijk, J.C.J. Effectiveness of flood management strategies on peak discharges in the Rhine basin. J. Flood Risk Manag. 2010, 3, 248–269. [Google Scholar] [CrossRef]
  18. Delft Hydraulics SOBEK User Manuals; Deltares: Delft, The Netherlands, 2007.
  19. Burnash, R.J.C. The NWS River Forecast System—Catchment model. In Computer Models of Watershed Hydrology; Water Resources Publications: Littleton, CO, USA, 1995. [Google Scholar]
  20. Republic of China Ministry of Economic Affairs. Water Resources Agency (WRA) Calibration of Flood Forecasting Model and Review and Establishment of Warning Stages; Water Resources Agency report (2/2); Republic of China Ministry of Economic Affairs: Taipei, Taiwan, 2014. (In Chinese)
  21. Republic of China Ministry of Economic Affairs. Water Resources Agency (WRA) Operation Directions for Nanhua Reservoir; (2011 updated version); Republic of China Ministry of Economic Affairs: Taipei, Taiwan, 2004. (In Chinese)
  22. Chen, W.B.; Liu, W.C. Modeling Flood Inundation Induced by River Flow and Storm Surges over a River Basin. Water 2014, 6, 3182–3199. [Google Scholar] [CrossRef]
  23. Republic of China Ministry of Economic Affairs. Water Resources Agency (WRA) Operation Directions for Tsengwen Reservoir; (2014 updated version); Republic of China Ministry of Economic Affairs: Taipei, Taiwan, 2002. (In Chinese)
  24. Republic of China Ministry of Economic Affairs. Water Resources Agency (WRA) Operation Directions for Wusanto Reservoir; (2011 updated version); Republic of China Ministry of Economic Affairs: Taipei, Taiwan, 2008. (In Chinese)
  25. Tang, Y.; Reed, P.M.; Wagener, T. How effective and efficient are multiobjective evolutionary algorithms at hydrologic model calibration? Hydrol. Earth Syst. 2006, 10, 289–307. [Google Scholar] [CrossRef]
  26. Su, Y.F.; Cheng, C.T.; Liu, J.J.; Chen, Y.M. Bias correction of MRI-WRF dynamic downscaling datasets. Terr. Atmos. Ocean. Sci. 2015. Submitted. [Google Scholar]
  27. Yu, Y.C.; Lee, T.J.; Kung, C.Y. Disaster warning and scenario analysis in Typhoons and Heavy Rainfall events. NCDR Rep. 2014, 2014, 1–15. (In Chinese) [Google Scholar]
  28. Johnson, F.; Sharma, A. Accounting for interannual variability: A Comparison of Options for Water Resources Climate Change Impact Assessments. Water Resour. Res. 2011, 47. [Google Scholar] [CrossRef]
Figure 1. Conceptual scheme of the evaluation of the effects of climate change on river flow and water level.
Water 08 00081 g001
Figure 2. Conceptualization of the Sacramento model and parameters.
Water 08 00081 g002
Figure 3. Tsengwen River Basin.
Water 08 00081 g003
Figure 4. Rainfall hyetograph for the TOP1-20 extreme typhoon rainfall events during the three periods.
Water 08 00081 g004
Figure 5. Map of the Tsengwen River Basin rainfall stations and WRF grid points.
Water 08 00081 g005
Figure 6. Comparison between the estimated and observed results of the water level at the XinZong (1) water level station during Typhoon Kalmaegi.
Water 08 00081 g006
Figure 7. Comparison between the estimated and observed results of the water level at the XinZong (1) water level station during Typhoon Morakot.
Water 08 00081 g007
Figure 8. Comparison between the estimated and observed results of the water level at the XinZong (1) water level station for 0610 extreme rain.
Water 08 00081 g008
Figure 9. Discharge hydrographs for the TOP1-20 extreme typhoon events during the three periods at (a) XinZong (1); (b) Erxi Bridge; and (c) Yufeng Bridge.
Water 08 00081 g009
Figure 10. Water level hydrographs for the TOP1–20 extreme typhoon events during three periods at (a) XinZong (1); (b) Erxi Bridge; and (c) Yufeng Bridge.
Water 08 00081 g010
Table 1. Sacramento model parameters and their allowable ranges.
ParametersDescriptionAllowable Range
UZTWMCapacity of the upper tension water zone (mm)250–300
UZFWMCapacity of the upper free water zone (mm)240–300
UZKUpper zone lateral drainage rate (fraction of contents per day)0.2
PCTIMPermanent impervious fraction of the segment contiguous with stream channels0.02
ADIMPAdditional impervious fraction when all tension water requirements are met0.3–0.5
SARVAFraction of the segment covered by streams, lakes, and riparian vegetation0.01
ZPERCProportional increase in the percolation under saturated to dry conditions in the lower zone10–20
REXPExponent in the percolation equation, for determining the rate at which percolation demand changes from dry to wet conditions1.5–2.5
LZTWCapacity of the lower zone tension water storage (mm)210–330
LZFPMCapacity of the lower zone primary free water storage (mm)230–450
LZFSMCapacity of the lower zone supplemental free water storage (mm)200–340
LZPKDrainage rate of the lower zone primary free water storage (fraction of contents per day)0.004–0.04
LZSKDrainage rate of the lower zone supplemental free water storage (fraction of contents per day)0.06–0.14
PFREEFraction of percolated water that drains directly to the lower zone free water storage0.2
RSERVFraction of the lower zone free water storage that is unavailable for transpiration purposes0.3
SIDERatio of the unobserved to observed base flow0
SSOUTFixed rate of discharge lost during the total CF (mm/t)0
Table 2. Precipitation analysis of extreme events.
Typhoon EventsBase PeriodNear FutureEnd of This Century
(1979–2003)(2015–2039)(2075–2099)
No.(1)(2)(3)(4)(1)(2)(3)(4)(1)(2)(3)(4)
Top1851.4108.6491.3120548.2111.7420.3901027.8191.7722.148
Top2505.963268.490370132.3367.878738.2160.6572.566
Top3298.657.1247.390304.968.8296.366551.1200.4549.536
Top4295.758.7223.160344.364.2295.860534.684.8433.2132
Top5248.855.722266288.3117.0280.967677.0154.3430.148
Top6194.873.5192.67822739.6197.290407.5135.9404.966
Top7174.875.7164.442197.747.0183.342503.094.2394.7102
Top8149.168147.642171.955.5162.772475.791.2366.648
Top9242.536.3141.848167.540.3158.272484.897.2359.942
Top10132.4117.1131.896218.128.2149.948344.963.9283.448
Top11153.431.0123.054156.933.7145.948338.392.0268.254
Top12112.9106.0112.948295.227.1145.7150328.082.2250.842
Top13104.389.698.772147.962.7143.372258.061.9219.666
Top1495.695.695.6108225.432.7133.442259.779.0203.642
Top1592.190.692.184122.256.7121.866201.194.6195.454
Top1688.688.688.624120.828.7120.284239.043.6191.872
Top1785.777.785.730112.237.3106.860306.842.7186.160
Top1891.852.785.354110.937.3106.878290.157.3173.730
Top1975.275.275.24898.542.698.130190.828.6147.148
Top2067.534.837.013876.523.674.84268.721.566.878
Typhoon Morakot1007.5144.3636.272
(1) Total precipitation (mm); (2) Maximum of 3 h; (3) Maximum of 24 h; (4) Total duration (h).
Table 3. Design discharge and water level.
Gauge StationReturn Period (Years)Design Discharge (cm)Design Stage (m)* Historical Maximum Stage (m)
XinZong (1)100989015.7118.36
Erxi Bridge874021.3723.56
Yufeng Bridge690046.0646.98
* occurred during typhoon Morakot.
Table 4. Calibrated and verified results.
ItemTyphoon Events C E E L P E T P (h)
CalibratedKalmaegi(2008)0.8−1.31−2
Morakot(2009)0.94.75−1
Verified0610 Extreme rain (2009)0.9−1.660
Table 5. Water levels exceeding the design stage during extreme typhoon events.
Water Level StationDesign Water Level (m)
Base Period (88)Future (82)End of Century (81)
XinZong (1)2610
Erxi Bridge3612
Yufeng Bridge118

