
Controlling River Eutrophication under Conflicts of Interests—A GIS Modeling Approach

MTA-BME Water Research Group, Hungarian Academy of Sciences, Muegyetem rkp. 3, Budapest H-1111, Hungary
Water 2015, 7(9), 5078-5090; https://doi.org/10.3390/w7095078
Submission received: 11 August 2015
/
Revised: 26 August 2015
/
Accepted: 2 September 2015
/
Published: 18 September 2015
Abstract
:Stream networks are highly complex systems, in which spatially complicated and temporally varying water quality patterns develop. River eutrophication is underlain by nutrient inputs across the entire stream network and is controlled by many interacting factors in an ever moving and renewing medium. These complex features must be perceived as a whole entity to control river eutrophication. The Szamos River is one of the largest tributaries of the Tisza River in Eastern Europe. It delivers high loads of nutrients and algal biomass and fundamentally influences the hydro-morphological, chemical and ecological status of the Tisza River. To improve the ecological status of the recipient river, nutrient and phytoplankton inputs from the tributary should be controlled, yet the two rivers belong to different countries, which are reluctant to harmonize management plans. This study aims at modeling trophic status of the tributary with the PhosFate nutrient emission model to outline a set of management measures that would satisfy both countries. Four management alternatives are analysed with altered landuse patterns, and management options. Each of these alternatives is evaluated against the present conditions.
1. Introduction
Stream networks are highly complex systems, in which spatially and temporally varying water quality patterns develop. While lake eutrophication can be successfully managed based on well established relationships between algal biomass and loads of limiting nutrients, usually phosphorus [1], a similar relationship does not seem to be universally valid in rivers. Although most algal genera in rivers are also represented in lakes [2], there is a fundamental difference in the physicochemical environment that selects for different species in these two types of aquatic habitats [3]. This results in a significant difference in the relative abundance of various species.
While coordinates of time and space are separated in a standing water body (i.e., there is no predefined path of water movement), there are trajectories of flow in stream networks that transport entrained algae through different environmental gradients. Although water residence time in large river basins is comparable to some lakes and reservoirs (weeks to months; [4]), the algae spend this period with a journey through immense variations in the physical environment. In small and medium sized rivers the available timeframe for in-stream development is shorter (usually below a few days), which means a brief but diverse trip for the phytoplankton. Therefore, small, rapidly growing, opportunistic species—often diatoms—dominate the phytoplankton community in free-flowing rivers [2,5]. Growth limitation quickly varies by location and period, as determined by the complex interaction of external boundary conditions and the topology of the stream network. The specific features of individual stream networks must be assessed to successfully manage river eutrophication. Besides all the natural intricacy, management has to consider the socio-economical objectives as well, which is especially difficult when multiple authorities govern different parts of the stream network.
The Szamos River (in Romanian: Someş) is one of the largest tributaries of the Tisza River. Of the catchment of 15,700 km2, 98% belongs to Romania, the rest to Hungary. Pluriannual mean discharge is 120 m3·s−1 at the mouth. The Szamos River delivers relatively high nutrient loads and algal biomass. Phytoplankton export from this river causes a disruption in the trophic profile of the Tisza River [6,7]. This, in turn, can be assumed to drastically alter the structure and functioning of the whole trophic network along the Hungarian Tisza River. To improve the ecological status of the Tisza River, nutrient and phytoplankton inputs from the Szamos River should be controlled. Yet, the two countries (Romania and Hungary) are reluctant to harmonize their management plans, probably due to their radically different interests. Romania cares most about the infrastructural development in the Szamos catchment, while Hungary cares most about water quality in the Tisza River. The present study aims at outlining a set of management measures that would result in a significant improvement in terms of both objectives using a GIS-based modeling approach. The procedure can be considered as a blueprint for designing river eutrophication control under conflict of interests among countries or different provincial authorities sharing the same river system.
2. Experimental Section
2.1. Measurements
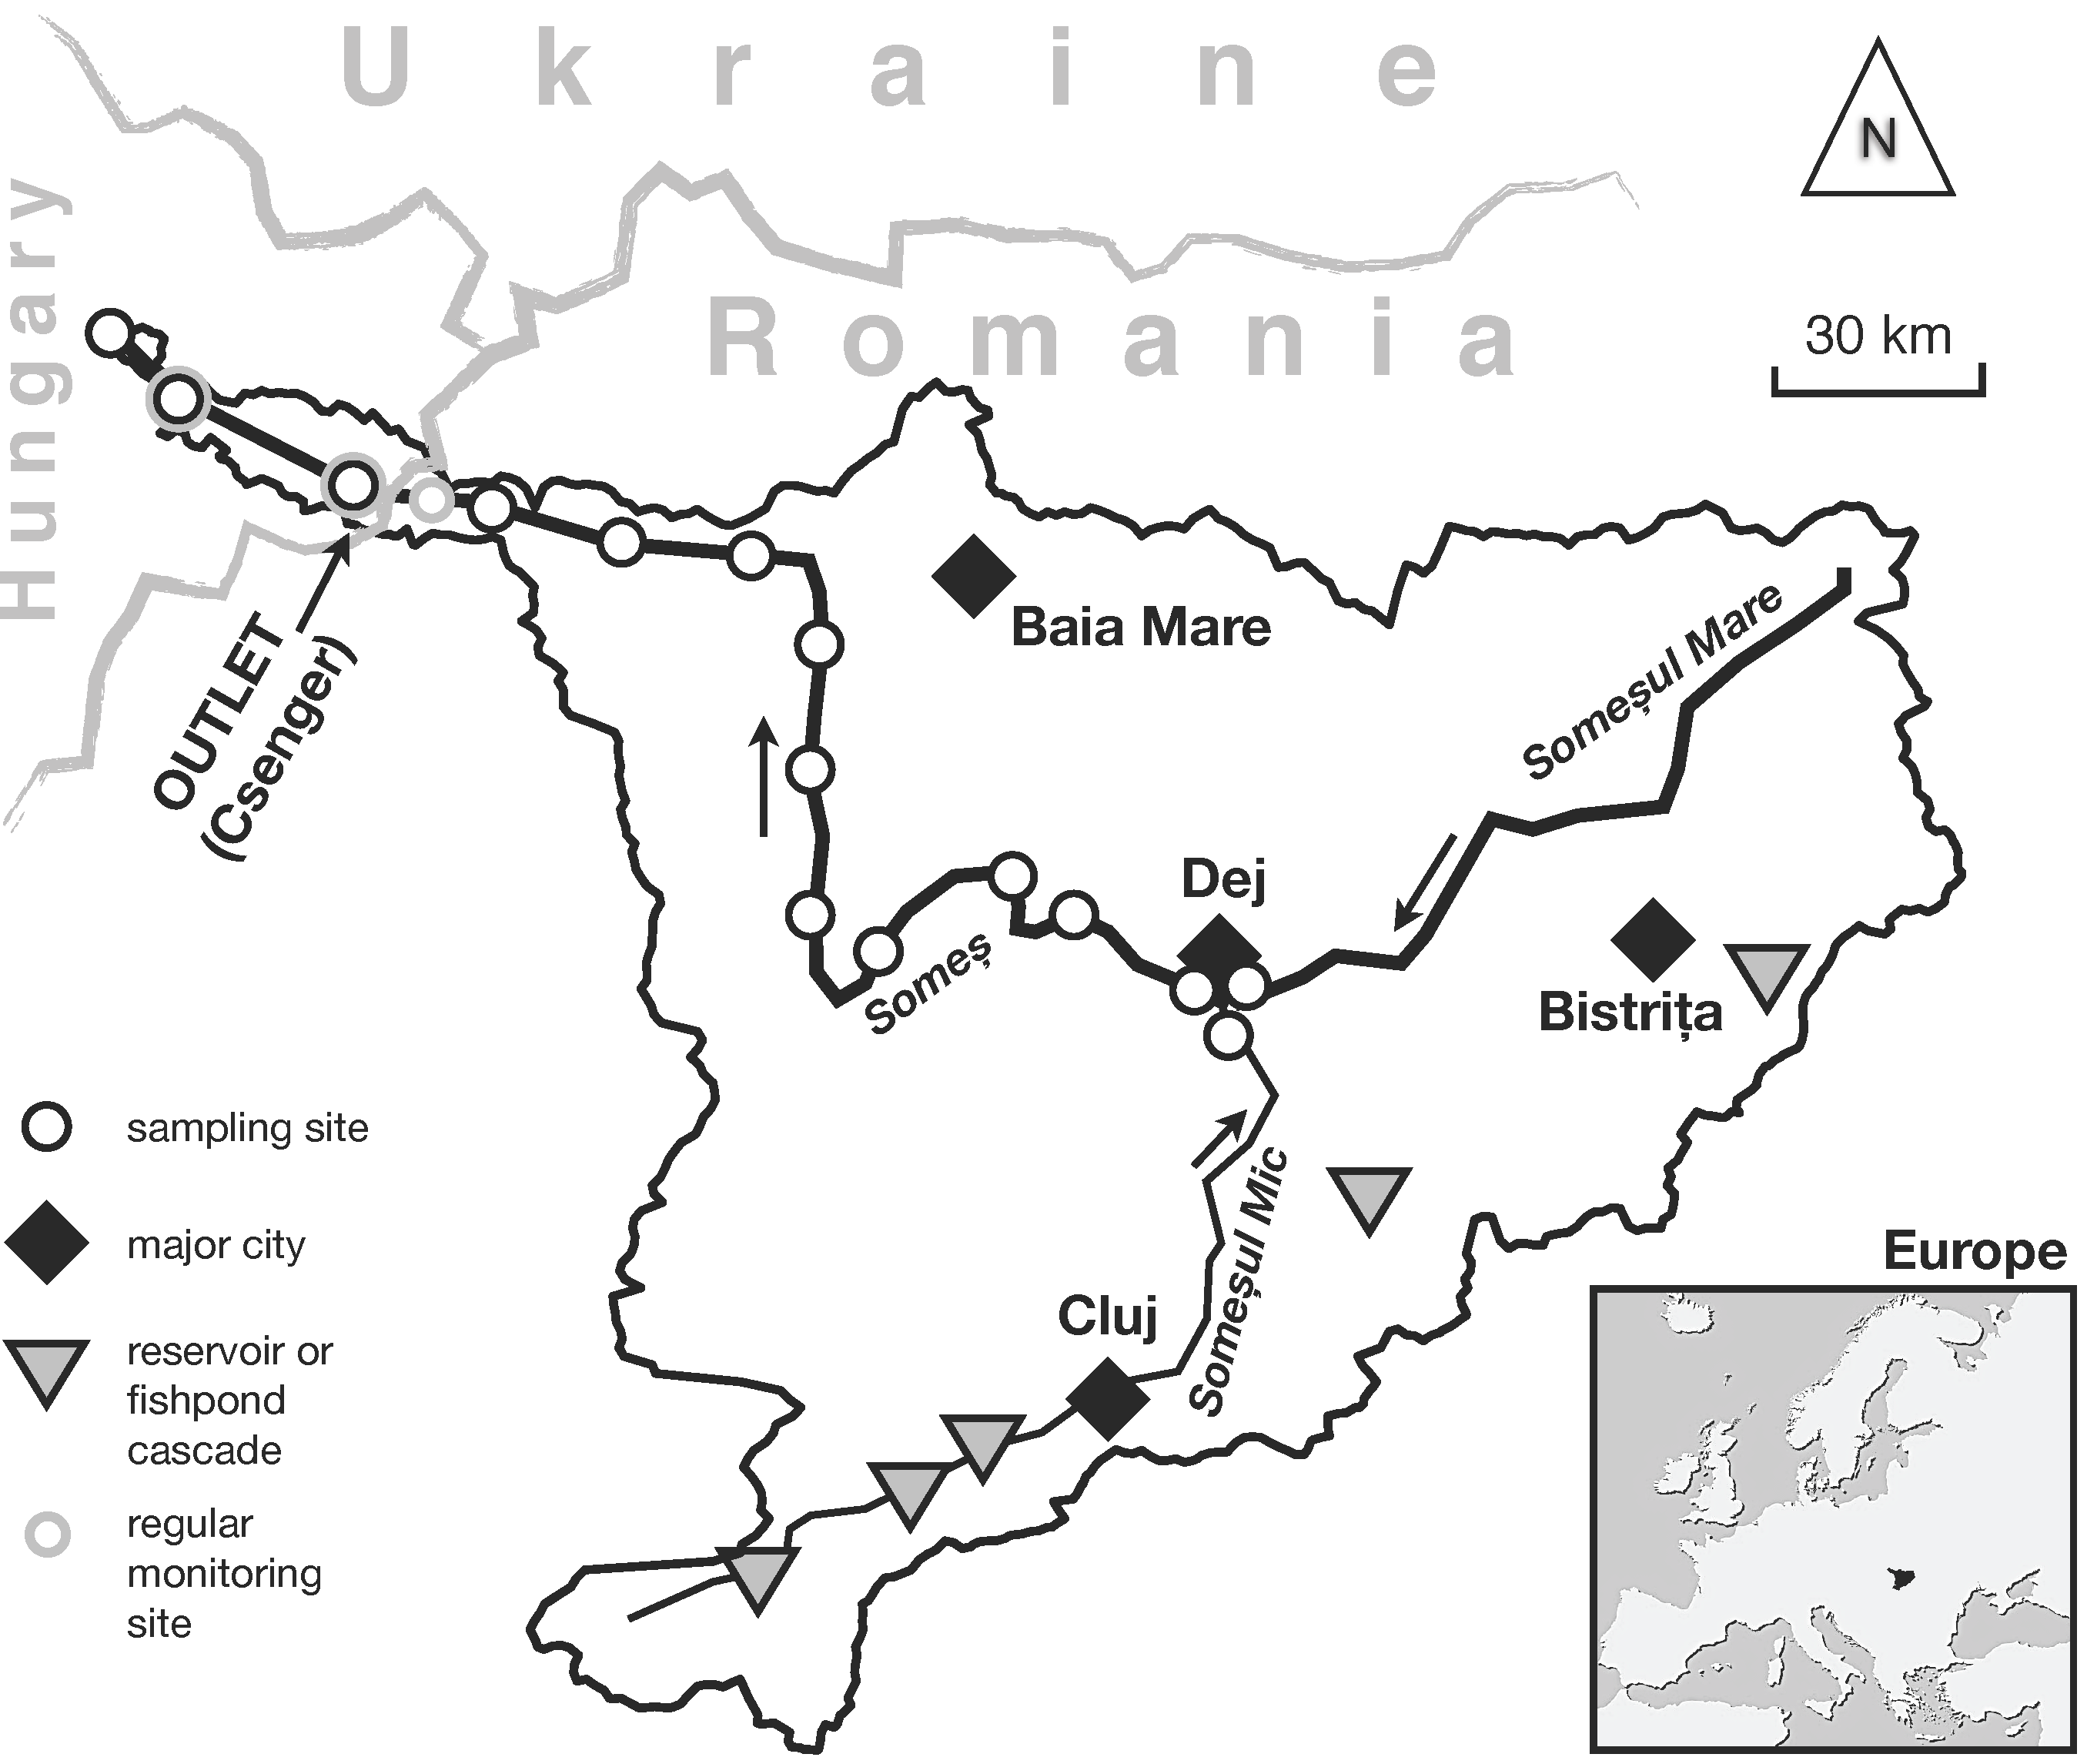
Systematic biweekly to monthly water quality data were available at three sites in the Szamos River (51, 46.4, and 21.9 river km) in the period 1987–2012 from the National Water Quality Database of Hungary (Figure 1). Since discharge was measured only at the city of Csenger (46.4 river km), this site was considered to represent the outlet of the Szamos River catchment (Figure 1).
Figure 1.
The Szamos/Someş catchment with major cities, standing waters and the 15 sampling locations. The discharge gauge at the city of Csenger was considered as the catchment outlet for this study.
Figure 1.
The Szamos/Someş catchment with major cities, standing waters and the 15 sampling locations. The discharge gauge at the city of Csenger was considered as the catchment outlet for this study.

Discharge-weighted river loads of dissolved P (DP), particulate P (PP), and dissolved inorganic N (DIN) were computed using daily mean discharge data. Since total dissolved P was not measured, soluble reactive P was taken equal to DP and PP was calculated as the difference of total P and DP. DIN was the sum of ammonium-N, nitrite-N and nitrate-N. River load of suspended solids (SS, (g·m−3)) and chlorophyll-a (Chl, (mg Chl·m−3)) was calculated similar to that of nutrients.
Phytoplankton biomass was characterized by mean summer concentration of Chl along the Szamos River in 2012 based on [7]. Summer mean concentrations were calculated based on the biweekly concentrations measured from 11 April to 16 October 2012 at 13 sites of the Szamos River between Dej and the confluence, as well as in the two main branches upstream of Dej, the Someşul Mare and Someşul Mic Rivers (Figure 1; [7]).
2.2. Catchment Model
Due to the importance of spatial variability of river eutrophication, river basin management planning has to be based on tools that operate with as high spatial resolution as possible. This is crucial for both the high-fidelity reproduction of existing eutrophication patterns and the ability to simulate the impacts of management measures that act at a local scale.
The PhosFate model was used to calculate nutrient emissions and transport in the catchment. PhosFate is a catchment-scale phosphorus emission model [8,9]. It has been developed to support decision-making in catchment management. The model allows for planning and evaluating the impact of best management practices on phosphorus loads using the critical source area concept. PhosFate is a semi-empirical, long-term average, distributed parameter model. It computes the main elements of the hydrologic cycle, local soil erosion and the associated mobilization of phosphorus, soil and phosphorus transport in the terrestrial areas and throughout the stream network. The model has been validated in several types of Central European catchments, the size of which ranged from a few km2 to several thousands of km2 [6,8,10,11]. Model applications showed good performance in both arid and wet regions.
The overarching model concept is to represent spatial heterogeneity of the catchment by linking homogeneous, small-sized elementary cells that bear a series of individual properties. Cell size is adjusted to the spatial resolution of the available input data and is preferably 100 × 100 m or less. Rates of soil loss and P emission are computed independently for every single cell. Then the individual cells are connected by the flow-tree and cumulative transport is calculated with an explicit routing using mass balance equations that include the retention of soils/sediments and PP. A linear P partitioning is assumed between solid and dissolved phases in the soils, and in surface runoff. Diffuse DP load is transported to waterbodies by both surface runoff and baseflow. Point emissions are introduced directly into the watercourses that emerge as a result of flow accumulation and routing. Mass balance equations describe in-stream transport of the suspended load and PP.
PhosFate includes an optimization algorithm that iteratively finds critical source and transport areas to minimize diffuse phosphorus output from the catchment at the lowest spatial extent of interventions. For the purpose of the present work, a variety of PhosFate was used that possessed an algal growth and a simple dissolved nitrogen emission and transport module [7]. Algal growth was characterised by a net growth rate including all possible factors affecting the growth rate of phytoplankton except nutrient limitation. Thus, underwater light availability, grazing were considered implicitly in the calibrated growth rate.
2.3. Agricultural Nutrient Balance
The PhosFate model calculates diffuse particulate P (PP) emission from elementary cells as the product of soil loss and P content of surface soils. Thus, the nutrient status of agricultural soils is a direct modelling input. In previous applications of PhosFate [9,10,11], this input was accumulated from annual agricultural P surpluses/deficits estimated from statistical data (mineral fertilizers and manure, harvest) over the past 50 years. This approach, however, had several shortcomings [12]. First, long-term accumulation may seriously overestimate present nutrient status of soils since transformations between active and inactive P forms, as well as nutrient loss from soils are neglected. Second, constant specific nutrient content in manure and in harvested crops may be misleading when substantial changes occur in the nutrient status of agricultural soils, since both plants and animals adapt their nutrient use efficiencies to nutrient availability in a considerably wide range [13]. Third, 50 years long statistical series are typically available at very low spatial resolution. Downscaling these data to finer scales would require a lot of additional information. Considering these difficulties, the agricultural nutrient balance of P (kg P ha−1·year−1) and N (kg N ha−1·year−1) was estimated for only the past decade. The modified approach does not fully eliminate the shortcomings of the original PhosFate methodology but efficiently decreases its bias.
Agricultural nutrient budgets (ANBs) were computed as the sum of manure and mineral fertilizer application, in-field excretion by grazing livestock, N2 fixation, and nutrient removal by grazing and harvest. Other components have been neglected either because of their negligible overall impact or insufficient data availability.
2.4. Management Alternatives
Four management alternatives were analyzed with altered landuse patterns and management options. Each of these alternatives was evaluated against the current conditions (Scenario PRESENT; Table 1).

| Alternative | Landuse | Management |
|---|---|---|
| PRESENT | As today | As today |
| BIOGEOCHEMICAL BACKGROUND | Natural vegetation | Soil nutrient level is set to background; no point sources; no reservoirs |
| SOCIETAL BACKGROUND | As today | Soil nutrient level is set to background; no point sources; no reservoirs |
| RBMP | As today | Sewer network and WWTP development according to RBMP Someş-Tisa; status to be achieved by 2018 |
| BAT-BMP | Optimized landuse conversions | Best available technology in 9 WWTPs; no sewer network or WWTP development in other settlements |
Scenario BIOGEOCHEMICAL BACKGROUND was free of any human impact. There were no point emissions and reservoirs; soil nutrient levels were at the background level (that is, they were calculated from the (present) clay and humus content of the topsoils). Present grasslands were forested with the appropriate type of trees (deciduous, coniferous or mixed), present arable land was converted to grassland. This scenario provided the natural outputs (nutrient loads and phytoplankton biomass) from the catchment.
Scenario SOCIETAL BACKGROUND delimited the reference condition, below which nutrient emissions cannot be reduced in the presence of humans. This alternative assumed extensive agriculture and a lack of point-source pollution. The only difference from BIOGEOCHEMICAL BACKGROUND was that the present landuse structure was assumed to prevail.
Two management options were considered. Scenario RBMP was based on the middle-term (2018) sewer network and WWTP development plan outlined in the “River Basin Management Plan of the Someş-Tisa” [14]. When the technology of future WWTPs was not given, biological treatment was assumed. P and N removal efficiencies were set to 25% TP and 15% TN [15]. Where enhanced sewage treatment was planned with additional N removal, efficiencies were increased to 30% TP and 40% TN based on the existing Cluj-Napoca plant [16].
Scenario BAT-BMP introduces the best available wastewater treatment technology in the 9 largest WWTPs of the RBMP alternative. Sewer development is needed in the operation area of these WWTPs as outlined by Apele Romane (2009). No change was assumed compared to the present situation in the rest of the settlements. Removal efficiencies in BAT were set to 95% TP and 85% TN [15]. Besides controlling municipal nutrient emissions, Scenario BAT-BMP included the control of diffuse emissions via optimized landuse conversions (Best Management Practices) designed by the optimization algorithm of the PhosFate model.
3. Results and Discussion
3.1. Present Water Quality
Nutrient loads delivered by the Szamos River were relatively low in a European comparison [17], thanks to the low population density (88 inhabitants km−2) and dominantly extensive agriculture. Yet, the loads delivered by the Upper Tisza River were even lower by 25%–30%, although the catchments of the two rivers are neighbouring and have similar landuse patterns. Therefore the medium-term (10–15 years) management objective should be a 25%–30% reduction in nutrient loads delivered by the Szamos River to the Tisza River. Easily controllable point sources were responsible for 60% of N and 80% of P loads in the Szamos catchment. This high share of point emissions was due to inefficient management of municipal wastewater and to the high number of industrialized animal farms (poultry, pig) that were usually deployed close larger rivers without proper effluent treatment.
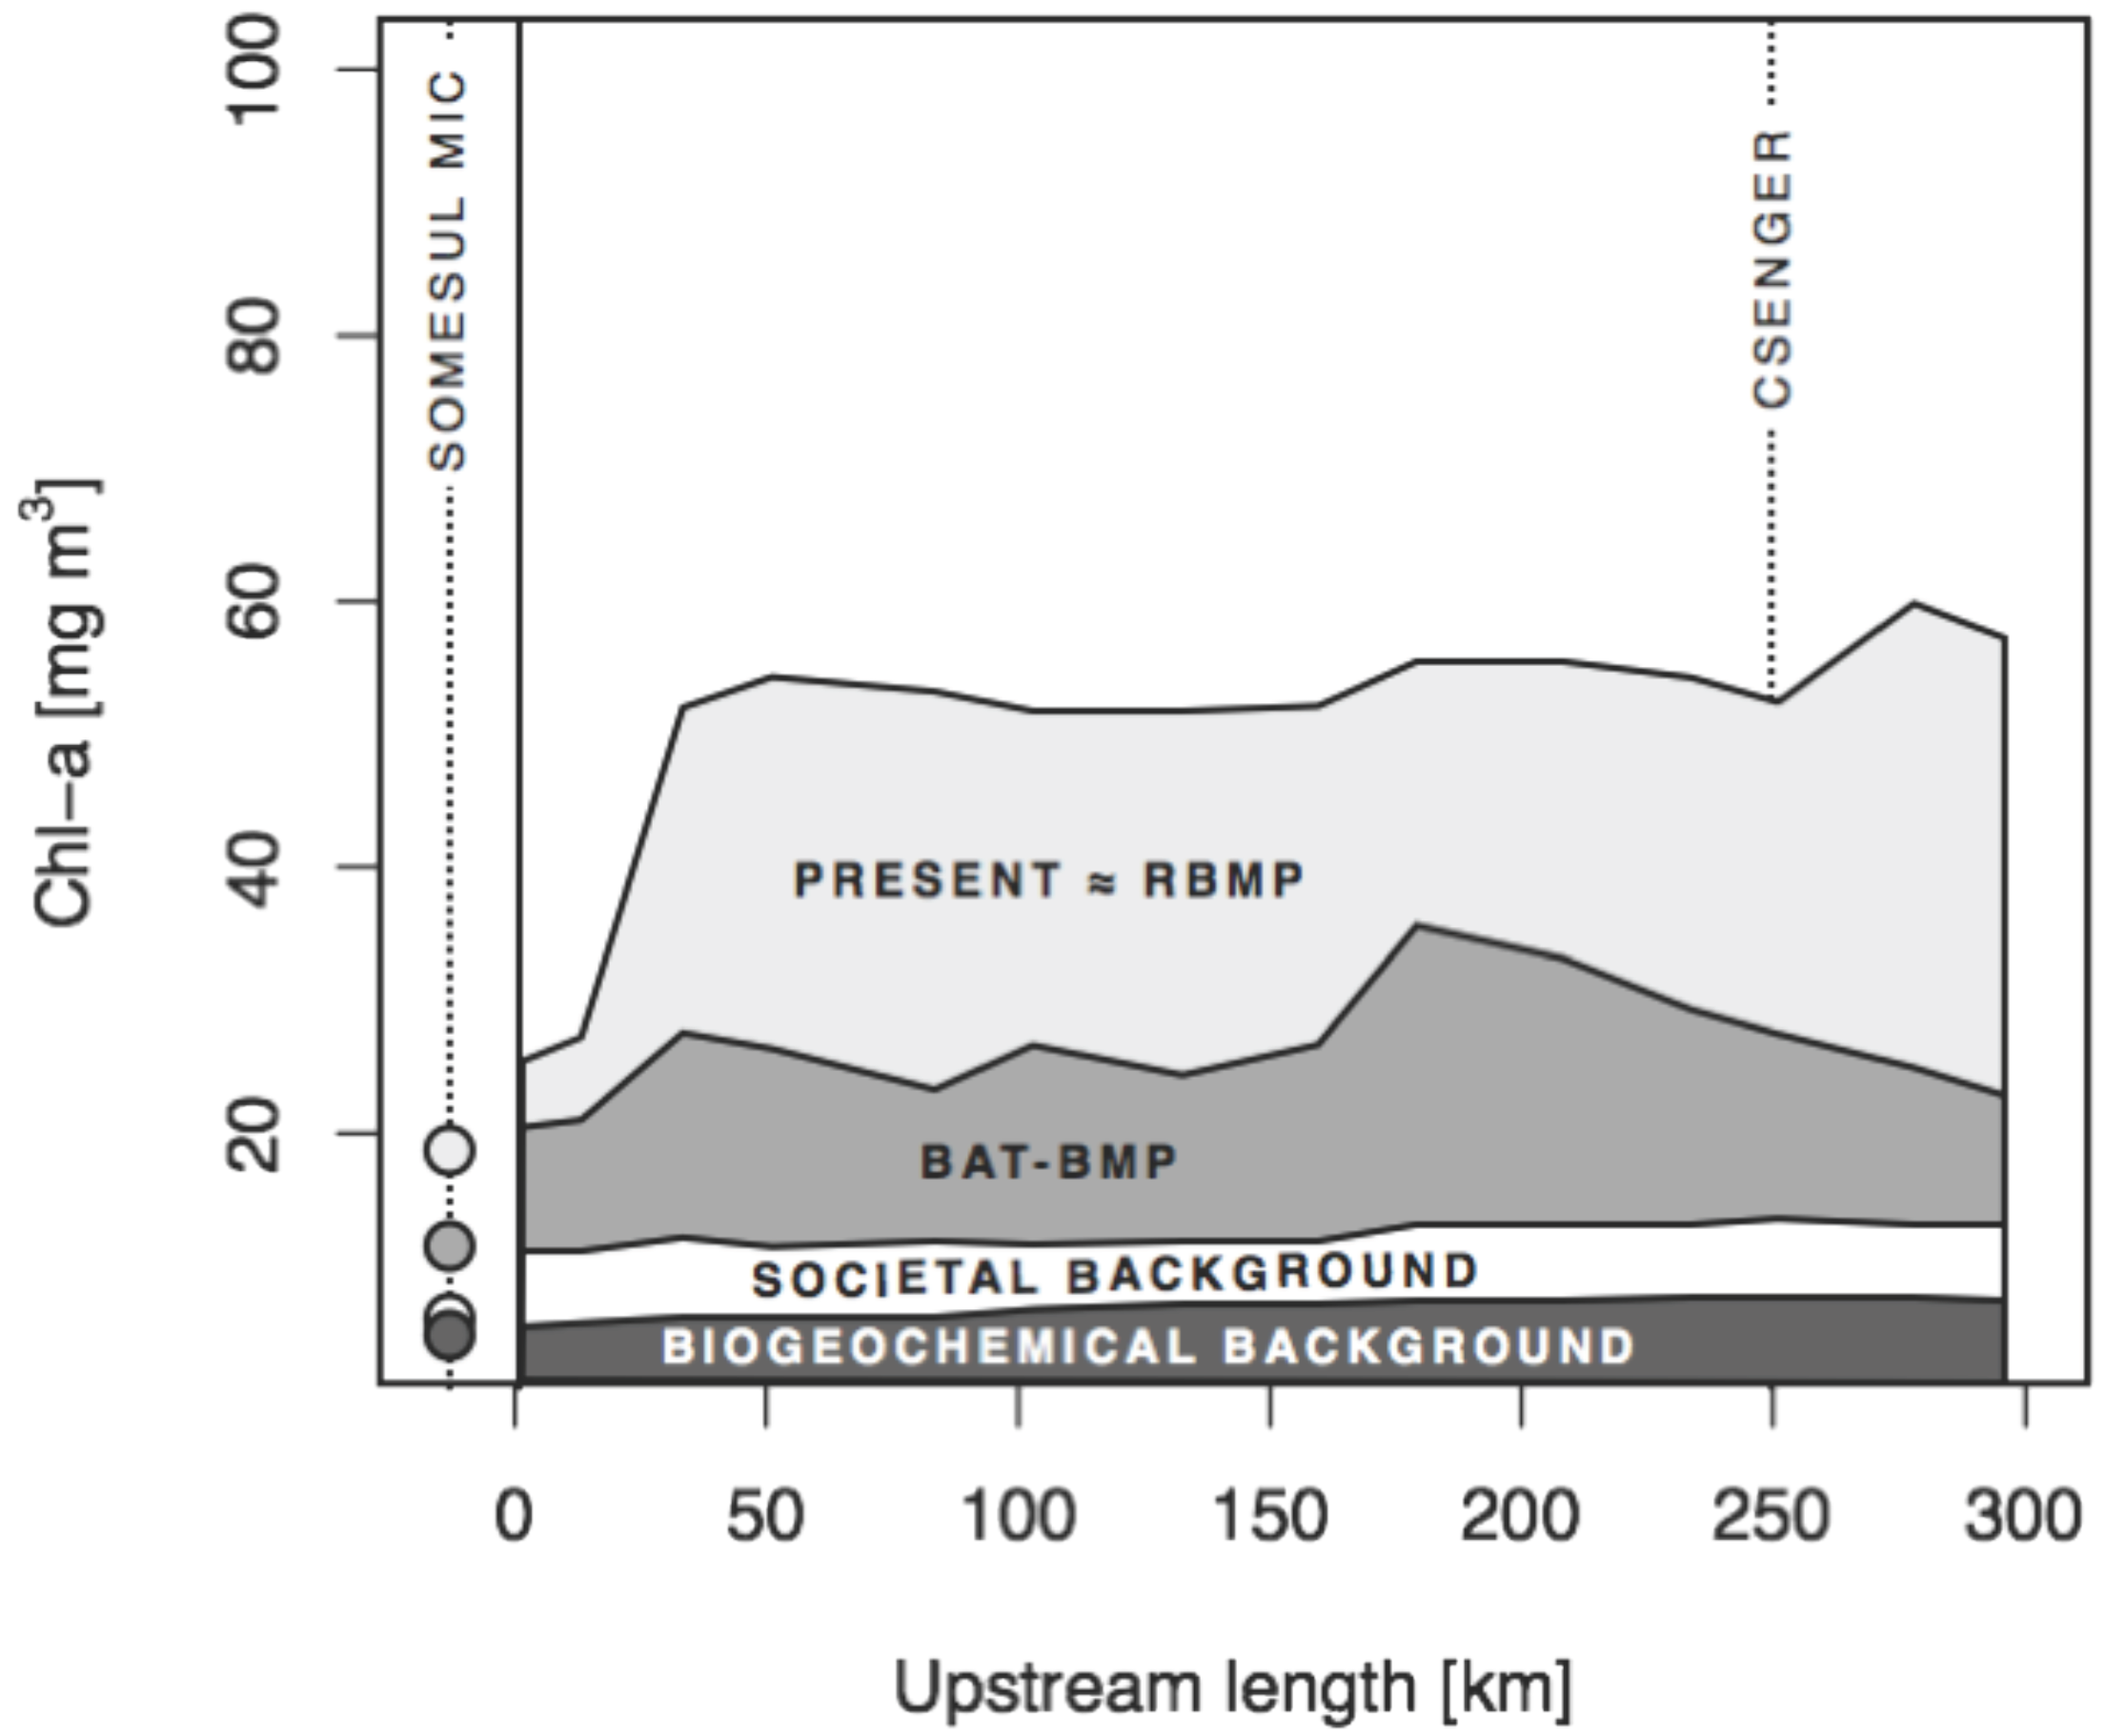
Figure 2.
Observed and simulated summer mean Chl profiles along the Szamos River. Closed circles: observed in the extremely dry year of 2012. Grey region: simulated long-term summer mean; Dotted line: simulated mean for 2012; “Upstream length” is 0 km at the city of Dej and maximal at the confluence with River Tisza.

While nutrient loads were moderate, summer algal growth was fast in the main channel (Figure 2). This was explained by the almost pristine hydromorphology of the upper two thirds of the Szamos River. The unregulated channel provided a diverse array of habitats with highly variable depths and flow velocities. Meroplanktonic diatoms, which dominated the phytoplankton downstream of Dej in the summer, escape rapid washout by temporarily settling to the well-illuminated bottom along the extended shallow areas of the channel [7]. Thus, advanced eutrophication paradoxically indicated the high ecological potential of the Szamos River. After the initial fast growth downstream of Dej, mean summer algal biomass remained high along most of the sections to the catchment outlet, except for a temporary drop from km 200 to 250 (Figure 2). The drop may have been caused by the toxic pollution delivered by a tributary coming from the mines and industries of Baia Mare, but precise reasons are still unknown [12].
3.2. Agricultural Nutrient Balance
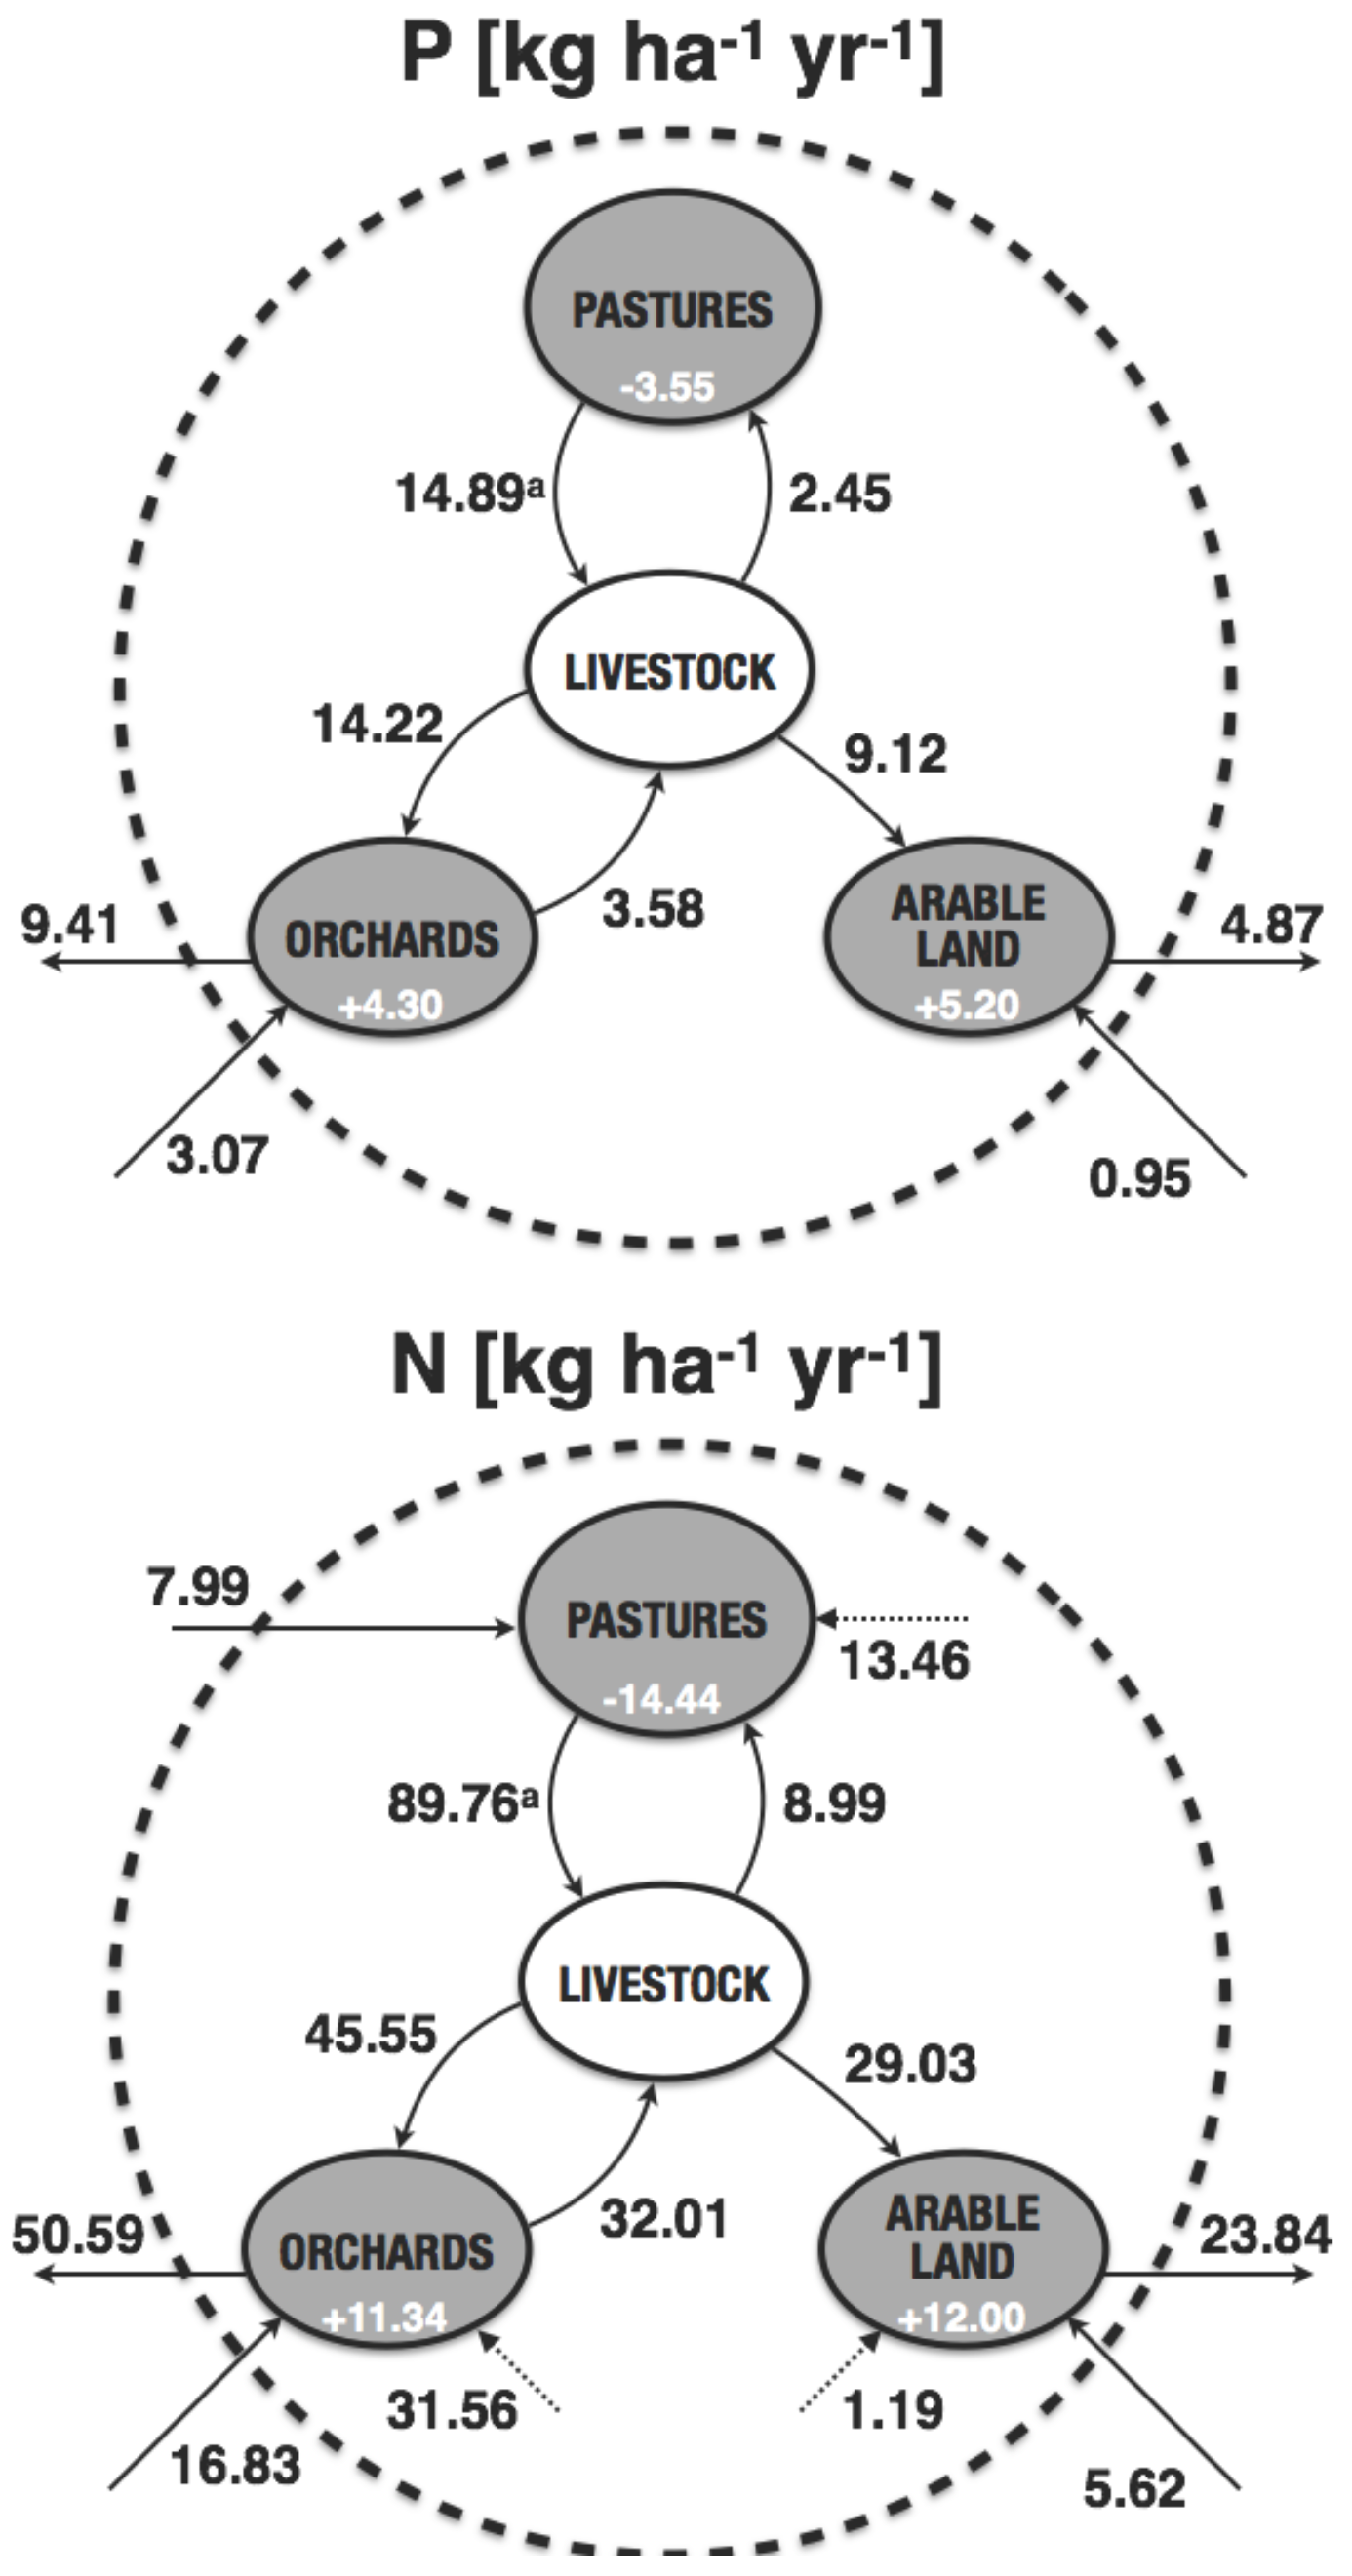
Balanced fertilization dominated in arable land and plantations in the Szamos catchment; 77.5% of arable land and 56.1% of plantations belonged to this category. Simultaneously, 91.5% of grasslands were estimated to loose nutrients (insufficient fertilization). As a whole, 793,102 ha of agricultural land (89% of total) experienced insufficient or balanced nutrient supply. Over-fertilization was estimated only in 40,529 ha, equivalent to 4.5% of total agricultural area. This strongly contrasted many other regions of the World where the agro-economic boom is characterized by increasing yields and steady nutrient surpluses [18].
Under the present economic constraints, a basically closed regional nutrient cycling was the key feature of agricultural production in the Szamos catchment (Figure 3). The close to zero overall nutrient balance would, however, be unsustainable since the nutrient supply in arable land and plantations was maintained by nutrient withdrawal from grasslands.
Figure 3.
Long-term annual mean agricultural budgets in the Szamos/Someş catchment. a—half of yield is supported by natural nutrient supply of soils. An internal utilization of fodder crops and an export of other arable crops is assumed. Arrows pointing into the circle indicate the import of mineral fertilizers; dotted arrows denote N2 fixation).

3.3. Catchment Modeling
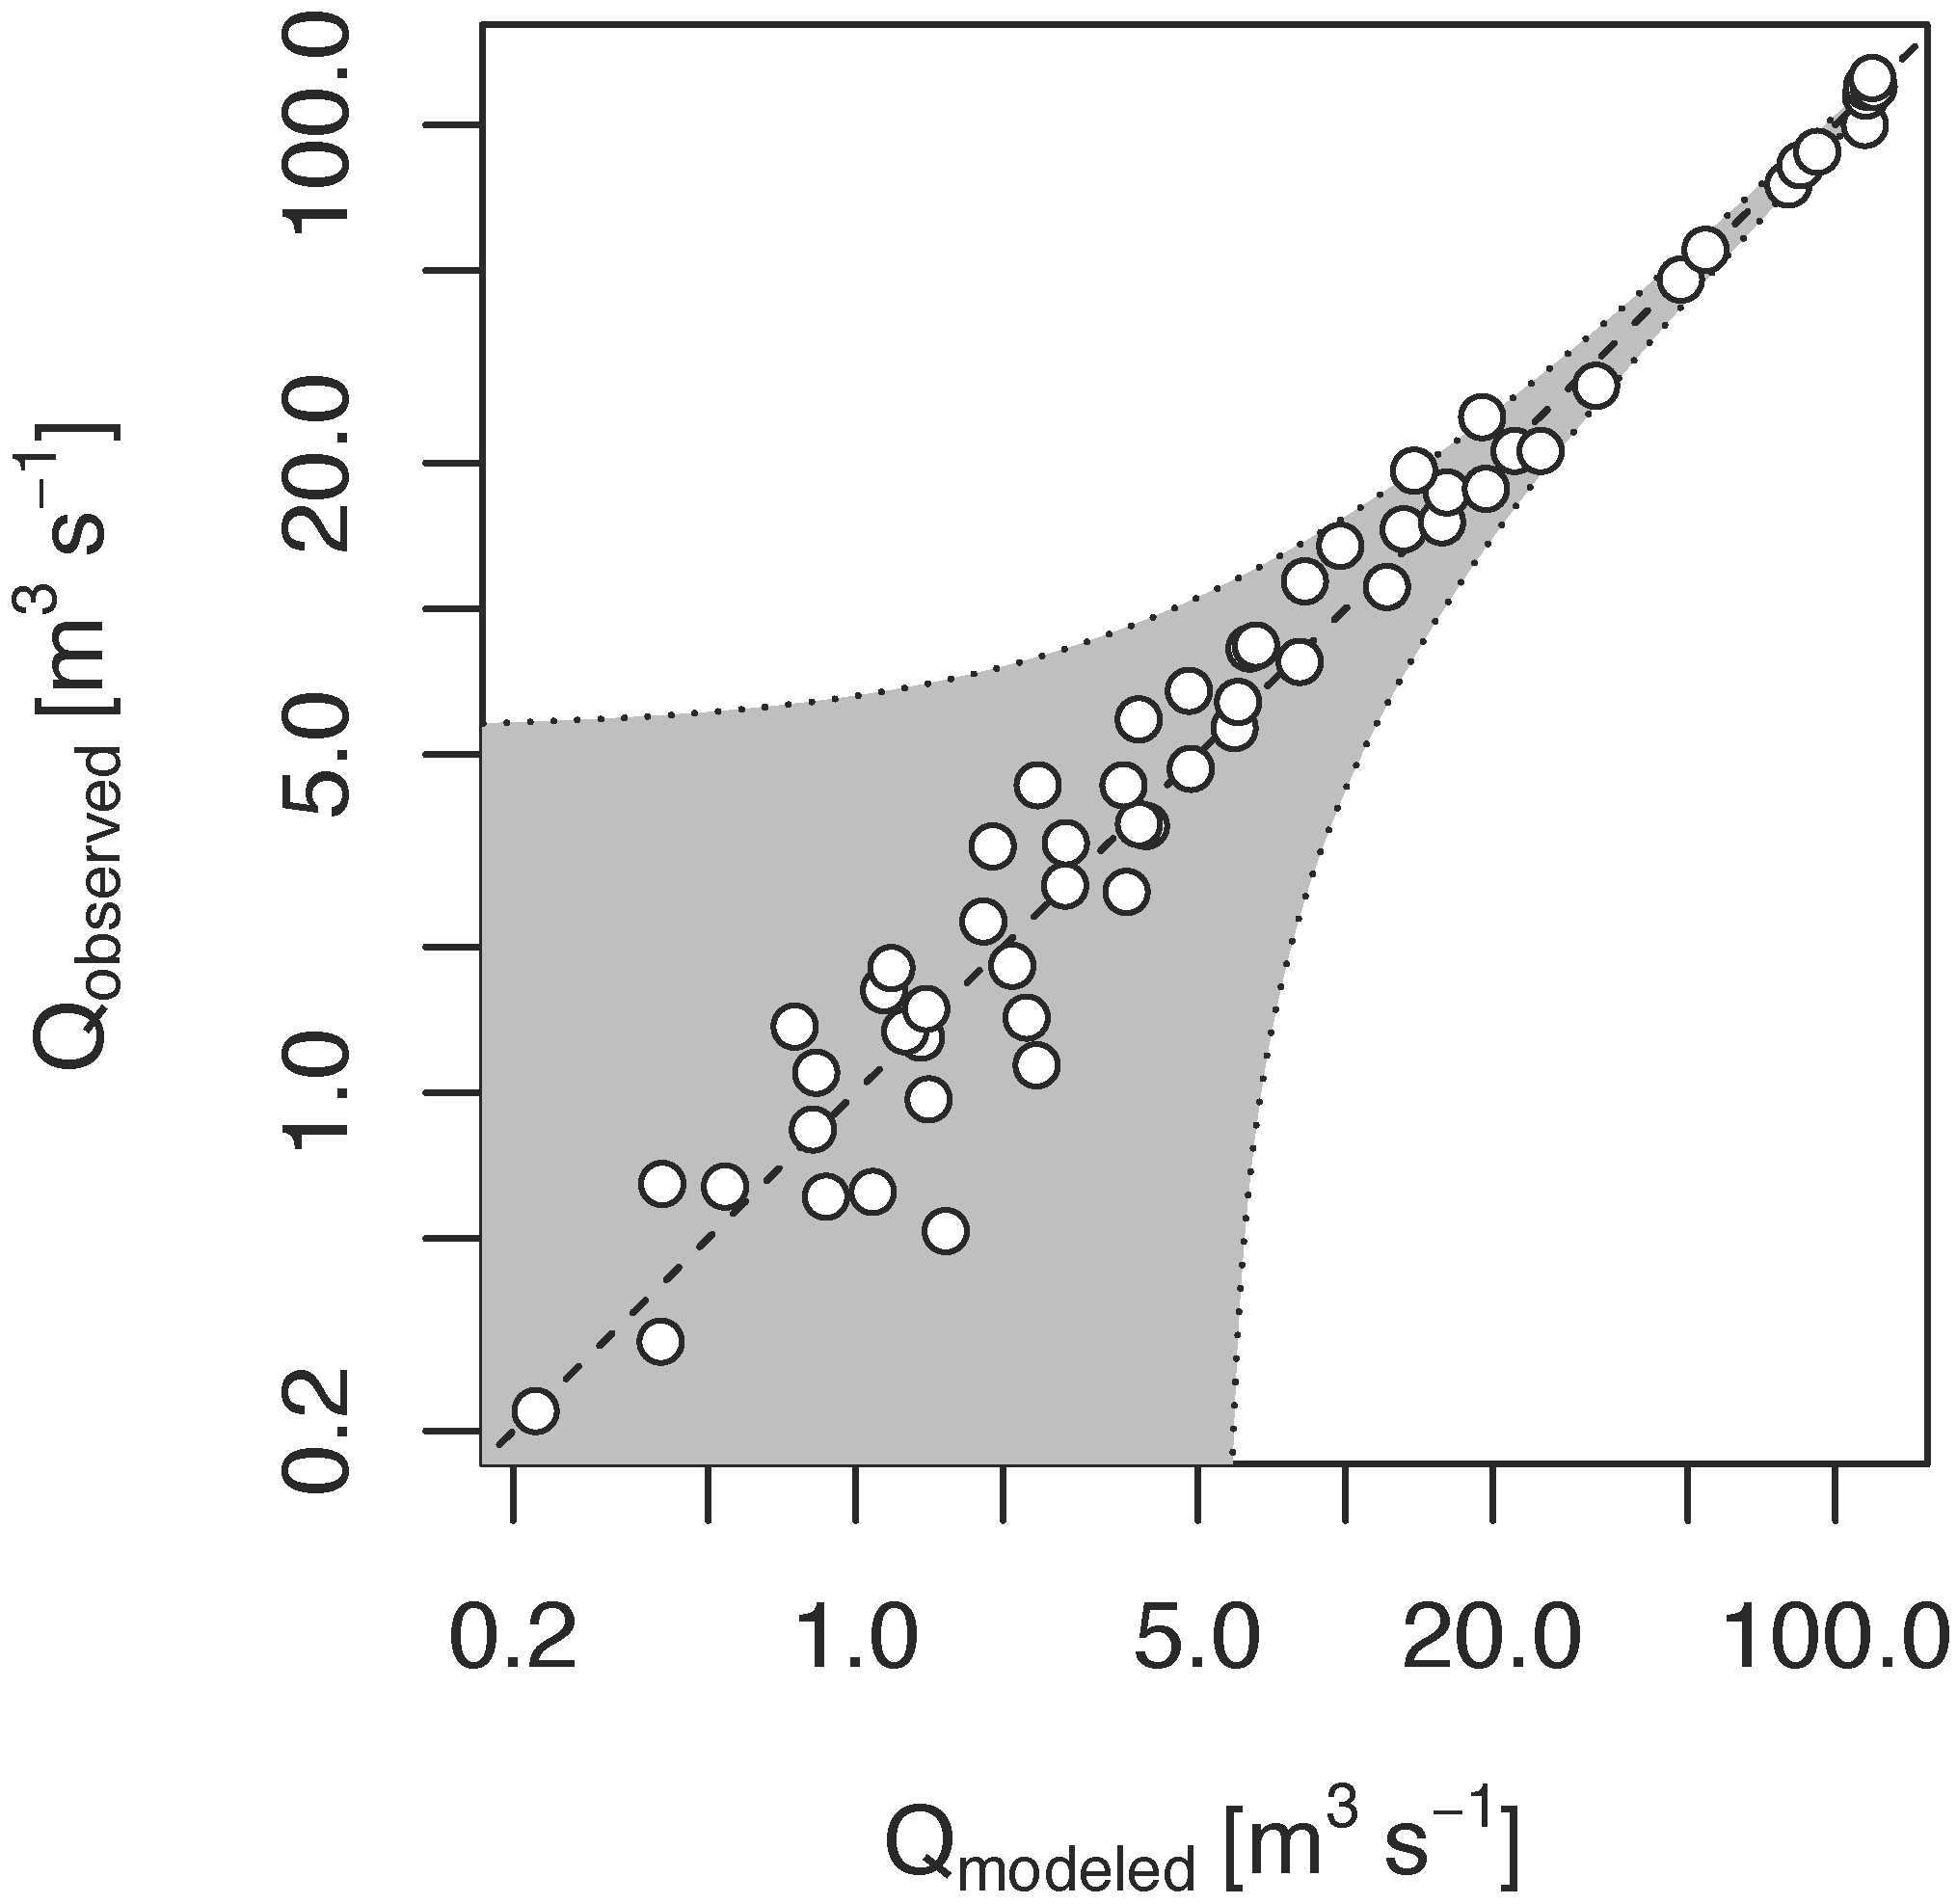
The delineated catchment area of the Szamos River showed an almost perfect agreement with the catchment map of Apele Romane (2009). The length of streams totalled at 10,631 km in the area of 15,650 km2, resulting in a modelled stream density of 0.68 km·km−2. Mean annual discharge agreed reasonably with the observations [14] (Figure 4). The relative error of the model results was significantly higher for smaller streams than for larger ones.
Figure 4.
Comparison of observed and modeled mean annual discharges at different gauging sites in the stream network. (Regression: Qobserved = 0.99 × Qmodeled, r2 = 0.99, N = 59. Shaded area is the 95% confidence band. Note that both scales are logarithmic).
Figure 4.
Comparison of observed and modeled mean annual discharges at different gauging sites in the stream network. (Regression: Qobserved = 0.99 × Qmodeled, r2 = 0.99, N = 59. Shaded area is the 95% confidence band. Note that both scales are logarithmic).

Annual rate of soil loss ranged from 0.01 to 390 t ha−1·year−1. Variability through many orders of magnitude is a widely observed feature of erosion. This huge variability is the basis for the common catchment management practice that aims at identifying and controlling erosive hotspots. Hotspots occupy only a negligible portion of a catchment, yet they are responsible for the bulk of sediment and diffuse nutrient loads [19]. The average rate of soil loss was 9.1 t ha−1·year−1 across the entire Szamos catchment. This converted into a soil loss of 14.2 million tons or into the loss of a 0.48 mm thick soil layer annually, assuming the specific density of soil particles (2.7 t·m−3) and a mean porosity of 30%. This average soil loss fell into the tolerable range [20].
Estimated sediment flux agreed reasonably with the observed flux at the outlet of the Szamos catchment. The adjusted retention constants were kSS,t = 8×10⁻⁴·s−1 during overland flow and kSS,ch = 8×10⁻⁶·s−1 during in-stream transport. Only a small fraction of total soil loss was delivered to the catchment outlet (delivery ratio was 1:13). The adjusted deposition rate of the SS flux also applied to the PP flux. Simulated annual PP load (451 t P·year−1) fitted well to the observed load at the outle (444 t P·year−1).
Loss constants of DP and DIN during river transport were calibrated from the estimated point emissions and summer fluxes of these nutrient forms at the outlet. The adjusted constant for DP loss excluding phytoplankton uptake was kloss,DP = 8.4×10⁻⁶·m−1. Since travel velocity showed little variability around an average value of about 1 m·s−1 in the bulk of the stream network, the loss rate of DP was almost identical to the deposition rate of PP (and SS) during in-stream transport. While the retention mechanisms are different for DP (adsorption by sediments and/or uptake by benthic microorganisms) and PP (net settling), the similarity of the adjusted kSS,ch and kloss,DP values indicated that the two processes were closely coupled. This suggested that adsorption might have dominated DP retention, whereas biotic processes played a subordinate role. Due to the dominance of abiotic mechanisms, DP loss is a process that takes place throughout the year. The simulated annual DP + algal P load of 380 t P·year−1 favourably compares with the observed mean load of 393 t P·year−1. In spite of the high in-stream retention efficiency (64%), 86% of the simulated DP + AP load originated from point sources.
Phytoplankton growth was calibrated against the observed mean biomass profile along the Szamos River. The adjusted apparent net growth rate was as high as 2.5 day−1. The model reasonably reproduced spatial growth pattern of phytoplankton along the Szamos River, including rapid growth downstream of Dej (Figure 2). The high apparent net growth rate was indicative of the importance of benthic retention mechanism that enabled meroplanktonic algae to sustain high recruitment rate in the water by maintaining a large benthic stock that reproduced at a realistic low growth rate of 0.2–0.25 day−1. The temporary drop in mean algal biomass between 200 and 250 km could not be simulated as neither toxic effects were not included in the model.
3.4. Evaluation of Management Alternatives
In Scenario RBMP, the sewer network would be extended significantly. With the exception of regional facilities, low efficiency mechanical and biological treatment would be installed. This would result in a 36% and 16% increase in annual municipal emissions of DP and DIN, respectively. Mean annual loads of these nutrients (DP + AP and DIN + AN) would increase at the catchment outlet by 43 t P·year−1 and 265 t N·year−1 (Table 2). Elevated loads would result in a slightly higher mean algal biomass (Table 2). The largest deterioration would be expected in the trophic status of the Someşul Mare River and in the Szamos River between Dej and the confluence of the Lapuş River. Thus, Scenario RBMP would increase both present nutrient loads and phytoplankton input into the Tisza River.
Table 2.
Annual mean nutrient fluxes and summer mean algal biomass (Chl) at Csenger according to observations and in different alternatives.
| Alternative | Q (m3·s−1) | SS (kt·year−1) | TP (t P·Year−1) | PP (t P Year−1) | DP + AP (t P·Year−1) | DIN+AN (t N·Year−1) | Summer Chl (mg Chl·m−3) |
|---|---|---|---|---|---|---|---|
| Observations | 120 | 1100 | 853 | 444 | 393 | 5847 | 45 |
| PRESENT | 120 | 1070 | 831 | 451 | 380 | 5148 | 44 |
| BIOGEOCHEMICAL BACKGROUND | 109 | 88 | 65 | 19 | 46 | 748 | 5 |
| SOCIETAL BACKGROUND | 120 | 1177 | 474 | 332 | 142 | 2270 | 9 |
| RBMP | 120 | 1070 | 874 | 451 | 423 | 5413 | 49 |
| BAT-BMP | 120 | 600 | 541 | 264 | 277 | 3889 | 20 |
Scenario BAT-BMP assumed the introduction of state-of-the-art sewage treatment in nine major WWTPs planned to operate by 2018 and introduced BMPs in 1% of the catchment. Optimized management would decrease annual mean loads PP and SS by 44% from diffuse sources (Table 2). In most cases, the optimization algorithm prioritized establishment of buffer strips along low order streams. The preference for enhancing retention near low-order streams over reducing erosion on steep slopes coincided with our previous findings in a much smaller catchment (the Zala River; [10]). DIN + algal N loads decreased to 1259 t N·year−1, primarily due to the reduction in point emission. As a consequence, summer mean biomass of phytoplankton decreased by more than 50% in the Szamos River (Table 2; Figure 5). To realize the largest improvement in the trophic status of both the Szamos and the Tisza Rivers, priority must be given to achieve the highest P removal efficiency allowed by the best available technology in WWTPs (95%), because algae are P limited along the main channel. Considering the high distance-specific in-stream loss coefficient of DP, WWTPs closer to the catchment outlet should be upgraded first.
Figure 5.
Longitudinal algal profiles along the Szamos River in different scenarios. “Upstream length” is 0 km at the city of Dej and maximal at the confluence with River Tisza.
Figure 5.
Longitudinal algal profiles along the Szamos River in different scenarios. “Upstream length” is 0 km at the city of Dej and maximal at the confluence with River Tisza.

Scenario SOCIETAL BACKGROUND highlighted that the present pollution mostly originated from point sources. The elimination of all wastewater inputs halved both P and N loads (Table 2).
Scenario BIOGEOCHEMICAL BACKGROUND suggested that nearly all of the present PP load and 85%–90% of the DP+AP and DIN+algal N loads were due to human impact (Table 2). River algae were P-limited in most of the stream network. Mean summer biomass of phytoplankton was about 5 mg Chl·m−3, 10% of the present value (Table 2). Presently (1995–2012) summer mean biomass of algae was 3.6 ± 1.0 mg Chl·m−3 in the Tisza River at the nearest monitoring site upstream of the confluence with the Szamos River. Therefore it is clear that the Szamos River has been more productive than the Tisza River even under pristine conditions. Human activity, however, substantially magnified the extent of this impact.
In both BACKGROUND alternatives reduced nutrient availability was not the only factor that influenced algal growth. Large lakes and reservoirs represent a very important hydro-morphological modification factor inside a stream network in terms of nutrient balance and algal growth [21]. The large reservoirs situated in the mountainous upstream parts of both the Someşul Mic and Mare subcatchments were absent from these two alternatives. Therefore mean water age at the mouth of the Szamos River decreased from the present 55 days to 4.3 days. As a consequence, phytoplankton could not exhaust nutrient-determined carrying capacity in many streams and rivers. This, together with diminished nutrient supply has led to a general improvement in trophic conditions across the stream network.
Based on the evaluation of alternatives, the application of BAT-BMP measures would meet the medium-term nutrient management objective, while executing RBMP would be a step in the wrong direction with respect to water quality. Implementing BAT-BMP would mean that the negative impacts of human activities would drop to less than half, a significant step towards the best attainable status with the presence of humankind on the catchment.
4. Conclusions
River basin management should rely on local information to elaborate realistic plans that would, with high probability, improve water quality . Topology of the stream network, position of large reservoirs and fishponds, as well as hydromorphology are crucial to understand the functioning of the river system. Moreover, management targets need to be tailored to local conditions: the eutrophication potential is highly variable even between neighbouring river systems and this needs to be considered when one wants to set feasible and sensible objectives.
Comparison of RBMP and BAT-BMP Scenarios cast light on the major conflict of interest between stakeholders of the Szamos catchment (mostly Romania) and along the Tisza River (mostly Hungary). The RBMP Scenario would improve local sanitary conditions at the cost of further deteriorating water quality downstream. In contrast, the proposed BAT-BMP Scenario would provide a healthy mixture of infrastructure development (upgraded and new WWTPs) and water quality improvement along both rivers. Instead of sacrificing water quality management for infrastructure development, rural population of the Szamos catchment should be supplied with better sanitation keeping pace with installation of best available technologies in new WWTPs.
Acknowledgments
The study was carried out under subcontract with the Upper-Tisza Regional Inspectorate for Environment, Nature, and Water (Nyíregyháza) as part of the project “Ecological Assessment of the Szamos/Someş River to Determine Its Influence on the Ecological State of the Tisza River” financed by the EU Hungary-Romania Cross Border Cooperation Programme (HURO/1001/312/1.3.4).
I am grateful for the repeated consultations and frequent help from Vera Istvánovics (MTA-BME Water Research Group, HAS, Budapest), Nelli Kocsis (project leader, Upper Tisza Regional Inspectorate for Environmental Protection, Nature Conservation and Water Management, (Nyíregyháza) and Ádám Kovács (ICPDR, Vienna).
Conflicts of Interest
The author declares no conflict of interest.
References
- Vollenweider, R.A. Advances in defining critical loading levels for phosphorus in lake eutrophication. Mem. Ist. Ital. Idrobiol. 1976, 33, 53–83. [Google Scholar]
- Rojo, C.; Cobelas, M.A.; Arauzo, M. An elementary, structural analysis of river phytoplankton. Hydrobiologia 1994, 289, 43–55. [Google Scholar] [CrossRef]
- Zhu, W.; Wan, L.; Zhao, L.F. Effect of nutrient level on phytoplankton community structure in different water bodies. J. Environ. Sci. 2010, 22, 32–39. [Google Scholar] [CrossRef]
- Walks, D.J. Persistence of plankton in flowing water. Can. J. Fish. Aquat. Sci. 2007, 64, 1693–1702. [Google Scholar] [CrossRef]
- Reynolds, C.S. Hydroecology of river plankton: The role of variability in channel flow. Hydrol. Process. 2000, 14, 3119–3132. [Google Scholar] [CrossRef]
- Honti, M.; Istvánovics, V.; Kozma, Z. Assessing phytoplankton growth in River Tisza (Hungary). Verh. Int. Ver. Theor. Angew. Limnol. 2008, 30, 87–89. [Google Scholar]
- Istvánovics, V.; Honti, M.; Kovács, A.; Kocsis, G.; Stier, I. Phytoplankton growth in relation to network topology: Time-averaged catchment-scale modelling in a large lowland river. Freshw. Biol. 2014, 59, 1856–1871. [Google Scholar] [CrossRef]
- Kovács, A.; Honti, M.; Clement, A. Design of best management practice applications for diffuse phosphorus pollution using interactive GIS. Water Sci. Technol. 2008, 57, 1727–1733. [Google Scholar] [CrossRef] [PubMed]
- Kovács, A.; Honti, M. Estimation of diffuse phosphorus emissions at small catchment scale by GIS-based pollution potential analysis. Desalination 2008, 226, 72–80. [Google Scholar] [CrossRef]
- Honti, M.; Istvánovics, V.; Kovács, A. Balancing between retention and flushing in river networks—Optimizing nutrient management to improve trophic state. Sci. Total Environ. 2010, 408, 4712–4721. [Google Scholar] [CrossRef] [PubMed]
- Kovács, A.; Fülöp, B.; Honti, M. Detection of hot spots of soil erosion and reservoir siltation in ungauged Mediterranean catchments. Energy Procedia 2012, 18, 934–943. [Google Scholar] [CrossRef]
- Istvanovics, V.; Honti, M.; Kovacs, A. Ecological Assessment of the Szamos/Somes River to Determine Its Influence on the Ecological State of the Tisza River WP4: Data Analysis, Ecological Modeling and Proposals for River Basin Management; Technical Report; Department of Hydraulic and Water Resources Engineering, Budapest University of Technology and Economics: Budapest, Hungary, 2013. [Google Scholar]
- Fernall, D.; Murray, A. UK TAPAS Action Soil Nutrient Balances; Final Report; Technical Report; UK Department for Environment, Food & Rural Affairs: London, UK, 2009.
- Apele Romane. Planul de Management al Spaţiului Hidrografic Someş-Tisa; Technical Report; Apele Române: Bucureşti, Romania, 2009. (In Romanian) [Google Scholar]
- Somlyódy, L.; Buzás, K.; Clement, A.; Licskó, I. Települési vízgazdálkodás (in Hungarian). In A Hazai Vízgazdálkodás Stratégiai Kérdései; Somlyódy, L., Ed.; MTA: Budapest, Hungary, 2002. [Google Scholar]
- ARPMCJ. Raport Privind Starea Mediului în Judetul Cluj; Technical Report; Agenţia Naţională pentru Protecţia Mediului: Cluj-Napoca, Romania, 2010. (In Romanian)
- Behrendt, H.; Opitz, D. Retention of nutrients in river systems: Dependence on specific runoff and hydraulic load. Hydrobiologia 1999, 410, 111–122. [Google Scholar] [CrossRef]
- Zheng, M.M.; Zheng, H.; Wu, Y.X.; Xiao, Y.; Du, Y.H.; Xu, W.H.; Lu, F.; Wang, X.K.; Ouyang, Z.Y. Changes in nitrogen budget and potential risk to the environment over 20 years (1990–2010) in the agroecosystems of the Haihe Basin, China. J. Environ. Sci. 2015, 28, 195–202. [Google Scholar] [CrossRef] [PubMed]
- Sharpley, A.; Wang, X. Managing agricultural phosphorus for water quality: Lessons from the USA and China. J. Environ. Sci. 2014, 26, 1770–1782. [Google Scholar] [CrossRef] [PubMed]
- Pretorius, J.R.; Cooks, J. Soil loss tolerance limits: An environmental management tool. GeoJournal 1989, 191, 67–75. [Google Scholar]
- Yu, Q.; Chen, Y.; Liu, Z.; de Giesen, N.V.; Zhu, D. The Influence of a Eutrophic Lake to the River Downstream: Spatiotemporal Algal Composition Changes and the Driving Factors. Water 2015, 7, 2184–2201. [Google Scholar] [CrossRef]
© 2015 by the author; licensee MDPI, Basel, Switzerland. This article is an open access article distributed under the terms and conditions of the Creative Commons Attribution license (http://creativecommons.org/licenses/by/4.0/).
Share and Cite
MDPI and ACS Style
Honti, M. Controlling River Eutrophication under Conflicts of Interests—A GIS Modeling Approach. Water 2015, 7, 5078-5090. https://doi.org/10.3390/w7095078
AMA Style
Honti M. Controlling River Eutrophication under Conflicts of Interests—A GIS Modeling Approach. Water. 2015; 7(9):5078-5090. https://doi.org/10.3390/w7095078
Chicago/Turabian StyleHonti, Mark. 2015. "Controlling River Eutrophication under Conflicts of Interests—A GIS Modeling Approach" Water 7, no. 9: 5078-5090. https://doi.org/10.3390/w7095078