Article

Evaluation of the Integrated Multi-SatellitE Retrievals for the Global Precipitation Measurement (IMERG) Product in the São Francisco Basin (Brazil)

by
Daniele Tôrres Rodrigues
1,2,*,
Cláudio Moisés Santos e Silva
2,3,
Jean Souza dos Reis
2,
Rayana Santos Araujo Palharini
4,5,6,
Jório Bezerra Cabral Júnior
7,
Helder José Farias da Silva
2,
Pedro Rodrigues Mutti
2,3,
Bergson Guedes Bezerra
2,3 and
Weber Andrade Gonçalves
2,3
1
Department of Statistic, Federal University of Piauí, Av. Campus Universitário Ministro Petrônio Portella, Ininga, Teresina 64049-550, Brazil
2
Climate Sciences Post-Graduate Program, Department of Climate and Atmospheric Sciences, Federal University of Rio Grande do Norte, Av. Senador Salgado Filho 3000, Lagoa Nova, Natal 59078-970, Brazil
3
Department of Atmospheric and Climate Sciences, Federal University of Rio Grande do Norte, Av. Senador Salgado Filho 3000, Lagoa Nova, Natal 59078-970, Brazil
4
Escuela de Gobierno, Pontificia Universidad Catolica de Chile, Av. Vicuña Mackenna 4860, Macul, Santiago 3580000, Chile
5
Research Center for Integrated Disaster Risk Management, Av. Vicuña Mackenna 4860, Macul, Santiago 3580000, Chile
6
Millennium Initiative for Collaborative Research in Bacterial Resistance, Av. Vicuña Mackenna 4860, Macul, Santiago 3580000, Chile
7
Institute of Geography, Development and Environment, Federal University of Alagoas, Av. Lourival Melo Mota, Tabuleiro do Martins, Maceió 57072-970, Brazil
*
Author to whom correspondence should be addressed.
Water 2021, 13(19), 2714; https://doi.org/10.3390/w13192714
Submission received: 11 August 2021 / Revised: 8 September 2021 / Accepted: 11 September 2021 / Published: 1 October 2021
(This article belongs to the Section Hydrology)

Abstract

:
The São Francisco River basin is one of the largest in the Brazilian territory. This basin has enormous economic, social and cultural importance for the country. Its water is used for human and animal supply, irrigation and energy production. This basin is located in an area with different climatic characteristics (humid and semiarid) and studies related to precipitation are very important in this region. In this scenario, the objective of this investigation is to present an assessment of rainfall estimated through the Integrated Multi-SatellitE Retrievals for Global Precipitation Measurement (IMERG) product compared with rain gauges over the São Francisco river basin in Brazil. For that, a period from of 20 years and 18 surface weather stations were used to evaluate the product. Based on different evaluation techniques, the study found that the IMERG is appropriate to represent precipitation over the basin. According to the results, the performance of the IMERG product depends on the location where the rain occurs. The bias ranged from −1.67 to 0.34 mm, the RMSE ranged from 5.36 to 10.36 mm and the values of the correlation coefficients between the daily data from the IMERG and rain gauge ranged from 0.28 to 0.61. The results obtained by Student t-test, density curves and regression analysis, in general, show that the IMERG is able to satisfactorily represent rain gauge data. The exception is the eastern portion of the basin, where the product, on average, underestimates the precipitation (p-value < 0.05) and presents the worst statistical metrics.

1. Introduction

Precipitation is one of the most important variables in hydrometeorological studies, whose analysis encompasses applications in various activities, such as energy generation, irrigated agriculture, water resource management and monitoring areas of hydrological disaster risk, among others. The availability of reliable precipitation data, with a high spatial and temporal resolution, is essential for studies in these areas [1,2]. Rain gauges measure the amount of rain accurately and immediately, although it has been reported that raw precipitation amounts are usually underestimated due to wind-induced undercatch, wetting and evaporation losses, trace amount of precipitation, and equipment design [3]. However, hydrometeorological monitoring in some countries is deficient, especially in developing or underdeveloped countries [4,5].
In Brazil, most river basins have low rainfall. Additionally, the precipitation database in general suffers from a high percentage of missing data. For example, in Northeast Brazil (NEB), the percentage of failures per weather station can reach 23% in 30-year climatological series [6]. In the Amazon Basin (AMZ), the percentage of failures is highly variable, but even in the case of data previously filtered based on the standards of the World Meteorological Organization (WMO), the failures usually reach values above 6% for annual series [7]. Thus, satellite precipitation products are alternatives for hydrometeorological monitoring [5,8]. In particular, the rainfall estimated from the tropical rainfall measuring mission (TRMM) algorithms [9] and more recently the global precipitation measurement (GPM) has been widely used in regional and global meteorological and climatological studies [8,10,11,12,13,14,15]. In this context, several studies have been performed to evaluate the precipitation estimates from the TRMM and GPM satellites in different regions of Brazil [5,16,17,18,19]. Overall, the results of these studies suggest that the accuracy of satellite precipitation estimates depends on factors such as terrain, type of precipitation and local climate.
In the tropical portion of South America, the rainfall estimated by the TRMM algorithms were analyzed for their ability to represent precipitation in the AMZ from the high-frequency variability, represented by the diurnal precipitation cycle [1,20], up to the modes of seasonal and interannual variability [20,21,22]. In NEB, whose spatial distribution of precipitation is mostly inserted in a semiarid zone, flanked by the rainy coastal region and borders with the Amazon and the Cerrado biomes [6], TRMM products have been used in various hydrometeorological applications. For example, [5] used TRMM data to estimate return periods for extreme precipitation events. In contrast [23] used TRMM data to monitor drought in the semiarid region.
Most recently, the Integrated Multi-SatellitE Retrievals for GPM (IMERG) product from the GPM satellite constellation has been evaluated in different regions of the world against rain gauge such as in China [24,25], Pakistan [26], different climatic zones of Brazil [27], the Ebro River basin in Spain [28], Chile [29], and Canada [30]. It was also evaluated under specific conditions such as orographic rains [28], different microphysical rain regimes [29], and heavy rain conditions such as during hurricane days [31] and typhoons [32]. Overall IMERG performance is satisfactory. However, has been reported [28,29] that it strongly depends on altitude and precipitation regime. Concerning the Brazilian rivers basin, the performance of IMERG product was still poorly analyzed.
In the specific context of the São Francisco River basin (SFB), which is the largest in extent and volume of NEB, the most recent studies with TRMM data have focused on the analysis of drought variability [33] or analysis of the precipitation trend [34]. However, these studies focused on the upper reach of the São Francisco River, which corresponds to the southern portion of the SFB. Thus, in this study we evaluated the IMERG product of the GPM mission, was developed as a continuation and improvement of the TRMM mission, to estimate precipitation over the entire length of the São Francisco River basin, comparing it with rainfall data measured on the surface.

2. Materials and Methods
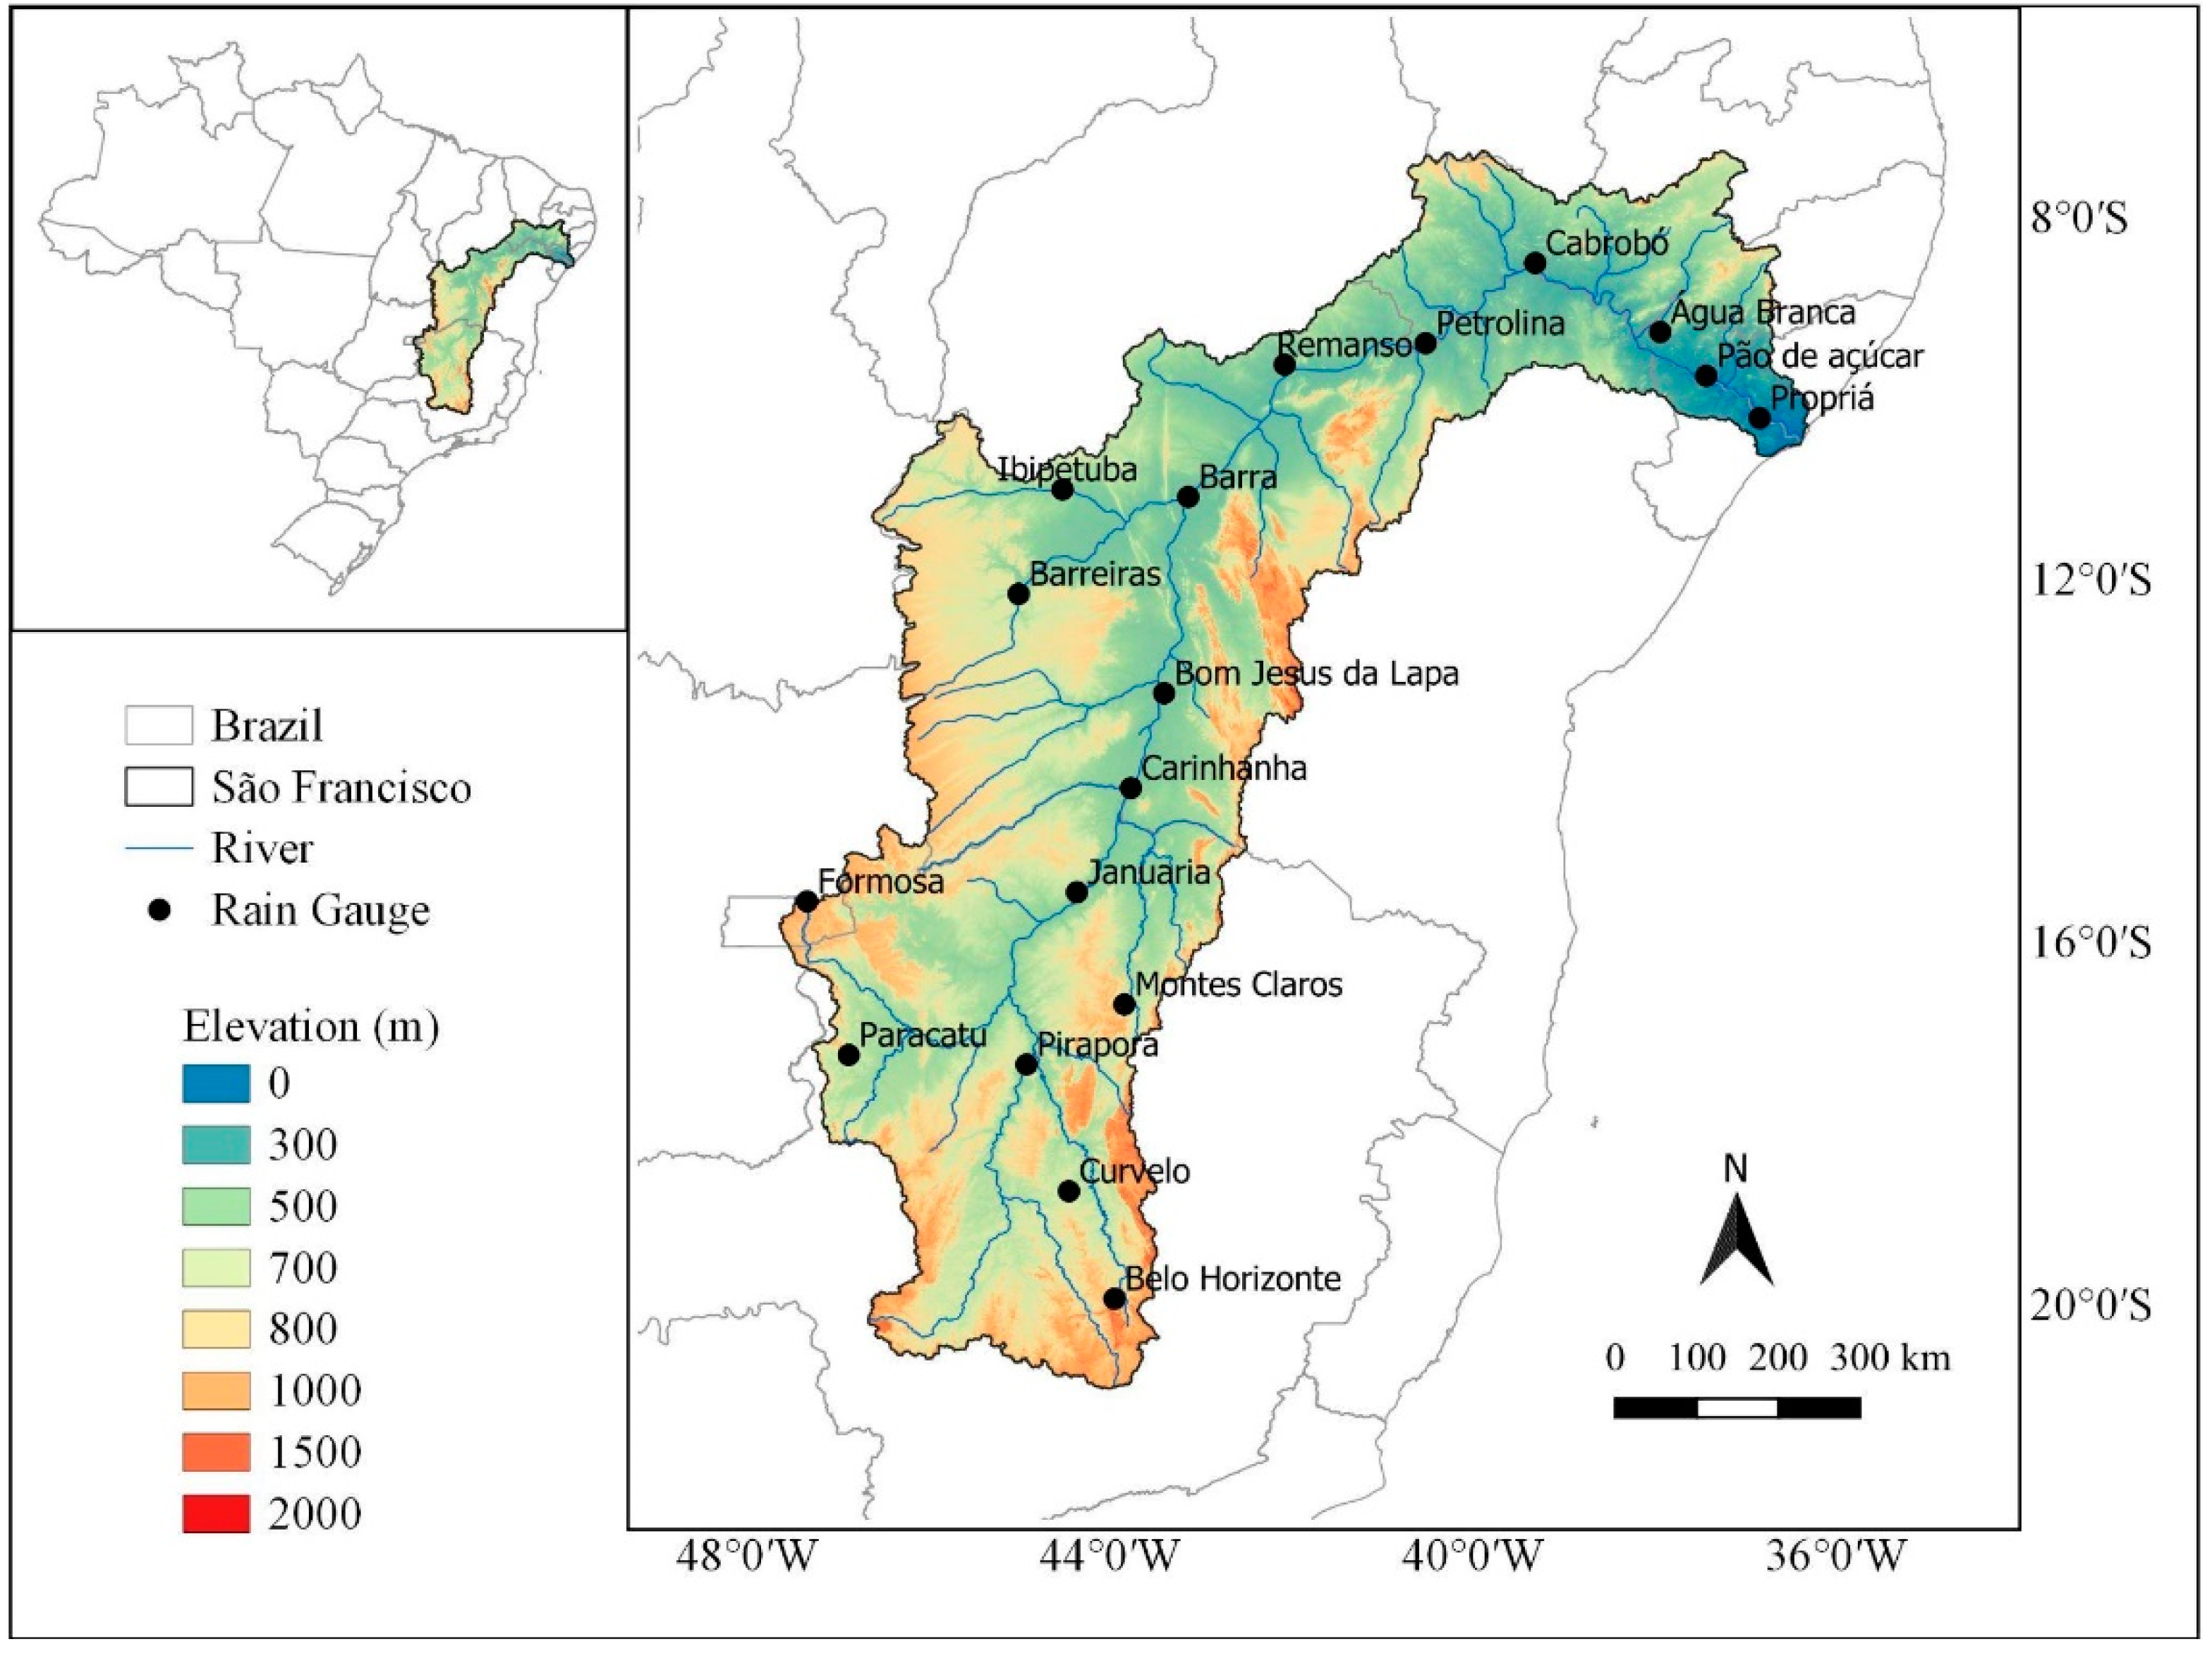
2.1. Study Area

The SFB is located in Brazil between the geographical coordinates 7.0°–21.0° S and 35.0°–47.7° W (Figure 1). According to the São Francisco River Basin Committee [35], the basin is one of the largest in Brazilian territory, being located in portions of the Northeast, Southeast and Midwest regions of the country. In addition, it occupies an area of 619,543.94 km2, which corresponds to almost 8% of national territory. Due to its size, it is divided into four physiographic regions: Upper, Middle, Sub-Middle and Lower. Furthermore, the SFB has enormous economic, social and cultural importance to the country. Its water is used for human and animal supply, irrigation and energy production for a large part of the surrounding population, living in about 505 municipalities [36,37] with a population of 18,218,575 [38]. In addition, the river serves for transport between cities. The rainy season and the amount of rainfall differ in time and space in the SFB. In the southern portion and at the mouth the climate is humid while in the central reach a semiarid climate predominates [39,40].

2.2. Satellite Data

Precipitation estimates data used in this work are from the IMERG product, the GPM level 3 multi-satellite precipitation algorithm, which combines all microwave sensors in the constellation and infrared-based observations from geosynchronous satellites [41]. The IMERG version 6 product fuses the early precipitation estimates by the TRMM satellite from the 2000 to 2015 with more recent precipitation estimates by the GPM satellite from 2014 to present. The IMERG version 6 products on a half-hour 0.1° grid were accessed on NASA’s Goddard Space Flight Center website https://pmm.nasa.gov/data-access/downloads/gpm (accessed on 17 December 2020). In this study, the IMERG data collection period was from June 2000 to December 2019, then accumulated to a daily data.

2.3. Precipitation Data

In order to assess the daily precipitation estimate of the satellite product, a set of rainfall data observed at 18 surface gauge stations was used as a reference. These stations are distributed throughout the SFB and are managed by the National Meteorological Institute (INMET), through the Meteorological Database Project (BDMEP).
Table 1 presents information about the surface gauges, such as the municipalities where the gauges is installed, latitude, longitude, elevation (m) and percentage of missing data for each gauge within the period from June 2000 to December 2019. The data series observed by each surface gauge does not exceed 10% of missing data (Table 1). Condition imposed by several researchers as [18,42,43]. To assess the IMERG estimates, the dates with missing data were excluded from the two databases, Gauge and IMERG.

2.4. Statistical Analysis

The performance of the IMERG precipitation estimates was evaluated using five statistical indices, namely: bias (BIAS), root mean squared error (RMSE), Pearson’s correlation coefficient (r), probability of detection (POD) and false alarm ratio (FAR). BIAS represents the systematic errors in satellite precipitation estimates based on observations from rain gauges, and is calculated by Equation (1). RMSE measures the average absolute error of the satellite’s precipitation estimates, Equation (2). The lower the RMSE, the better the estimates of IMERG product to represent rain gauges dataset. The value of r quantifies the relationship between the precipitation values estimated by the satellite and observed by the rain gauges, Equation (3):
BIAS = i = 1 n X i Y i n
RMSE = i = 1 n ( X i Y i ) 2 n
r = i = 1 n ( X i   X ¯   ) ( Y i   Y ¯   ) i = 1 n ( X i   X ¯   ) 2 i = 1 n ( Y i   Y ¯   ) 2
where X i represents the satellite precipitation estimate on day/month i ; Y i denotes the precipitation value observed by the rain gauge on day/month i ; n is the number of days/months analyzed in the study; and   X ¯   and   Y ¯   represent the mean values of X i and Y i , respectively.
For the categorical analysis of precipitation estimated by the IMERG, the variables POD and FAR from Equations (4) and (5) were used. POD measures the fraction of the total precipitation events correctly detected by the satellite, while FAR measures the total fraction of precipitation events incorrectly detected by the satellite:
POD = N a N a + N c
FAR = N b N a + N b
where N a is the number of correct answers, referring to the number of days in which the precipitation values estimated by the satellite and observed by rain gauges were greater than a predefined precipitation limit, 1 mm/day, in this study, following the criterion adopted by [44,45];   N b is the number of days on which the satellite-based precipitation estimate was greater than 1 mm/day and the rainfall observed by the pluviometer was less than 1 mm/day; and N c is the number of days on which the satellite-based precipitation estimate was less than 1 mm/day and the rainfall observed by the pluviometer was greater than 1 mm/day.
The probability density function (PDF) was also used. Denoted by f X ( x ) the FDP describes the behavior, in polygon form, of the frequency distribution of a random variable. The probability of the random variable being less than a given value of interest, x , is calculated using the cumulative distribution function (CDF), represented by Equation (6):
F X ( x ) = P ( X x ) = x f X ( x ) dx
The CDF of a continuous random variable is a non descending function, and the expressions are validated: F X ( ) = 0 and F X ( + ) = 1 [46,47,48,49]. Conversely, the corresponding FDP can be obtained by differentiating F X ( x ) , The PDF, f X ( x ) , is represented by Equation (7):
f X ( x ) = dF X ( x ) dx
The Student t-test was applied to verify a significant difference between the means (gauge and IMERG), adopting 5% statistical significance. In addition, a simple linear regression model was used to assess the semilarity of monthly precipitation variations between the data estimated by IMERG and observed by gauges, Equation (8):
Y = β 0 + β 1 X
where Y represents the dataset observed by the rain gauges; β 0   is the intercept; β 1 is the slope; and X represents the dataset estimated by the satellite. The closer to zero and one the estimated values, respectively, of parameters β 0 and β 1 are, the better the relationship between the gauge and IMERG data is. The determination coefficient ( R 2 ) represents the goodness of fit of the regression model.

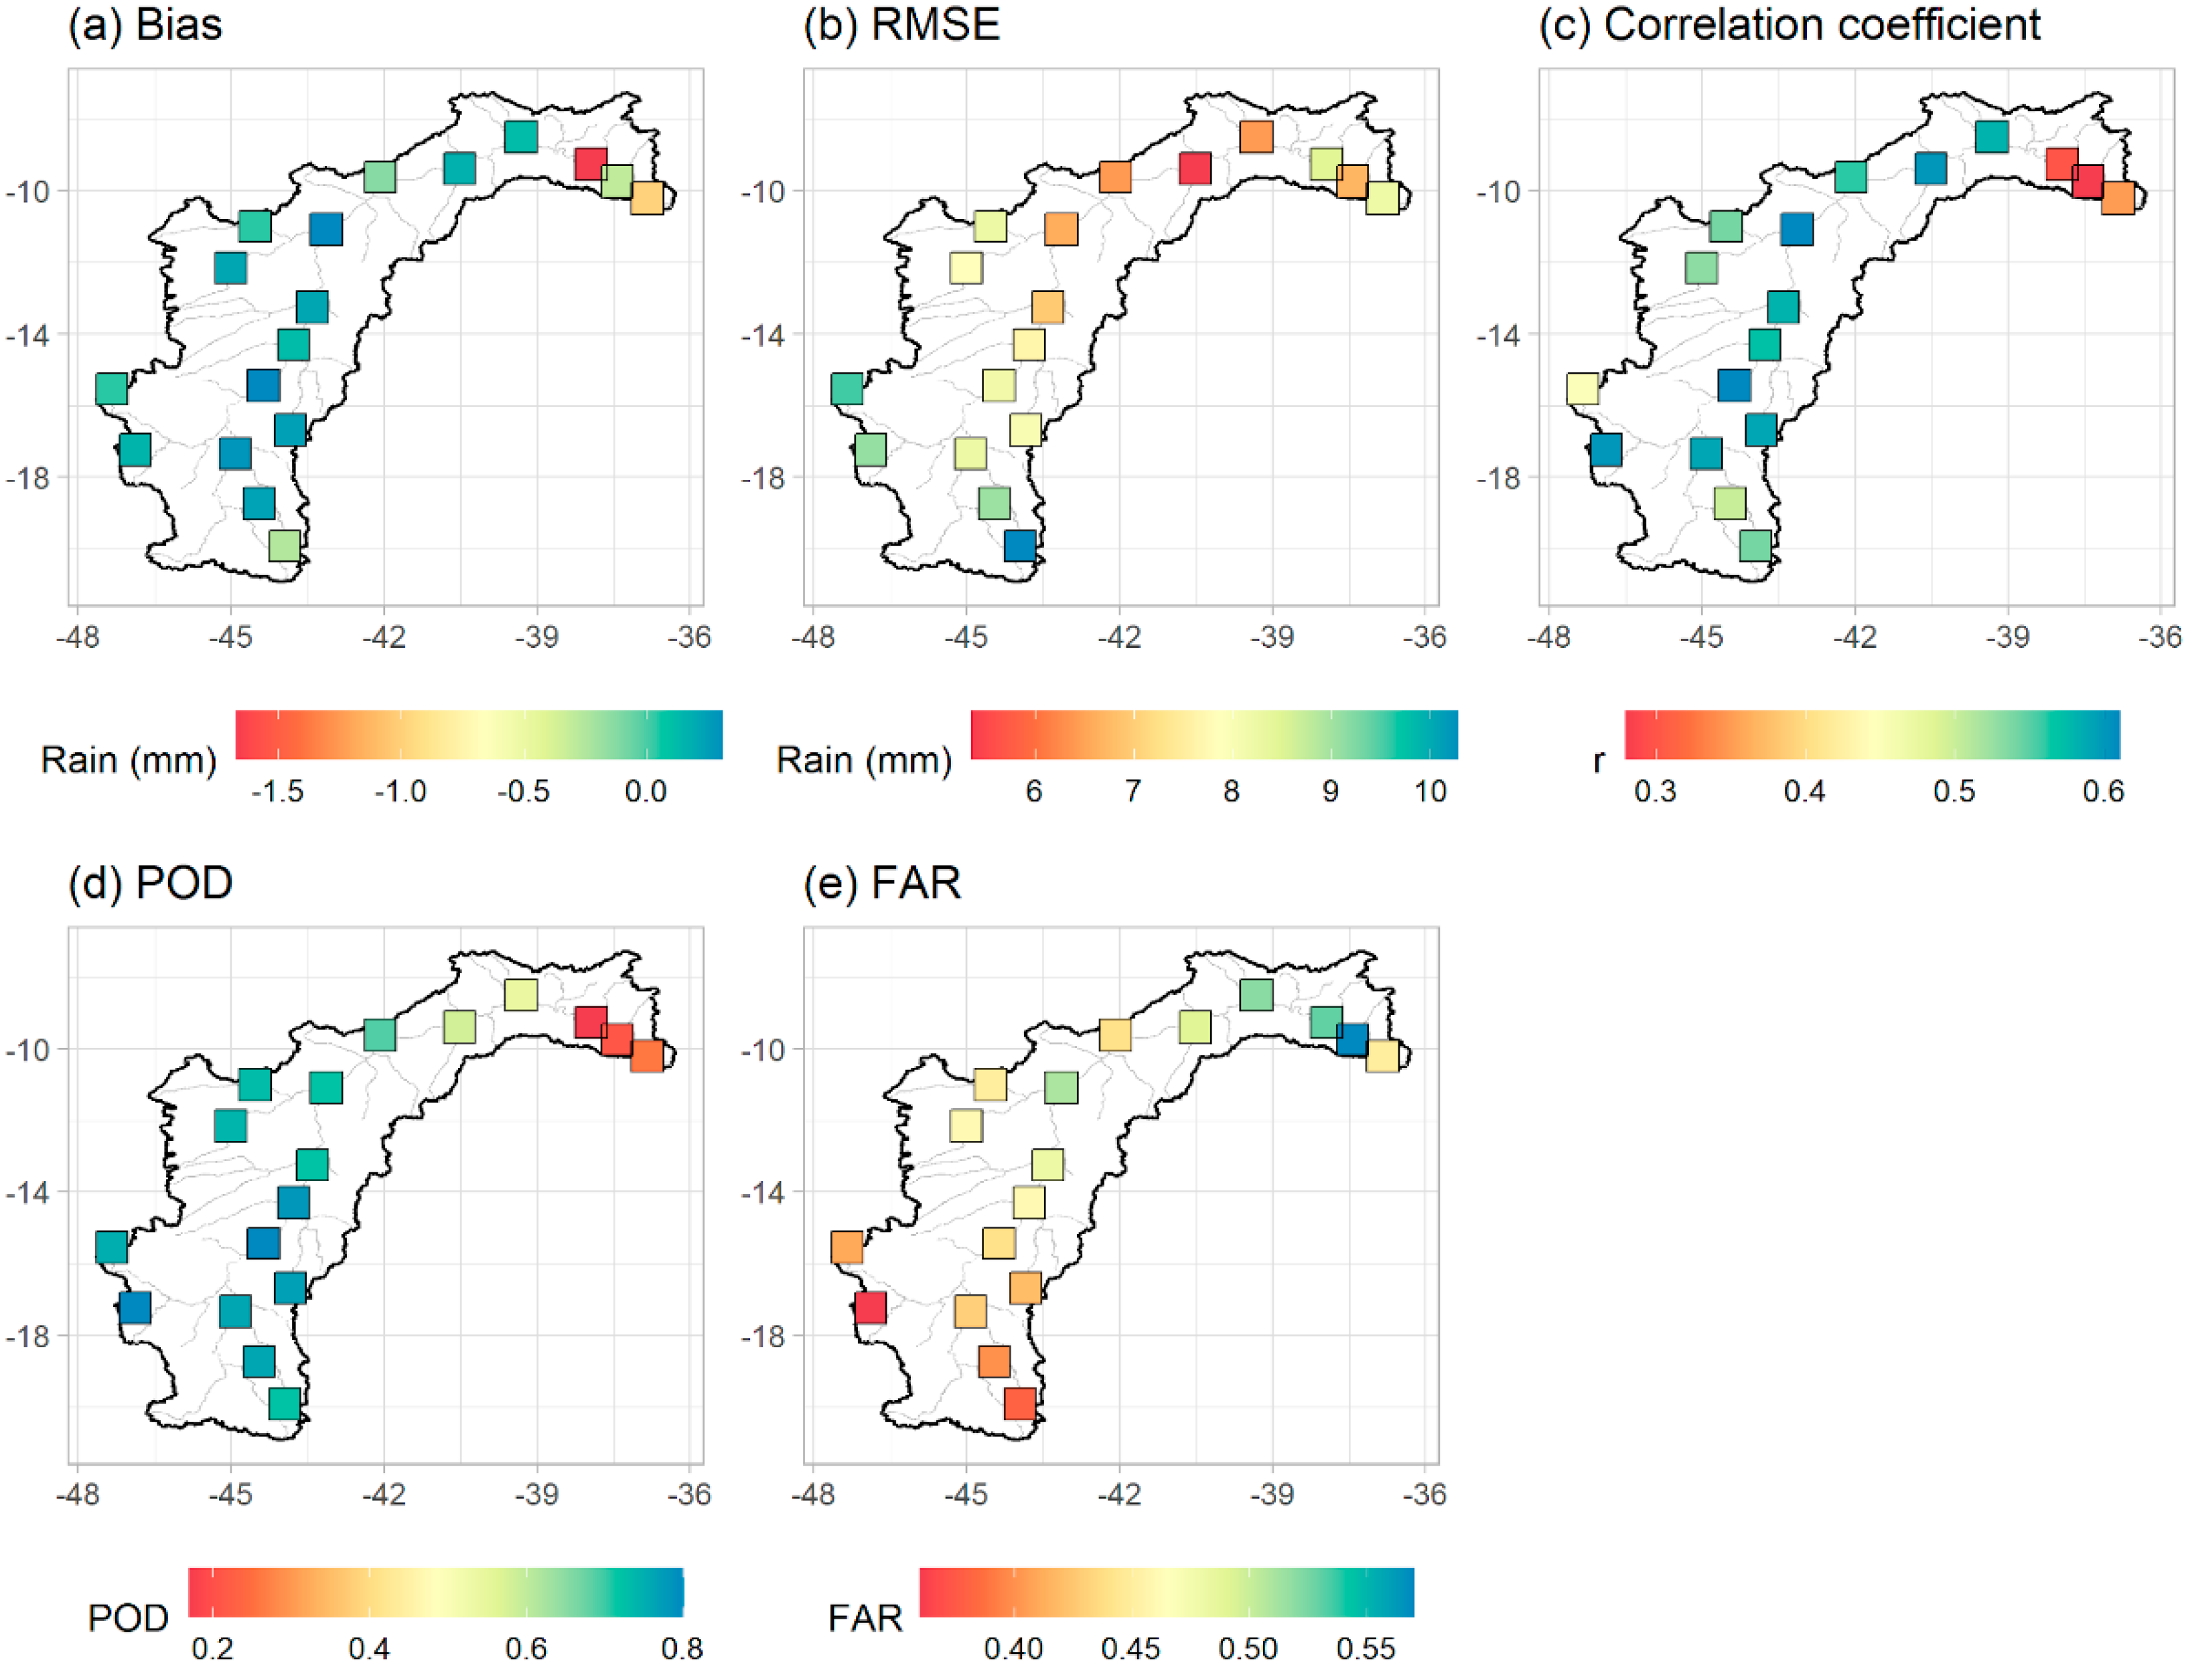
3. Results and Discussion

The annual average precipitation observed by the rain gauges and estimated by the IMERG are shown in Figure 2. The precipitation in the SFB presents a characteristic distribution with higher annual average accumulations above 1500 mm in the South (Upper São Francisco). In the Middle São Francisco, the observed precipitation was around 600 and 1050 mm, decreasing to values below 500 mm in the northern portion of the basin (Lower São Francisco). This gradual decrease in precipitation from South to North observed in the rain gauges (Figure 2a) is represented consistently by the algorithm, but IMERG underestimates precipitation in the Lower São Francisco.
The analysis of precision and accuracy is shown in Figure 3. The underestimation in the Lower São Francisco (Figure 3a) is confined to the northernmost of the SFB, located in the coastal region. In the rest of the SFB, the algorithm presents biases between −0.5 and 0.5 mm.
The RMSE exceeds 10 mm in the southernmost portion of the SFB, decreasing towards the central region (Figure 3b). The lower the RMSE values, the better the capacity of the IMERG product to represent the precipitation values observed by rain gauges. The correlation is below 0.4 in the Lower São Francisco (Figure 3c) and it is in this region where the lowest POD (Figure 3d) and highest FAR (Figure 3e) are found. Similar values were found by [18] who observed in inland and coast northeastern regions, regiões que abrangem o SFB, that 3B42 product of TRMM demonstrated a better performance, as demonstrated in the metrics for inland and coast northeastern regions, bias = 2.82 mm/day and − 2.94 mm/day; r = 0.18 and 0.30; std = 8.53 mm/day and 6.97 mm/day; rmse = 14.75 mm/day and 7.03 mm/day, respectively.
The precipitation in the SFB shows an evident spatial and temporal variability (Figure 4). The positive aspect regarding the IMERG data is the ability to adequately capture the seasonality of precipitation, observed over most of the basin.
In this figure, it is clear that the rain regime is different among the sites. The majority presents its rainy period in the austral summer. On the other hand, the dry period prevails in the austral winter. For these sites, its clearly observed that the IMERG product is well related to the in-situ data. However, for the sites which presented their rainy period in the austral winter and the dry period during the summer, the results are not the same. in the municipalities of Água Branca (Figure 4a), Pão de Açúcar (Figure 4n) and Propriá (Figure 4r), the satellite did not consistently reproduce the distribution of precipitation between the months of May and August, underestimating both the average, median and quartiles measured using rain gauges. This could be explained by the occurrence of warm cloud in these regions [5,50], which in turn, generate worse precipitation estimates by sattelites.
The density curves (gauge and IMERG) referring to the monthly data distributions are similar in a large part of the basin (Figure 5). As indicated by the boxplot (Figure 4), the exception is in the municipalities of Água Branca (Figure 5a), Pão de Açúcar (Figure 5n) and Propriá (Figure 5r), where the distributions of the satellite data show a higher concentration on the left compared to the data from the rain gauges. According to the results of the Student t-test, the averages of the distributions observed by the rain gauges and estimated by the satellite are statistically different over these municipalities (valor-p < 0.05). When observing the estimates of the parameters of the linear regression model, we also found that Água Branca, Propriá and Pão de Açúcar showed the worst results, with r ≤ 0.68 and R2 ≤ 0.46 (Table 2).
It stands out that the greatest accumulation of precipitation is concentrated between the months of October and April, a period during the rainy season in much of the region, consistent with previous analyses obtained from rain gauge and satellite data [5,6,51]. A possible explanation for this underestimation of precipitation in the NEB east coast is the type of weather systems which usually affect this region. Previous studies have suggested the formation of warm clouds over this region [50,52]. This hypothesis is consistent with the low frequency of electrical discharges in practically the entire NEB east coast [53]. Warm clouds have little vertical development and low ice content, which is essential for the electrification process of clouds. These conditions contribute to a deficience on estimating precipitation by satellites [5,8,18,50,54]. In addition, it is reasonable assume that IMERG’s resolution can be not sufficient to represen(mainly) the local convection in the region, thus the rainfall is underestimated.
In general, the IMERG provided satisfactory results to estimate the precipitation in the BSF. Data from this product is precious as it covers a more detailed spatial coverage that is not always supplied by the network of rainfall stations, in addition to being important for the most diverse applications that demand knowledge about the quantity, duration and distribution of the rainfall regime in time and space [55,56,57,58,59,60].
It is also reinforced that the IMERG presented limitations for estimating precipitation in the lower São Francisco and that future studies are important to elucidate remaining gaps. For example, the results found in this work corroborate the results of [61], these authors analyzed the following satellite-derived precipitation estimate products: Multi-Satellite Precipitation Analysis (TMPA); Integrated Multi-satellite Retrievals (IMERG-F, version V05) and Global Satellite Mapping of Precipitation (GSMaP); in all of them there was an underestimate when compared with data measured by pluviometers in the coastal portion of Northeastern Brazil. [62] analyzed the daily precipitation estimated by IMERG for the year 2016 and found similar results. On the other hand, [63] evaluated 13 years of rainfall estimates for Brazil by the TRMM and concluded that there was good agreement (by 97%) in all regions of the country.

4. Conclusions

We present an assessment of the data from the IMERG algorithm for the São Francisco River basin in Brazil. For that, we used data from 18 surface weather stations, from which statistics were determined for each location. The results obtained depend on the basin region. The bias ranged from −1.67 to 0.34 mm/day, the RMSE ranged from 5.36 to 10.36 mm/day and the values of the correlation coefficients between the daily data from the IMERG and rain gauge ranged from 0.28 to 0.61. The results obtained by Student t-test, density curves and regression analysis, in general, show that the IMERG is able to satisfactorily represent rain gauge data. We observed that the product is suitable for represent the precipitation variability, except in the region closest to the east coast, where the product presents the worst statistical metrics. A possible explanation for underestimation of precipitation in the NEB east coast is the type of weather systems which usually affect this region. Previous studies have suggested the formation of warm clouds over this region. Another hypothesis is that the product is not suitable to represent the variability of precipitation over the region closest to the east coast, due to the product’s deficiency in efficiently representing points that are at the ocean-continent interface. This question is still open among researchers regarding precipitation estimation algorithms globally.

Author Contributions

Conceptualization, D.T.R. and C.M.S.e.S.; methodology, D.T.R. and B.G.B.; software, D.T.R. and J.S.d.R.; validation, R.S.A.P., W.A.G. and P.R.M.; visualização, R.S.A.P.; data curation, J.S.d.R. and H.J.F.d.S.; writing—original draft preparation, D.T.R.; writing—review and editing, D.T.R., C.M.S.e.S. and J.B.C.J.; All authors have read and agreed to the published version of the manuscript.

Funding

This research received no external funding.

Institutional Review Board Statement

Not applicable.

Informed Consent Statement

Not applicable.

Data Availability Statement

The data used in this manuscript are available by writing to the corresponding authors.

Acknowledgments

We are thankful to the National Council for Scientific and Technological Development (CNPq) for the research productivity grant of the second author (Process n° 310781/2020-5).

Conflicts of Interest

The authors declare no conflict of interest.

References

  1. Kucera, P.A.; Ebert, E.E.; Turk, F.J.; Levizzani, V.; Kirschbaum, D.; Tapiador, F.J.; Loew, A.; Borsche, M. Precipitation from space: Advancing earth system science. Bull. Am. Meteorol. Soc. 2013, 94, 365–375. [Google Scholar] [CrossRef]
  2. Marengo, J.A. Mudanças Climáticas Globais e Seus Efeitos Sobre a Biodiversidade—Caracterização do Clima Atual e Definição das Alterações Climáticas para o Território Brasileiro ao longo do Século XXI, 2nd ed; Ministério do Meio Ambiente: Brasília, Brazil, 2006; ISBN 8577380386. [Google Scholar]
  3. Wang, X.; Pang, G.; Yang, M. Precipitation over the tibetan plateau during recent decades: A review based on observations and simulations. Int. J. Climatol. 2018, 38, 1116–1131. [Google Scholar] [CrossRef]
  4. Behrangi, A.; Khakbaz, B.; Jaw, T.C.; AghaKouchak, A.; Hsu, K.; Sorooshian, S. Hydrologic evaluation of satellite precipitation products over a mid-size basin. J. Hydrol. 2011, 397, 225–237. [Google Scholar] [CrossRef] [Green Version]
  5. Rodrigues, D.T.; Gonçalves, W.A.; Spyrides, M.H.C.; Santos e Silva, C.M. Spatial and temporal assessment of the extreme and daily precipitation of the Tropical Rainfall Measuring Mission satellite in Northeast Brazil. Int. J. Remote Sens. 2019, 41, 549–572. [Google Scholar] [CrossRef]
  6. Oliveira, P.T.; Santos e Silva, C.M.; Lima, K.C. Climatology and trend analysis of extreme precipitation in subregions of Northeast Brazil. Theor. Appl. Climatol. 2017, 130, 77–90. [Google Scholar] [CrossRef]
  7. Santos, E.B.; Lucio, P.S.; Santos e Silva, C.M. Estimating return periods for daily precipitation extreme events over the Brazilian Amazon. Theor. Appl. Climatol. 2016, 126, 585–595. [Google Scholar] [CrossRef]
  8. Rodrigues, D.T.; Gonçalves, W.A.; Spyrides, M.H.C.; Santos e Silva, C.M.; de Souza, D.O. Spatial distribution of the level of return of extreme precipitation events in Northeast Brazil. Int. J. Climatol. 2020, 40, 5098–5113. [Google Scholar] [CrossRef]
  9. Kummerow, C.; Barnes, W.; Kozu, T.; Shiue, J.; Simpson, J. The Tropical Rainfall Measuring Mission (TRMM) sensor package. J. Atmos. Ocean. Technol. 1998, 15, 809–817. [Google Scholar] [CrossRef]
  10. Libertino, A.; Sharma, A.; Lakshmi, V.; Claps, P. A global assessment of the timing of extreme rainfall from TRMM and GPM for improving hydrologic design. Environ. Res. Lett. 2016, 11, 054003. [Google Scholar] [CrossRef]
  11. Singh, N.; Kumar, A.; Anshumali; Singh, J.; Nath, D. Observations on the distribution of precipitation over northern India using joint CloudSat, CALIPSO and TRMM measurements. Remote Sens. Lett. 2020, 11, 117–126. [Google Scholar] [CrossRef]
  12. Singh, R.; Shekhar, M.; Pandey, V.K.; Kumar, R.; Sharma, R.K. Causes and geomorphological effects of large debris flows in the lower valley areas of the meru and gangotri glaciers, Bhagirathi basin, Garhwal Himalaya (India). Remote Sens. Lett. 2018, 9, 809–818. [Google Scholar] [CrossRef]
  13. Subrahmanyam, K.; Kumar, K.K. The vertical structure of latent heating and its association with cloud types during the Indian summer monsoon. Remote Sens. Lett. 2020, 11, 1070–1079. [Google Scholar] [CrossRef]
  14. Wang, K.; Kong, L.; Yang, Z.; Singh, P.; Guo, F.; Xu, Y.; Tang, X.; Hao, J. GPM annual and daily precipitation data for real-time short-term nowcasting: A pilot study for a way forward in data assimilation. Water 2021, 13, 1422. [Google Scholar] [CrossRef]
  15. Yu, C.; Zheng, J.; Hu, D.; Di, Y.; Zhang, X.; Liu, M. Evaluation and correction of imerg late run precipitation product in rainstorm over the southern basin of China. Water 2021, 13, 231. [Google Scholar] [CrossRef]
  16. Huffman, G.J.; Adler, R.F.; Bolvin, D.T.; Gu, G.; Nelkin, E.J.; Bowman, K.P.; Hong, Y.; Stocker, E.F.; Wolff, D.B. The TRMM Multisatellite Precipitation Analysis (TMPA): Quasi-global, multiyear, combined-sensor precipitation estimates at fine scales. J. Hydrometeorol. 2007, 8, 38–55. [Google Scholar] [CrossRef]
  17. Lal, P.; Prakash, A.; Kumar, A.; Srivastava, P.K.; Saikia, P.; Pandey, A.C.; Srivastava, P.; Khan, M.L. Evaluating the 2018 extreme flood hazard events in Kerala, India. Remote Sens. Lett. 2020, 11, 436–445. [Google Scholar] [CrossRef]
  18. Araujo Palharini, R.S.; Vila, D.A.; Rodrigues, D.T.; Palharini, R.C.; Mattos, E.V.; Pedra, G.U. Assessment of extreme rainfall estimates from satellite-based: Regional analysis. Remote Sens. Appl. Soc. Environ. 2021, 23, 100603. [Google Scholar] [CrossRef]
  19. Salles, L.; Satgé, F.; Roig, H.; Almeida, T.; Olivetti, D.; Ferreira, W. Seasonal effect on spatial and temporal consistency of the new GPM-based IMERG-v5 and GSMaP-v7 satellite precipitation estimates in Brazil’s Central Plateau region. Water 2019, 11, 668. [Google Scholar] [CrossRef] [Green Version]
  20. Amorim, J.D.S.; Viola, M.R.; Junqueira, R.; de Oliveira, V.A.; de Mello, C.R. Evaluation of satellite precipitation products for hydrological modeling in the brazilian cerrado biome. Water 2020, 12, 2571. [Google Scholar] [CrossRef]
  21. Hierro, R.; Llamedo, P.; de la Torre, A.; Alexander, P. Spatiotemporal structures of rainfall over the Amazon basin derived from TRMM data. Int. J. Climatol. 2016, 36, 1565–1574. [Google Scholar] [CrossRef]
  22. Oliveira, R.; Maggioni, V.; Vila, D.; Porcacchia, L. Using satellite error modeling to improve GPM-Level 3 rainfall estimates over the central Amazon region. Remote Sens. 2018, 10, 336. [Google Scholar] [CrossRef] [Green Version]
  23. Brasil Neto, R.M.; Santos, C.A.G.; da Costa Silva, J.F.C.B.; da Silva, R.M.; dos Santos, C.A.C.; Mishra, M. Evaluation of the TRMM product for monitoring drought over Paraíba State, northeastern Brazil: A trend analysis. Sci. Rep. 2021, 11, 1097. [Google Scholar] [CrossRef]
  24. Li, X.; Chen, Y.; Wang, H.; Zhang, Y. Assessment of GPM IMERG and radar quantitative precipitation estimation (QPE) products using dense rain gauge observations in the Guangdong-Hong Kong-Macao Greater Bay Area, China. Atmos. Res. 2020, 236, 104834. [Google Scholar] [CrossRef]
  25. Yu, C.; Hu, D.; Liu, M.; Wang, S.; Di, Y. Spatio-temporal accuracy evaluation of three high-resolution satellite precipitation products in China area. Atmos. Res. 2020, 241, 104952. [Google Scholar] [CrossRef]
  26. Arshad, M.; Ma, X.; Yin, J.; Ullah, W.; Ali, G.; Ullah, S.; Liu, M.; Shahzaman, M.; Ullah, I. Evaluation of GPM-IMERG and TRMM-3B42 precipitation products over Pakistan. Atmos. Res. 2021, 249, 105341. [Google Scholar] [CrossRef]
  27. Freitas, E.D.S.; Coelho, V.H.R.; Xuan, Y.; Melo, D.D.C.D.; Gadelha, A.N.; Santos, E.A.; Galvão, C.D.O.; Ramos Filho, G.M.; Barbosa, L.R.; Huffman, G.J.; et al. The performance of the IMERG satellite-based product in identifying sub-daily rainfall events and their properties. J. Hydrol. 2020, 589, 125128. [Google Scholar] [CrossRef]
  28. Navarro, A.; García-Ortega, E.; Merino, A.; Sánchez, J.L.; Tapiador, F.J. Orographic biases in IMERG precipitation estimates in the Ebro River basin (Spain): The effects of rain gauge density and altitude. Atmos. Res. 2020, 244, 105068. [Google Scholar] [CrossRef]
  29. Rojas, Y.; Minder, J.R.; Campbell, L.S.; Massmann, A.; Garreaud, R. Assessment of GPM IMERG satellite precipitation estimation and its dependence on microphysical rain regimes over the mountains of south-central Chile. Atmos. Res. 2021, 253, 105454. [Google Scholar] [CrossRef]
  30. Moazami, S.; Najafi, M.R. A comprehensive evaluation of GPM-IMERG V06 and MRMS with hourly ground-based precipitation observations across Canada. J. Hydrol. 2021, 594, 125929. [Google Scholar] [CrossRef]
  31. Ayat, H.; Evans, J.P.; Behrangi, A. How do different sensors impact IMERG precipitation estimates during hurricane days? Remote Sens. Environ. 2021, 259, 112417. [Google Scholar] [CrossRef]
  32. Yu, C.; Hu, D.; Di, Y.; Wang, Y. Performance evaluation of IMERG precipitation products during typhoon Lekima (2019). J. Hydrol. 2021, 597, 126307. [Google Scholar] [CrossRef]
  33. Santos, C.A.G.; Brasil Neto, R.M.; Passos, J.S.A.; da Silva, R.M. Drought assessment using a TRMM-derived standardized precipitation index for the upper São Francisco River basin, Brazil. Environ. Monit. Assess. 2017, 189, 250. [Google Scholar] [CrossRef] [PubMed]
  34. Santos, C.A.G.; Brasil Neto, R.M.; da Silva, R.M.; de Araújo Passos, J.S. Integrated spatiotemporal trends using TRMM 3B42 data for the Upper São Francisco River basin, Brazil. Environ. Monit. Assess. 2018, 190, 175. [Google Scholar] [CrossRef] [PubMed]
  35. CBHSF—Comitê da Bacia Hidrográfica do Rio São Francisco A Bacia: Principais Características. Available online: https://cbhsaofrancisco.org.br/a-bacia/ (accessed on 25 September 2020).
  36. Cabral Júnior, J.B.; e Silva, C.M.S.; de Almeida, H.A.; Bezerra, B.G.; Spyrides, M.H.C. Detecting linear trend of reference evapotranspiration in irrigated farming areas in Brazil’s semiarid region. Theor. Appl. Climatol. 2019, 138, 215–225. [Google Scholar] [CrossRef]
  37. Torres, M.D.O.; Maneta, M.; Howitt, R.; Vosti, S.A.; Wallender, W.W.; Bassoi, L.H.; Rodrigues, L.N. Economic impacts of regional water scarcity in the São Francisco river Basin, Brazil: An application of a linked hydro-economic model. Environ. Dev. Econ. 2012, 17, 227–248. [Google Scholar] [CrossRef] [Green Version]
  38. IBGE—Instituto Brasileiro de Geografia e Estatística Sinopse Do Censo Demográfico. Available online: http://www.censo2010.ibge.gov.br (accessed on 5 September 2020).
  39. Alvares, C.A.; Stape, J.L.; Sentelhas, P.C.; De Moraes Gonçalves, J.L.; Sparovek, G. Köppen’s climate classification map for Brazil. Meteorol. Z. 2013, 22, 711–728. [Google Scholar] [CrossRef]
  40. Cabral Júnior, J.B.; Bezerra, B. Análises da evapotranspiração de referência e do índice de aridez para o Nordeste do Brasil. Rev. Geociên. Nord. 2018, 4, 71–89. [Google Scholar]
  41. Hou, A.Y.; Kakar, R.K.; Neeck, S.; Azarbarzin, A.A.; Kummerow, C.D.; Kojima, M.; Oki, R.; Nakamura, K.; Iguchi, T. The global precipitation measurement mission. Bull. Am. Meteorol. Soc. 2014, 95, 701–722. [Google Scholar] [CrossRef]
  42. Serrano-Notivoli, R.; Beguería, S.; Saz, M.Á.; de Luis, M. Recent trends reveal decreasing intensity of daily precipitation in Spain. Int. J. Climatol. 2018, 38, 4211–4224. [Google Scholar] [CrossRef]
  43. Tavakol, A.; Rahmani, V.; Harrington, J. Changes in the frequency of hot, humid days and nights in the Mississippi River Basin. Int. J. Climatol. 2020, 40, 4715–4730. [Google Scholar] [CrossRef]
  44. Alexander, L.V.; Zhang, X.; Peterson, T.C.; Caesar, J.; Gleason, B.; Klein Tank, A.M.G.; Haylock, M.; Collins, D.; Trewin, B.; Rahimzadeh, F.; et al. Global observed changes in daily climate extremes of temperature and precipitation. J. Geophys. Res. Atmos. 2006, 111, 1–22. [Google Scholar] [CrossRef] [Green Version]
  45. Haylock, M.R.; Peterson, T.C.; Alves, L.M.; Ambrizzi, T.; Anunciação, Y.M.T.; Baez, J.; Barros, V.R.; Berlato, M.A.; Bidegain, M.; Coronel, G.; et al. Trends in total and extreme South American rainfall in 1960–2000 and links with sea surface temperature. J. Clim. 2006, 19, 1490–1512. [Google Scholar] [CrossRef]
  46. Sheather, S.J.; Jones, M.C. A Reliable Data-Based Bandwidth Selection Method for Kernel Density Estimation. J. R. Stat. Soc. Ser. B 1991, 53, 613–658. [Google Scholar] [CrossRef]
  47. Silverman, B.W. Density Estimation for Statistics and Data Analysis. J. Am. Stat. Assoc. 1988, 83, 269–270. [Google Scholar]
  48. Venables, W.N.; Ripley, B.D. Modern Applied Statistics with S, 4th ed.; Springer: New York, NY, USA, 2003; ISBN 9781441930088. [Google Scholar]
  49. Scott, D.W. Multivariate Density Estimation: Theory, Practice, and Visualization, 2nd ed.; Wiley Series in Probability and Statistics; Wiley: New York, NY, USA, 2015; ISBN 9780471547709. [Google Scholar]
  50. Araújo Palharini, R.S.; Vila, D.A. Climatological Behavior of Precipitating Clouds in the Northeast Region of Brazil. Adv. Meteorol. 2017, 2017, 17–21. [Google Scholar] [CrossRef]
  51. Palharini, R.S.A.; Vila, D.A.; Rodrigues, D.T.; Quispe, D.P.; Palharini, R.C.; de Siqueira, R.A.; de Sousa Afonso, J.M. Assessment of the extreme precipitation by satellite estimates over South America. Remote Sens. 2020, 12, 2085. [Google Scholar] [CrossRef]
  52. Machado, L.A.T.; Silva Dias, M.A.F.; Morales, C.; Fisch, G.; Vila, D.; Albrecht, R.; Goodman, S.J.; Calheiros, A.J.P.; Biscaro, T.; Kummerow, C.; et al. The CHUVA project: How does convection vary across Brazil? Bull. Am. Meteorol. Soc. 2014, 95, 1365–1380. [Google Scholar] [CrossRef]
  53. de Abreu, L.P.; Gonçalves, W.A.; Mattos, E.V.; Albrecht, R.I. Assessment of the total lightning flash rate density (FRD) in northeast Brazil (NEB) based on TRMM orbital data from 1998 to 2013. Int. J. Appl. Earth Obs. Geoinf. 2020, 93, 102195. [Google Scholar] [CrossRef]
  54. Hobouchian, M.P.; Salio, P.; García Skabar, Y.; Vila, D.; Garreaud, R. Assessment of satellite precipitation estimates over the slopes of the subtropical Andes. Atmos. Res. 2017, 190, 43–54. [Google Scholar] [CrossRef]
  55. Dinis, P.A.; Mantas, V.; Andrade, P.S.; Tonecas, J.; Kapula, E.; Pereira, A.; Carvalho, F.S. Contribution of trmm rainfall data to the study of natural systems and risk assessment. Cases of application in SW ANGOLA. Estud. Quaternário/Quat. Stud. 2013, 0, 33–43. [Google Scholar] [CrossRef]
  56. Siddique-E.-Akbor, A.H.M.; Hossain, F.; Sikder, S.; Shum, C.K.; Tseng, S.; Yi, Y.; Turk, F.J.; Limaye, A. Satellite Precipitation Data–Driven Hydrological Modeling for Water Resources Management in the Ganges, Brahmaputra, and Meghna Basins. Earth Interact. 2014, 18, 1–25. [Google Scholar] [CrossRef]
  57. Agel, L.; Barlow, M.; Qian, J.H.; Colby, F.; Douglas, E.; Eichler, T. Climatology of daily precipitation and extreme precipitation events in the Northeast United States. J. Hydrometeorol. 2015, 16, 2537–2557. [Google Scholar] [CrossRef]
  58. Kidd, C.; Becker, A.; Huffman, G.J.; Muller, C.L.; Joe, P.; Skofronick-Jackson, G.; Kirschbaum, D.B. So, how much of the Earth’s surface is covered by rain gauges? Bull. Am. Meteorol. Soc. 2017, 98, 69–78. [Google Scholar] [CrossRef] [PubMed]
  59. Fang, J.; Yang, W.; Luan, Y.; Du, J.; Lin, A.; Zhao, L. Evaluation of the TRMM 3B42 and GPM IMERG products for extreme precipitation analysis over China. Atmos. Res. 2019, 223, 24–38. [Google Scholar] [CrossRef]
  60. De Medeiros, F.J.; De Oliveira, C.P.; Gomes, R.D.S.; Da Silva, M.L.; Cabral Júnior, J.B. Hydrometeorological conditions in the semiarid and east coast regions of northeast brazil in the 2012-2017 period. An. Acad. Bras. Cienc. 2021, 93, e20200198. [Google Scholar] [CrossRef] [PubMed]
  61. Rozante, J.R.; Vila, D.A.; Chiquetto, J.B.; Fernandes, A.D.A.; Alvim, D.S. Evaluation of TRMM/GPM blended daily products over Brazil. Remote Sens. 2018, 10, 882. [Google Scholar] [CrossRef] [Green Version]
  62. Gadelha, A.N.; Coelho, V.H.R.; Xavier, A.C.; Barbosa, L.R.; Melo, D.C.D.; Xuan, Y.; Huffman, G.J.; Petersen, W.A.; Almeida, C.D.N. Grid box-level evaluation of IMERG over Brazil at various space and time scales. Atmos. Res. 2019, 218, 231–244. [Google Scholar] [CrossRef] [Green Version]
  63. Pereira, G.; Silva, M.; Moraes, E.; Cardozo, F. Avaliação dos Dados de Precipitação Estimados pelo Satélite TRMM para o Brasil. Rev. Bras. Recur. Hídricos 2013, 18, 139–148. [Google Scholar] [CrossRef]
Figure 1. Location and topography of the São Francisco River basin region and rain gauge stations.
Water 13 02714 g001
Figure 2. Spatial distributions of mean annual precipitation (2000 to 2019): (a) Rain gauges, (b) IMERG.
Water 13 02714 g002
Figure 3. Spatial distributions of (a) BIAS, (b) RMSE, (c) correlation coefficient (r), (d) POD and (e) FAR.
Water 13 02714 g003
Figure 4. Boxplot of monthly precipitation during 2000 to 2019 at each gauge (a) Água Branca, (b) Barra, (c) Barreiras, (d) Belo Horizonte, (e) Bom Jesus da Lapa, (f) Cabrobó, (g) Carinhanha, (h) Curvelo, (i) Formosa, (j) Ibipetuba, (l) Januaria, (m) Montes Claros, (n) Pão de açúcar, (o) Paracatu, (p) Petrolina, (q) Pirapora, (r) Propriá, (s) Remanso.
Water 13 02714 g004
Figure 5. Precipitation density curves observed by rain gauges and IMERG at each gauge (a) Água Branca, (b) Barra, (c) Barreiras, (d) Belo Horizonte, (e) Bom Jesus da Lapa, (f) Cabrobó, (g) Carinhanha, (h) Curvelo, (i) Formosa, (j) Ibipetuba, (l) Januaria, (m) Montes Claros, (n) Pão de açúcar, (o) Paracatu, (p) Petrolina, (q) Pirapora, (r) Propriá, (s) Remanso.
Water 13 02714 g005
Table 1. Information about the surface gauge.
MunicipalitiesLatitudeLongitudeElevation (m)Missing Data (%)
Água Branca−9.26−37.94603.428.48
Barra−11.08−43.14407.502.86
Barreiras−12.16−45.01447.514.72
Belo Horizonte−19.93−43.95915.470.01
Bom Jesus da Lapa−13.25−43.41447.750.19
Cabrobó−8.50−39.32342.786.99
Carinhanha−14.3−43.77455.254.42
Curvelo−18.75−44.45668.260.78
Formosa−15.55−47.34938.680.01
Ibipetuba−11.00−44.52450.011.47
Januaria−15.45−44.37480.000.82
Montes Claros−16.69−43.84645.871.85
Pão de açúcar−9.75−37.4320.869.75
Paracatu−17.24−46.88711.410.34
Petrolina−9.39−40.52372.540.10
Pirapora−17.35−44.92509.527.85
Propriá−10.21−36.8418.460.06
Remanso−9.63−42.08397.390.51
Table 2. Estimates of the parameters (β0 and β1) of the linear regression model, the determination coefficient (R2), correlation coefficient (r), the corresponding p-value.
Municipalitiesβ0 β1R2rp-Value
Água Branca59.000.700.170.42<0.05
Barra−1.600.860.860.93<0.05
Barreiras−1.600.940.880.94<0.05
Belo Horizonte1.501.100.880.94<0.05
Bom Jesus da Lapa0.260.900.870.93<0.05
Cabrobó4.700.810.760.87<0.05
Carinhanha−3.000.990.840.92<0.05
Curvelo1.000.920.830.91<0.05
Formosa−0.320.990.850.92<0.05
Ibipetuba−1.200.000.790.89<0.05
Januaria−4.200.930.930.97<0.05
Montes Claros−1.800.940.900.95<0.05
Pão de açúcar21.000.650.430.66<0.05
Paracatu−0.540.960.910.95<0.05
Petrolina2.000.820.820.90<0.05
Pirapora−2.800.940.920.96<0.05
Propriá35.000.890.460.68<0.05
Remanso2.600.000.840.92<0.05
Publisher’s Note: MDPI stays neutral with regard to jurisdictional claims in published maps and institutional affiliations.

