Article

Thermophilic Anaerobic Co-Digestion of Exhausted Sugar Beet Pulp with Cow Manure to Boost the Performance of the Process: The Effect of Manure Proportion

by
Xiomara Gómez-Quiroga
1,*,
Kaoutar Aboudi
1,
Luis Alberto Fernández-Güelfo
2,
Carlos José Álvarez-Gallego
1 and
Luis Isidoro Romero-García
1
1
Department of Chemical Engineering and Food Technology, Faculty of Sciences, Wine and Agri-Food Research Institute-IVAGRO, International Campus of Excellence-ceiA3, University of Cádiz, Republic Saharawi Avenue, P.O. Box 40, 11510 Puerto Real, Cádiz, Spain
2
Department of Environmental Technologies, Faculty of Marine and Environmental Sciences, Wine and Agri-Food Research Institute-IVAGRO, International Campus of Excellence-ceiA3, 11510 Puerto Real, Cádiz, Spain
*
Author to whom correspondence should be addressed.
Water 2021, 13(1), 67; https://doi.org/10.3390/w13010067
Submission received: 27 November 2020 / Revised: 24 December 2020 / Accepted: 27 December 2020 / Published: 31 December 2020
(This article belongs to the Special Issue Enhancement of Anaerobic Digestion for Energy and Resource Recovery)

Abstract

:
Sugar beet by-products are a lignocellulosic waste generated from sugar beet industry during the sugar production process and stand out for their high carbon content. Moreover, cow manure (CM) is hugely produced in rural areas and livestock industry, which requires proper disposal. Anaerobic digestion of such organic wastes has shown to be a suitable technology for these wastes valorization and bioenergy production. In this context, the biomethane production from the anaerobic co-digestion of exhausted sugar beet pulp (ESBP) and CM was investigated in this study. Four mixtures (0:100, 50:50, 75:25, and 90:10) of cow manure and sugar beet by-products were evaluated for methane generation by thermophilic batch anaerobic co-digestion assays. The results showed the highest methane production was observed in mixtures with 75% of CM (159.5 mL CH4/g VolatileSolids added). Nevertheless, the hydrolysis was inhibited by volatile fatty acids accumulation in the 0:100 mixture, which refers to the assay without CM addition. The modified Gompertz model was used to fit the experimental results of methane productions and the results of the modeling show a good fit between the estimated and the observed data.

1. Introduction

Anaerobic co-digestion (AcoD) of lignocellulosic biomass and animal manure to produce biogas has gained increasing recognition over the years thanks to the synergy produced between this type of wastes, creating a positive energy balance, which leads to a high yield of biogas and elimination of organic matter. The anaerobic digestion (AD) process is defined in the literature as a complex biological process of four stages: hydrolysis, acidogenesis, acetogenesis, and methanogenesis. Moreover, the AD process involves a wide variety of micro-organisms acting individually and/or in parallel in the consumption of organic matter to produce biogas [1,2]. One of the main factors influencing the performance of the AD process lies on the inhibition due to the accumulation of volatile fatty acids (VFA). Zhao et al. [3], reported that AD of agro-industrial waste could lead to an inhibition of the process due to its high carbon content since VFAs are derived from organic carbon. AcoD can be considered as an improvement of the AD due to several considerations such as the optimization in the nutritional balance of the microorganisms in the system, the maintenance of a resistant microbial mixture in the reactor, the balance between the four phases of the AD process, and the improvement of the biomass biodegradability [4]. All these aspects are directly influenced by the characteristics of the co-substrates used.
Exhausted sugar beet pulp (ESBP) is classified as lignocellulosic biomass. However, this type of high-value agro-industrial waste is difficult to degrade in AD due to its hemicellulose, cellulose, and lignin content [5,6]. Whereas the cattle manure, another organic waste that has been widely studied in the AD process, is characterized by its high energy density and nutrient content, as well as being easily accessible [7]. Therefore, the use of residues such as cattle manure as a co-substrate in AcoD offers buffer capacity and a source of additional microorganisms/enzymatic capacity to the anaerobic process [1,8].
Cow manure (CM) is one of the most interesting wastes that is used as a co-substrate in the anaerobic co-digestion of agro-industrial waste [9,10]. In the Statistical Yearbook of Spain 2019, they reported that in Spain there are more than 6 million heads of cattle [11]. Therefore, the use of CM in AcoD processes would help to mitigate the negative effects on climate change in the country due to GHG emissions from CM during storage and processing [8].
Li et al. [12] investigated the co-digestion of rice straw with cow dung (VS ratio (1:1)) and obtained a 9.6% improvement in methane production yield with respect to anaerobic digestion of rice straw individually. In the same line, Akyol et al. [13] reported that the co-digestion process of cow dung and barley was more efficient in all the mixing ratios studied (cow dung:barley ratios of 1:1, 2:1 and 1:2) compared to the mono-digestion of cow dung with an improvement in the specific CH4 production of 35%, 31% and 22.8%, respectively. Moreover, they reported that the high acidification in the reactors was from the barley, but there was no accumulation of volatile fatty acids at the end of the digestion. In another study of co-digestion of tomato and maize stubble residues with cow dung, they found that the mixtures containing 13%, 33% and 54% of cow dung have 10.2, 0.9 and 0.5 times higher methane yield than the digestion of individual substrates, respectively [14]. In a study of Wang et al. [15], they investigated the co-digestion of cattle manure, chicken manure, and wheat straw and reported that co-digestion improved process yield due to the synergistic effect of these substrates. Similarly, Montoro et al. [16] reported that AcoD of dairy manure and sweet potato had positive synergistic effects, increased buffer capacity and the nutrients balance in the system, leading to improve the substrates biodegradation.
Several researchers have studied the influence of temperature on the anaerobic co-digestion of agro-industrial waste. Li et al. [17] reported that operating under thermophilic conditions can help in the degradation of recalcitrant material in the hydrolysis phase of the AD of waste classified as lignocellulosic biomass. However, if there is no balance between the hydrolysis, acidogenesis, and methanogenesis phases there may be the accumulation of VFAs, delaying the AD process and lowering methane productivities. Chuenchart et al. [18] studied the mono-digestion and co-digestion of chicken manure and food waste under thermophilic conditions and reported that the process was better in co-digestion thanks to the syntrophic association between the oxidants of the substrate and hydrogenic methanogens, these methanogens use carbon dioxide and hydrogen produced by the acetoclastic bacteria for their transformation into methane. The presence of these methanogens is due to the fact that the process of syntrophic oxidation of acetate is common in thermophilic conditions.
In another study, they report that temperature as a variable in the AD process is a critical factor that affects the rate, reaction, and activity of microorganisms. Thus, high-temperature conditions accelerate the hydrolysis stage resulting in higher yields of methane and elimination of pathogens. Nevertheless, compared with mesophilic processes, thermophilic temperatures present instability of the process by being more sensitive to changes that may occur in the reactor, such as the accumulation of VFAs [19].
With regard to the problems of inhibition by the accumulation of VFAs in AD mentioned above, Fdez-Güelfo et al. [20] used interesting parameters as criteria to identify the stage of the AD process that causes destabilization of the system. These parameters are the dissolved acid carbon (DAC) which refers to the sum of the carbon present in the VFAs form, the dissolved organic carbon (DOC) which refers to the concentration of solubilized carbon in the hydrolysis stage, and the carbon as acid substrate (ASC) which refers to the difference between DOC and DAC. Angeriz-Campoy et al. [21] used these parameters in their research on AD of food wastes and reported that high values of ASC are related to an imbalance between the hydrolysis and acidogenesis stages.
The objective of this study is to evaluate the effect of cow manure as co-substrate in the thermophilic anaerobic co-digestion with exhausted sugar beet pulp at four different mixtures. In addition, indirect and kinetic parameters have been evaluated aiming to understand the balance between the different AD steps and compare experimental and predicted data, respectively. In this study, it is highlighted that the use of CM as a co-substrate in the anaerobic digestion of ESBP helped in the stabilization of the anaerobic process and in the degradation of VFA into methane. It should be borne in mind that the use of thermophilic temperature conditions in co-digestion of sugar-beet by-products with cow manure has not been addressed previously.

2. Material and Methods

2.1. Substrates

Exhausted sugar beet pulp (ESBP) was provided by AB SugarTM from its factory located in Jerez de la Frontera (Cádiz, Spain). The substrate was presented in small cylindrical dry pellets which were stored at −20 °C prior their use. A 24 h rehydration procedure was applied in order to obtain the final total solids content of 8% [22]. On the other hand, the cow manure (CM) was collected from a medium sized local farm located in El Puerto Santa María (Cádiz, Spain) where the liquid slurry was discarded in an industrial sedimentation tank. CM was also stored at −20 °C.
Inoculum for batch tests was sampled from a semicontinuous thermophilic anaerobic digester operating at 30-days hydraulic retention time and fed with a CM:ESBP mixture at 8% a wet weight proportion of 90:10. This inoculum reactor was operated in a stable way during a year.
Physicochemical characteristics of substrates and inoculum are shown in Table 1.

2.2. Experimental Design

Four duplicated batch tests were performed in order to study the effect of adding different proportions of CM on anaerobic digestion of ESBP.
The tested mixtures (CM:ESBP) were 0:100, 50:50, 75:25, and 90:10. All the tests were carried out at 8% TS content by initial distilled water addition. Table 2 shows the characterization of initial substrates in each condition.

2.3. Experimental Device and Procedure

Eight stainless steel reactors (1.7 L working volume) were used for the assays. Temperature (55 °C) and agitation (20 rpm) were electronically controlled in each reactor. The stirring system consists of a central shaft with blades. The temperature was controlled by a PID control system, by means of a PT-100 probe that was inserted inside the vessel of the reactor. The heating system consists of a heating plate located at the base of the reactor that distributed the heat evenly throughout the cylindrical body of a stainless steel jacket that surrounds the reactor. The reactor cover is made of glass with several input/output ports that were used for the temperature control, sampling, safety valve, and biogas outlet.
Inoculation ratio was fitted to 50% (wet weight proportion) and initial pH was not fixed in order to observe the initial spontaneous reaction of anaerobic assays, although these were subsequently controlled. Therefore, a pH of 7.0 was established as a minimum value and lower values were daily adjusted by adding K2CO3 to the reactors.
The air in the headspace was displaced by nitrogen at day 0 and every time reactors were opened for sampling purpose.

2.4. Analytical Methods

Biogas composition and production was measured through an on-line device. Specific CH4, H2, and CO2 sensors (BCP-series, Bluesens®, Germany) were placed in biogas line and volumetric on-line totalizers (Milligascounter®, Ritter®, Germany) were used for gas production measurement.
Volatile and total solids (VS and TS), total and soluble chemical oxygen demand (COD and sCOD), dissolved organic carbon (DOC), total Kjeldahl nitrogen (TKN), alkalinity and pH were measured according to APHA-AWWA-WPCF Standard Methods [23].
A total organic carbon (TOC) analyzer (Analytik-Jena® multi N/C 3100, Germany) was used for the dissolved organic carbon (DOC) determination and gas chromatography was applied for volatile fatty acids (VFAs) determination. Acetic (C2), propionic (C3), isobutyric (iC4), butyric (C4), isovaleric (iC5), valeric (C5), isocaproic (iC6), caproic (C6), and heptanoic (C7) individual acids were measured in a FID-GC (Shimadzu® GC-2010, Japan) [22].
Fiber content analysis (cellulose, hemicellulose, protein/pectin, and lignin) was performed according to Van Soest method [24] in a fiber digester (FIBERTEC 8000, FOSS®, Spain). Fiber content fractioning was measured only for the initial characterization.
All the analysis in solid samples were performed three times a week except for pH measurement which was daily determined inside the reactor.
Samples for VFAs, DOC and sCOD measurement were previously centrifuged (3220 g during 15 min) and filtered by 0.45 μm (Durarpore® PVDF Millipore®, USA). In addition, samples for VFAs analysis were filtered again by 0.22 µm (Syringe PTFE filter, Millipore® USA) [25].

2.5. Statistical Analysis

Duplicates were performed to ensure reproducibility. One-way variance analysis (ANOVA: single factor) was applied using Microsoft® Excel® software to determine statistical differences in the results obtained from different proportions of CM and ESBP tested. This test consisted of obtaining a statistical value F, which reflects the degree of similarity between the means that have been compared. If the probability level (p) associated with the F-value is less than 0.05, the hypothesis of equality of means is rejected [26].

2.6. Methane Production Modelling

Modified Gompertz model [27,28,29] equation was used for kinetic modelling. Equation (1) was fitted to experimental methane production data.
Y ( t ) = Y × e x p { e x p ( R m × e Y   ( λ t ) + 1 ) }
where Y(t) is the accumulated CH4 production (mL), Y is the maximum potential CH4 production (mL), Rm is the maximum production rate (mL/d), e is the Euler number (e ≈ 2.71828), λ is the lag phase time (d), and t is the time (days). The model fitting was performed by STATISTICA® software.

2.7. Indirect Parameters

A set of indirect parameters has been defined to analyze the evolution of the anaerobic process and identifying the limiting phase [21]. According to Fdez-Guelfo et al. [20], acidogenic substrate as carbon (ASC) and dissolved acid carbon (DAC) could be used to deepen in explaining how hydrolysis and acidogenesis stages are carried out in well-balanced or destabilized anaerobic reactors.
DAC is estimated as the weighted sum of C2–C7 individual VFAs expressed in carbon units. On the other hand, ASC is the fraction of solubilized organic matter that has not been converted into VFAs. ASC values are determined by the difference between DOC and DAC parameters. DAC and ASC formulas are shown in Equation (2) and Equation (3), respectively:
D A C = i = 2 i = 7 A i H × n i × 12 M W i
A S C = D O C D A C = D O C i = 2 i = 7 A i H × n i × 12 M W i
AiH is the individual concentration of each VFA (C2–C7)—it must be noted than isoacids has been included in linear acids—ni is the number of carbons and MWi is the molecular weight. DAC, ASC, and DOC are expressed as concentrations (M/L3).
A well-balanced batch anaerobic process runs with a slight or not detected initial increase in DAC concentration and a stable and very low level of ASC concentration. Once the process turns to imbalanced process, DAC and ASC accumulations could be observed. In a partial or totally inhibited batch reactor, if the acidogenic stage is limited or inhibited, ASC shows a clear increase (located in a period or maintained in time) with DAC consumption or not. In the case that the hydrolysis is affected, ASC is very low meanwhile DAC could very much higher.

3. Results and Discussion

3.1. Substrate Characterization

The characteristics of CM, ESBP, and the inoculum used are shown in Table 1. The results indicate that ESBP has a higher content of organic matter than CM in terms of VS and solubilized organic matter (sCOD). However, the C:N ratio of ESBP is 28.66, falling within the optimum range 20–30 for anaerobic digestion.

3.2. Statistical Significance of Results from Batch Tests

An ANOVA analysis has been used to determine if there are statistically significant differences between the mean values of the different parameters (pH, TVFA, Alkalinity, and sCOD) in the two reactors used for each mixture tested. The results are shown in Table 3.
The ANOVA analysis indicates that the results between replicates do not present statistically significant differences for a confidence level of 95%. The only case for which the data are not comparable is the sCOD for the 10:90 mix (p < 0.05). The reason could be that, in this case, there was an error in the experimental determination of the COD of one of the reactors, therefore, only data from one reactor is available.

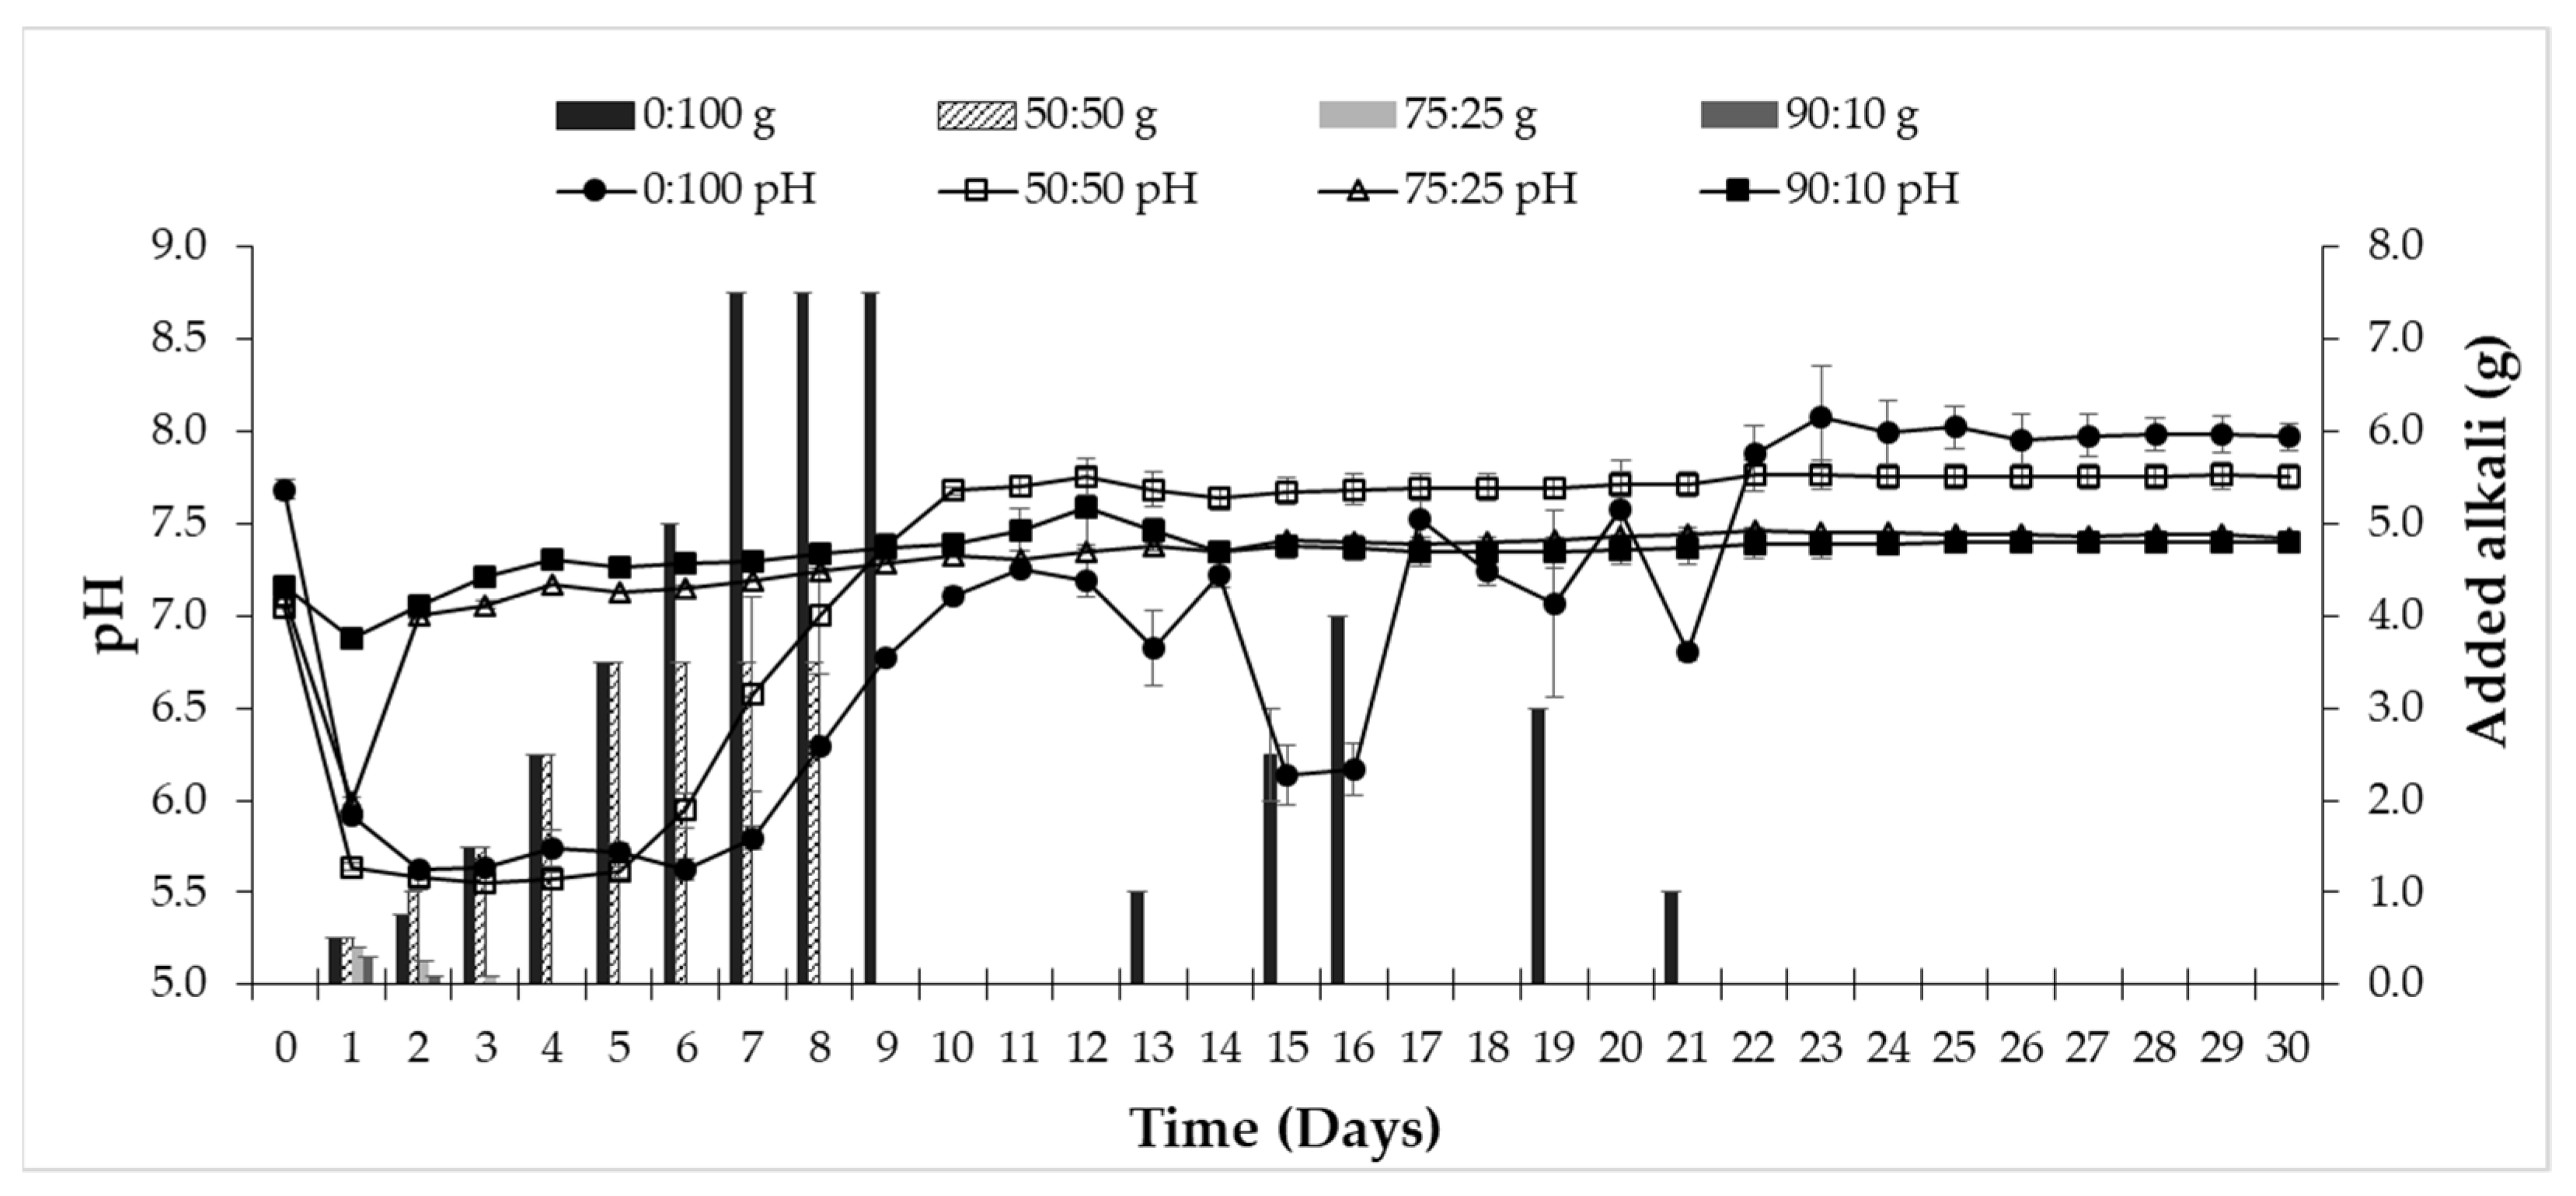
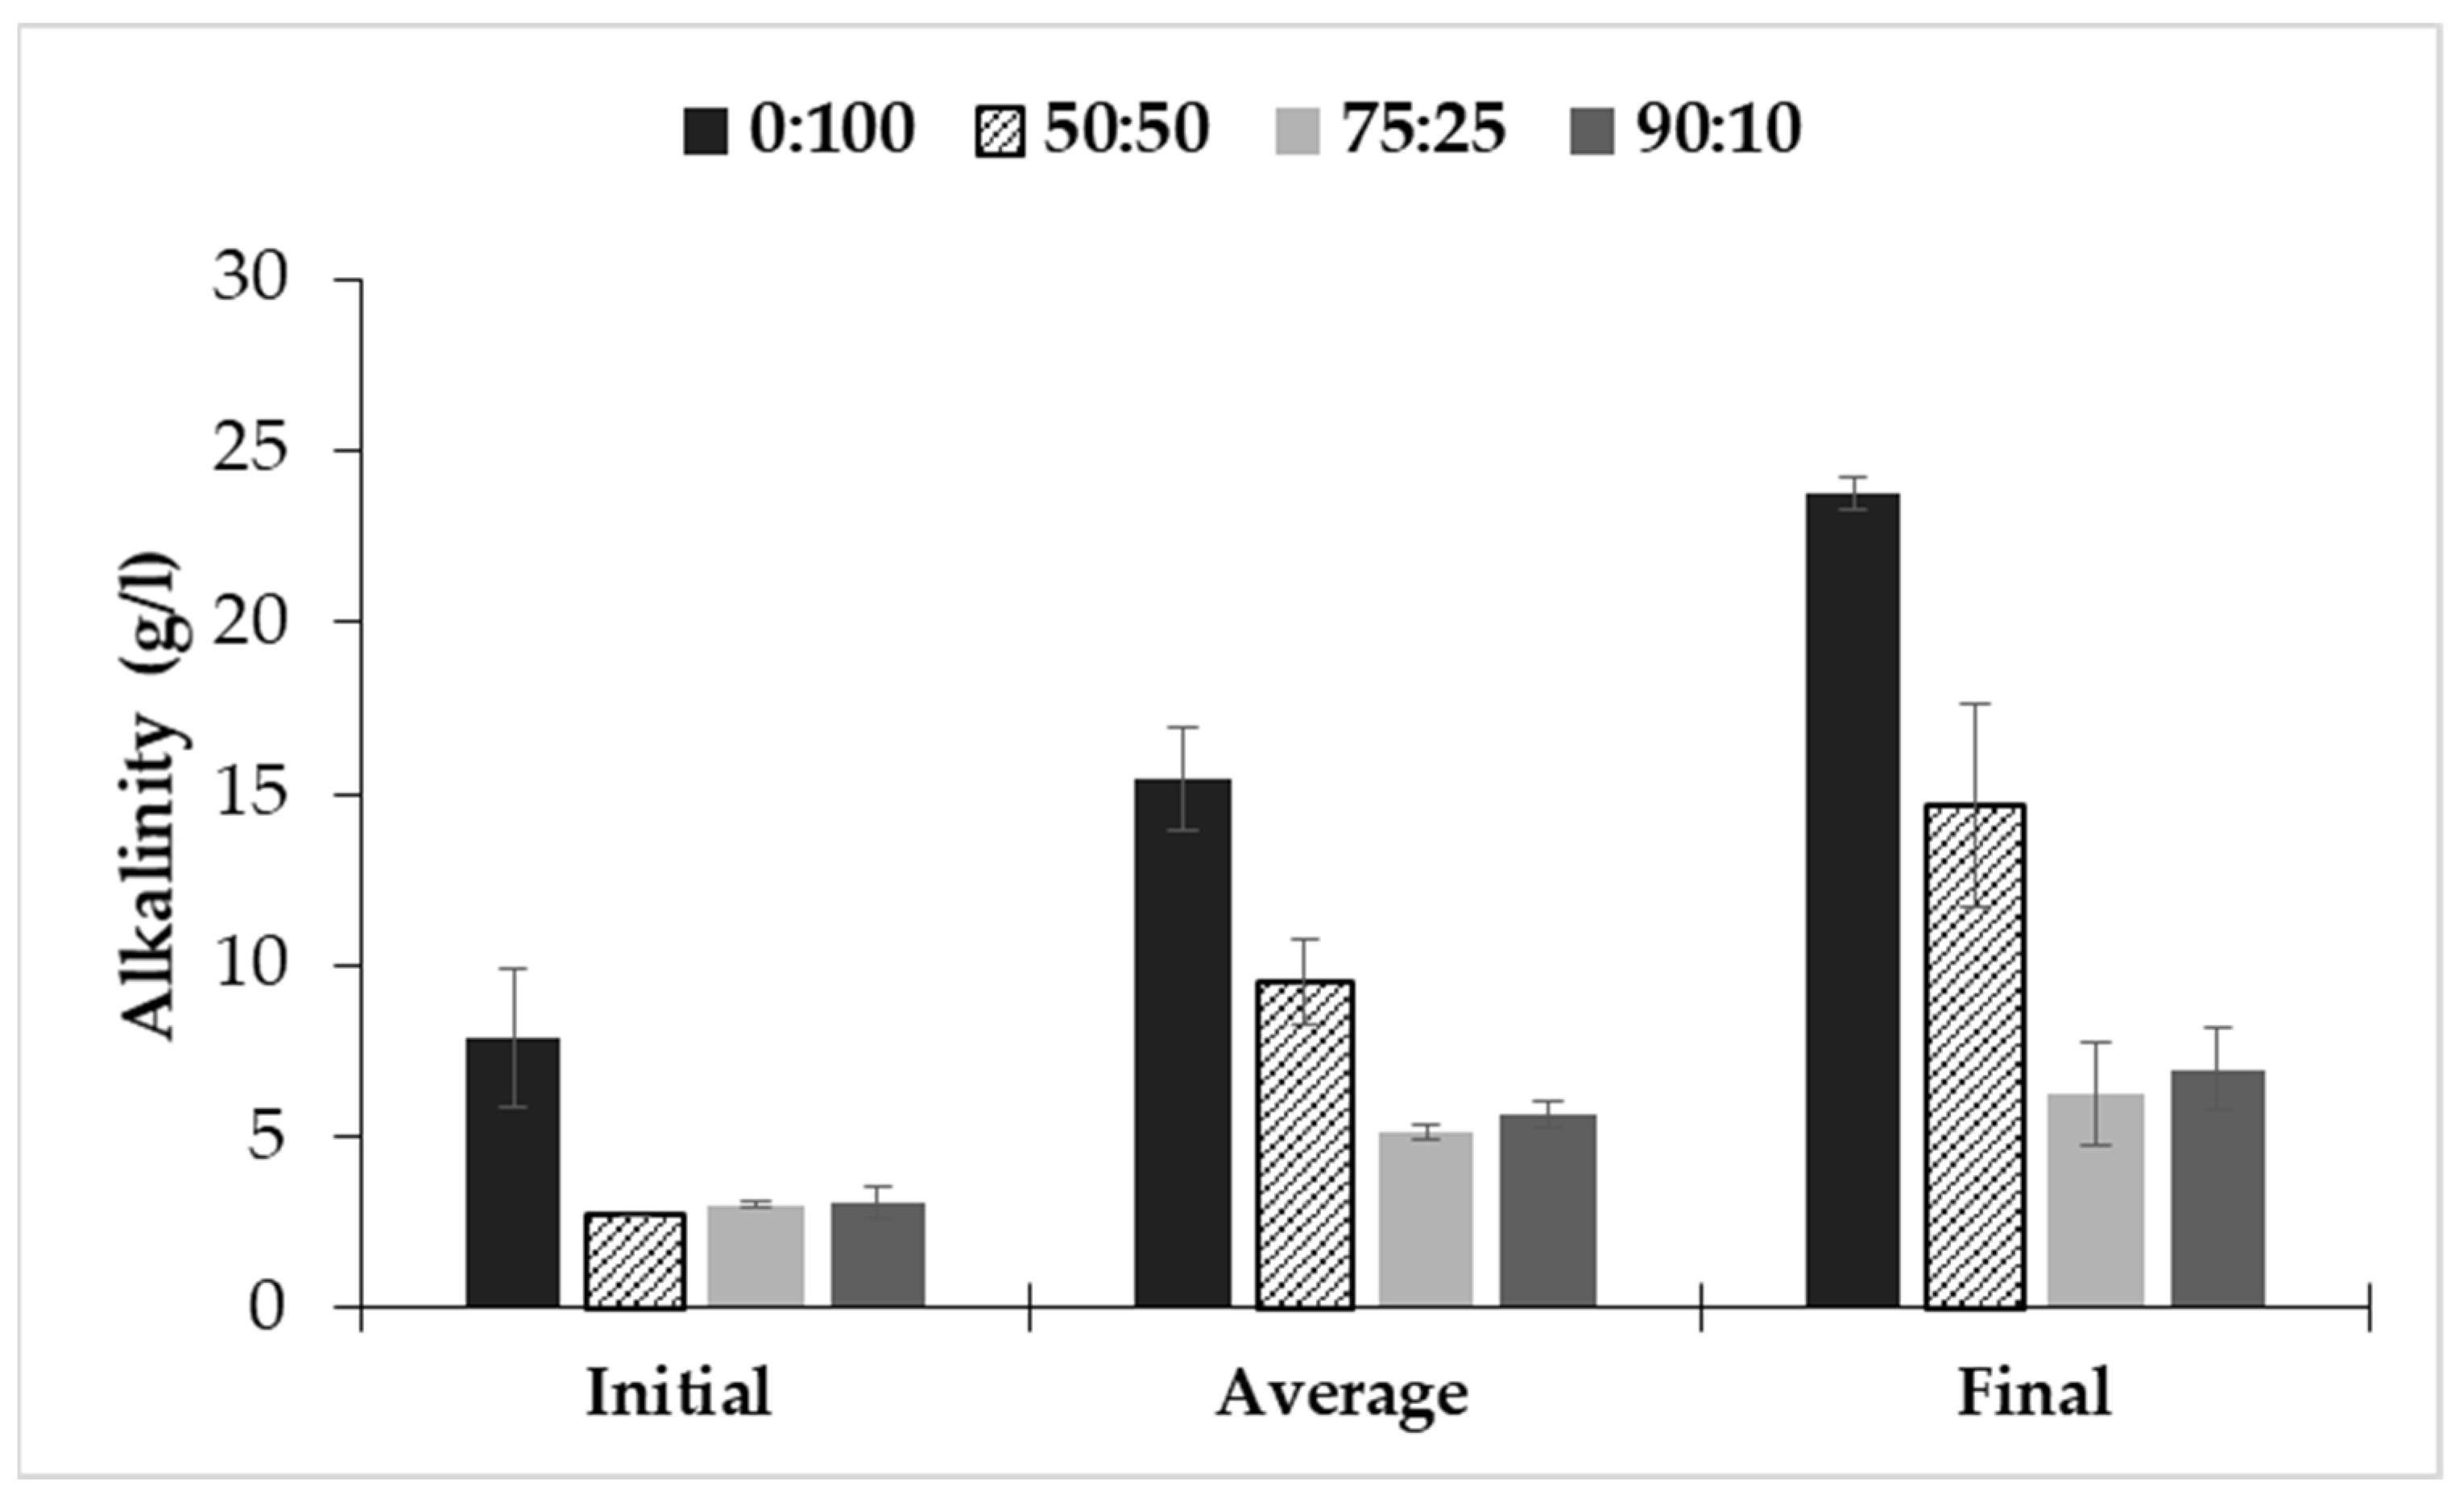
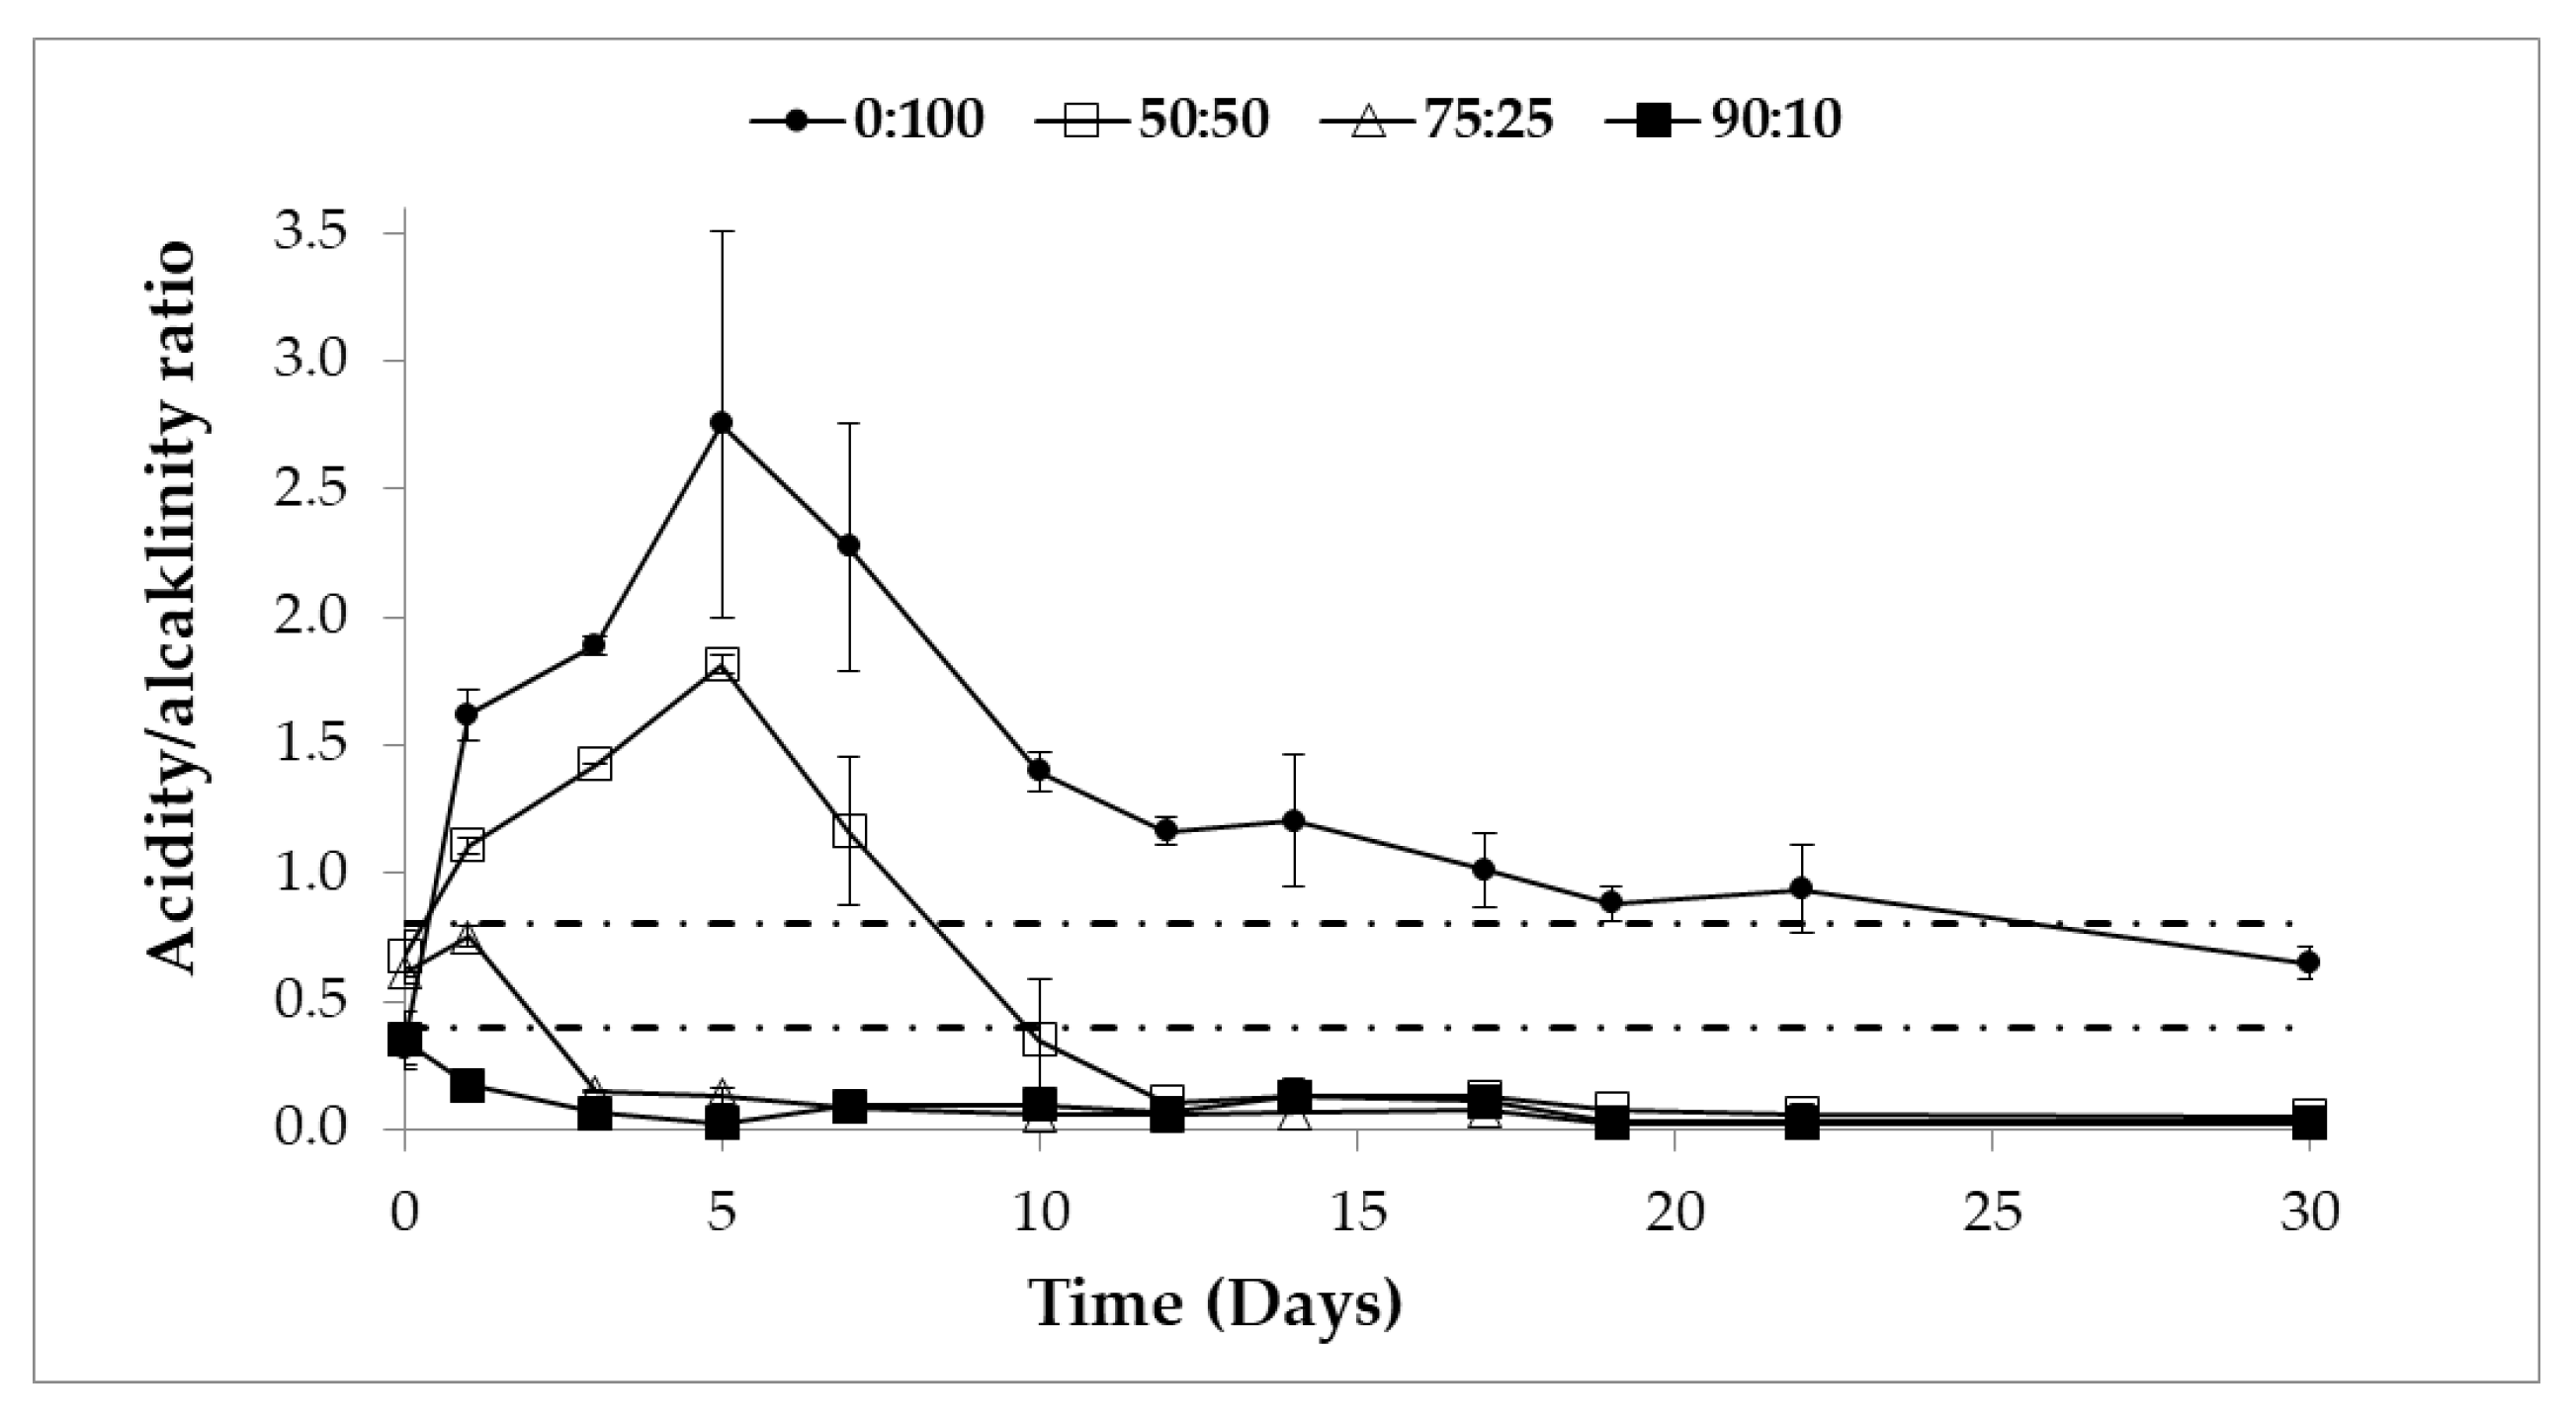
3.3. pH and Total Acidity (TVFA) in Anaerobic Co-Digestion of Exhausted Sugar Beet Pulp and Cattle Manure

Figure 1 shows the pH evolution together with the addition of alkali performed in each test for the different mixtures studied.
As can be seen, initially (first two days) there is a decrease in the pH value for all reactors. However, for the 90:10 and 75:25 mixtures, the drop in pH was lower due to the buffering capacity provided by the CM.
The optimal pH range for the activity of methanogenic microorganisms and biogas production is 6.5–8.0 [30]. The addition of K2CO3 was necessary to prevent destabilization of the process due to the fast initial hydrolysis of the more easily degradable fractions. The potassium carbonate additions had to be higher and held for longer the higher the ESBP content in the mixture. Therefore, the neutralization requirements of the reactors and the time required for pH stabilization to be achieved were different for the different reactors. Thus, the pH stabilized at values suitable for the process (around 7.3) [31] on the third day of testing for the 90:10 and 75:25 mixtures, while 10 days were required for the 50:50 mixture. For the 0:100 assay, the pH approached 7.0 on day 12, after multiple additions of the alkaline agent, but subsequently, it dropped again and did not stabilize until day 22 of the test.
The pH is closely related to the formation of volatile fatty acids (VFAs) due to the decomposition of organic matter [32]. Thus, the decrease in pH in the first days of the tests was due to the production and accumulation of VFAs, as can be seen in Figure 2. VFA production is more pronounced in the reactors with a higher content of organic matter (i.e., higher content of ESBP). This causes higher requirements for the addition of alkaline agent for its neutralization, as well as the delay in reaching the stabilization of the pH at suitable values in the 0:100 and 50:50 mixtures, with respect to the other reactors.
Alkalinity is a variable of great importance for the stability of the anaerobic digestion process. A high value of alkalinity allows the system to be able to absorb the production of VFAs, without producing sharp drops in pH. In general, operating at thermophilic range (55 °C) a higher alkalinity value is required to maintain the stability of the process and to avoid the acidification caused by the production of VFAs. This fact is related to the increase in hydrolysis and acidogenesis rates when operating in the thermophilic range. Figure 3 shows the initial, average, and final alkalinity data for the different co-digestion mixtures.
The initial alkalinity levels for the different substrate mixtures (CM: ESBP) ranged between 2.64 and 3.50 g/L. These values can be considered adequate. Thus, Lorenzo and Obaya [33] reported that the alkalinity in an AD process should be close to 2 g/L.
As can be seen in Figure 3, the alkalinity increases in all the tests from the initial to the final stage. The increase is related to the production and solubilization of carbon dioxide in the medium in addition to the amounts of potassium carbonate added. Therefore, the increase is higher in tests with higher content in ESBP. As a consequence, maximum increases were produced for 0:100 and 50:50 mixtures.
Figure 4 shows the evolution of the Acidity/Alkalinity ratio for the different tests. In the literature [34], this parameter is used as a stability criterion for the anaerobic digestion process, since it relates the total volatile acidity in the medium with its buffering capacity.
The relationship between the total content of VFAs and the alkalinity shows a different trend for the different mixtures tested. Thus, in Figure 4 it can be observed that, as the percentage of CM in the mixtures increases, the maximum value reached in the Acidity/Alkalinity ratio decreases. Zhao and Viraraghavan [35] reported that if the acidity/alkalinity ratio exceeds 0.8, the pH drops sharply followed by a clear inhibition in methane production and the process fails. Increases above 0.3–0.4 indicate a system failure and the need for a corrective action. A suitable ratio is considered to be between 0.1 and 0.2.
Zhu and Jha [36] also agree that values higher than 0.8 can lead to inhibition of the anaerobic process. Other researchers [37] report that a ratio of less than 0.4 is considered optimal for liquid anaerobic digestion.
Schoen et al. [38] used the acidity/alkalinity ratio in a mathematical anaerobic digestion model (ADM1) to evaluate the stability of two digesters: one from a municipal WWTP and the other from a laboratory-scale reactor fed with cattle manure. They considered values between 0.1 and 0.4 indicate favourable operating conditions, whereas increases above 0.4 indicate discomfort and the need for corrective action, and if the ratio exceeds 0.8, an inhibition in the process may occur; in their study they found an imminent failure when they exceeded the value of the 0.9 ratio.
Camacho et al. [39] studied the use of cow manure as inoculum in the dry thermophilic anaerobic digestion of municipal solid waste. The acidity/alkalinity ratio increased exceeding the value of 0.8 having to take corrective actions over pH.
According to the aforementioned studies, it has been corroborated that values of the Acidity/Alkalinity ratio in the range between 0.1 and 0.4 are suitable for a proper operation and values in the range between 0.4 and 0.8 are indicative of a digester distortion. Finally, values above 0.8 indicate that the system is inhibited.
In this study, an initial increase in the acidity/alkalinity ratio is observed in all the tests, which is more pronounced the higher the ESBP content in the mixture.
These increases are directly related to the drop in pH values observed in this same period of time (Figure 1). The pH correction required the addition of an alkali (K2CO3) that contributed to the increase in alkalinity and buffer capacity of the systems, allowing to neutralize the VFAs generated and stabilizing the acidity/alkalinity ratio. Thus, the 90:10 mixture was kept at all times within the range of suitable values for the process (0.1–0.4). For the 75:25 mixture, an initial increase is observed that causes the ratio to momentarily rise above 0.4, but which quickly (on the third day of testing) stabilized below 0.15. For the 50:50 and 0:100 mixtures, the behavior is different and the increase in the acidity/alkalinity ratio widely exceeds the limit value of 0.8 and continues to increase until day 5, despite the daily additions of the alkaline agent. For day 5 of operation, the maximum is reached in both tests (1.81 for 50:50, and 2.75 for 0:100).
From that moment, it is observed that the value of the ratio begins to decrease in both tests, probably as a consequence of the addition of potassium carbonate and after day 10 of operation, it is achieved that the 50:50 test is below the value 0.4. However, for the 0:100 test, the decrease in the ratio is slower and remains above 0.8 for practically the entire operating time, indicating the existence of a more pronounced inhibition, due to the accumulation of VFAs in the medium.
Figure 2 shows the individual evolution of the VFAs and the total volatile acidity of the studied mixtures. The four major organic acids produced in the different tests were the following: acetic, propionic, butyric, and valeric. The major VFA produced was, in all cases, acetic acid, while valeric acid was present in very low concentrations and only had a certain importance in the 50:50 and 0:100 tests.
Acetic acid is usually the most generated intermediate in many co-digestion studies, for example in the co-digestion of cotton stalk and pig manure [40].
The trend for each of the individual VFAs is very similar to that observed for total acidity in each test. In Figure 2, it can be seen that the highest production and accumulation of volatile acids took place for the 0:100 assay.
Furthermore, the inhibitory character of VFAs on methanogenic microorganisms increases as a consequence of the associated decrease in pH [12]. In this sense, it must be taken into account that the undissociated forms of the organic acids have a more pronounced inhibitory effect, and that these increase when the pH is lower [41].
The 0:100 assay shows a significant accumulation of all the individual fatty acids analyzed. This accumulation is maintained practically until the end of the test, detecting only a slight decrease in the last value determined after 30 days of testing, although the TVFA continues at values higher than 15 g/L. These high TVFA values may be related to the inhibition of acetoclastic methanogenesis [42]. Li, X. et al. [43] reported that in the AD process, valeric acid is not normally generated in appreciable amounts and that the formation of this VFA is due to the reversibility of the biochemical reactions of acetic acid, propionic acid, and hydrogen.
It is important to note that in the case of the 50:50 mixture, acid concentrations above 10 g/L have been reached in the first days, which clearly fall within the range of methanogenic inhibition [44,45,46,47]. However, the biological system has been able to reverse the situation by consuming these acids in a very short time. This behavior is different from that observed for the 0:100 assay for which a higher value of TVFA is reached (greater than 23 g/L) and the system is not able to recover itself and degrade them effectively during the 30-day period.
The maximum TVFA reached in the tested mixtures increased as a function of the proportion of ESBP in the mixture, which is related to the carbohydrate content of this substrate [48].
The maximum TVFA concentration is also reached for different times in each mixture. Thus, for the 90:10 mixture, the TVFA concentration constantly decreases from the initial value of 1.01 g/L. For the 75:25 mixture, the maximum is reached on the first test day with a value of 3.07 g/L, but the VFAs were rapidly degraded. For the 50:50 mixture, the maximum is reached between days 5 and 7, with an average value of 10.30 g/L. Finally, for the 0:100 assay, the maximum is reached and maintained between days 7 and 14, reaching an average value of 23.63 g/L.
In a study of co-digestion of ESBP with cow manure in the mesophilic range, Aboudi et al., [49] reported that the maximum TVFA achieved for the mixture (CM:ESBP) 0:100 was 15.29 g/L which is slightly minor, but comparable, to the data obtained in this study. In stable anaerobic reactors, the VFAs produced by acidogenic bacteria should be consumed by the action of the acetoclastic methanogenic archaea, reaching a low level from the first days. This behavior was observed in the 90:10 and 75:25 mixtures, and it denotes a good coupling of the acidogenic and methanogenic activities. However, the temporary accumulation of undegraded VFAs for extended periods of time implies an imbalance between the activities of acidogenic bacteria and methanogenic archaea, as occurs in reactors with lower CM content (0:100 and 50:50) (Figure 2).
Regarding the evolution of the different individual VFAs, the following can be discussed:
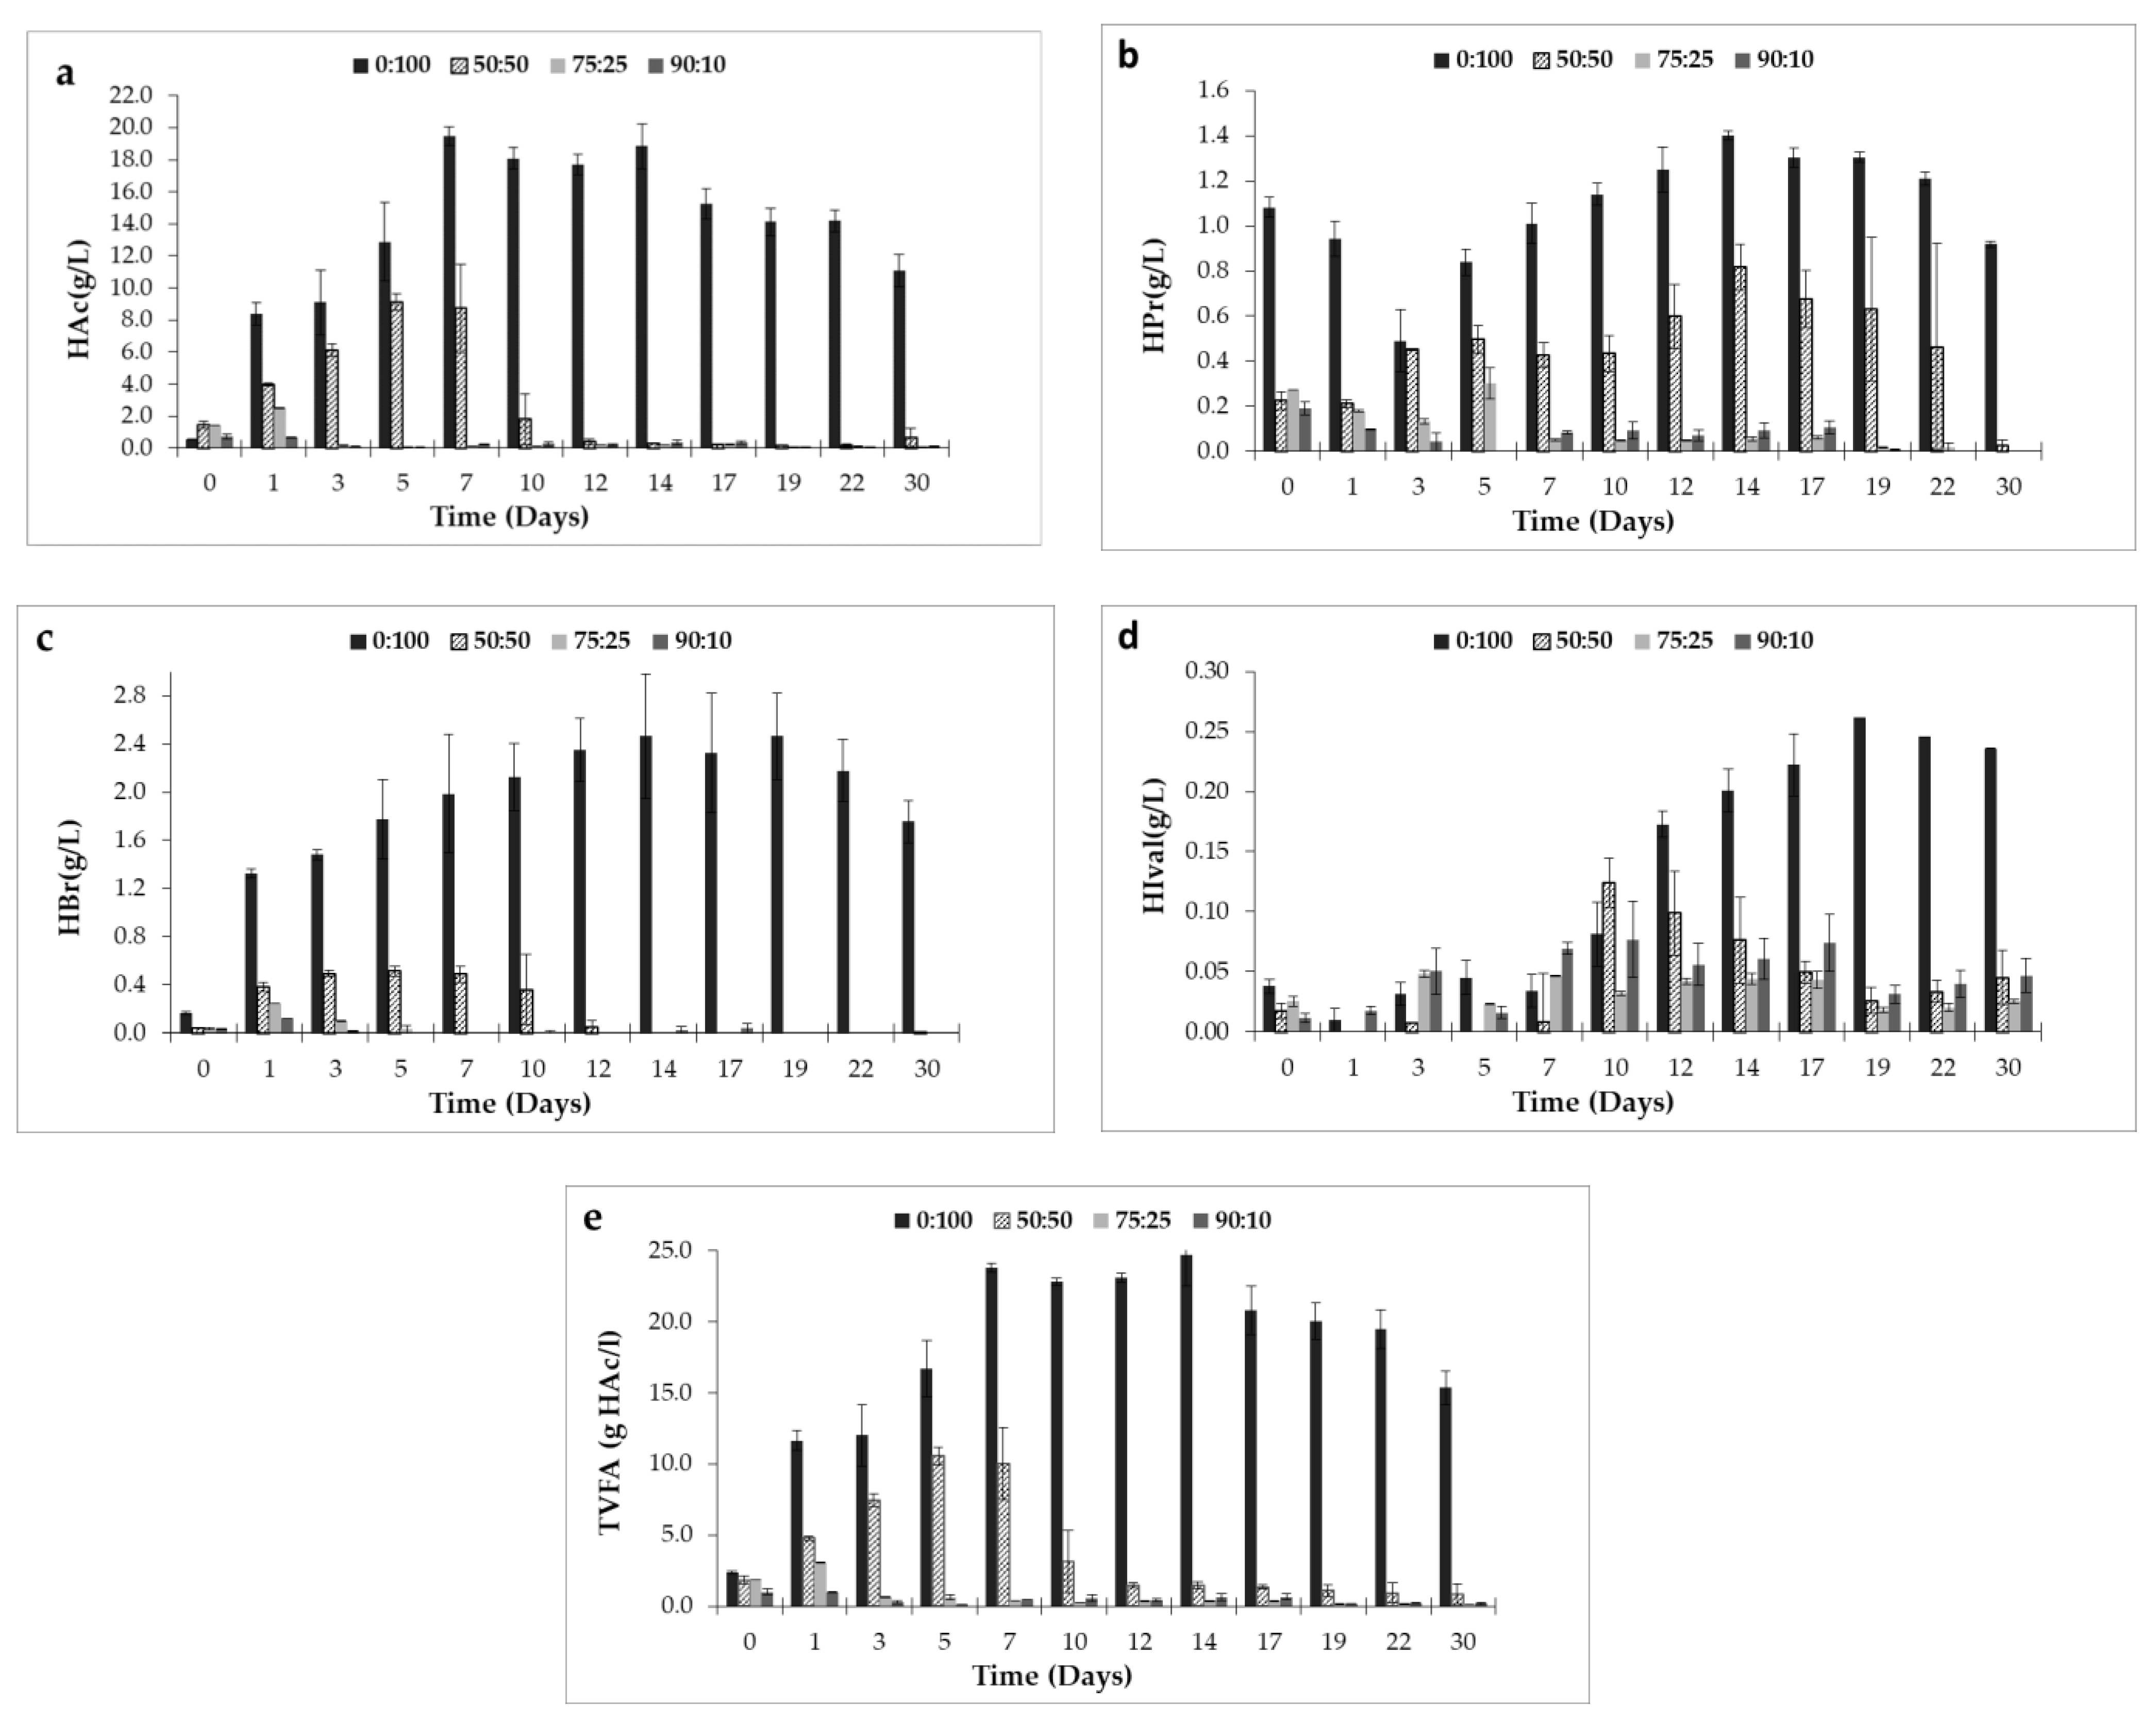
  • Acetic acid is clearly, the principal acid in all the tests and its evolution is, therefore, very similar to that already mentioned for TVFA.
  • Butyric acid reaches much lower values (an order of magnitude lower) but its evolution is practically the same that for acetic acid, in all cases.
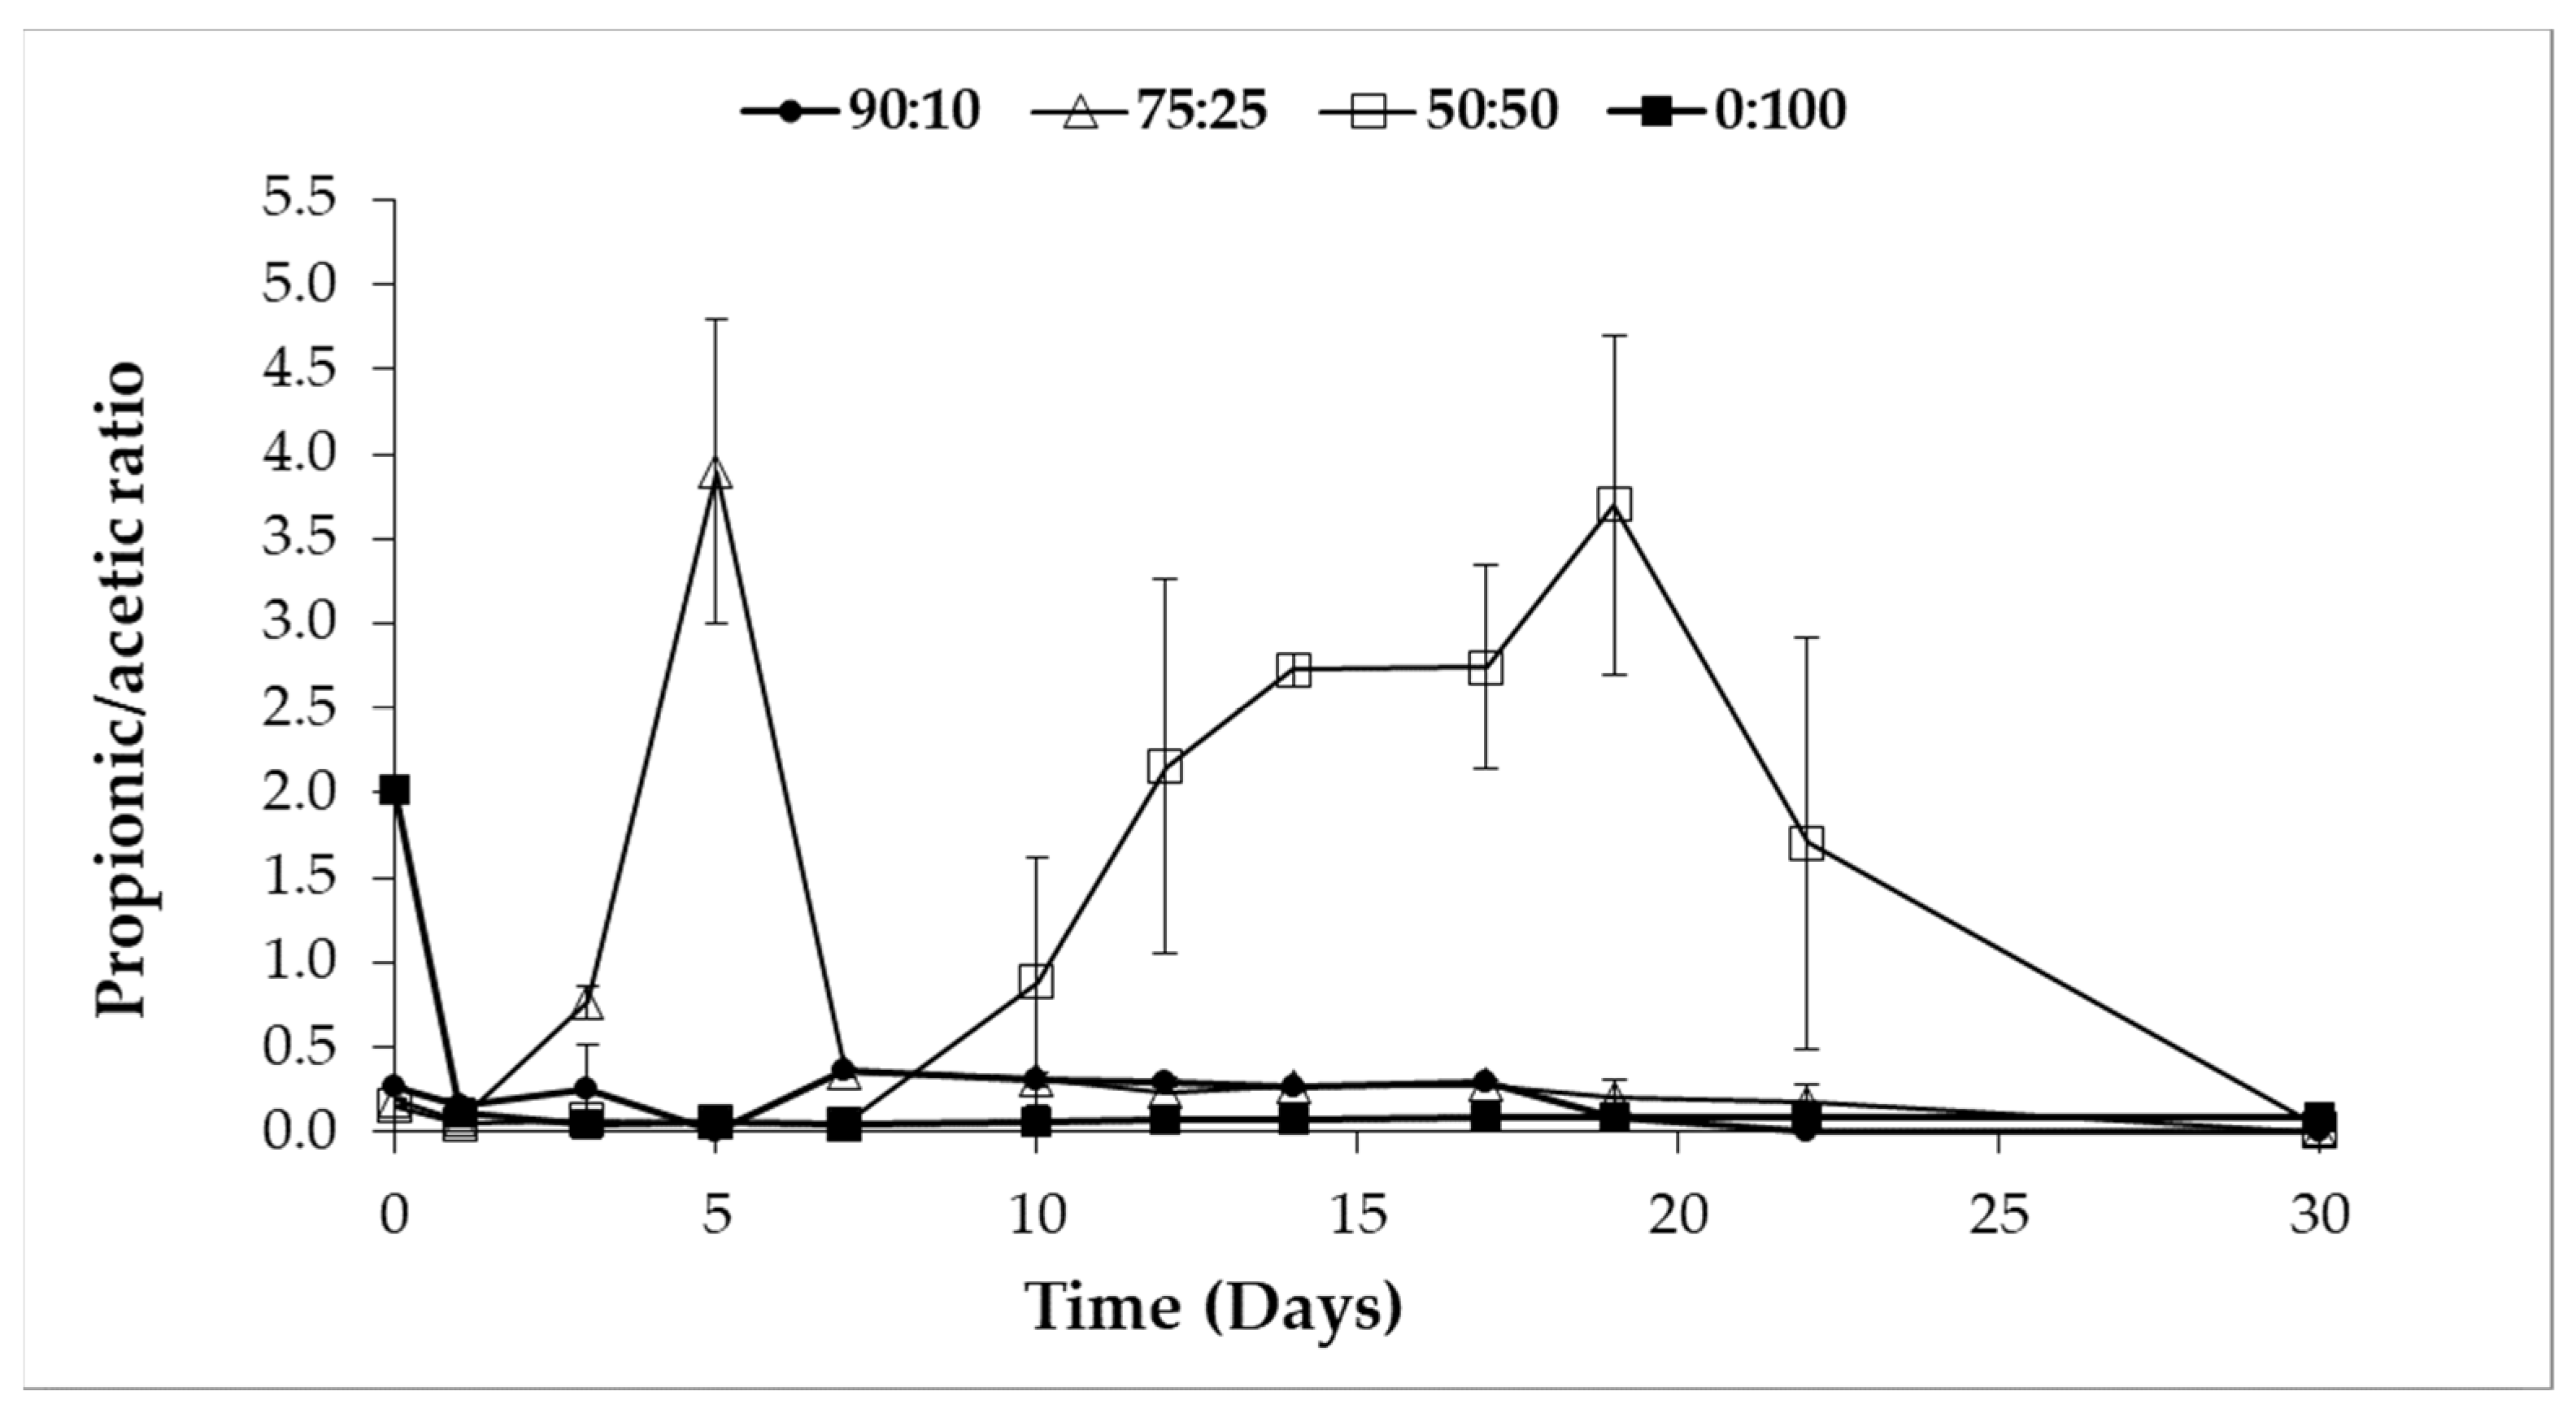
  • Propionic acid, however, shows a different behavior. It can be seen that it is practically residual in the 90:10 and 75:25 mixtures but its concentration increases and accumulates in the system up to 14 days for both 50:50 and 0:100. From that moment on, a slightly decreasing trend is observed in both cases, which ends with the complete consumption of propionic acid in the 50:50 test for day 30 of operation, while for the 0:100 assay it remains at values close to 1 g/L. It is known that propionic acid is the most inhibitory of the short-chain volatile fatty acids (acetic, propionic, and butyric acids) in the anaerobic digestion process [50,51].
  • Valeric acid has very low concentrations in all cases, although it is observed that it increases at the end of the test. This trend is especially marked for the 0:100 test and is in agreement with what has been previously commented on that this acid is generated as a consequence of the reversibility of the biochemical reactions of acetic acid, propionic acid and hydrogen [43].
Figure 5 shows the evolution of the propionic/acetic of the studied mixtures.
The 75:25 and 50:50 mixtures exceeded the value of 1.4 in the propionic/acetic ratio, a value determined as a limit for the correct functioning of the AD process [52]. However, these mixtures reached admissible values over time, recovering the stability of the system. The 90:10 mixture was maintained with a propionic/acetic ratio below 0.40, the concentration of propionic acid did not exceed 0.19 g/L. Although, the propionic/acetic ratio of the 0:100 assay had very low values, possibly, in this case, acetoclastic methanogens were not capable of converting acetate to methane, resulting in the accumulation of acetic acid generated from propionic acid and the accumulation of propionate that was not transformed into acetate, due to inhibition of hydrogenotrophic methanogens, which it caused low production of CH4 as a consequence of the decoupling of the AD process. Leng Li et al. [53], reported that approximately 6 to 35% of the total methanogenesis is derived from the degradation of propionic acid in acetate, H2/CO2, therefore, the degradation of propionic acid is decisive in the stability of the methanogenic stage and the digestion performance. Furthermore, they indicate that the inhibition by acetate and propionate is due to free acids instead of the anions because it depends on the pH.

3.4. Parameters Related to the Organic Material Evolution

ESBP is a lignocellulosic by-product that presents difficulties in the use of structural sugars, which is due to the recalcitrance generated by lignin. In fact, as it can be seen in Figure 6, for 0:100 assay the dissolved organic matter removal (measured in terms of DOC) was very low, since a significant fraction remained in the medium as VFAs. Aboudi et al. [49] found the same trend in the increase of the maximum values of DOC when the proportion of ESBP in the mixture increases.
According to other authors, in mesophilic anaerobic co-digestion processes, the propionic acid is the predominant. Li et al. [12] studied the anaerobic mesophilic co-digestion of rice straw and cow manure, they detected that increasing the organic load in the reactor increased the production of VFA and reported that propionic acid (1802–2761 mg/L) was the strongest inhibitor in biogas production.
Similarly, Borowski and Kucner [45] investigated the anaerobic mesophilic co-digestion of sugar beet pulp stillage with poultry manure and municipal sewage sludge. In the co-digestion of stillage with 20% poultry manure, the total volatile fatty acids production was in the range of 5500–8500 g/m3, (propionic ranged between 72 and 76% of the TVFA) while in the co- digestion of stillage with 60% of sewage sludge, the predominant acid was acetic acid with 72–82% of the total acidity.
Capson et al. [54] studied three alternatives (low temperature digestion, co-digestion with waste paper, and addition of trace elements) using batch reactors to mitigate the accumulation of ammonia and VFA during food waste anaerobic digestion. They found that propionic acid accumulation was predominant in all the conditions tested. In the same line, Aboudi et al. [49] obtained maximum values of propionic acid in the range of 1100–5500 mg/L, while acetic acid was in the range of 2000–6000 mg/L approximately.
However, in this study acetic acid was the predominant, which presented accumulation due to the fast hydrolysis and acidogenesis derived from operating the process in the thermophilic range. As it can be seen in Figure 6, the accumulation of this acid affected the methane production and organic matter removal. In this sense, according to Borja, R. et al. [55], in some bacteria, the assimilation of undissociated CH3-COOH through the cell membrane causes the modification of the internal pH with inhibitory effects on the AD processes.
In Figure 6, the evolution of dissolved organic carbon and accumulated methane production is shown. These data can be linked to the total volatile acidity evolution reported in Figure 2e.
The highest methane production (7375 mL) was reached by the 75:25 mixture (CM: ESBP) with a final COD of 1.09 g/L, following the 50:50 mixture with a methane production of 6008 mL, and a final COD of 1.57 g/L. The 0:100 assay is the one with the highest COD without degrading (8 g/L). All the assays showed synergistic effects (propionic acid degradation and increased CH4 production in mixtures containing CM); however, the increase or decrease in methane production can be due to different factors, such as buffering capacity, nutrient balance, and the effect of toxic compounds (VFAs accumulation).
Fukuzaki et al. [56] studied the effect of acetic acid on methanogens in batch trials, and they found that undissociated acetic acid affects the methanogenesis stage. In fact, acetic acid was the predominant acid in this work, which explains the high-solubilized organic matter and VFA accumulations in the different mixtures and the low methane production. In this sense, Xu et al. [57] and other authors [58,59], reported that acetic acid mainly affects acetoclastic methanogenesis since it is more sensitive than hydrogenotrophic methanogenesis in the AD process. As it can be seen in Figure 6, this effect was the most pronounced of the 0:100 assay.
In addition, Zyhang et al. [60] reported that the hydrogenotrophic methanogens inhibition may be mainly due to the accumulation of free acetic acid. However, they indicated that, under mesophilic conditions, there is no difference among the toxicity caused by free acetic, propionic, and butyric acids [61].
About the specific methane yield in term of VS fed, for the 75:25 mixture it was approximately 3.3 times greater than for the 0:100 assay. This fact is due to an increase in the CM proportion as co-substrate. The higher specific methane production reached in this mixture may be due to the balanced carbon and nitrogen contents.
Aboudi et al. [49] studied the anaerobic co-digestion of by-product of sugar beet and CM and they found the highest methane yield in the 25:75 mixture (ESBP-DP and CM). This value was 1.8 times higher than for the 100:0 (ESBP-DP and CM) mixture. In another study of co-digestion under thermophilic conditions with pig manure as co-substrate, authors obtained the highest methane production in the 25:75 (ESBP: PM) mixture and it was 4.4 times higher than for the 100:0 mixture (ESBP:PM) [22].

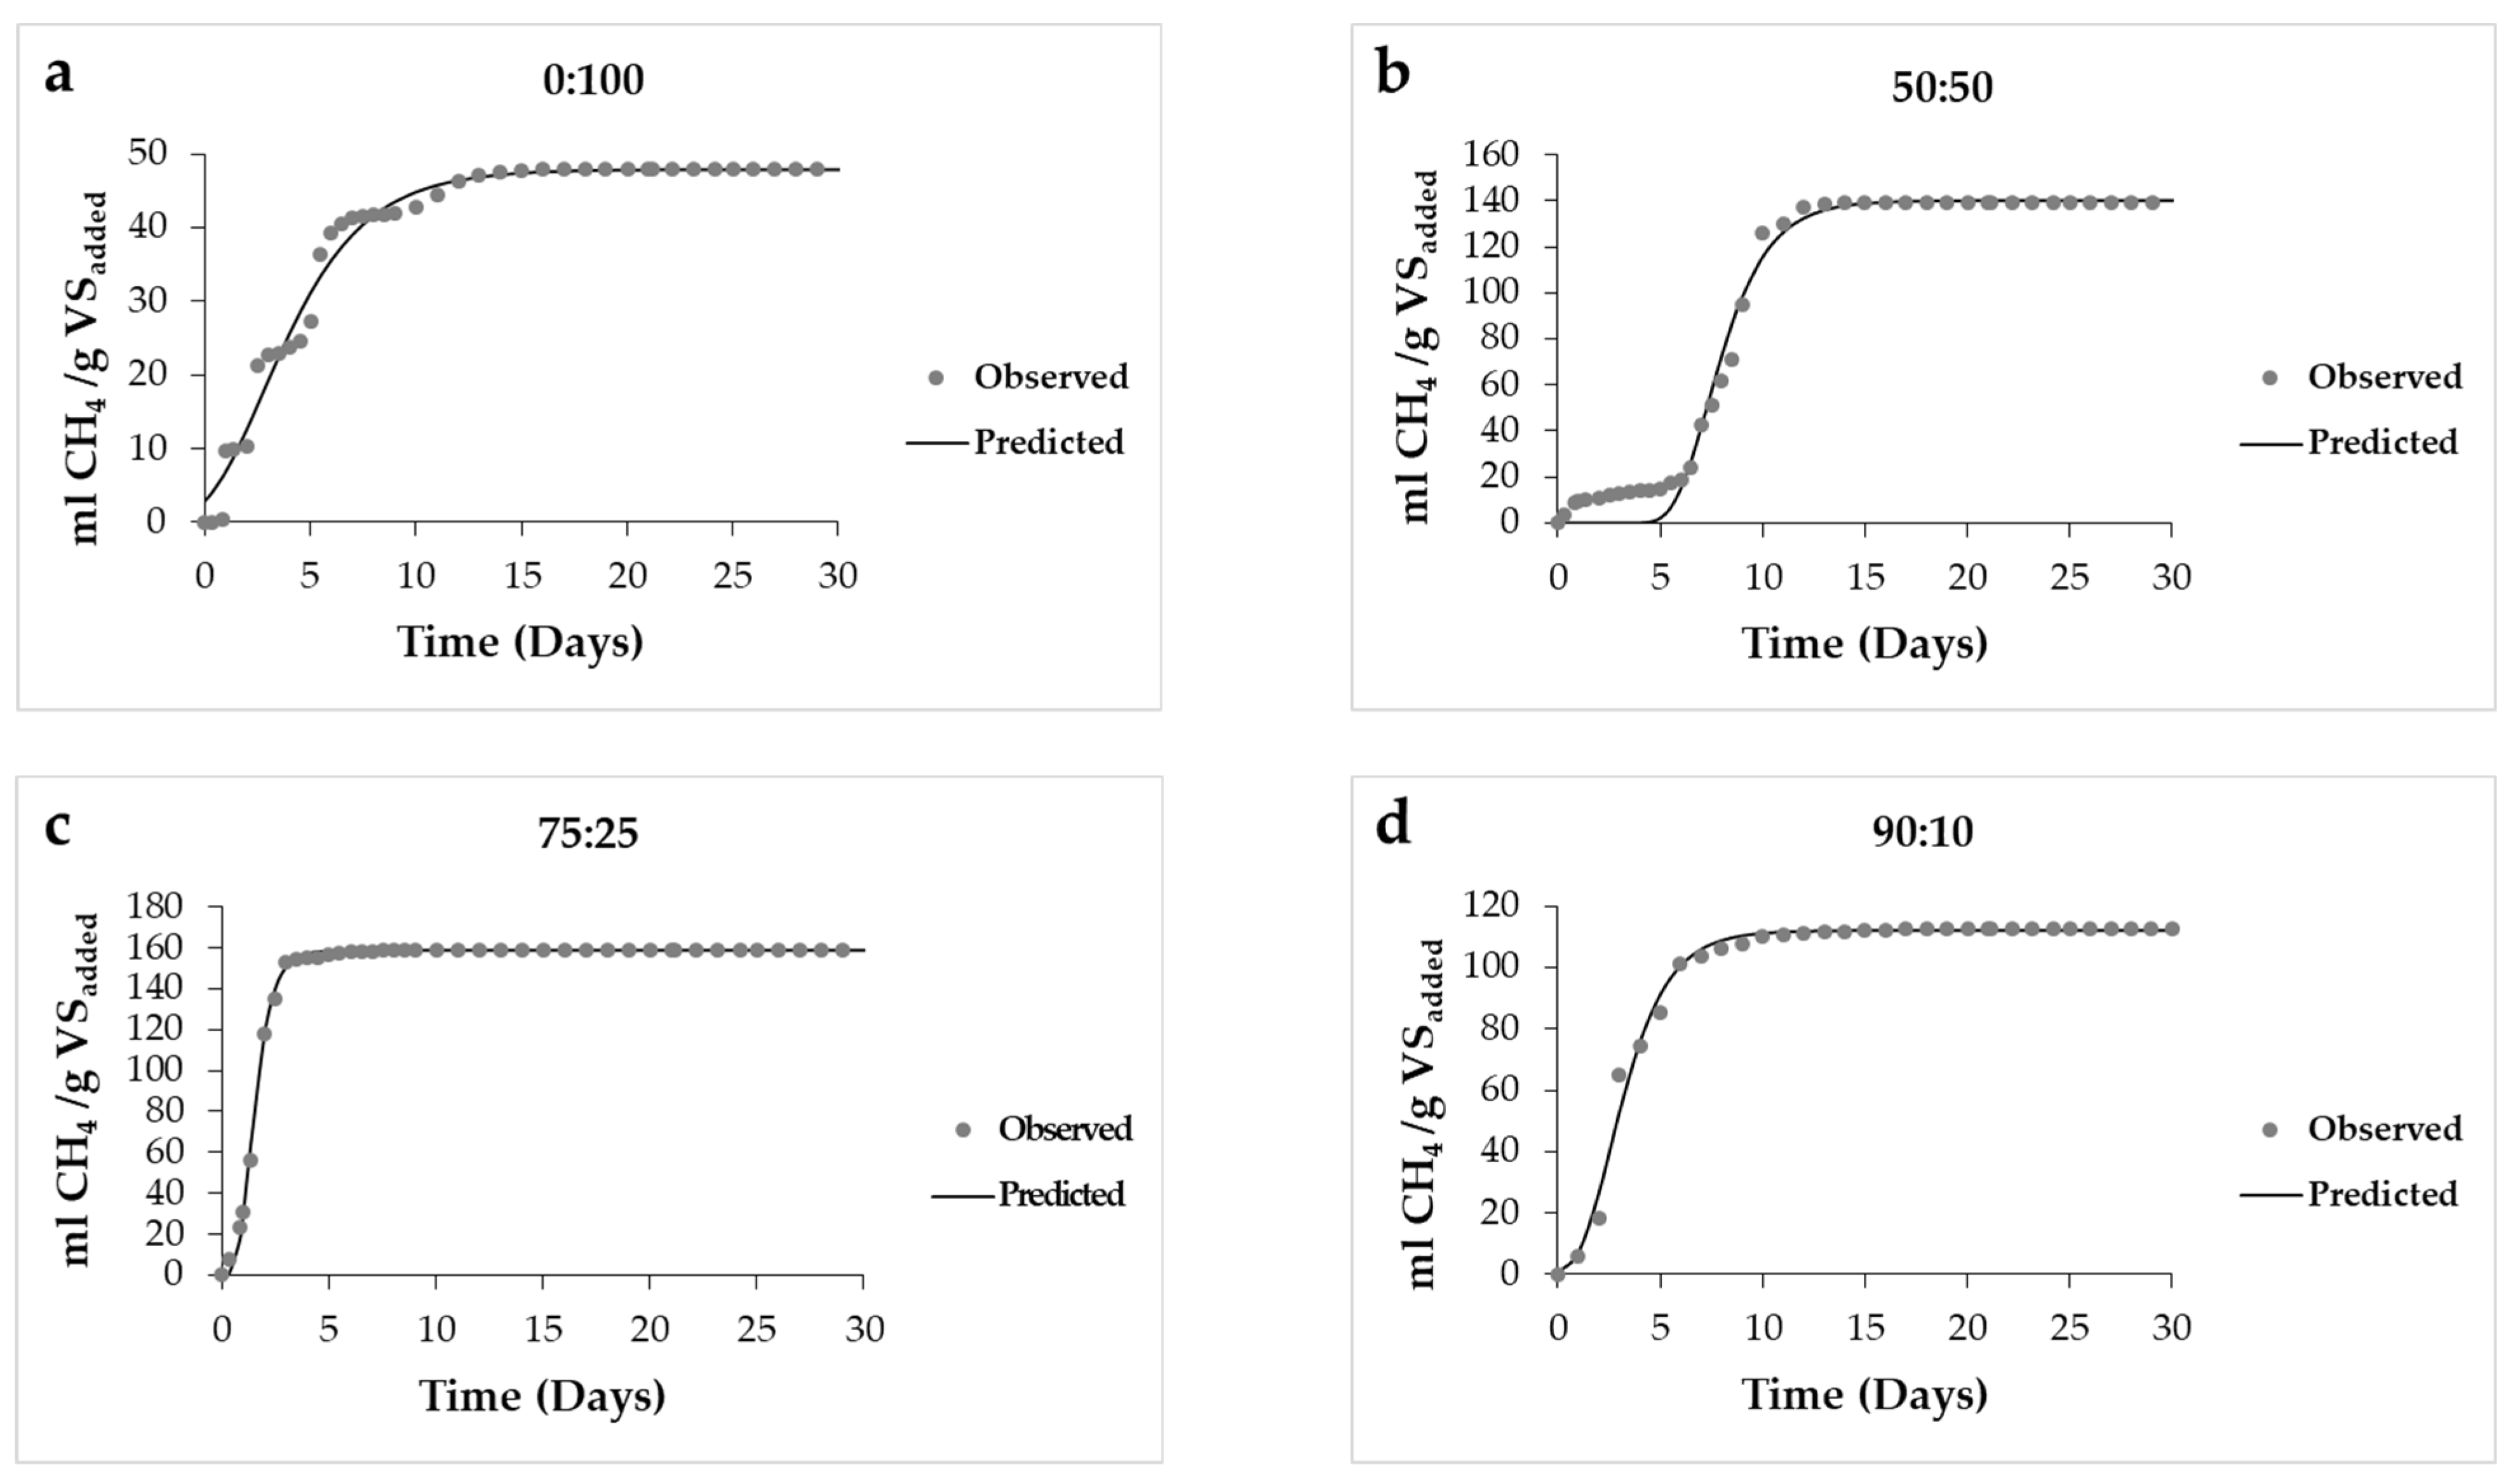
3.5. The Kinetic Model

Table 4 shows the model parameters that were obtained from fitting the experimental data on methane production. All correlation coefficients (R2) of the studied mixtures were above 97.9%.
The two highest methane production rates (Rm) was obtained for the 75:25 (CM:ESBP) mixture, corroborating that it is the best mixture tested for both residues. However, a difference in biogas production was observed between all the mixtures; the lag phase time (λ) for the 50:50 mixture was higher than the other study mixtures, probably due to the drop in pH in those first days. The 0:100 assay is the one with the lowest λ in the generation of CH4; however, it also has the lowest Rm, possibly due to the accumulation of VFAs as mentioned in the previous section, exceeding 8 g/L of acetic acid since day one of the test (Figure 4).
In a co-digestion study of by-products of sugar beet (SBB) and cattle manure (cow and pig), they report that in reactors fed only with SBB, the lag phase increases as the percentage of TS increases [42]. The 75:25 mixture presented the maximum rate of CH4 production compared to the other mixtures studied, this mixture has a C:N ratio of 16.85. Figure 7 shows the prediction values of the model and the experimental values.
The 75:25 and 90:10 mixtures present the highest R2 between the experimental values and the predicted values, this may be due to the fact that they are the mixtures that contain the highest proportion of CM, which is the most readily biodegradable substrate compared to 0:100 and 50:50 mixtures containing higher ESBP ratios, which is characterized by having fractions more resistant to biodegradation.
In Figure 7, it can be seen that the 75:25 mixture is the one with the greatest similarity between the predicted values and the experimental values, with an R2 of 99.80%.
The study revealed that the highest methane production was obtained from the mixture containing 75% CM, 159.5 mL CH4/g VSadded and it was also found that the specific methane production was increased 3.3 times relative to the ESBP (0:100) condition. The 90:10 and 50:50 mixtures showed a yield of 112.9 and 139.3 mL CH4/g VSadded, respectively.

3.6. Indirect Parameters

Figure 8 shows the evolution of the indirect parameters of the different mixtures studied. In the 50:50 mixture (Figure 8b), a premature depletion of the ASC can be observed, which determines a clear limitation of the hydrolysis stage. Nevertheless, over the assay days, the system was able to recover and consume the VFAs produced.
Analyzing the DAC, the acid consumption in the three CM-containing mixtures is clearly visible. In the 50:50, 75:25 and 90:10 mixtures (Figure 8b–d) the DAC reaches similar final levels 0.33, 0.05, and 0.08 g/L respectively, but a great difference can be observed with the 0:100 assay, which indicates a decoupling of the phases of the anaerobic digestion process [65], the system is not able to recover and the final values of all the parameters are not close to those of the other mixtures studied, showing that in this case, hydrolysis is effectively inhibited by the concentration of VFAs reached. In the 50:50 mixture, the kinetic differences that occur in the digestion process can be observed (Figure 8b). A final phase of production of acetic acid from propionic acid is also identified, although it is not transformed to methane, possibly requiring more time (Figure 2b).
In all the mixtures studied, the methane production coincides with the decreases in acid concentration (Figure 6 and Figure 8); however, in the 0: 100 assay in the final days the methane production is not appreciated (Figure 6a).

4. Conclusions

According to the data and evolutions obtained in this study, it can be concluded that the ESBP is a waste that presents difficulties for its thermophilic anaerobic degradation since it leads to the acidification of the system. The use of a co-substrate, such as CM, provided sufficient stability to the system, increasing its buffer capacity, and reducing the content of biodegradable organic matter, which allowed the accumulation of VFAs not to completely inhibit the process and that they could be degraded to methane.

Author Contributions

Conceptualization, L.A.F.-G., C.J.Á.-G., and L.I.R.-G.; methodology, X.G.-Q., K.A., L.A.F.-G., C.J.Á.-G., L.I.R.-G.; software, L.A.F.-G., C.J.Á.-G., L.I.R.-G.; validation, K.A., L.A.F.-G., C.J.Á.-G., and L.I.R.-G.; formal analysis, X.G.-Q., K.A., L.A.F.-G., C.J.Á.-G., L.I.R.-G.; investigation, X.G.-Q.; resources, C.J.Á.-G., and L.I.R.-G.; data curation, X.G.-Q., K.A., L.A.F.-G., C.J.Á.-G., and L.I.R.-G.; writing—original draft preparation, X.G.-Q., K.A., L.A.F.-G., C.J.Á.-G., and L.I.R.-G.; writing—review and editing, X.G.-Q., K.A., L.A.F.-G., C.J.Á.-G., and L.I.R.-G.; visualization, K.A., L.A.F.-G., C.J.Á.-G., and L.I.R.-G.; supervision, C.J.Á.-G., and L.I.R.-G.; project administration, C.J.Á.-G., and L.I.R.-G.; funding acquisition, C.J.Á.-G., and L.I.R.-G. All authors have read and agreed to the published version of the manuscript.

Funding

This research was funded by [the Spanish Ministry of Economy, Industry and Competitiveness] grant number [CTM2013–43938-R and CTM2016–79071-R], [the Spanish State Research Agency and the European Regional Development Fund], and [the doctoral fellowship from the University of Cádiz] grant number [UCA-2014–043/PU/EPIF-FPI-CT/CP].

Institutional Review Board Statement

Not applicable.

Informed Consent Statement

Not applicable.

Data Availability Statement

The data presented in this study are available on request from the corresponding author.

Acknowledgments

This research was supported by the projects CTM2013–43938-R and CTM2016–79071-R (Spanish Ministry of Economy, Industry and Competitiveness) and financed by the Spanish State Research Agency (“Agencia Estatal de Investigación”—AEI), and by the European Regional Development Fund (ERDF). The Authors also acknowledge the University of Cádiz (Spain) for the Scholarship UCA-2014–043/PU/EPIF-FPI-CT/CP, the Agri-food Campus of International Excellence (Ceia3) and the Azucarera (an AB Sugar Company) for the supply of samples of exhausted sugar beet pulp.

Conflicts of Interest

The authors declare no conflict of interest.

References

  1. Dai, X.; Chen, Y.; Zhang, D.; Yi, J. High-solid anaerobic co-digestion of sewage sludge and cattle manure: The effects of volatile solid ratio and pH. Sci. Rep. 2016, 6, 35194. [Google Scholar] [CrossRef] [Green Version]
  2. Li, Q.; Qiao, W.; Wang, X.; Takayanagi, K.; Shofie, M.; Cheng, J. Kinetic characterization of thermophilic and mesophilic anaerobic digestion for coffee grounds and waste activated sludge. Waste Manag. 2015, 36, 77–85. [Google Scholar] [CrossRef]
  3. Zhao, Y.; Sun, F.; Yu, J.; Cai, Y.; Luo, X.; Cui, Z.; Hu, Y.; Wang, X. Co-digestion of oat straw and cow manure during anaerobic digestion: Stimulative and inhibitory effects on fermentation. Bioresour. Technol. 2018, 269, 143–152. [Google Scholar] [CrossRef]
  4. Li, C.; Strömberg, S.; Liu, G.; Nges, I.A.; Liu, J. Assessment of regional biomass as co-substrate in the anaerobic digestion of chicken manure: Impact of co-digestion with chicken processing waste, seagrass and Miscanthus. Biochem. Eng. J. 2017, 118, 1–10. [Google Scholar] [CrossRef]
  5. Jiménez, J.; Guardia-Puebla, Y.; Cisneros-Ortiz, M.; Morgan-Sagastume, J.; Guerra, G.; Noyola, A. Optimization of the specific methanogenic activity during the anaerobic co-digestion of pig manure and rice straw, using industrial clay residues as inorganic additive. Chem. Eng. J. 2015, 259, 703–714. [Google Scholar] [CrossRef]
  6. Yu, Q.; Sun, C.; Liu, R.; Yellezuome, D.; Zhu, X.; Bai, R.; Liu, M.; Sun, M. Anaerobic co-digestion of corn stover and chicken manure using continuous stirred tank reactor: The effect of biochar addition and urea pretreatment. Bioresour. Technol. 2021, 319, 124197. [Google Scholar] [CrossRef]
  7. Zhou, J.; Zhang, Y.; Khoshnevisan, B.; Duan, N. Meta-analysis of anaerobic co-digestion of livestock manure in last decade: Identification of synergistic effect and optimization synergy range. Appl. Energy 2021, 282, 116128. [Google Scholar] [CrossRef]
  8. Li, Y.; Zhao, J.; Krooneman, J.; Euverink, G.J.W. Strategies to boost anaerobic digestion performance of cow manure: Laboratory achievements and their full-scale application potential. Sci. Total Environ. 2020, 142940. [Google Scholar] [CrossRef]
  9. Xu, H.; Yun, S.; Wang, C.; Wang, Z.; Han, F.; Jia, B.; Chen, J.; Li, B. Improving performance and phosphorus content of anaerobic co-digestion of dairy manure with aloe peel waste using vermiculite. Bioresour. Technol. 2020, 301, 122753. [Google Scholar] [CrossRef]
  10. Xing, B.-S.; Cao, S.; Han, Y.; Wen, J.; Zhang, K.; Wang, X.C. Stable and high-rate anaerobic co-digestion of food waste and cow manure: Optimisation of start-up conditions. Bioresour. Technol. 2020, 307, 123195. [Google Scholar] [CrossRef]
  11. Instituto Nacional de Estadística-INE, Anuario Estadístico de España. 2019, Volume 605. Available online: www.ine.es/infoine (accessed on 16 November 2020).
  12. Li, D.; Liu, S.; Mi, L.; Li, Z.; Yuan, Y.; Yan, Z.; Liu, X. Effects of feedstock ratio and organic loading rate on the anaerobic mesophilic co-digestion of rice straw and cow manure. Bioresour. Technol. 2015, 189, 319–326. [Google Scholar] [CrossRef] [PubMed]
  13. Akyol, Ç.; Ozbayram, E.G.; Ince, O.; Kleinsteuber, S.; Ince, B. Anaerobic co-digestion of cow manure and barley: Effect of cow manure to barley ratio on methane production and digestion stability. Environ. Prog. Sustain. Energy 2016, 35, 589–595. [Google Scholar] [CrossRef]
  14. Li, Y.; Li, Y.; Zhang, D.; Li, G.; Lu, J.; Li, S. Solid state anaerobic co-digestion of tomato residues with dairy manure and corn stover for biogas production. Bioresour. Technol. 2016, 217, 50–55. [Google Scholar] [CrossRef]
  15. Wang, X.; Yang, G.; Feng, Y.; Ren, G.; Han, X. Optimizing feeding composition and carbon–nitrogen ratios for improved methane yield during anaerobic co-digestion of dairy, chicken manure and wheat straw. Bioresour. Technol. 2012, 120, 78–83. [Google Scholar] [CrossRef] [PubMed]
  16. Montoro, S.B.; Lucas, J.; Santos, D.; Costa, M.S.S.D.M. Anaerobic co-digestion of sweet potato and dairy cattle manure: A technical and economic evaluation for energy and biofertilizer production. J. Clean. Prod. 2019, 226, 1082–1091. [Google Scholar] [CrossRef]
  17. Li, C.; Zhou, Y.; Lu, W.; Nges, I.A. Enhancement of the solid-state anaerobic digestion of rice straw by liquor supplementation. Bioresour. Technol. Rep. 2019, 5, 59–65. [Google Scholar] [CrossRef]
  18. Chuenchart, W.; Logan, M.; Leelayouthayotin, C.; Visvanathan, C. Enhancement of food waste thermophilic anaerobic digestion through synergistic effect with chicken manure. Biomass Bioenergy 2020, 136, 105541. [Google Scholar] [CrossRef]
  19. Li, Q.; Li, H.; Wang, G.; Wang, X.C. Effects of loading rate and temperature on anaerobic co-digestion of food waste and waste activated sludge in a high frequency feeding system, looking in particular at stability and efficiency. Bioresour. Technol. 2017, 237, 231–239. [Google Scholar] [CrossRef]
  20. Fernández-Güelfo, L.A.; Álvarez-Gallego, C.J.; Sales, D.; Romero-García, L.I. New indirect parameters for interpreting a destabilization episode in an anaerobic reactor. Chem. Eng. J. 2012, 180, 32–38. [Google Scholar] [CrossRef]
  21. Angeriz-Campoy, R.; Fernández-Güelfo, L.A.; Tyagi, V.K.; Álvarez-Gallego, C.J.; Romero-García, L.I. New criteria to determine the destabilization of the acidogenic anaerobic co-digestion of organic fraction of municipal solid waste (OFMSW) with mixed sludge (MS). Bioresour. Technol. 2018, 248, 174–179. [Google Scholar] [CrossRef]
  22. Gómez-Quiroga, X.; Aboudi, K.; Álvarez-Gallego, C.J.; Romero-García, L.I. Enhancement of Methane Production in Thermophilic Anaerobic Co-Digestion of Exhausted Sugar Beet Pulp and Pig Manure. Appl. Sci. 2019, 9, 1791. [Google Scholar] [CrossRef] [Green Version]
  23. APHA-AWWA-WPCF. Standards Methods for the Examination of Water and Wastewater, 20th ed.; American Public Health Association: Washington, DC, USA, 2005. [Google Scholar]
  24. Van Soest, P.V.; Robertson, J.B.; Lewis, B.A. Methods for Dietary Fiber, Neutral Detergent Fiber, and Nonstarch Polysaccharides in Relation to Animal Nutrition. J. Dairy Sci. 1991, 74, 3583–3597. [Google Scholar] [CrossRef]
  25. Álvarez-Gallego, C.J. Ensayo de Diferentes Procedimientos para el Arranque de un Proceso de Co-Digestión Anaerobia seca de FORSU y Lodos de Depuradora en Rango Termofílico. Ph.D. Thesis, Universidad de Cádiz, Cádiz, España, 2005. [Google Scholar]
  26. Mahdy, A.; Fotidis, I.A.; Mancini, E.; Ballesteros, M.; González-Fernández, C.; Angelidaki, I. Ammonia tolerant inocula provide a good base for anaerobic digestion of microalgae in third generation biogas process. Bioresour. Technol. 2017, 225, 272–278. [Google Scholar] [CrossRef] [Green Version]
  27. Vats, N.; Khan, A.A.; Ahmad, K. Effect of substrate ratio on biogas yield for anaerobic co-digestion of fruit vegetable waste & sugarcane bagasse. Environ. Technol. Innov. 2019, 13, 331–339. [Google Scholar] [CrossRef]
  28. Gaur, R.Z.; Khan, A.A.; Suthar, S. Effect of thermal pre-treatment on co-digestion of duckweed (Lemna gibba) and waste activated sludge on biogas production. Chemosphere 2017, 174, 754–763. [Google Scholar] [CrossRef]
  29. Kahm, M.; Hasenbrink, G.; Lichtenberg-Fraté, H.; Ludwig, J.; Kschischo, M. grofit: Fitting Biological Growth Curves with R. J. Stat. Softw. 2010, 33, 1–22. [Google Scholar] [CrossRef] [Green Version]
  30. Cheng, J.; Lu, X.; Kobayashi, T.; Cheng, J.; Xu, K.; Zhao, Y. Mesophilic anaerobic co-digestion of waste activated sludge and Egeria densa: Performance assessment and kinetic analysis. Appl. Energy 2015, 148, 78–86. [Google Scholar] [CrossRef]
  31. Owamah, I.; Izinyon, O. The effect of organic loading rates (OLRs) on the performances of food wastes and maize husks anaerobic co-digestion in continuous mode. Sustain. Energy Technol. Assess. 2015, 11, 71–76. [Google Scholar] [CrossRef] [Green Version]
  32. Haider, M.R.; Zeshan; Yousaf, S.; Malik, R.N.; Visvanathan, C. Effect of mixing ratio of food waste and rice husk co-digestion and substrate to inoculum ratio on biogas production. Bioresour. Technol. 2015, 190, 451–457. [Google Scholar] [CrossRef]
  33. Lorenzo Acosta, Y.; Obaya Abreu, M.C. La Digestión Anaerobia. Aspectos Teóricos. Parte I, ICIDCA. Sobre los Derivados de la Caña Azúcar. Vol. XXXIX; núm 1; Redalyc [en linea]; 2005; pp. 35–48. Available online: https://www.redalyc.org/articulo.oa?id=223120659006 (accessed on 29 September 2020).
  34. Bouallagui, H.; Lahdheb, H.; Ben Romdan, E.; Rachdi, B.; Hamdi, M. Improvement of fruit and vegetable waste anaerobic digestion performance and stability with co-substrates addition. J. Environ. Manag. 2009, 90, 1844–1849. [Google Scholar] [CrossRef]
  35. Zhao, H.W. Analysis of the performance of an anaerobic digestion system at the Regina wastewater treatment plant. Bioresour. Technol. 2004, 95, 301–307. [Google Scholar] [CrossRef]
  36. Zhu, G.; Jha, A.K. Psychrophilic dry anaerobic digestion of cow dung for methane production: Effect of inoculum. Science 2013, 39, 500–510. [Google Scholar] [CrossRef] [Green Version]
  37. Brown, D.; Li, Y. Solid state anaerobic co-digestion of yard waste and food waste for biogas production. Bioresour. Technol. 2013, 127, 275–280. [Google Scholar] [CrossRef]
  38. Schoen, M.A.; Sperl, D.; Gadermaier, M.; Goberna, M.; Franke-Whittle, I.; Insam, H.; Ablinger, J.; Wett, B. Population dynamics at digester overload conditions. Bioresour. Technol. 2009, 100, 5648–5655. [Google Scholar] [CrossRef]
  39. Camacho, R.; Castillo, H.S.V.; Hoyos, J.L. Evaluación del Estiércol de Vaca como Inóculo en la Digestión Anaerobia Termófila de Residuos Sólidos Urbanos. Evaluation of Cow Manure as Inoculum in the Thermophilic Anaerobic Digestion of Municipal Solid Waste. Inf. Technol. 2017, 28, 29–36. [Google Scholar] [CrossRef] [Green Version]
  40. Cheng, X.-Y.; Zhong, C. Effects of Feed to Inoculum Ratio, Co-digestion, and Pretreatment on Biogas Production from Anaerobic Digestion of Cotton Stalk. Energy Fuels 2014, 28, 3157–3166. [Google Scholar] [CrossRef]
  41. Infantes, D.; Del Campo, A.G.; Villaseñor, J.; Fernández, F. Kinetic model and study of the influence of pH, temperature and undissociated acids on acidogenic fermentation. Biochem. Eng. J. 2012, 66, 66–72. [Google Scholar] [CrossRef]
  42. Aboudi, K.; Álvarez-Gallego, C.; Romero-García, L. Influence of total solids concentration on the anaerobic co-digestion of sugar beet by-products and livestock manures. Sci. Total Environ. 2017, 586, 438–445. [Google Scholar] [CrossRef]
  43. Li, X.; Yang, Z.; Liu, G.; Ma, Z.; Wang, W. Modified anaerobic digestion model No.1 (ADM 1) for modeling anaerobic digestion process at different ammonium concentrations. Water Environ. Res. 2019, 91, 700–714. [Google Scholar] [CrossRef]
  44. Rahman, A.; Saha, C.K.; Ward, A.J.; Møller, H.B.; Alam, M. Anaerobic co-digestions of agro-industrial waste blends using mixture design. Biomass Bioenergy 2019, 122, 156–164. [Google Scholar] [CrossRef]
  45. Borowski, S.; Kucner, M. The use of sugar beet pulp stillage for co-digestion with sewage sludge and poultry manure. Waste Manag. Res. 2019, 37, 1025–1032. [Google Scholar] [CrossRef]
  46. Zhang, Z.; Zhang, G.; Li, W.; Li, C.; Xu, G. Enhanced biogas production from sorghum stem by co-digestion with cow manure. Int. J. Hydrogen Energy 2016, 41, 9153–9158. [Google Scholar] [CrossRef]
  47. Estevez, M.M.; Sapci, Z.; Linjordet, R.; Schnürer, A.; Morken, J. Semi-continuous anaerobic co-digestion of cow manure and steam-exploded Salix with recirculation of liquid digestate. J. Environ. Manag. 2014, 136, 9–15. [Google Scholar] [CrossRef]
  48. Fang, C.; Boe, K.; Angelidaki, I. Anaerobic co-digestion of by-products from sugar production with cow manure. Water Res. 2011, 45, 3473–3480. [Google Scholar] [CrossRef] [PubMed]
  49. Aboudi, K.; Álvarez-Gallego, C.J.; Romero-García, L.I. Evaluation of methane generation and process stability from anaerobic co-digestion of sugar beet by-product and cow manure. J. Biosci. Bioeng. 2016, 121, 566–572. [Google Scholar] [CrossRef] [PubMed]
  50. Bi, S.; Qiao, W.; Xiong, L.; Ricci, M.; Adani, F.; Dong, R. Effects of organic loading rate on anaerobic digestion of chicken manure under mesophilic and thermophilic conditions. Renew. Energy 2019, 139, 242–250. [Google Scholar] [CrossRef]
  51. Li, J.; Kumar Jha, A. Syntrophic Propionate Degradation in Anaerobic Digestion: A Review Biological Wastewater Treatment View Project Microbiology View Project. 2012. Available online: http://www.fspublishers.org (accessed on 21 November 2020).
  52. İnce, E.; İnce, M.; Önkal, E.G. Comparison of thermophilic and mesophilic anaerobic treatments for potato processing wastewater using a contact reactor. Glob. NEST J. 2017, 19, 318–326. [Google Scholar]
  53. Leng, L.; Yang, P.; Singh, S.; Zhuang, H.; Xu, L.; Chen, W.-H.; Dolfing, J.; Ling, L.; Zhang, Y.; Zeng, H.; et al. A review on the bioenergetics of anaerobic microbial metabolism close to the thermodynamic limits and its implications for digestion applications. Bioresour. Technol. 2018, 247, 1095–1106. [Google Scholar] [CrossRef] [PubMed]
  54. Capson-Tojo, G.; Ruiz, D.; Rouez, M.; Crest, M.; Steyer, J.-P.; Bernet, N.; Delgenès, J.-P.; Escudié, R. Accumulation of propionic acid during consecutive batch anaerobic digestion of commercial food waste. Bioresour. Technol. 2017, 245, 724–733. [Google Scholar] [CrossRef]
  55. Borja, R.; Alba, J.; Martín, A.; Mancha, A. Influencia de la Velocidad de Carga Orgánica Sobre el Proceso de Digestión Anaerobia de Aguas de Lavado de Aceitunas de Almazara en Reactores de Lecho Fluidizado. 1998. Available online: http://grasasyaceites.revistas.csic.es (accessed on 14 September 2020).
  56. Fukuzaki, S.; Nishio, N.; Nagai, S. Kinetics of the Methanogenic Fermentation of Acetate. Appl. Environ. Microbiol. 1990, 56, 3158–3163. Available online: http://www.ncbi.nlm.nih.gov/pubmed/16348323 (accessed on 3 October 2019). [CrossRef] [Green Version]
  57. Xu, Z.; Zhao, M.; Miao, H.; Huang, Z.; Gao, S.; Ruan, W. In situ volatile fatty acids influence biogas generation from kitchen wastes by anaerobic digestion. Bioresour. Technol. 2014, 163, 186–192. [Google Scholar] [CrossRef] [PubMed]
  58. Li, D.; Chen, L.; Liu, X.; Mei, Z.; Ren, H.; Cao, Q.; Yan, Z. Instability mechanisms and early warning indicators for mesophilic anaerobic digestion of vegetable waste. Bioresour. Technol. 2017, 245, 90–97. [Google Scholar] [CrossRef] [PubMed]
  59. Ziganshin, A.M.; Schmidt, T.; Lv, Z.; Liebetrau, J.; Richnow, H.H.; Kleinsteuber, S.; Nikolausz, M. Reduction of the hydraulic retention time at constant high organic loading rate to reach the microbial limits of anaerobic digestion in various reactor systems. Bioresour. Technol. 2016, 217, 62–71. [Google Scholar] [CrossRef] [PubMed]
  60. Zhang, W.; Dai, K.; Xia, X.-Y.; Wang, H.-J.; Chen, Y.; Lu, Y.-Z.; Zhang, F.; Zeng, R.J. Free acetic acid as the key factor for the inhibition of hydrogenotrophic methanogenesis in mesophilic mixed culture fermentation. Bioresour. Technol. 2018, 264, 17–23. [Google Scholar] [CrossRef]
  61. Zhang, W.; Zhang, F.; Li, Y.-X.; Jiang, Y.; Zeng, R.J. No difference in inhibition among free acids of acetate, propionate and butyrate on hydrogenotrophic methanogen of Methanobacterium formicicum. Bioresour. Technol. 2019, 294, 122237. [Google Scholar] [CrossRef]
  62. Koppar, P. Pullammanappallil, Single-stage, batch, leach-bed, thermophilic anaerobic digestion of spent sugar beet pulp. Bioresour. Technol. 2008, 99, 2831–2839. [Google Scholar] [CrossRef]
  63. Şenol, H.; Açıkel, Ü.; Demir, S.; Oda, V. Anaerobic digestion of cattle manure, corn silage and sugar beet pulp mixtures after thermal pretreatment and kinetic modeling study. Fuel 2020, 263, 116651. [Google Scholar] [CrossRef]
  64. Ziemiński, K.; Kowalska-Wentel, M. Effect of enzymatic pretreatment on anaerobic co-digestion of sugar beet pulp silage and vinasse. Bioresour. Technol. 2015, 180, 274–280. [Google Scholar] [CrossRef]
  65. Aguilar, M.R.; Fdez-Güelfo, L.; Álvarez-Gallego, C.; Romero-García, L.I. Effect of HRT on hydrogen production and organic matter solubilization in acidogenic anaerobic digestion of OFMSW. Chem. Eng. J. 2013, 219, 443–449. [Google Scholar] [CrossRef]
Figure 1. Evolution of pH and amounts of potassium carbonate added to the different reactors.
Water 13 00067 g001
Figure 2. Comparison of the evolution of the individual VFAs (acetic, propionic, butyric, and valeric acids) and of the total acidity (TVFA) in the reactors. (a) Evolution of the acetic acid (Hac). (b) Evolution of the propionic acid (HPr). (c) Evolution of the butyric acid (HBr). (d) Evolution of the valeric acid (HIval). (e) Evolution of total volatile fatty acidity (expressed as g Hac/L).
Water 13 00067 g002
Figure 3. Alkalinity of the anaerobic co-digestion process of CM and ESBP.
Water 13 00067 g003
Figure 4. Evolution of the Acidity/Alkalinity ratio.
Water 13 00067 g004
Figure 5. Evolution of the propionic/acetic ratio.
Water 13 00067 g005
Figure 6. Comparison of the Dissolved Organic Carbon (DOC) and methane accumulation evolutions in the studied mixtures. (a): 0:100 mixture ratio; (b): 50:50 mixture ratio; (c): 75:25 mixture ratio; (d): 90:10 mixture ratio.
Water 13 00067 g006
Figure 7. Gompertz model of co-digestion mixtures (CM:ESBP). (a): 0:100 mixture ratio; (b): 50:50 mixture ratio; (c): 75:25 mixture ratio; (d): 90:10 mixture ratio.
Water 13 00067 g007
Figure 8. Evolution of dissolved acid carbon (DAC), dissolved organic carbon (DOC), and carbon as acid substrate (ASC) parameters. (a): 0:100 mixture ratio; (b): 50:50 mixture ratio; (c): 75:25 mixture ratio; (d): 90:10 mixture ratio.
Water 13 00067 g008
Table 1. Characterization of substrates and inoculum.
ParametersUnitsCMESBPInoculum
pH-6.98 ± 0.026.22 ± 0.047.66 ± 0.04
Total solids (TS)(%)31.91 ± 0.3787.07 ± 0.024.20 ± 0.04
Volatile solids(%TS)45.45 ± 0.4187.79 ± 0.5457.92 ± 0.07
Alkalinity(gCaCO3/kg)38.05 ± 0.570.43 ± 0.104.8 ± 0.10
Total volatile fatty acidity (TVFA)(g/kg)1.28 ± 0.04219.34 ± 0.420.15 ± 0.01
Solubilized organic matter (sCOD)(g/kg)23.50 ± 2.79217.44 ± 5.954.20 ± 0.11
Dissolved organic carbon (DOC)(g/kg)8.38 ± 0.0593.14 ± 0.011.55 ± 0.02
Total kjeldahl nitrogen (TKN)(%)1.40± 0.451.36 ± 0.342.11 ± 0.05
C:N ratio-16.63 ± 0.4028.66 ± 0.2013.94 ± 0.02
Protein and pectins(%)-55.54-
Insoluble lignin(%)-3.5-
Soluble lignin and cellulose(%)-21.14-
Hemicellulose(%)-22.52-
Table 2. Initial Characterization of CM:ESBP mixtures.
ParametersUnits0:10050:5075:2590:10
pH-7.69 ± 0.057.05 ± 0.017.11 ± 0.047.16 ± 0.01
sCODg/L6.97 ± 0.316.77 ± 0.756.61 ± 0.084.92 ± 0.50
AlkalinitygCaCO3/L7.88 ± 2.042.74 ± 0.013.02 ± 0.083.07 ± 0.48
C:N-18.0617.0116.8514.46
VS(%TS)67.03 ± 1.7965.65 ± 0.1064.43 ± 0.1758.90 ± 0.06
Table 3. Statistical analysis.
MixturespHAlkalinitysCODTVFA
CM:ESBPFpFpFpFp
0:1000.0090.9271.0930.3070.2410.6280.0240.878
50:500.0080.9301.8840.1840.5100.4830.7880.384
75:250.0000.9920.7330.4000.0910.7650.0150.905
90:100.0060.9401.4800.237--2.8220.107
Table 4. Parameters obtained in the Gompertz model.
SubstratesMixtureTemperatureY (mL CH4/g VSadded)Rm (mL CH4/g VSadded day)λ (day)R2Ref.
CM:ESBP0:100 47.9036.6060.0940.9852This study
50:5055 °C140.14031.6645.6890.9888
75:25 158.788100.8970.7070.9996
90:10 112.08126.7241.0240.9910
Spent sugar beet pulpSingle55 °C336 a87 b0.44-[62]
SB:CM *25:7535 °C31.8 c1.3 d8.60.995[42]
CM:CS:SBP **2:1:139 °C194.998 e4.017 f2.7860.996[63]
SBPS–vinasse (beet molasses) ***3:137 °C583.63967.2031.0280.996[64]
a ml CH4 /g VS; b ml CH4 /g VS-d; c L CH4; d L CH4/day; e mL/g TS; f mL/g TS-d); * Sugar beet by products (SB) ** Corn silage (CN); Sugar beet Pulp (SBP); *** Sugar beet pulp silage (SBPS).
Publisher’s Note: MDPI stays neutral with regard to jurisdictional claims in published maps and institutional affiliations.

