Performance of Three Different Native Plant Mixtures for Extensive Green Roofs in a Humid Subtropical Climate Context


1
Department of Agronomy, Food, Natural Resources, Animals and Environment (DAFNAE), University of Padova, Viale dell’Università, 16, 35020 Legnaro, Italy
2
Department of Land, Environment, Agriculture and Forestry, University of Padova, Agripolis, Viale dell’Università 16, 35020 Legnaro, Italy
*
Author to whom correspondence should be addressed.
Water 2020, 12(12), 3484; https://doi.org/10.3390/w12123484
Submission received: 28 September 2020
/
Revised: 28 November 2020
/
Accepted: 9 December 2020
/
Published: 11 December 2020
(This article belongs to the Special Issue Green Roofing with Native Species: Enhance Water Use and Sustainability)
Abstract
:Most of the services and benefits of green roofs are related to the substrate as well as the vegetation layer. Although plant selection should be made on the basis of green roof typology, morphology, and climate conditions, very often, Sedum species only are used worldwide. However, they do not always guarantee the best performances; hence, it is important to investigate different plant species and their performance in different climate contexts. Herein, an experiment was conducted using three plant mixes (i.e., a Sedum mix, a perennial herbaceous mix, and a suffruticose mix), grown in boxes containing two substrates (a volcanic substrate or a recycled crushed brick substrate) and two drainage/storage layers (a preformed layer or a mineral layer), in factorial combination. The Sedum mix showed a high canopy cover, comparable to or even higher than that of the other mixes, particularly when supplemental irrigation was stopped. However, the actual crop coefficient (Kc act) of the herbaceous and suffruticose mixes was often higher than that of the Sedum mix. The results also showed that both the substrate and the drainage/storage layer may improve Kc act values as a consequence of their capacity for stormwater retention.
1. Introduction
The presence and coverage of plants have great influence on the services and benefits of green roofs [1], among which the most appreciated are those related to stormwater management, such as the delay in runoff peak and the direct retention of a portion of the rainfall, even if most of this retention is a function of the growth substrate [2,3,4,5]. Additionally, the vegetation and substrate of green roofs can also provide a wildlife habitat for many species and can improve biodiversity [1].
Urban surfaces and roof coatings contribute to the urban heat island (UHI) effect. Green roofs can mitigate the UHI effect and can improve building energy performance thanks to the characteristics of their layers and the presence of vegetation. In particular, the lower roof temperatures in summer result in energy savings from lower air conditioning costs. Green roof vegetation can mitigate air temperature via evapotranspiration phenomena, but albedo (reflectivity) is also a key determinant of roof temperature, with more reflective vegetation correlated with lower surface temperatures [6,7,8,9,10].
Green roofs can enhance the ornamental and landscape design both inside and outside urban areas, increasing the esthetic value of property [11,12]. Furthermore, despite vegetation suffering from pollution, at the same time, it is the main means through which pollutants can be reinserted into natural environments thanks to interception and biological re-elaboration [13], also achieved under green roof conditions [14]. In particular, the main reduced pollutants are nitrogen oxides (removed by leaf absorption and sometimes used by the plant as a source of nitrogen), sulfur dioxide (absorbed and reduced, but toxic in large quantities), carbon monoxide (removed in small quantities), chlorine compounds (effectively removed), and ozone (removed very effectively, but rapidly toxic for many species) [15].
Recently, green roofs have gained interest in Italy, and are among the preferred natural water retention measures (NWRMs) with vegetation [16,17], which also include rain gardens and bioretention basins. However, their spreading is generally based on the application of ready-to-use packages, which are poorly tested under specific environmental conditions.
As mentioned above, among green roof components, the growing substrate type and thickness play the most important role in runoff reduction, but the vegetation layer can also affect runoff by intercepting, retaining, and transpiring rainwater [18,19,20]. The stormwater retention efficiency of a green roof is, in fact, a consequence of its evapotranspiration feature and, focusing on the contribution of vegetation, of its water use efficiency (i.e., crop coefficient (Kc)).
Despite Sedum species being the most used plant material worldwide [21,22], they do not always assure the most benefits in terms of performance, for example, stormwater retention, cooling effect, and natural biodiversity preservation [23,24,25,26,27], and sometimes do not even guarantee plant survival [28]. Hence, there is great interest in exploring different plant species, with major emphasis on native species adapted to water shortage [23,29].
Herein, a study was carried out to test the green roof solution that is most suitable in the humid subtropical climate context of the Veneto Plain and that is able to better manage rainfall water for reducing outflow volumes from building roofs into the urban drainage systems. Twelve green roof microcosms derived from the factorial combination of three mixtures of native plants, two substrates, and two drainage/storage layers were studied. Specifically, in this paper, the plant performances in terms of plant cover and actual crop coefficient are reported.
2. Materials and Methods
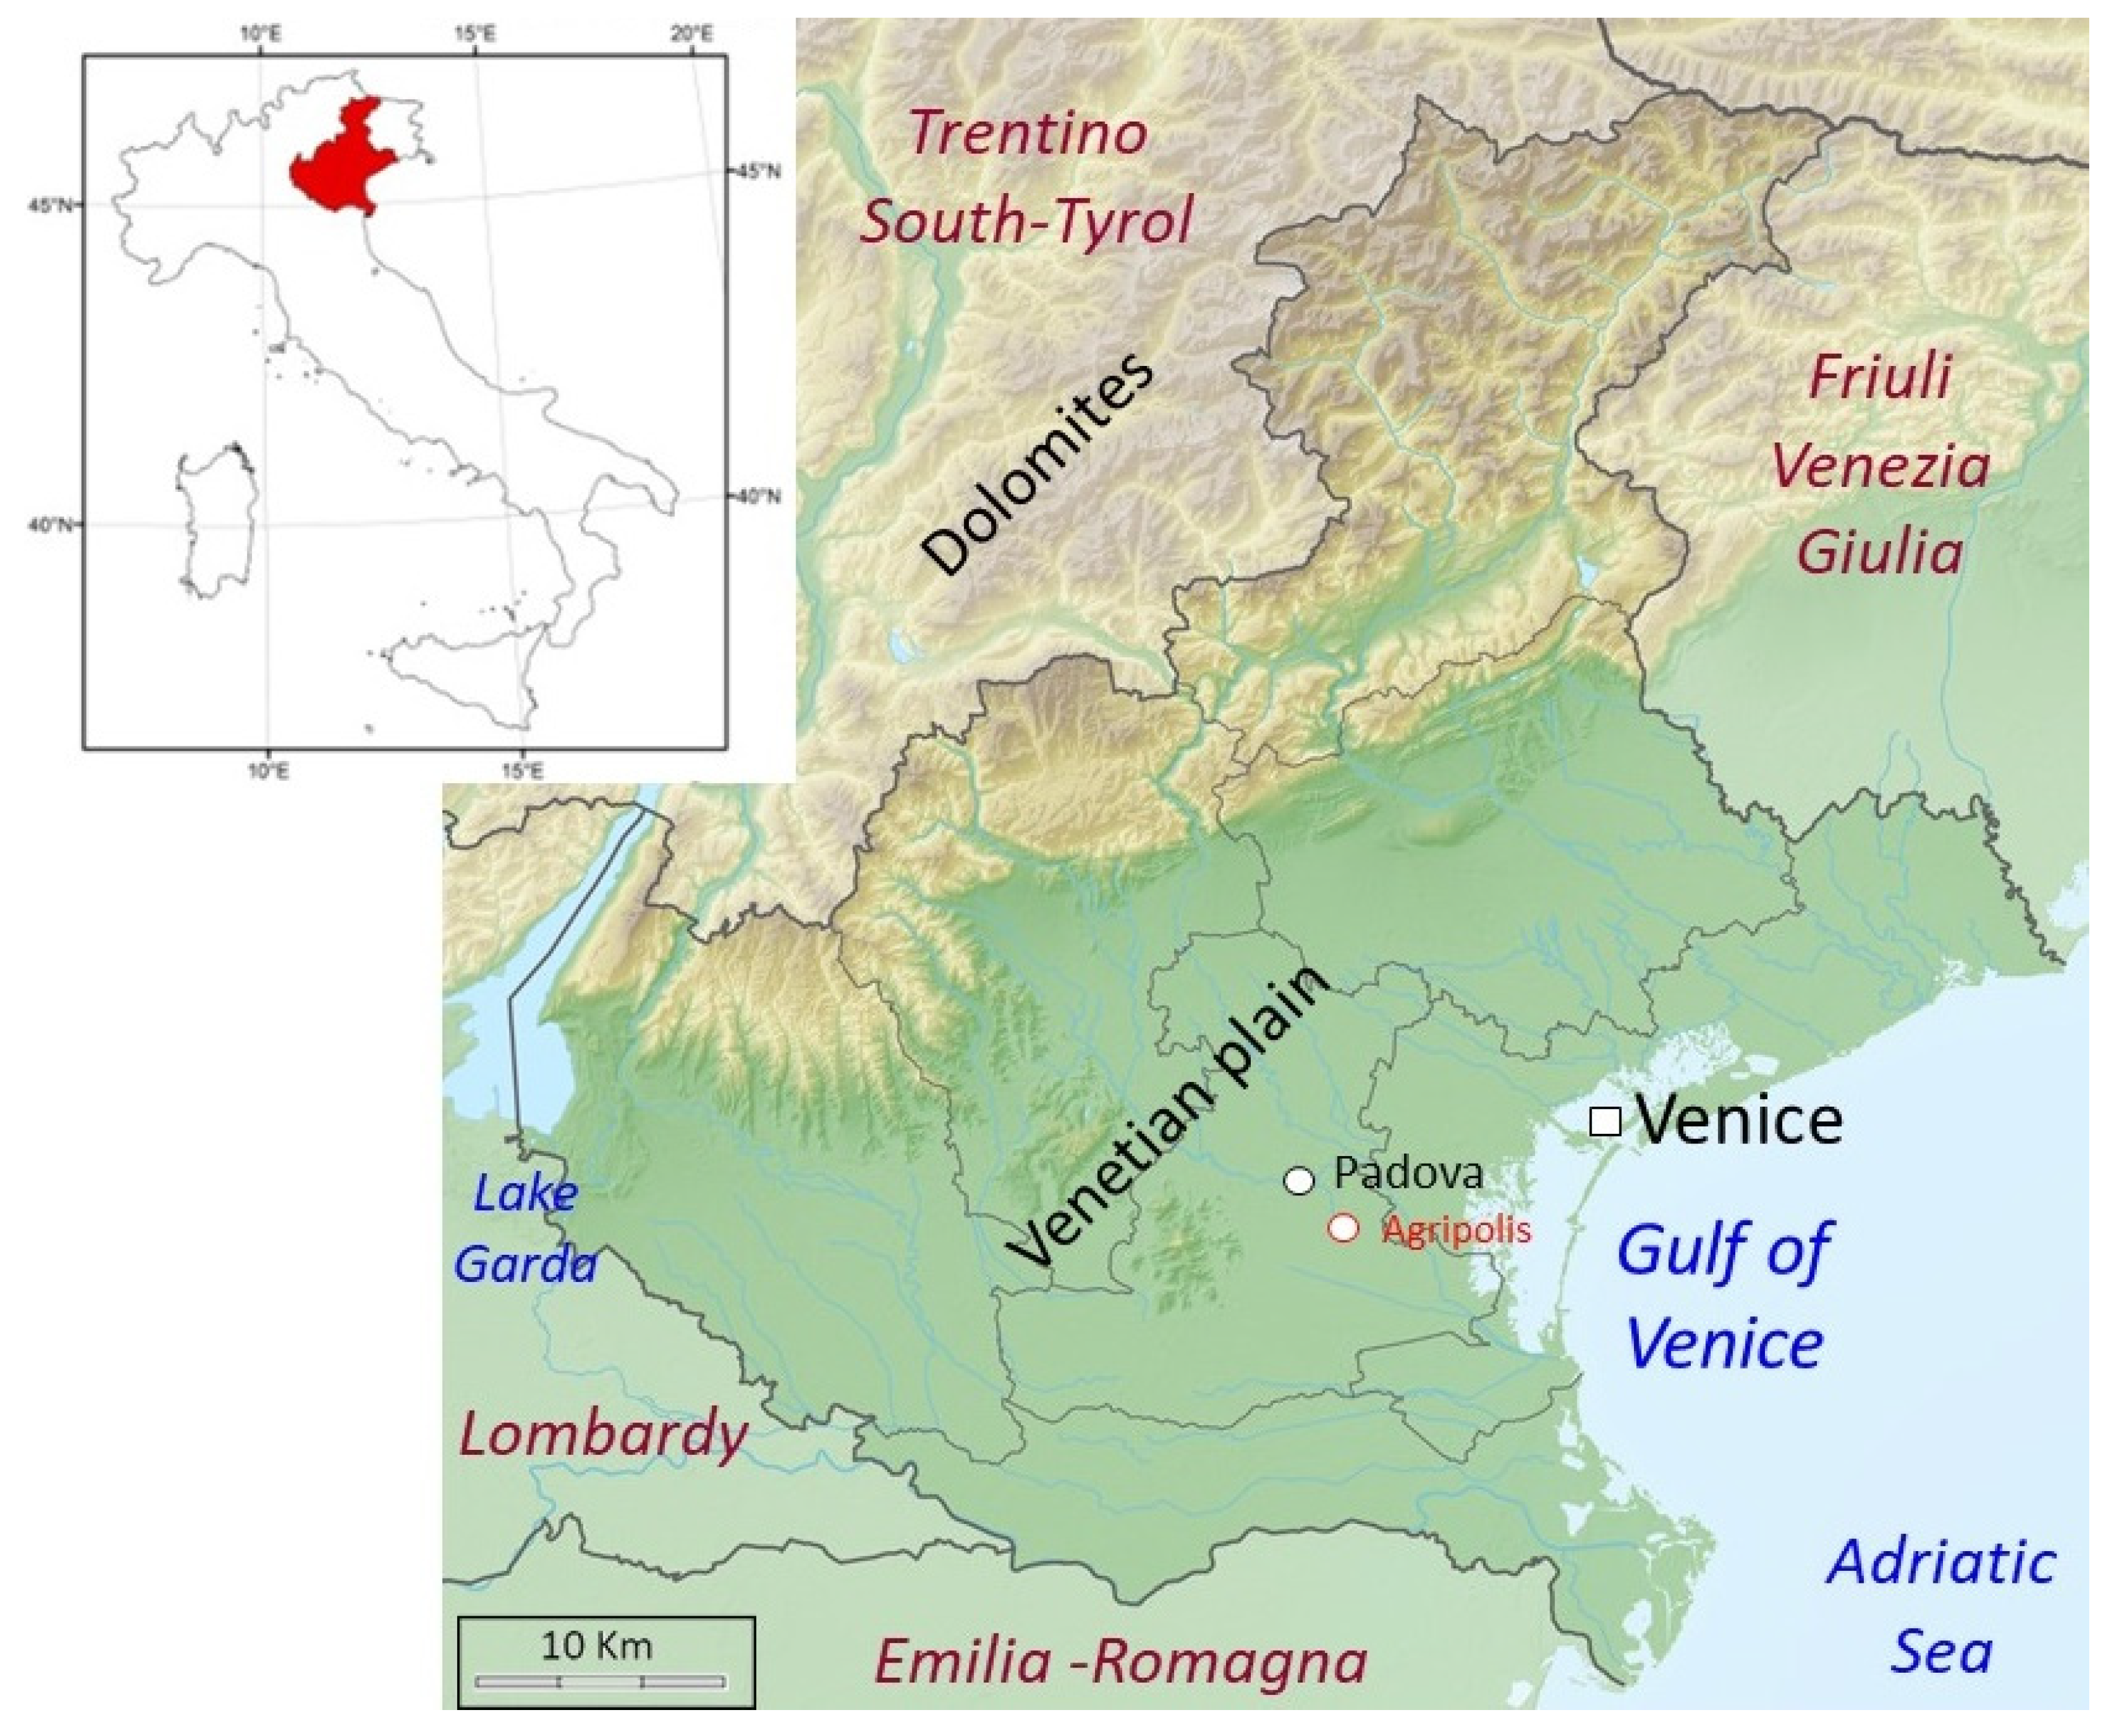
The experiment was conducted in the Agripolis Campus of the University of Padova, located in Legnaro (45°20′26″ N; 11°58′0″ E) in the Veneto region (northeastern Italy) (Figure 1). The plain of the Veneto region is characterized by a humid subtropical climate, with a mean annual temperature of 13–14 °C and annual precipitation ranging from 700 to 1000 mm [30]. Precipitation is concentrated in spring and autumn, with quite frequent high-intensity events, especially during summer, and convective storms. During the test, weather data (precipitation, air temperature, and air humidity) were recorded by the weather station located on campus.
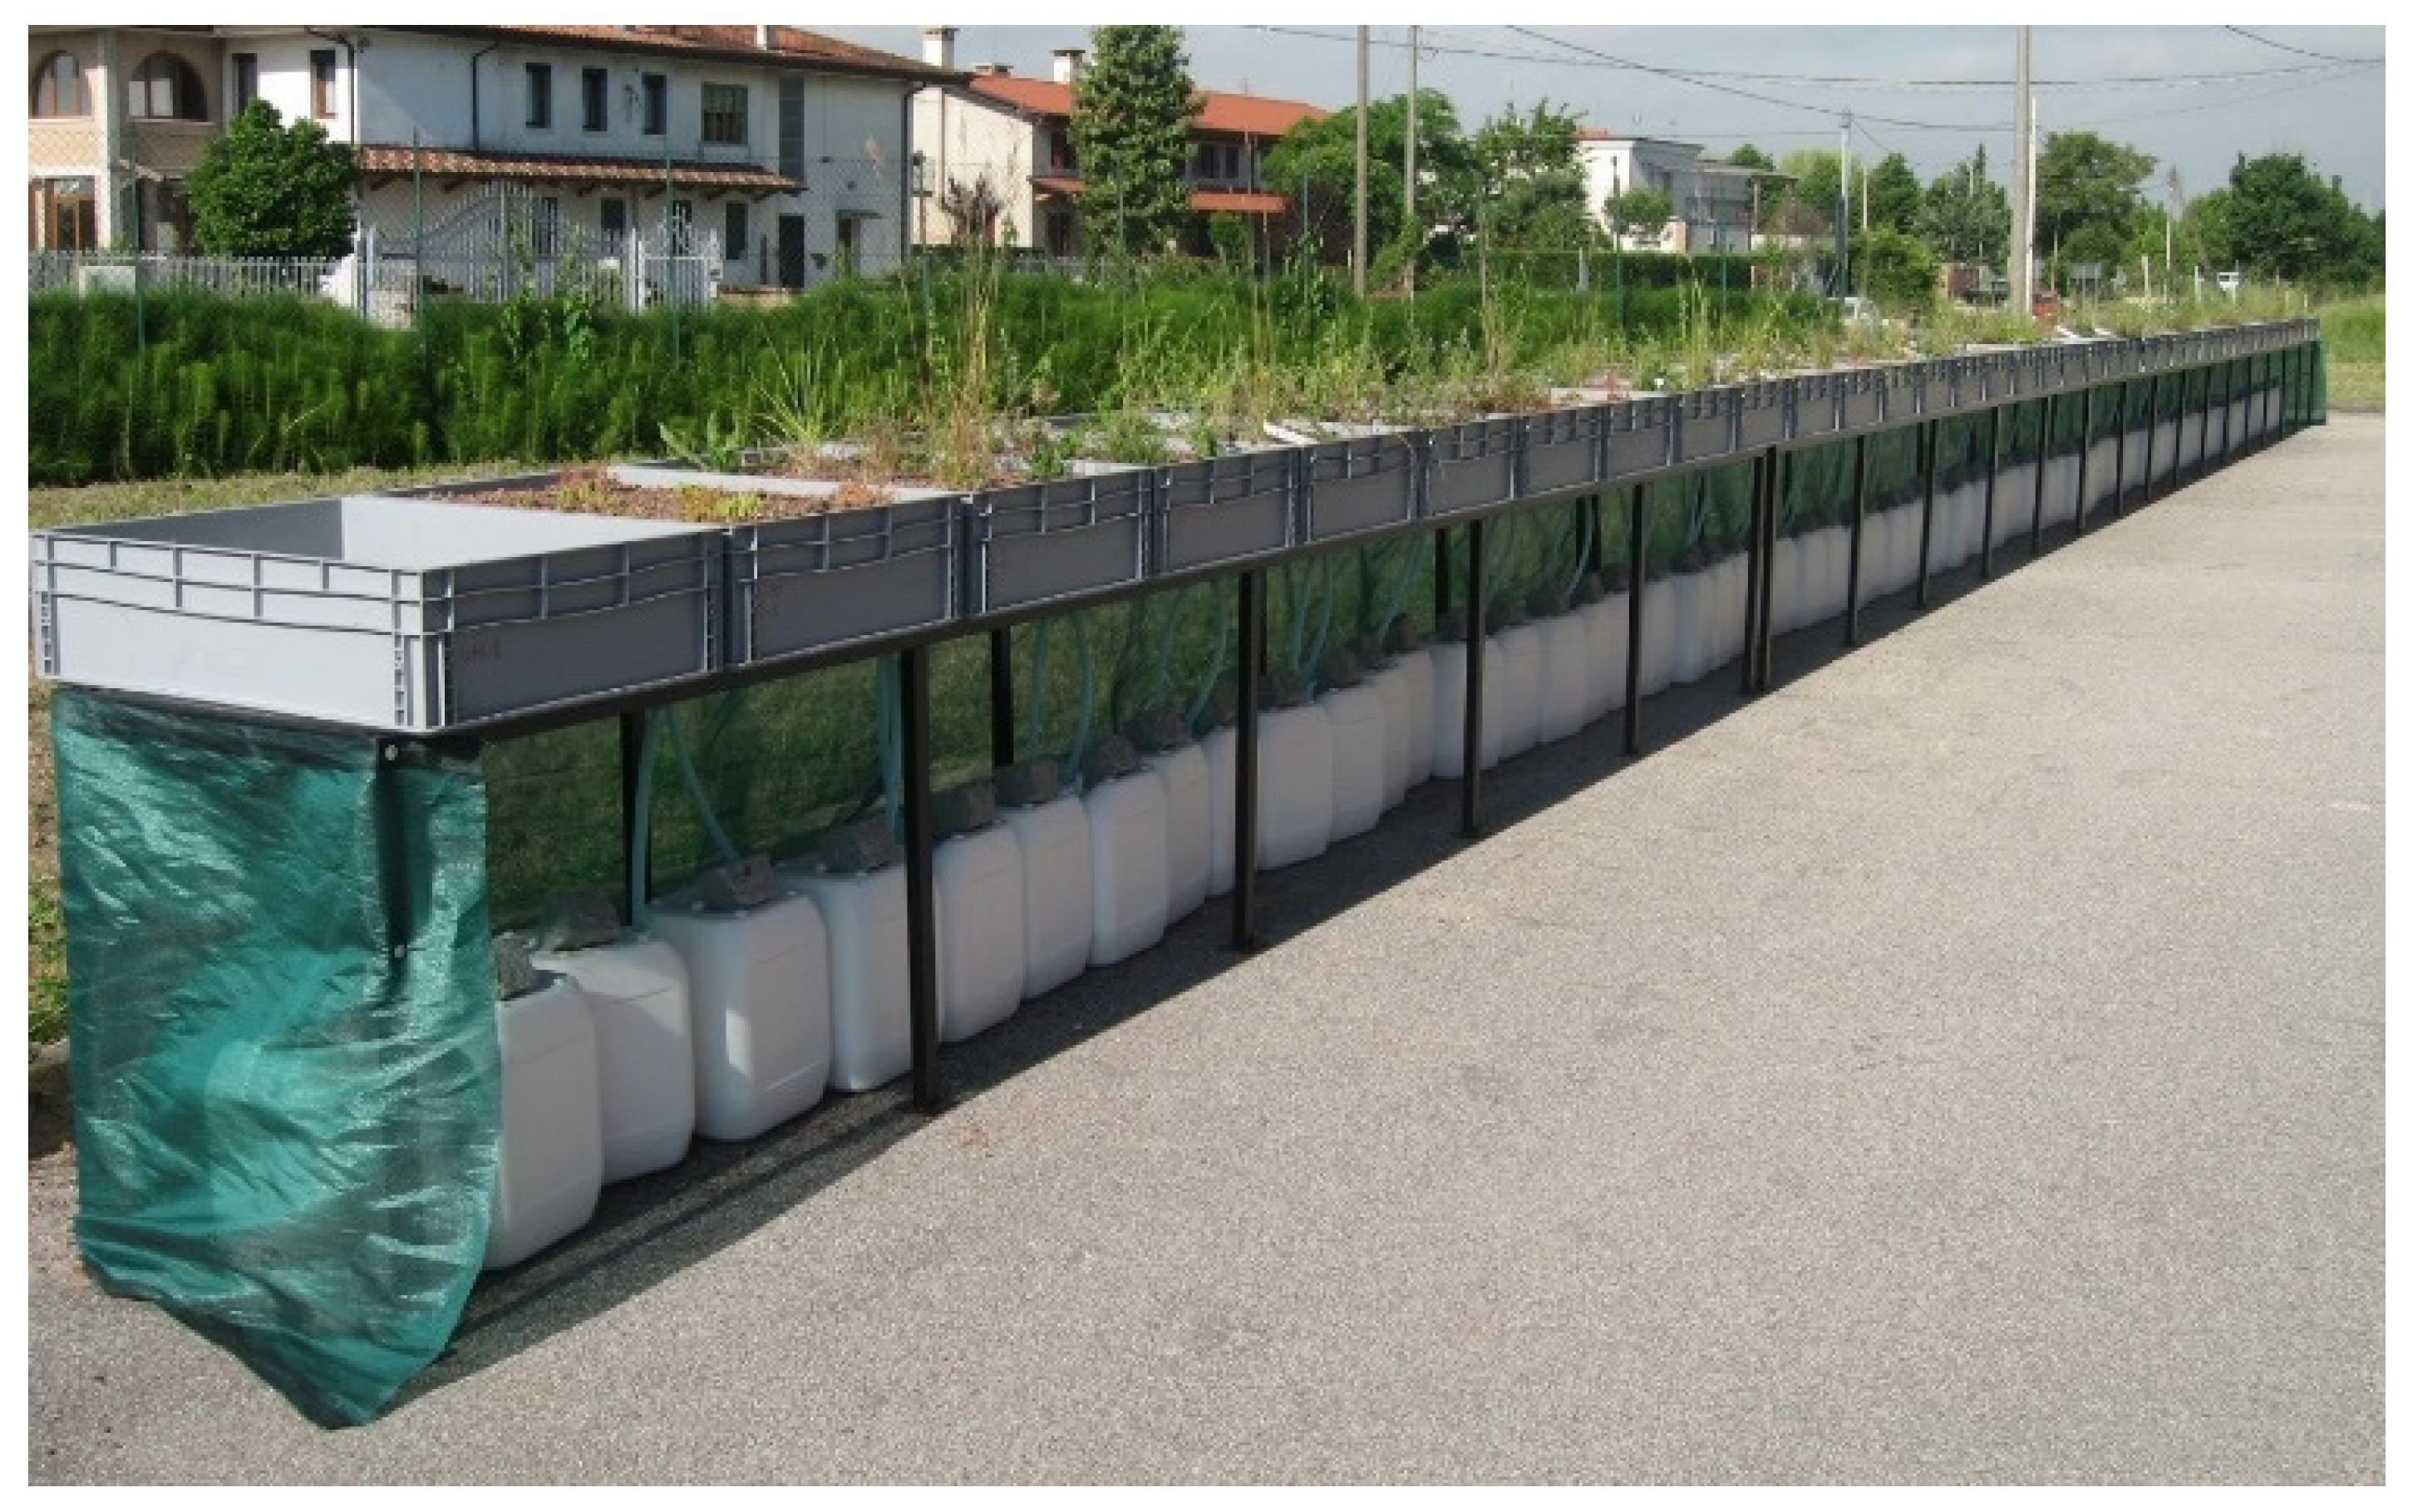
The trial involved the setting of different solutions of green roofs (microcosms) using plastic boxes (polypropylene (PP)) with a height of 22 cm and approximately 0.44 m2 of surface. A drain hole in the center of the bottom of the box was created to convey percolation water (outflow) into tanks, where it was collected and measured for the evaluation of the crop coefficient. A tubular steel structure kept the boxes raised approximately 1 m off of the ground (Figure 2).
Each green roof microcosm consisted of a combination of different layers, namely, a drainage/storage layer, a filter sheet, and a substrate with vegetation.
The drainage/storage layers were as follows:
- A preformed layer (PL) in recycled high-density polyethylene (HDPE) (Bauder DSE 40, Bauder GmbH, Stuttgart, Germany);
- A mineral layer (ML) composed of expanded perlite (Igroperlite Type 3, Perlite Italiana S.r.l., Corsico, Italy).
The substrates were as follows:
- A volcanic substrate (VS) (Vulcaflor Extensive, Europomice S.r.l., Milan, Italy);
- A recycled crushed brick substrate (RS) (“Rockery Type Plants”, Zinco GmbH, Nuertingen, Germany).
The water retention capacity of the substrates was 36 mm and 48 mm for VS and RS, respectively, while that of the drainage/storage layer was 16.5 mm and 18 mm for PL and ML, respectively. The other hydrological characteristics of the different layers were reported by Bettella et al. [30].
On these different combinations of layers, three different mixtures of plant species were transplanted:
- A mixture of Sedum species (SE): Sedum album L., Sedum acre L., Sedum reflexum L., and Sedum sexangulare L.;
- A mixture of herbaceous (HE) perennials: Melica ciliata L., Artemisia alba Turra, Bromus erectus Huds, and Dianthus carthusianorum L.;
- A mixture of suffruticose (SF): Potentilla pusilla Host, Clinopodium nepeta L., Thymus serpillum L., Euphorbia cyparissas L., i L., Campanula spicata L., and Dianthus hyssopifolius L.
The species were selected from among native plants found in dry natural habitats because they were considered to have higher adaptability to the specific environmental context and to green roof conditions; plants were collected in dry grasslands or sandy and rocky soils close to the experimental site, or were provided by Veneto Agricoltura’s Centre for Biodiversity and Outside-Forest Activities, Veneto’s regional agency for innovation in the primary sector.
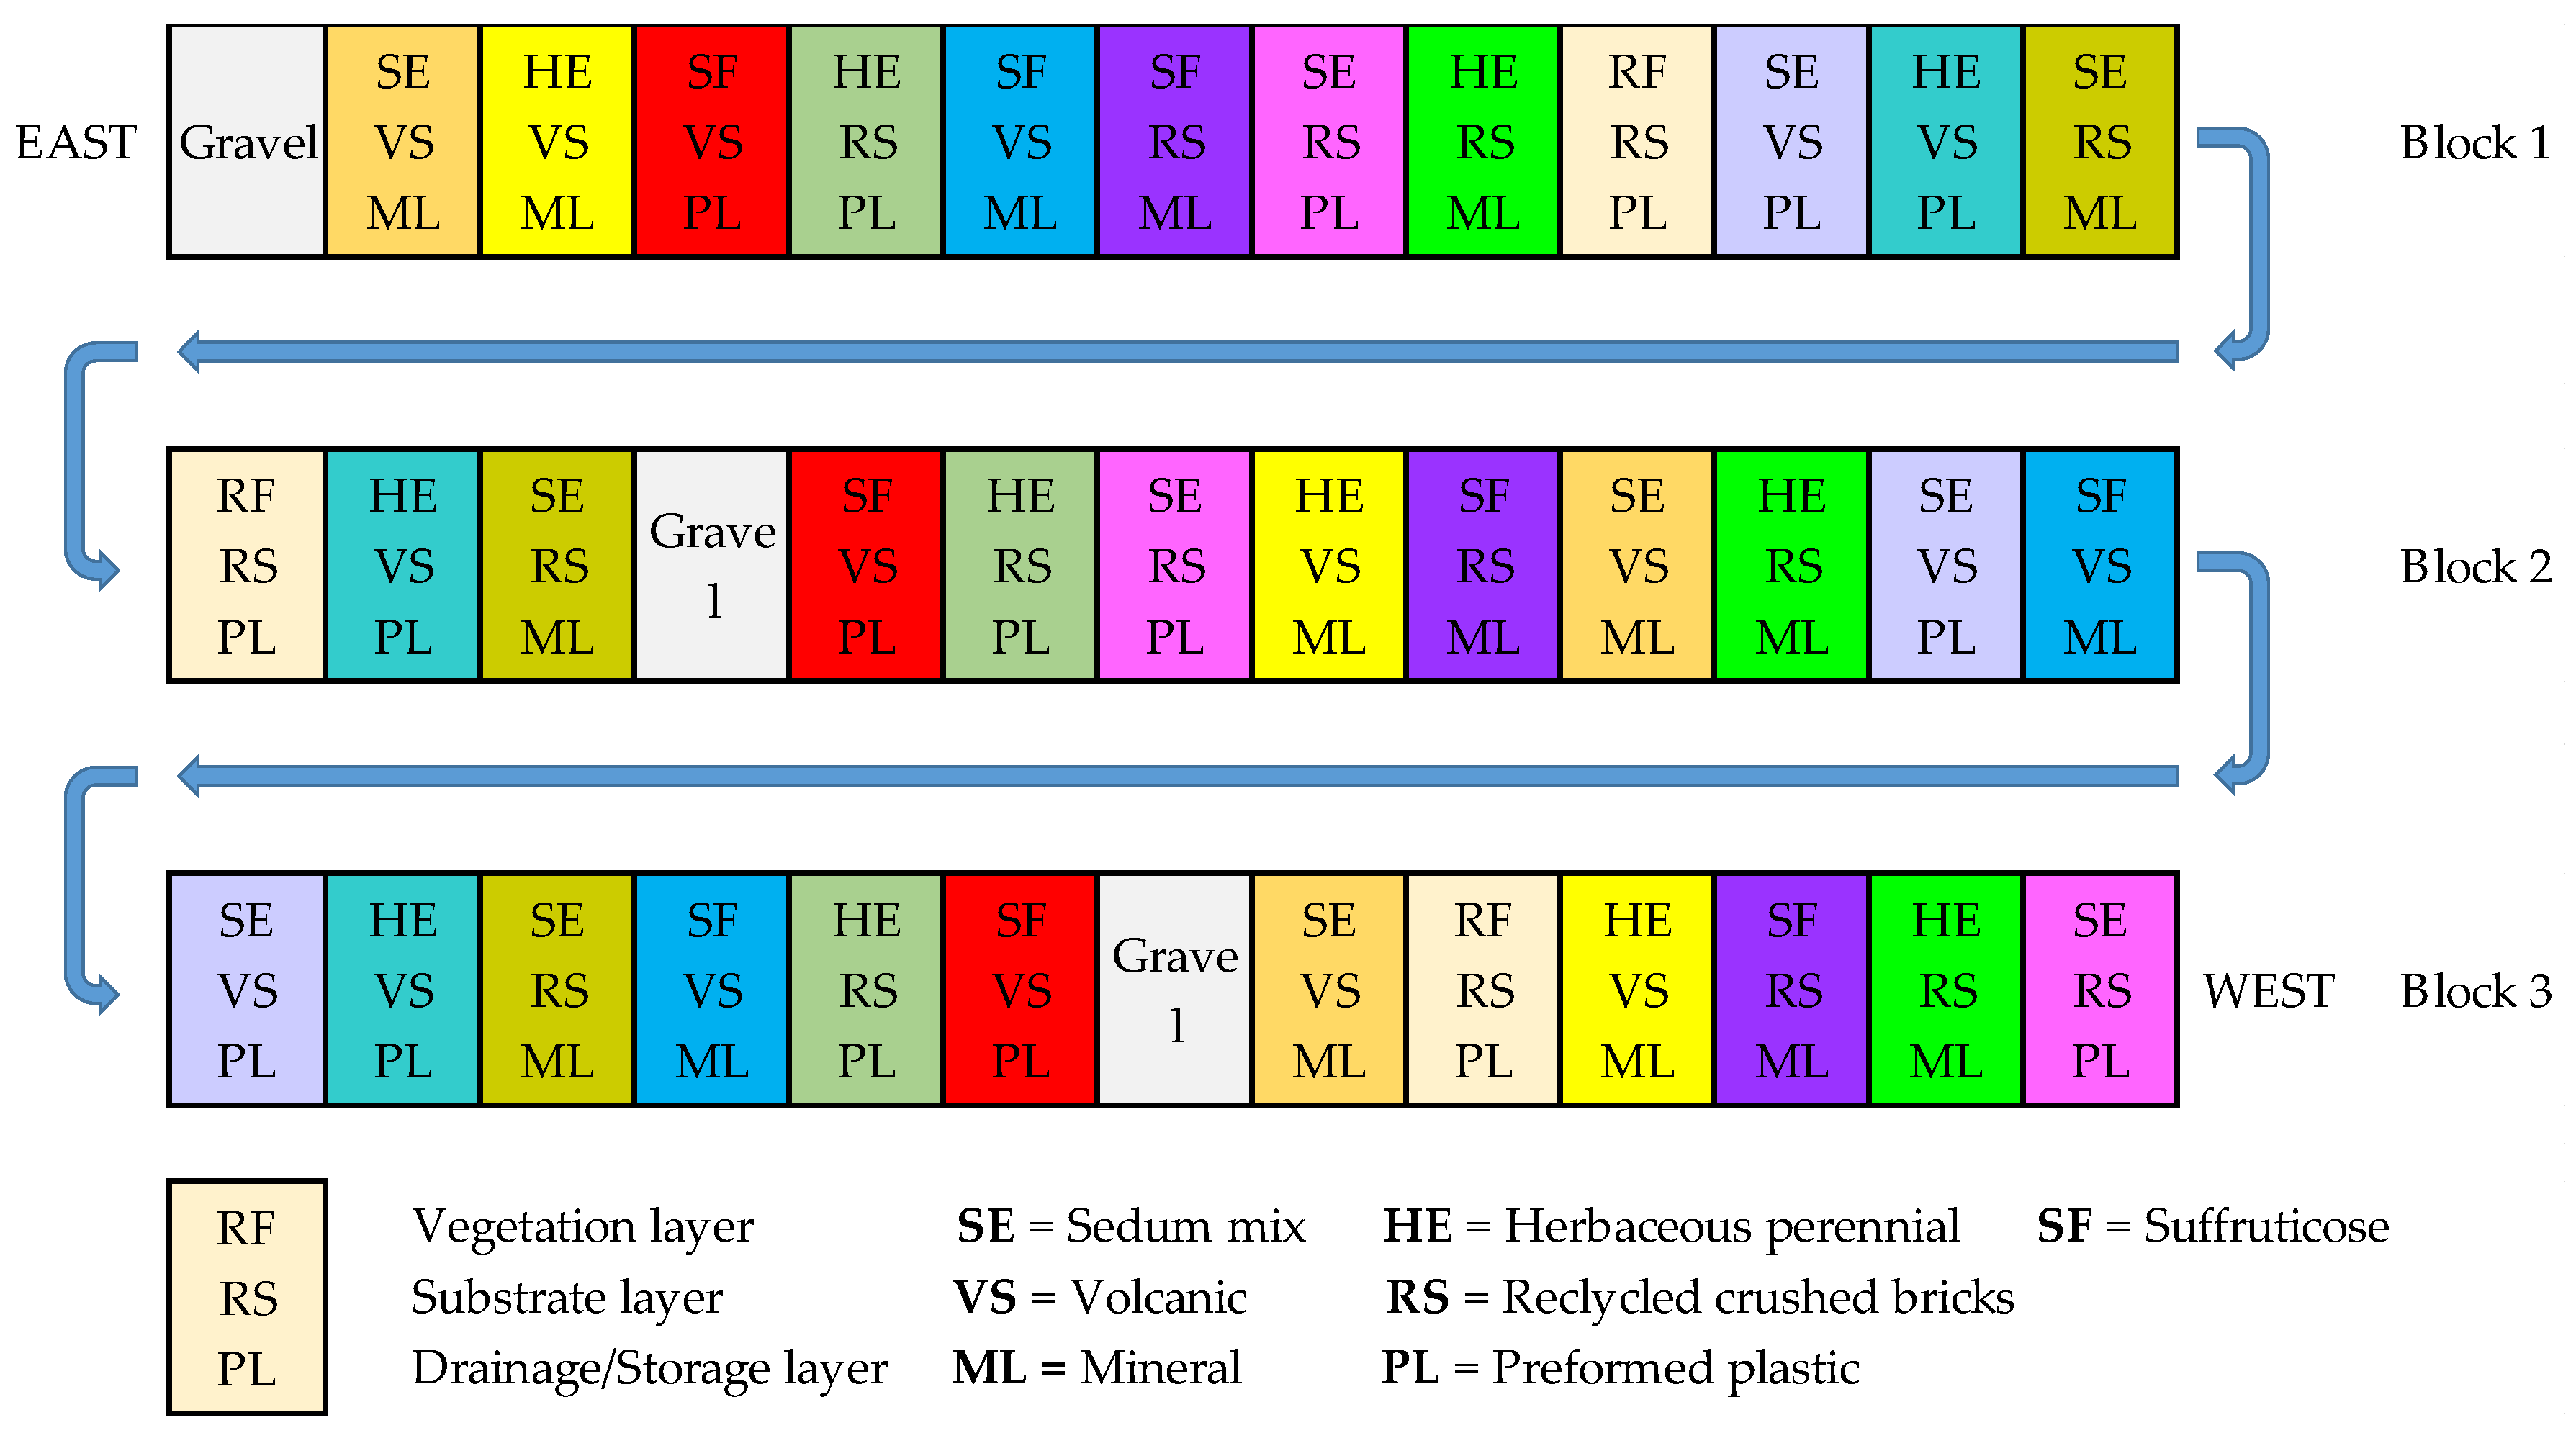
All 12 combinations (3 plant mixes × 2 substrates × 2 storage/drainage layers) were replicated three times, for a total of 36 microcosms. Three boxes were filled with gravel and used as controls (traditional roof with drainage element), whose significance will be illustrated in a forthcoming paper. The experimental design was a randomized complete block (Figure 3).
The experiment began in May 2014 when planting material, grown in 10 cm containers, was transplanted. A total of 15 plants per microcosm were used. During the initial phase, daily irrigations of 5 L (approximately 11 mm) were given to each microcosm to ensure normal plant growth. After June 2014, supplemental irrigations were performed only when strong symptoms of wilting occurred, and this management lasted throughout the experiment until May 2016, when no more supplemental watering was given. During the two years, 12 irrigations were performed.
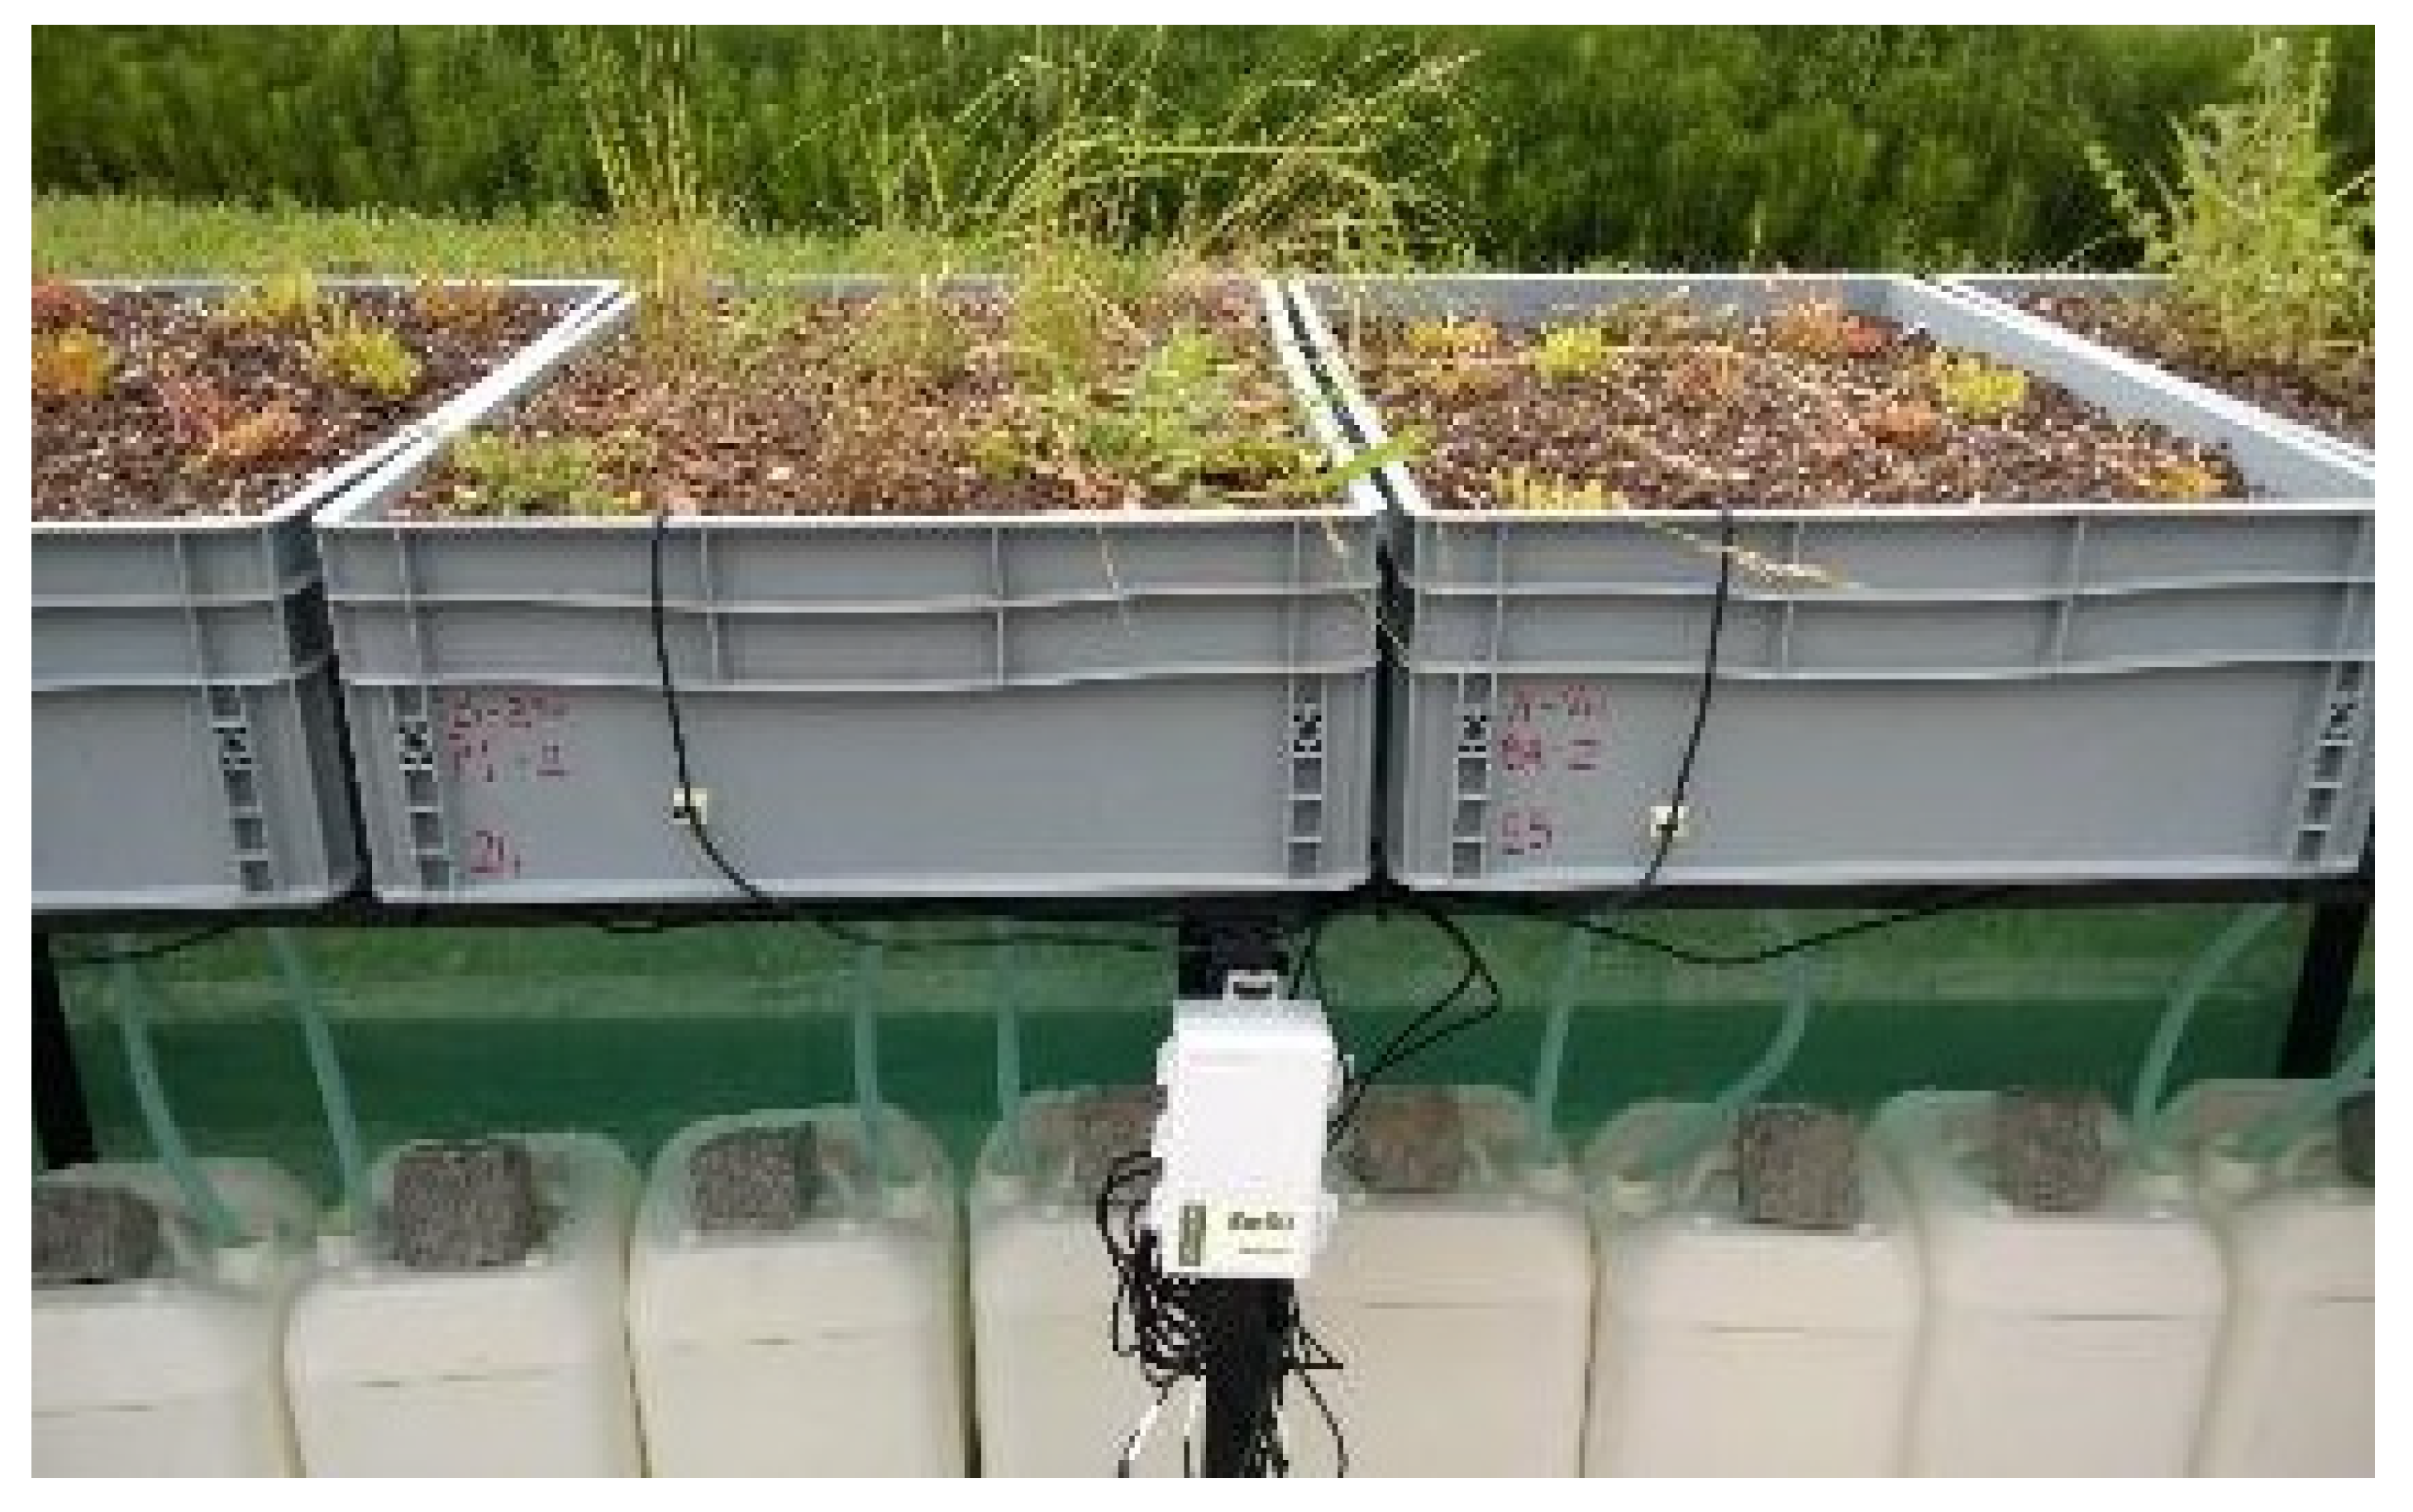
The soil moisture data of the growing media were recorded using 5TM probes positioned at a depth of 6 cm and an EM50 data logger (Decagon Devices Inc., Washington, DC, USA), set to record data every 10 min (Figure 4). Unfortunately, we soon realized that neither type of substrate allowed a correct and continuous measurement of the humidity value over time, making it impossible to compare the growth of the plants with the humidity of the substrates.
2.1. Surveys on the Development of Plant Cover
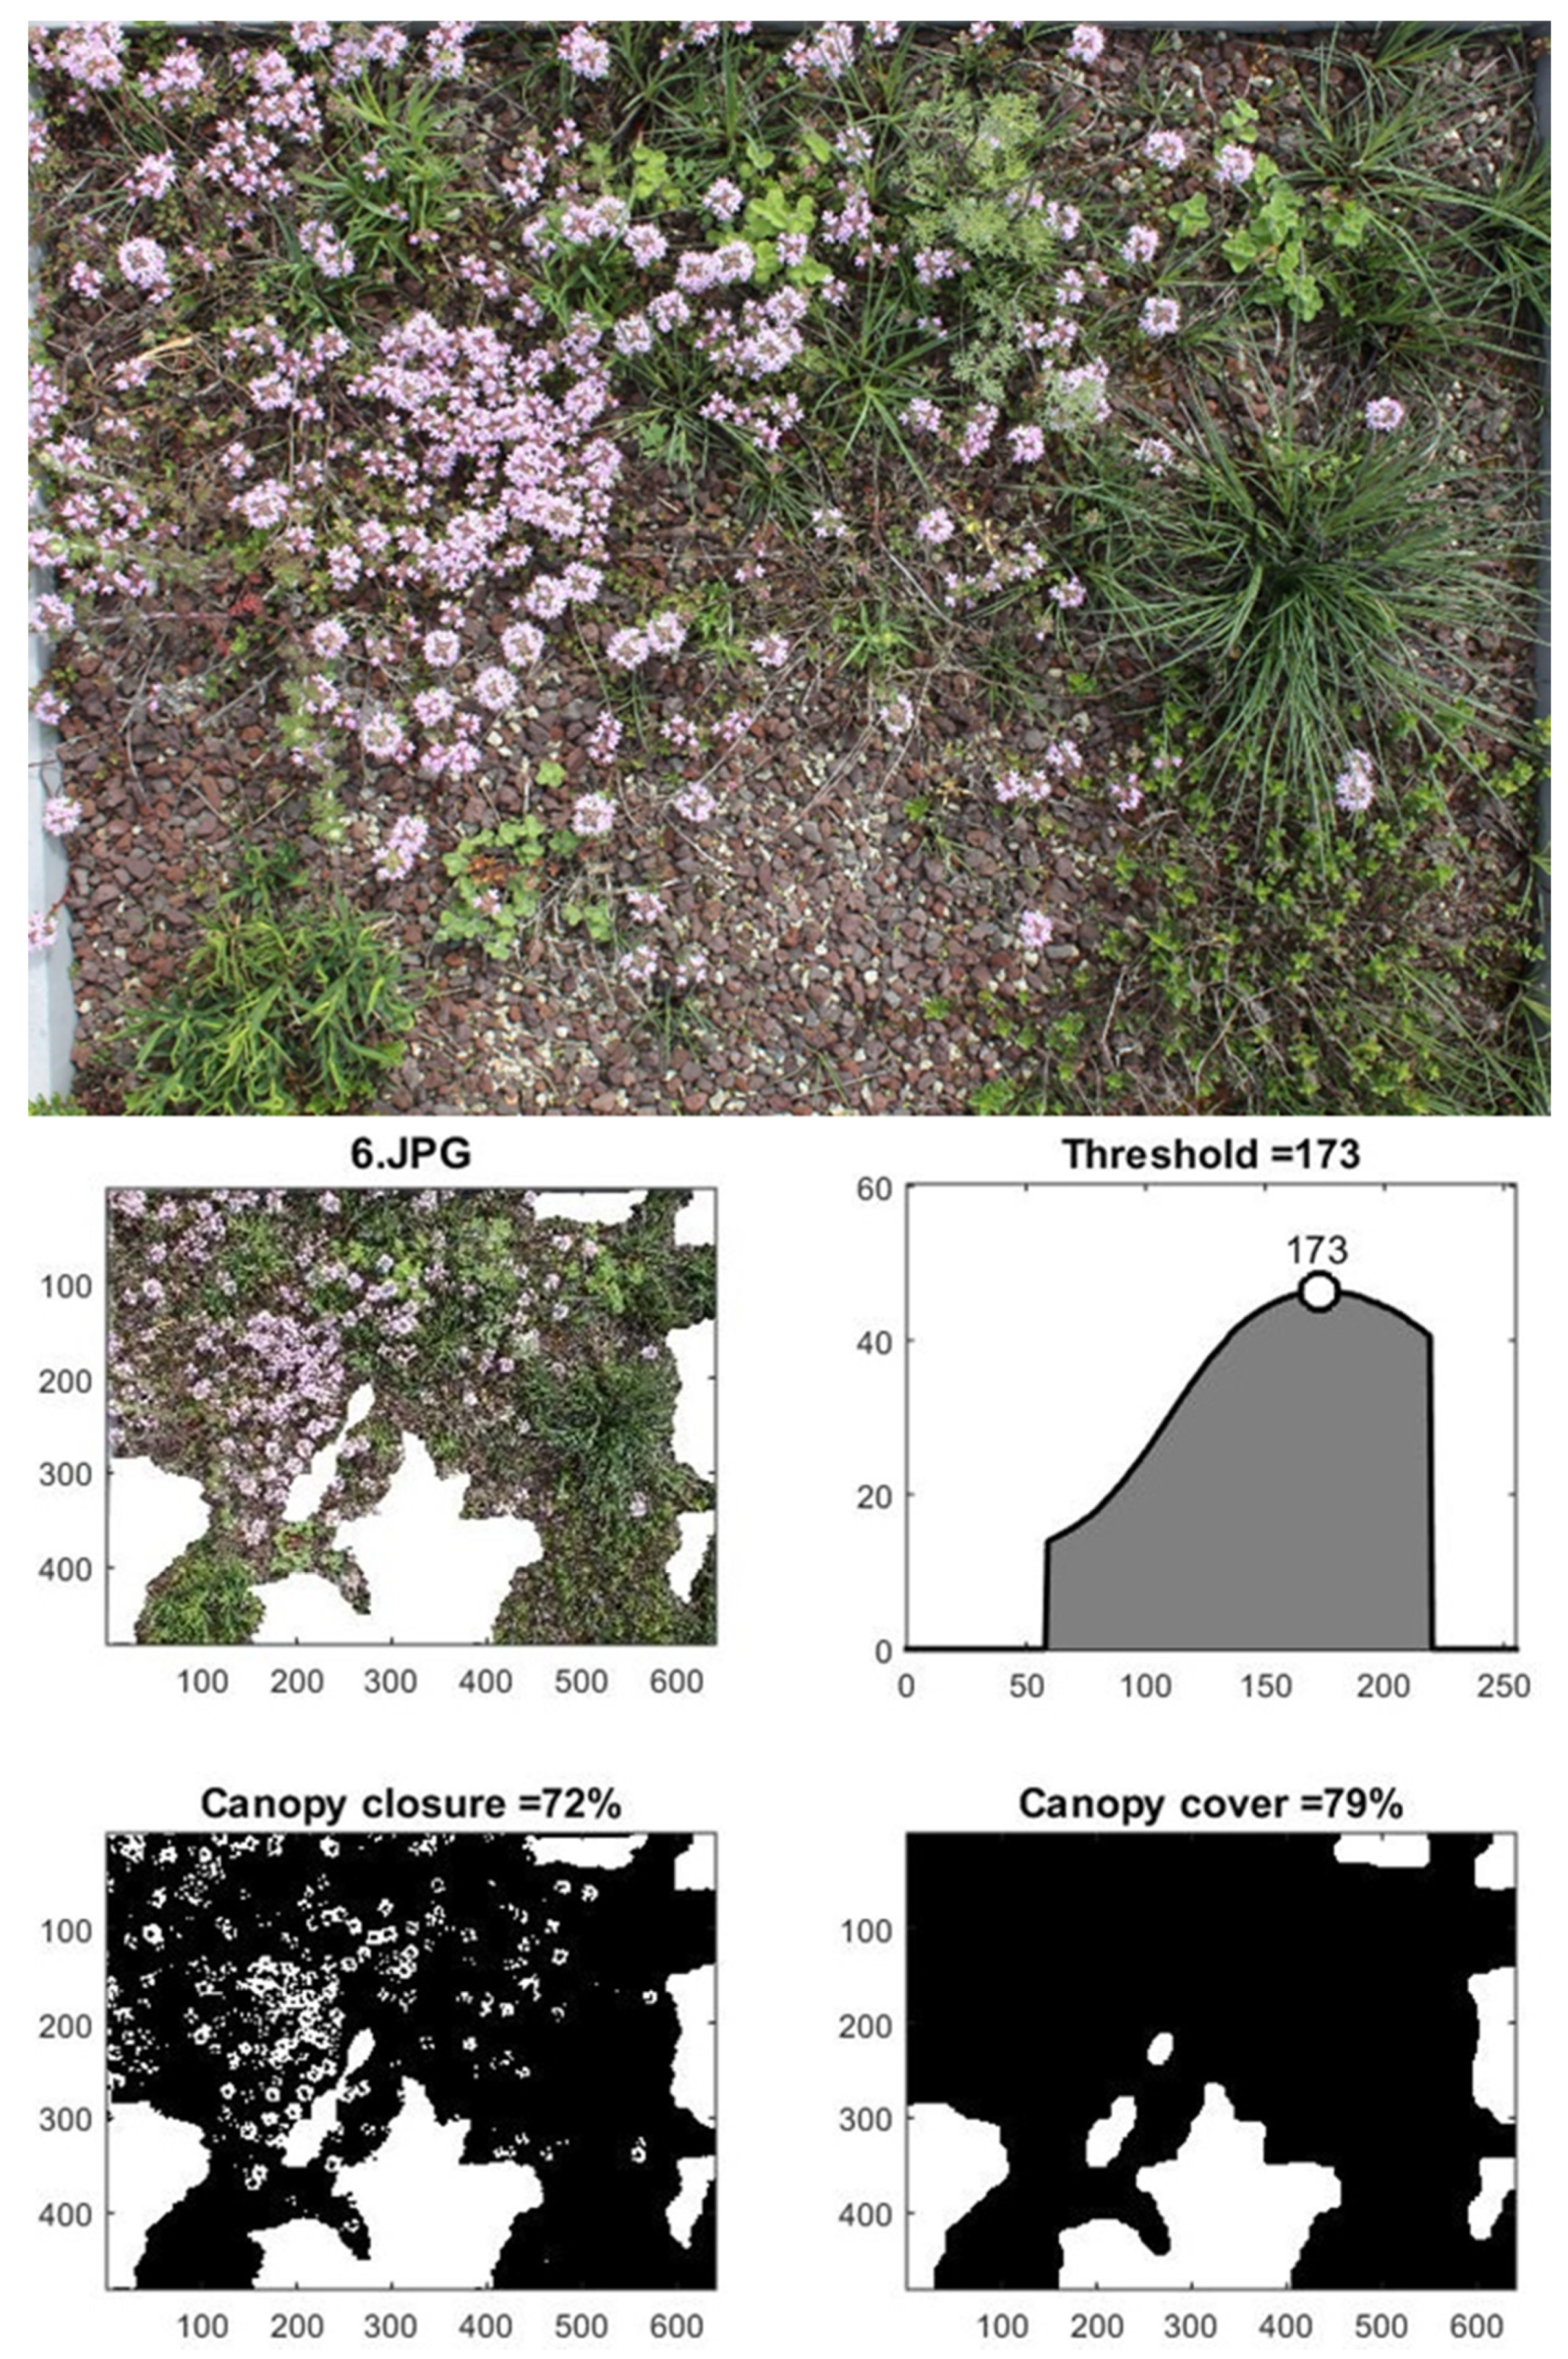
On the 19th of every month at approximately 2:00 p.m., starting from June 2014, a photographic survey of each microcosm was carried out in order to evaluate the trend of the vegetation canopy cover. A photo of each microcosm was taken with a remotely controlled GoPro Hero4 camera (Woodman Labs, Inc., San Mateo, CA, USA), placed on a mobile stand passing through the boxes (Figure 5), in order to always obtain stable photos. The photos were processed using Adobe Photoshop Lightroom (Adobe Inc., San Jose, CA, USA) to correct any lens distortions, shadows, or highlights to obtain cleaner colors and to crop the photo so that only the area inside the box was framed. ImageJ [31] was used to remove all that was not vegetation from the image, and MATLAB® software (MathWorks Inc., Matick, MA, USA) was used for the calculation of the plant cover [32] in order to obtain the percentages of canopy cover. An example of an original picture and its elaboration are given in Figure 6.
2.2. Evaluation of the Crop Coefficient
On a monthly basis, all microcosm boxes were weighed by means of an electrical scale associated with a pallet jack. For each microcosm, the monthly actual evapotranspiration (ET) was empirically determined as follows:
where P is the precipitation, I is the irrigation water, D is the drainage (outflow), and ΔW is the difference in weight of the boxes between two successive weighings, and represents the difference in water content of boxes between two dates. All the data are expressed in millimeters. In particular, ΔW data were converted to millimeters by considering the area of each box. Hence, the actual crop coefficient (Kc act) was calculated according to [33]:
where ET0 is the monthly reference evapotranspiration calculated using the Hargreaves–Samani formula modified by Berti et al. [34].
ET = P + I − D − ΔW
Kc act = ET/ET0
2.3. Statistical Analysis of the Data Collected on the Microcosms of Green Roofs
The study was arranged as a 3 × 2 × 2 factorial experiment (3 plant mixes × 2 substrates × 2 drainage/storage layers) in a completely randomized block design with three replications. Data were analyzed using a three-way analysis of variance (ANOVA), and when the ANOVA was significant (p < 0.05), the means were differentiated by Tukey’s honestly significant difference (HSD) test. Values expressed as percentages were angular-transformed prior to the ANOVA.
3. Results
3.1. Weather Conditions
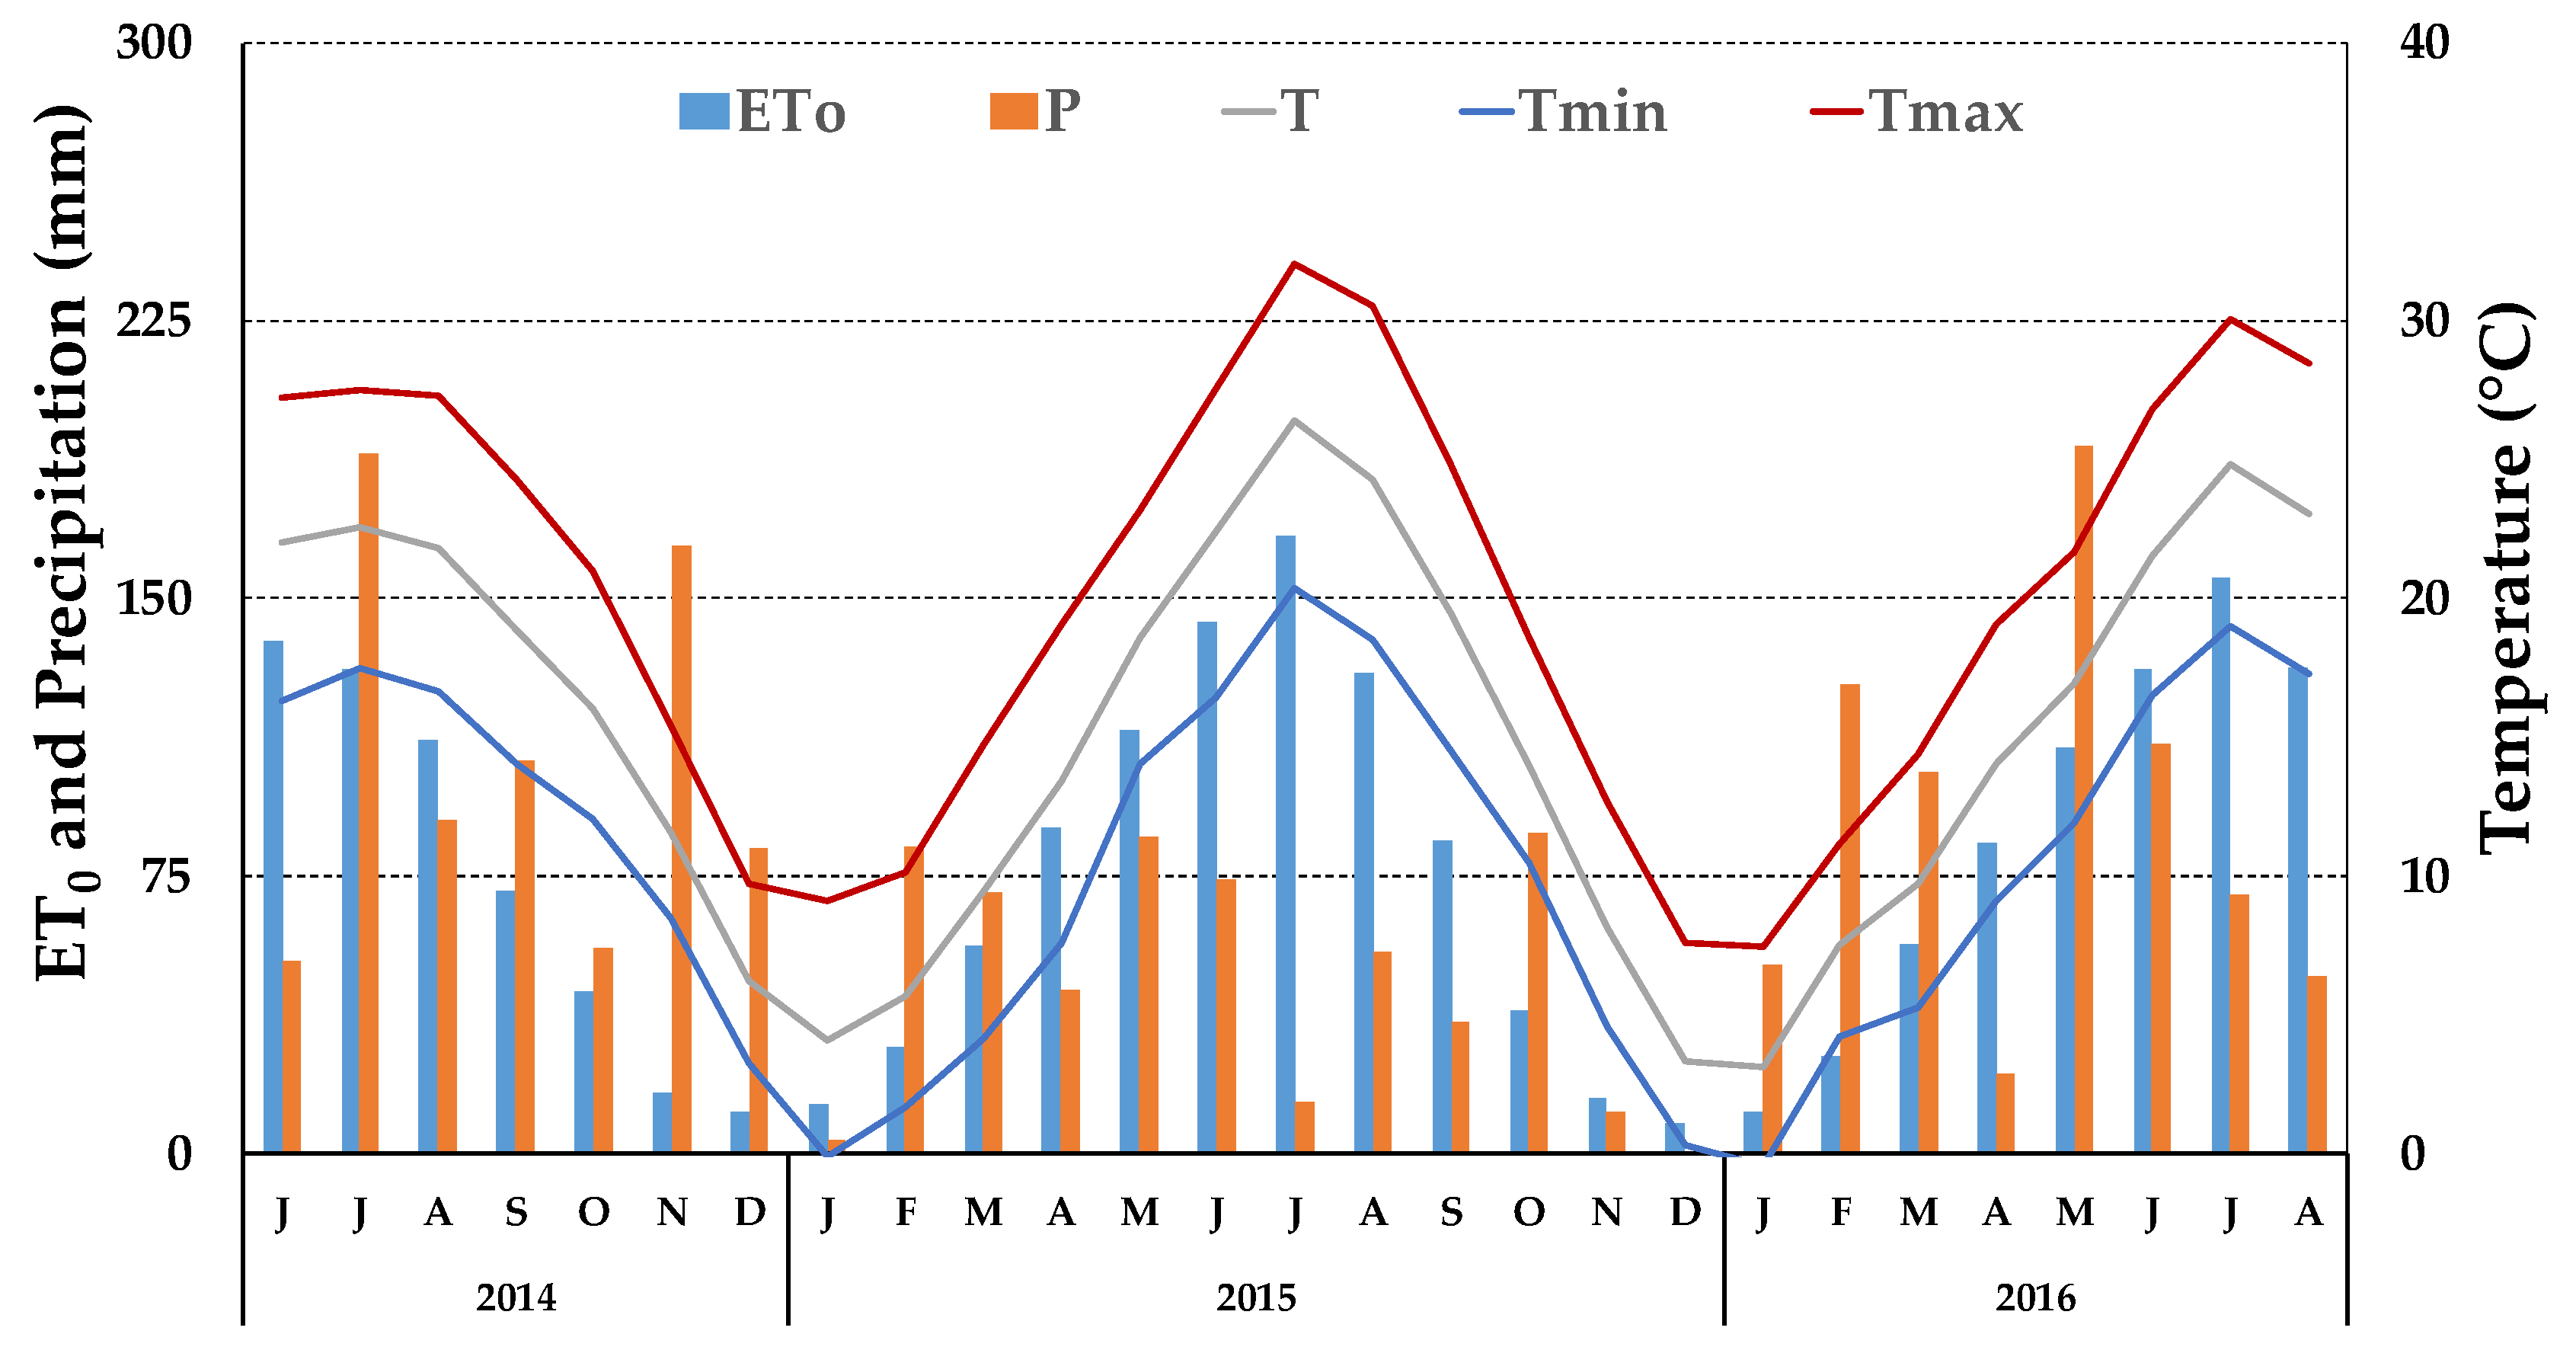
The meteorological data recorded during the experiment period are reported in Figure 7. Temperatures were particularly high in summer 2015 when the average maximum temperature was higher than 30 °C for two months. The year 2014 was characterized by a rainy summer and fall, whereas 2015 and 2016 had dry summers. During the first year of data collection (September 2014–August 2015), precipitation was 839 mm, whereas in the second year (September 2015–August 2016), it was 856 mm.
3.2. Plant Cover Evolution
The evolution of plant cover after the transplant reflected the initial plant growth (higher for the herbaceous perennials and suffruticose than for the Sedum species) and did not change substantially over the summer. Starting from April 2015, the plants began to grow, reaching the highest coverage in October–November 2015 (Figure 8); the greatest growth rate was manifested by the Sedum species that, from the lower coverage at the beginning of 2015, achieved significantly higher values compared to the other plant mixes, starting from August. During the second winter, all species showed a general coverage reduction, but it was lower for the Sedum species. During summer 2016, a consistent decrease in plant coverage was noted in all plant mixes due to the drought and the absence of supplemental irrigation, which caused the death of some plants, but it was definitely higher in the herbaceous perennials and suffruticose than in the Sedum plants. At the end of the experimental period, the Sedum mix had twice the coverage of the other mixes (Figure 8A).
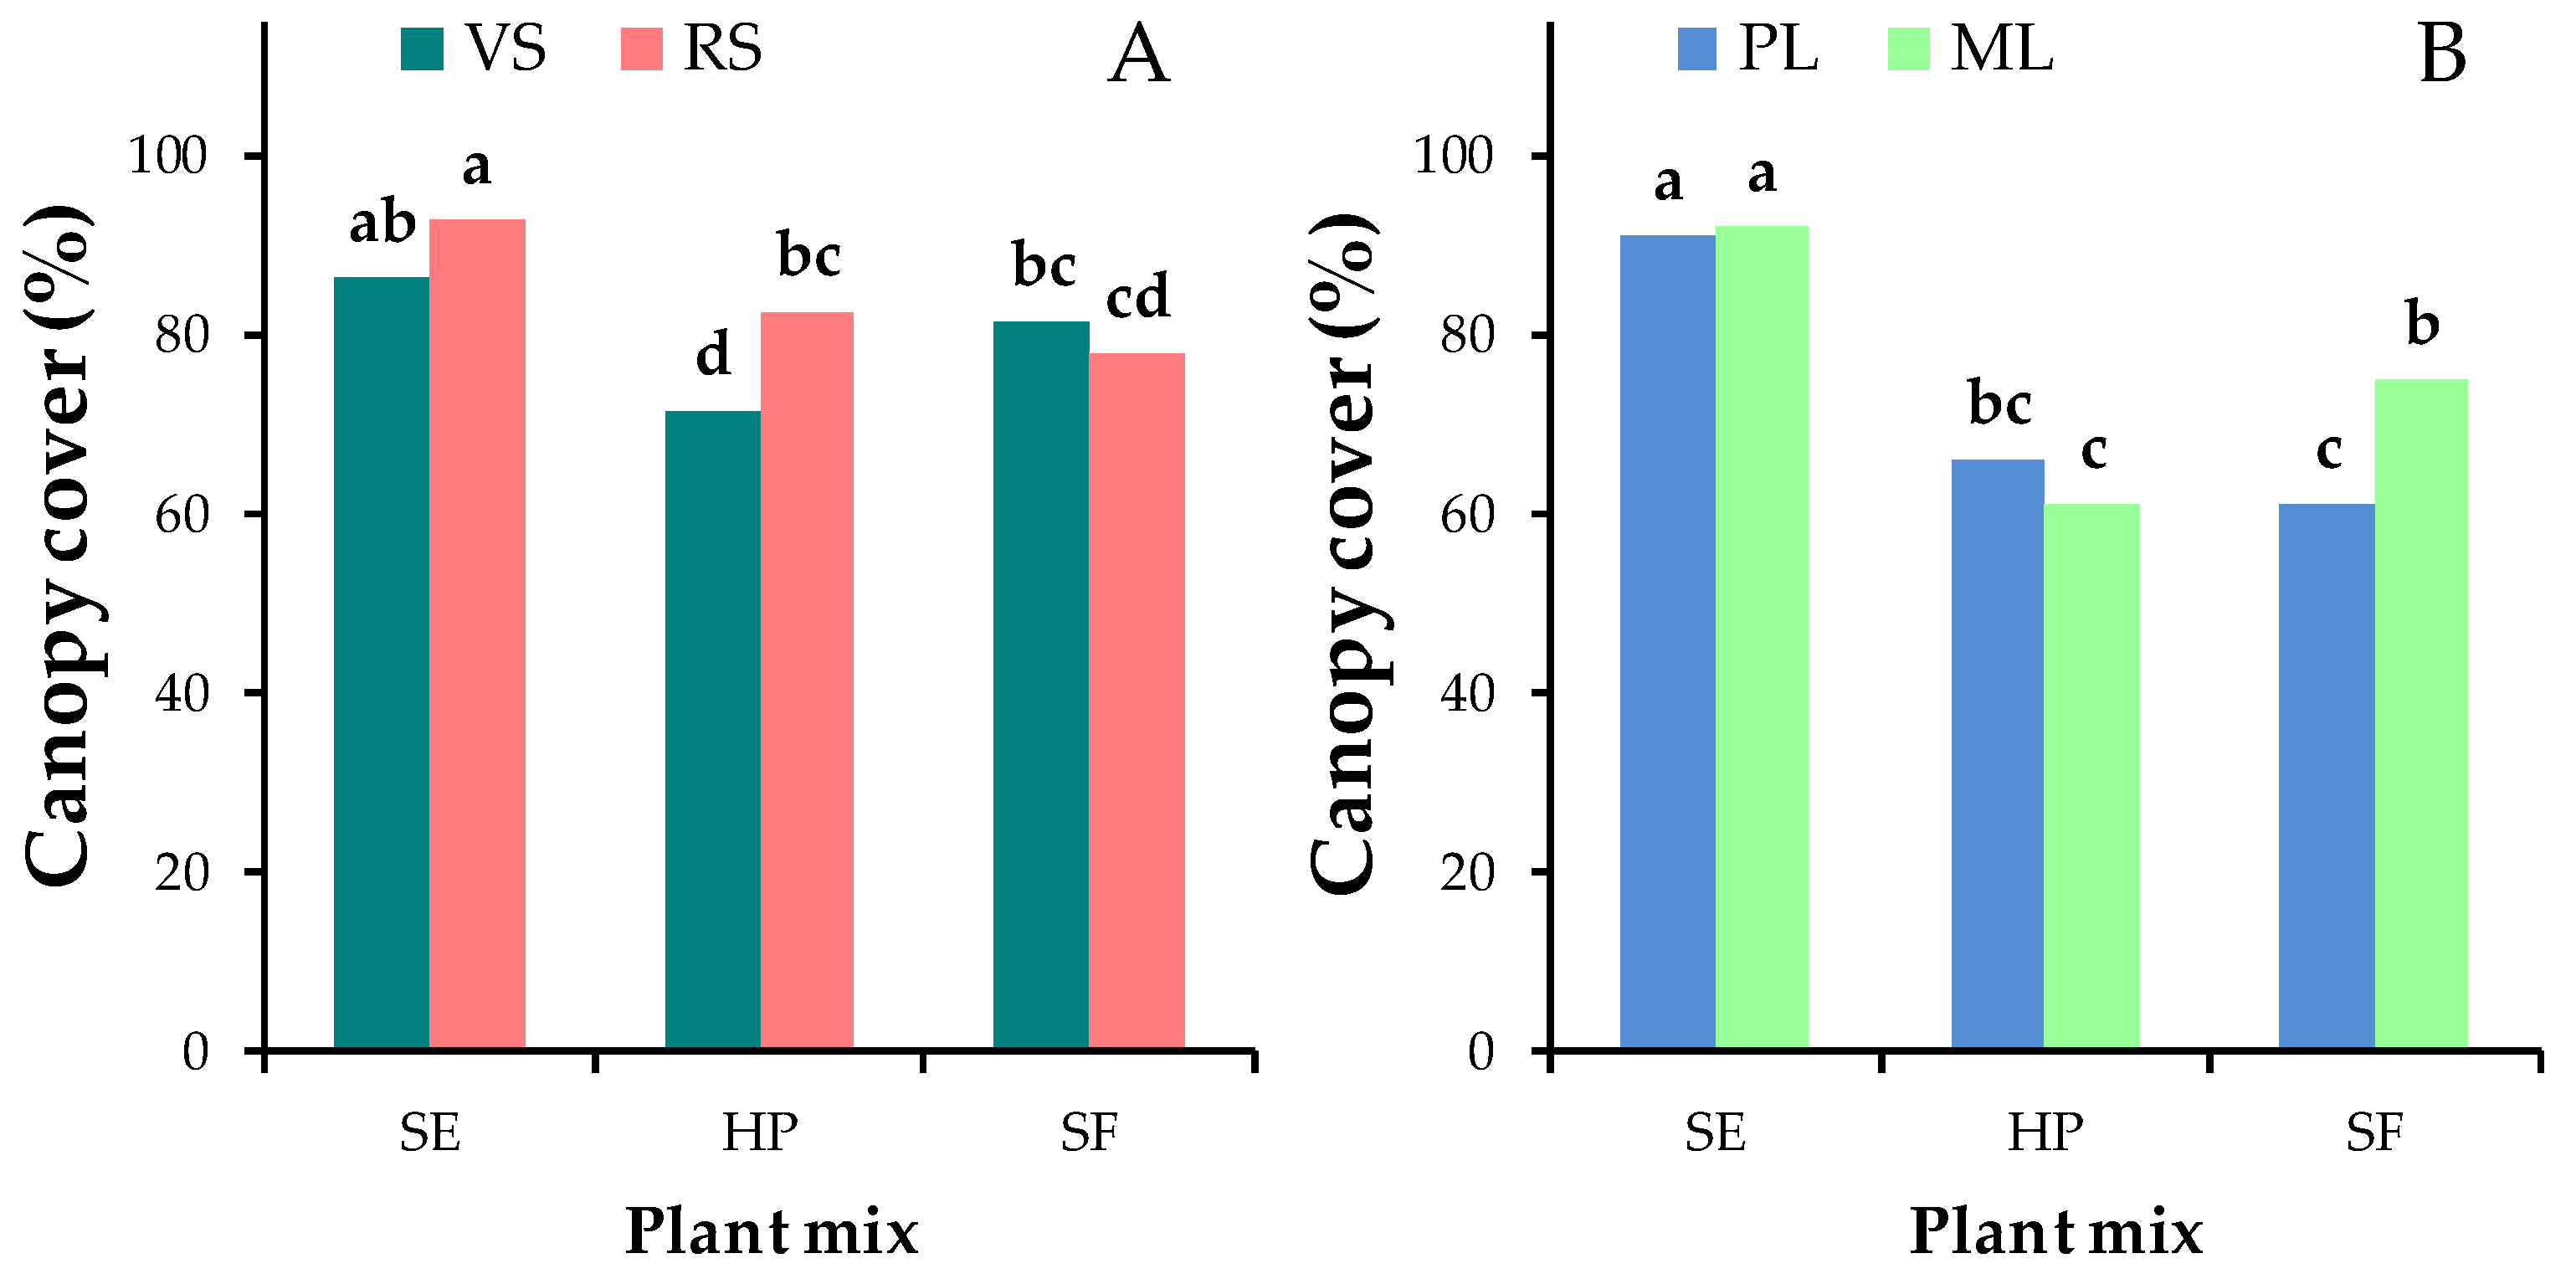
The ANOVA highlighted that the canopy cover was also affected by the substrate (Figure 8B). The highest values of canopy cover were shown in the recycled crushed brick substrate (RS) with differences that were ≥30% higher than those observed in the volcanic substrate (VS) at most of the sampling points (Figure 8B). The effect of the drainage/storage layer was found to be significant only in five months, with differences that were not higher than 12% in summer 2015 (Figure 8C).
Interaction effects were observed only at three consecutive sampling points from October to December 2015 and at four from May to August 2016. In the first case, the significance concerned the plant mix × substrate interaction; the values for November 2015 (when differences were significant for p ≤ 0.001) are reported in Figure 9 as representative of this interaction. The different substrates affected only the canopy cover of the herbaceous perennial mix, which was higher with RS than with VS. In the second case, the plant mix × drainage/storage layer interaction, only the canopy cover of the suffruticose plant mix was affected by the drainage/storage layer, with ML achieving better coverage than PL, as shown in Figure 9B, which reports the values of May 2016 (p < 0.001).
3.3. Actual Crop Coefficient
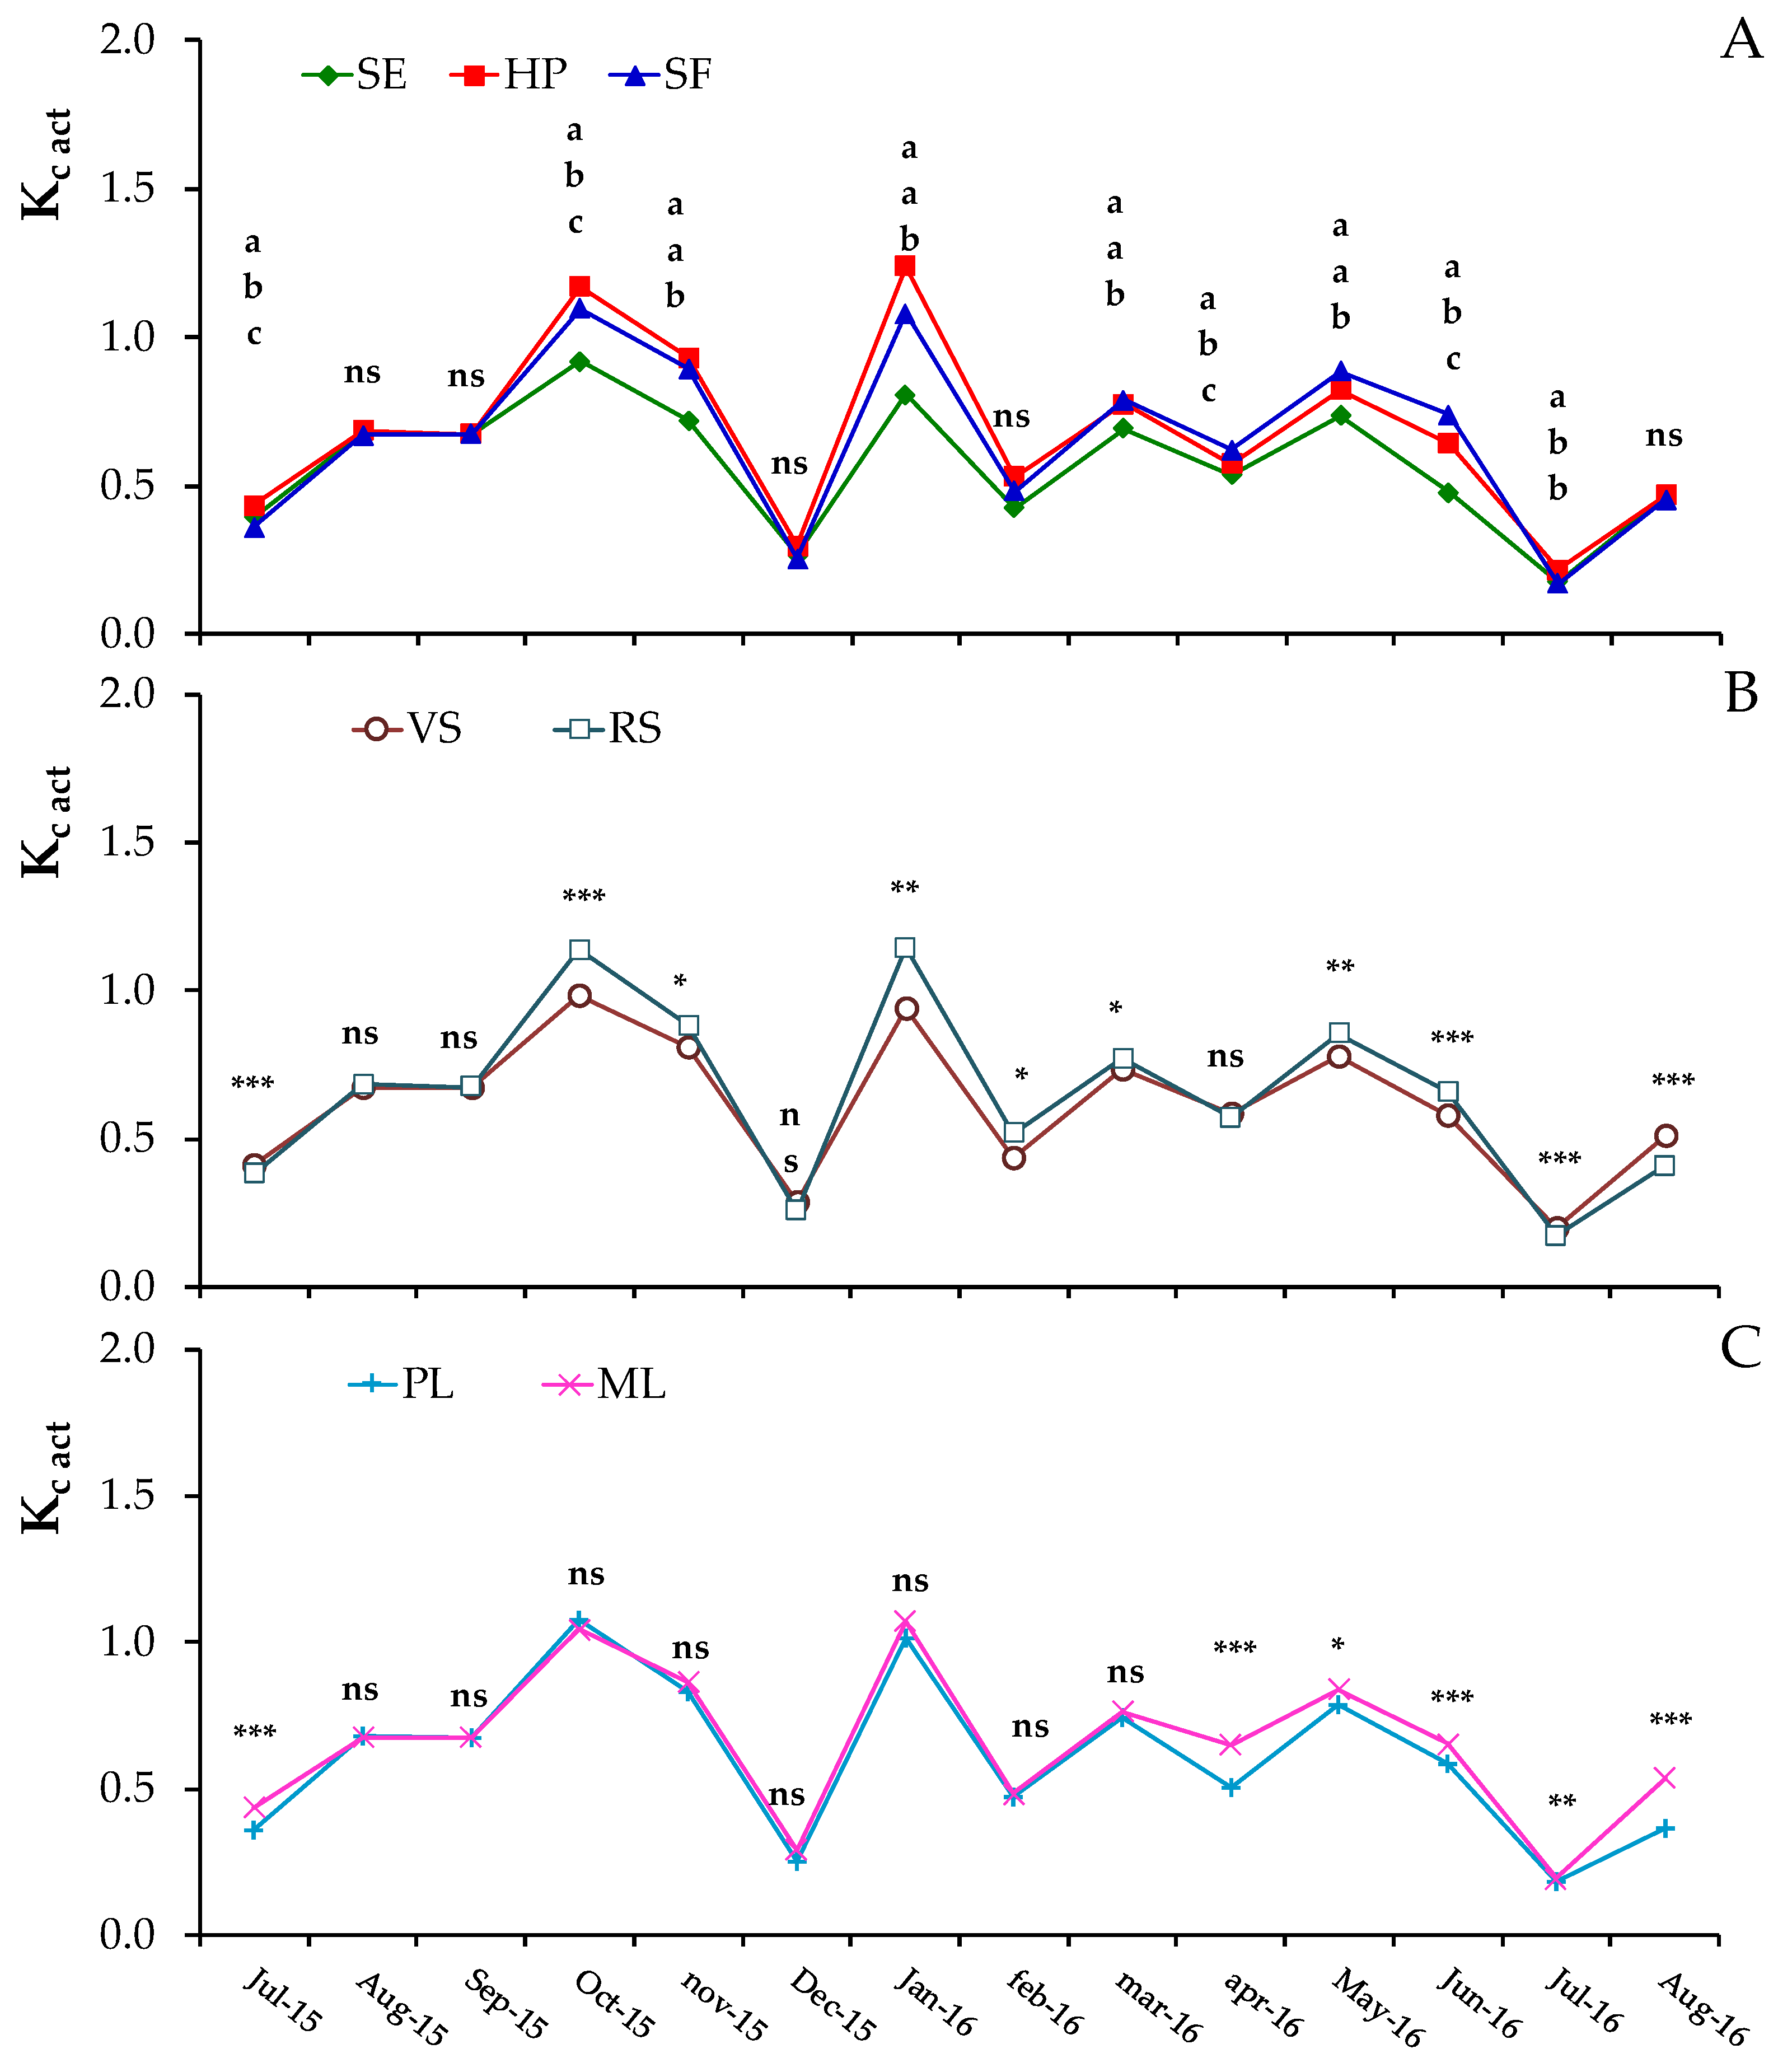
The actual crop coefficient (Kc act) varied over time, ranging, on average, from the minimum value in July 2016 (0.19 mm) to the maximum in October 2015 and January 2016 (1.06 and 1.04 mm, respectively) (Figure 10).
The ANOVA often revealed a significant effect of the three main factors. As for the plant mix (Figure 10A), with the exception of July 2015, when significant differences were found, the lowest Kc act values were observed in the Sedum mix. The values of herbaceous perennial and suffruticose mixes were higher than those of the Sedum mix, and were similar for the first two-thirds of the monitored period; following this, the Kc act values of the suffruticose mix were sometimes higher (Figure 10A).
The substrates also influenced the Kc act values and, in seven out of the nine months in which the differences were significant, RS increased its values compared to VS (Figure 10B). The drainage/storage layer affected the Kc act values much less than the other main factors did. Significant differences were found in the last period of the trial, where, in comparison to PL, ML was found to improve the Kc values (Figure 10C).
On some occasions, the interactions were also significant, although only those significant for p ≤ 0.01 are reported. In April and June 2016, the significant interactions were plant mix × drainage/storage layer and substrate × drainage/storage layer. In both months, the Kc act values were higher with ML than with PL, particularly in April and with the suffruticose species, if we consider the plant mix (Figure 11A,C), and with RS, if we consider the substrate instead (Figure 11B,D).
4. Discussion
In this experimental setting, the Sedum plants had lower coverage than the other plant mixes and in the first summer, the growth for all species was poor; however, starting from April 2015, plant growth increased noticeably, also assisted by supplemental irrigations, so the coverage reached 90% for Sedum and approximately 80% for the other plant mixes. Winter senescence reduced the canopy cover of all mixes, but from late winter to April 2016, the coverage increased again. Then, the HP and SF coverage strongly decreased as a consequence of drought, which resulted in the death of several plants. In contrast, the Sedum canopy cover remained high and stable (Figure 8A). The high capacity of Sedum species to survive and grow under harsh conditions (i.e., drought, high temperature and solar radiation, and wind) is well known, also in comparison to other herbaceous species [35,36,37]. Because of the crassulacean acid metabolism (CAM) of Sedum plants, their stomata can open at night to let carbon dioxide enter, so that daytime stomata closure reduces transpiration [35,38]. Sedum species also have great coverage as a result of their prostrate growth habit that, by shading, reduces soil evaporation [39], further increasing water use efficiency. In contrast, herbaceous forb and grass species are, in general, much more sensitive to drought because of their higher evapotranspiration requirements, and they need a deeper substrate in order to increase water retention and/or require irrigation [37,40].
As seen in Figure 8B,C, the plant coverage was also affected by the substrate and the drainage/storage layer, particularly the former. The higher water retention capacity of RS vs. VS and of ML vs. PL is likely the major contributor to this response, highlighting the importance of these layers in supporting plant growth. However, other aspects may also be involved, such as the different thermal capacities of the substrates, which can influence plant growth by affecting evaporation and, hence, water availability to plants [41].
As for the empirically determined Kc act, the values gradually decreased to very low values from October to December 2015. This is related to the low transpiration due to plant rest, but also to the drought period that occurred during November and December 2015. Over the next months, we observed a new increase linked to the natural vegetative restart, increasing actual evapotranspiration. During summer 2016, Kc act did not increase like it did the previous summer; this may be because the water deficit was not fulfilled by supplemental irrigation, causing some plants to die. It is known that irrigation can prevent plant death and can support evapotranspiration, which can increase from 3 to 5 L m−2 on a daily basis in summer [42]. As CAM metabolism allows a reduction in water consumption during a drought period [38], the Sedum species had a lower Kc act than the herbaceous perennial and suffruticose species did.
Sometimes, to estimate the performance of green roofs, the Kc of low-water-use plants (i.e., 0.3) is used [43,44]. This value is similar to those estimated by Starry et al. [45] for three Sedum species, ranging from 0.21 to 0.50 for S. album, from 0.22 to 0.55 for S. sexangulare, and from 0.25 to 0.71 for Phedimus kamtschaticus (formerly classified as S. kamtschaticum) according to the season, and to the Kc of 0.35–0.52 calculated by Lazzarin et al. [46]. In the present experiment, the average Kc act of 0.57 reveals that the Kc used to model the performance of the green roofs may have underestimated the evapotranspiration features of the Sedum species, particularly if we consider that we calculated Kc act and not Kc, which is related to a condition with no water stress [33]. In contrast, it has to be considered that some Sedum species are facultative CAM plants, and in moist conditions, they switch from CAM to C3 metabolism, in which plants’ stomata are open during the daytime, increasing the evapotranspiration of water in comparison to strict CAM succulents [47].
Furthermore, the herbaceous perennial and suffruticose species had higher Kc act values (0.68 and 0.65, respectively) than the Sedum species, but they did not reach the value used by Vanuytrecht et al. [48] (i.e., 1.0) for grasses and herbs or those found by Miller [49] for common forbs. It must be remembered that we did not calculate ET in well-watered conditions. Our values are more in line with the Kc used for high-water-use plants (i.e., 0.6) [43,44]. The lower water use, or lower evapotranspiration, of Sedum compared to other species is important to guarantee plant survival in low-maintenance green roofs. Indeed, our results proved once again that Sedum species can survive without supplemental irrigation during summer, while irrigation is mandatory for other species. However, the high-water-use efficiency of Sedum may turn out to be a drawback, as it limits the utilization of excess water [19,50] and reduces potential summer thermal benefits associated with evapotranspirative cooling [51]. Hence, in accordance with what has been reported by other authors, when selecting plants for green roofs, consideration should be given to which are the more important benefits to pursue [51,52].
The results also showed that the recycled substrate (RS) and the mineral drainage/storage layer (ML) generally improved the Kc act values as a consequence of their better water retention capacity [20], which promoted plant growth.
5. Conclusions
Along with the capacity to reduce stormwater runoff, evapotranspiration is a key factor for green roofs. Succulent species, particularly Sedum, are often used to vegetate green roofs, and our results confirmed that in a humid subtropical climate context, their drought tolerance guarantees their long-term survival, as well as rapid and full surface coverage, even with no supplemental irrigation. Our results demonstrate that the components of green roofs (i.e., the substrate and storage/drainage layer) are also important for overall plant performance, as long as they contribute as a water reservoir to support plant growth. Considering the actual crop coefficient of the tested species, even though the Sedum mix exhibited higher values than expected, those of the herbaceous perennial and suffruticose species were often superior, implying higher maintenance input to ensure plant survival but, potentially, higher benefits.
Author Contributions
Conceptualization, G.Z. and L.B.; data curation, G.Z. and L.B.; investigation, G.Z. and L.B.; methodology, G.Z. and L.B.; validation, G.Z. and L.B.; formal analysis, G.Z.; writing—original draft, G.Z. and L.B.; writing—review and editing, G.Z. and L.B.; supervision, L.B. All authors have read and agreed to the published version of the manuscript.
Funding
This work was financed by the Progetto di Ateneo 2012 N. CPDA122584 titled, “In situ sustainable management of stormwater runoff by mean of green roofs: evaluation of systems suitable for Venetian Plain” (University of Padova).
Conflicts of Interest
The authors declare no conflict of interest.
References
- Berardi, U.; Hoseini, A.G. State-of-the-art analysis of the environmental benefits of green roofs. Appl. Energy 2014, 115, 411–428. [Google Scholar] [CrossRef]
- VanWoert, N.D.; Rowe, D.B.; Andresen, J.A.; Rugh, C.L.; Fernandez, R.T.; Xiao, L. Green roof stormwater retention: Effects of roof surface, slope, and media depth. J. Environ Qual. 2005, 34, 1036–1044. [Google Scholar] [CrossRef] [PubMed]
- Berndtsson, C.J. Green roof performance towards management of runoff water quantity and quality: A review. Ecol. Eng. 2010, 36, 351–360. [Google Scholar] [CrossRef]
- Ercolani, G.; Chiaradia, E.A.; Gandolfi, C.; Castelli, F.; Masseroni, D. Evaluating performances of green roofs for stormwater runoff mitigation in a high flood risk urban catchment. J. Hydrol. 2018, 566, 830–845. [Google Scholar] [CrossRef]
- Gong, Y.; Yin, D.; Fang, X.; Li, J. Factors affecting runoff retention performance of extensive green roofs. Water 2018, 10, 1217. [Google Scholar] [CrossRef] [Green Version]
- Rosenfeld, A.H.; Akbari, H.; Romm, J.J.; Pomerantz, M. Cool communities: Strategies for heat island mitigation and smog reduction. Energy Build. 1998, 28, 51–62. [Google Scholar] [CrossRef]
- Onmura, S.; Matsumoto, M.; Hokoi, S. Study on evaporative cooling effect of roof lawn garden. Energy Build. 2001, 33, 653–666. [Google Scholar] [CrossRef]
- Ouldboukhitine, S.E.; Belari, R.; Jaffal, I.; Trabelsi, A. Assessment of green roof thermal behavior: A coupled heat and mass transfer model. Build. Environ. 2011, 46, 2624–2631. [Google Scholar] [CrossRef]
- Qiu, G.; Li, H.; Zhang, Q.; Chen, W.; Liang, X.; Li, X. Effects of Evapotranspiration on Mitigation of Urban Temperature by Vegetation and Urban Agriculture. J. Integr. Agric. 2013, 12, 1307–1315. [Google Scholar] [CrossRef]
- Speak, A.F.; Rothwell, J.J.; Lindley, S.J.; Smith, C.L. Reduction of the urban cooling effects of an intensive green roof due to vegetation damage. Urban Clim. 2013, 3, 40–55. [Google Scholar] [CrossRef]
- Brenneisen, S. Space for Urban Wildlife: Designing Green Roofs as Habitats in Switzerland. Urban Habitats 2006, 4, 1541–7115. [Google Scholar]
- Azis, S.S.A.; Sipan, I.; Sapri, M.; Abdul Jalil, R.; Mohammad, I.S. The effect of green envelope components on green building value. Property Manag. 2017, 35, 181–201. [Google Scholar] [CrossRef]
- Nowak, D.J.; Crane, D.E.; Stevens, J.C. Air pollution removal by urban trees and shrubs in the United States. Urban For. Urban Green. 2006, 4, 115–123. [Google Scholar] [CrossRef]
- Viecco, M.; Vera, S.; Jorquera, H.; Bustamante, W.; Gironás, J.; Dobbs, C.; Leiva, E. Potential of Particle Matter Dry Deposition on Green Roofs and Living Walls Vegetation for Mitigating Urban Atmospheric Pollution in Semiarid Climates. Sustainability 2018, 10, 2431. [Google Scholar] [CrossRef] [Green Version]
- Yang, J.; Yu, Q.; Gong, P. Quantifying air pollution removal by green roofs in Chicago. Atmos. Environ. 2008, 42, 7266–7273. [Google Scholar] [CrossRef]
- Bortolini, L.; Zanin, G. Hydrological behaviour of rain gardens and plant suitability: A study in the Veneto plain (north-eastern Italy) conditions. Urban For. Urban Green. 2018, 34, 121–133. [Google Scholar] [CrossRef]
- Zanin, G.; Bettella, F.; Bortolini, L. Hydrological and plant performance of green roofs in the climate context of the Veneto Plain (north-eastern Italy): Preliminary results. Acta Hortic. 2018, 1215, 95–100. [Google Scholar] [CrossRef]
- Nagase, A.; Dunnett, N. Amount of water runoff from different vegetation types on extensive green roofs: Effects of plant species, diversity and plant structure. Landsc. Urban Plan. 2012, 104, 356–363. [Google Scholar] [CrossRef]
- Vijayaraghavan, K. Green roofs: A critical review on the role of components, benefits, limitations and trends. Renew. Sustain. Energy Rev. 2016, 57, 740–752. [Google Scholar] [CrossRef]
- Pérez, G.; Coma, J. Chapter 2.3—Green Roofs Classifications, Plant Species, Substrates. In Nature Based Strategies for Urban and Building Sustainability; Pérez, G., Perini, K., Eds.; Butterworth-Heinemann: Oxford, UK, 2018; pp. 65–74. [Google Scholar]
- Cascone, S. Green roof design: State of the art on technology and materials. Sustainability 2019, 11, 3020. [Google Scholar] [CrossRef] [Green Version]
- Benvenuti, S.; Bacci, D. Initial agronomic performances of Mediterranean xerophytes in simulated dry green roofs. Urban Ecosyst. 2010, 13, 349–363. [Google Scholar] [CrossRef]
- Cook-Patton, S.C.; Bauerle, T.L. Potential benefits of plant diversity on vegetated roofs: A literature review. J. Environ. Manag. 2012, 106, 85–92. [Google Scholar] [CrossRef] [PubMed]
- Vasl, A.; Shalom, H.; Kadas, G.J.; Blaustein, L. Sedum—Annual plant interactions on green roofs: Facilitation, competition and exclusion. Ecol. Eng. 2017, 108, 318–329. [Google Scholar] [CrossRef]
- Li, X.X.; Cao, J.J.; Xu, P.X.; Fei, L.; Dong, Q.; Wang, Z.L. Green roofs: Effects of plant species used on runoff. Land Degrad. Dev. 2018, 29, 3628–3638. [Google Scholar] [CrossRef]
- Cao, J.J.; Hu, S.; Dong, Q.; Liu, L.J.; Wang, Z.L. Green roof cooling contributed by plant species with different photosynthetic strategies. Energy Build. 2019, 195, 45–50. [Google Scholar] [CrossRef]
- Klein, P.M.; Coffman, R. Establishment and performance of an experimental green roof under extreme climatic conditions. Sci. Total Environ. 2015, 512–513, 82–93. [Google Scholar] [CrossRef]
- Namba, Y.; Inoue, S.; Fujita, M.; Noguchi, Y.; Hara, C.; Ishii, H. Acclimation potential of three evergreen tree species to wind-induced water stress in an urban green-roof environment. Urban For. Urban Green. 2019, 43, 126386. [Google Scholar] [CrossRef]
- Zhang, Z.; Szota, C.; Fletcher, T.D.; Williams, N.S.; Werdin, J.; Farrell, C. Influence of plant composition and water use strategies on green roof stormwater retention. Sci. Total Environ. 2018, 625, 775–781. [Google Scholar] [CrossRef]
- Bettella, F.; D’Agostino, V.; Bortolini, L. Drainage flux simulation of green roofs under wet conditions. J. Agric. Eng. 2018, 49, 242–252. [Google Scholar] [CrossRef] [Green Version]
- Collins, T.J. ImageJ for microscopy. Biotechniques 2007, 43 (Suppl. S1), 25–30. [Google Scholar] [CrossRef]
- Korhonen, L.; Heikkinen, J. Automated Analysis of in Situ Canopy Images for the Estimation of Forest Canopy Cover. For. Sci. 2009, 55, 323–334. [Google Scholar]
- Allen, R.G. Using the FAO-56 dual crop coefficient method over an irrigated region as part of an evapotranspiration intercomparison study. J. Hydrol. 2000, 229, 27–41. [Google Scholar] [CrossRef]
- Berti, A.; Tardivo, G.; Chiaudani, A.; Rech, F.; Borin, M. Assessing reference evapotranspiration by the Hargreaves method in north-eastern Italy. Agric. Water Manag. 2014, 140, 20–25. [Google Scholar] [CrossRef]
- Monterusso, M.A.; Rowe, D.B.; Rugh, C.L. Establishment and persistence of Sedum spp. and native taxa for green roof applications. HortScience 2005, 40, 391–396. [Google Scholar] [CrossRef]
- Getter, K.L.; Rowe, D.B. The role of extensive green roofs in sustainable development. HortScience 2006, 41, 1276–1285. [Google Scholar] [CrossRef] [Green Version]
- MacIvor, J.S.; Margolis, L.; Puncher, C.L.; Matthews, B.J.C. Decoupling factors affecting plant diversity and cover on extensive green roofs. J. Environ. Manag. 2013, 130, 297–305. [Google Scholar] [CrossRef] [PubMed]
- Lee, K.S.; Kim, J.H. Changes in crassulacean acid metabolism (CAM) of Sedum plants with special reference to soil moisture conditions. J. Plant Biol. 1994, 37, 9–15. [Google Scholar]
- Wolf, D.; Lundholm, J.T. Water uptake in green roof microcosms: Effects of plant species and water availability. Ecol. Eng. 2008, 33, 179–186. [Google Scholar] [CrossRef]
- Nagase, A.; Dunnett, N. Drought tolerance in different vegetation types for extensive green roofs: Effects of watering and diversity. Landsc. Urban Plan. 2010, 97, 318–327. [Google Scholar] [CrossRef]
- Bates, A.J.; Sadler, J.P.; Mackay, R. Vegetation development over four years on two green roofs in the UK. Urban For. Urban Green. 2013, 12, 98–108. [Google Scholar] [CrossRef]
- Kaiser, D.; Köhler, M.; Schmidt, M.; Wolff, F. Increasing Evapotranspiration on Extensive Green Roofs by Changing Substrate Depths, Construction, and Additional Irrigation. Buildings 2019, 9, 173. [Google Scholar] [CrossRef] [Green Version]
- Roehr, D.; Kong, Y. Runoff reduction effects of green roofs in Vancouver, BC, Kelowna, BC, and Shanghai, China. Can. Water Res. J. 2010, 35, 53–68. [Google Scholar] [CrossRef] [Green Version]
- Talebi, A.; Bagg, S.; Sleep, B.; O’Carroll, D. Stormwater reduction by green roof technology: A comparison of Canadian climates. In Proceedings of the CSCE General Conference 2018, Canadian Society for Civil Engineering Annual Conference, Fredericton, NB, Canada, 13–16 June 2018; pp. 599–608. [Google Scholar]
- Starry, O.; Lea-Cox, J.; Ristvey, A.; Cohan, S. Parameterizing a water-balance model for predicting stormwater runoff from green roofs. J. Hydrol. Eng. 2016, 21, 04016046. [Google Scholar] [CrossRef] [Green Version]
- Lazzarin, R.M.; Castellotti, F.; Busato, F. Experimental measurements and numerical modelling of a green roof. Energy Build. 2005, 37, 1260–1267. [Google Scholar] [CrossRef]
- Johannessen, B.G.; Hanslin, H.M.; Muthanna, T.M. Green roof performance potential in cold and wet regions. Ecol. Eng. 2017, 106, 436–447. [Google Scholar] [CrossRef]
- Vanuytrecht, E.; Van Mechelen, C.; Van Meerbeek, K.; Willems, P.; Hermy, M.; Raes, D. Runoff and vegetation stress of green roofs under different climate change scenarios. Landsc. Urban Plan. 2014, 122, 68–77. [Google Scholar] [CrossRef]
- Miller, S.M. Evapotranspiration Potential of Green Infrastructure Vegetation. Ph.D. Thesis, Drexel University, Philadelphia, PA, USA, 2014. [Google Scholar]
- Farrell, C.; Szota, C.; Williams, N.S.; Arndt, S.K. High water users can be drought tolerant: Using physiological traits for green roof plant selection. Plant Soil 2013, 372, 177–193. [Google Scholar] [CrossRef]
- Blanusa, T.M.; Monteiro, M.M.V.; Fantozzi, F.; Vysini, E.; Li, Y.; Cameron, R.W.F. Alternatives to Sedum on green roofs: Can broad leaf perennial plants offer better ‘cooling service’? Build. Environ. 2013, 59, 99–106. [Google Scholar] [CrossRef] [Green Version]
- Sookhan, N.; Margolis, L.; MacIvor, J.S. Inter-annual thermoregulation of extensive green roofs in warm and cool seasons: Plant selection matters. Ecol. Eng. 2018, 123, 10–18. [Google Scholar] [CrossRef]
Figure 1.
Location of the Agripolis Campus in the portion of the Venetian Plain of the Veneto region (northeastern Italy). The Venetian Plain is the referential region for the climatic conditions considered in this study.
Figure 1.
Location of the Agripolis Campus in the portion of the Venetian Plain of the Veneto region (northeastern Italy). The Venetian Plain is the referential region for the climatic conditions considered in this study.

Figure 2.
The microcosms of green roofs at the experimental site of Agripolis Campus.

Figure 3.
Randomized complete block layout of the experimental site with the indication of the conditions of the substrate, drainage/storage, and vegetation layers of each green roof microcosm.
Figure 3.
Randomized complete block layout of the experimental site with the indication of the conditions of the substrate, drainage/storage, and vegetation layers of each green roof microcosm.

Figure 4.
Probes and data logger for the data recording of the humidity of the substrates.

Figure 5.
The mobile stand with a camera to take photos of the plant cover.

Figure 6.
Example of an original photo and its sequence of elaboration.

Figure 7.
Monthly reference evapotranspiration (ET0), precipitation (P) and average (T), maximum (Tmax), and minimum (Tmin) temperature during the experimental period.
Figure 7.
Monthly reference evapotranspiration (ET0), precipitation (P) and average (T), maximum (Tmax), and minimum (Tmin) temperature during the experimental period.

Figure 8.
Variation of canopy cover during the experiment as affected by plant mix (A), substrate (B), and drainage/storage layer (C). SE = Sedum mix, HP = herbaceous perennials, SF = suffruticose, VS = volcanic substrate, RS = recycled crushed brick substrate, PL = preformed plastic drainage/storage layer, ML = mineral drainage/storage layer. On each date, values with different letters are significantly different according to Tukey’s HSD test p ≤ 0.05). *, **, and *** = significant for p-values of <0.05, <0.01, and <0.001 according to the analysis of variance (ANOVA). ns = not significant.

Figure 9.
Interaction effects of plant mix × substrate (A) (November 2015) and plant mix × drainage/storage layer (B) (May 2016). Histogram values with different letters indicate significant differences according to Tukey’s HSD test (p < 0.05). SE = Sedum mix, HP = herbaceous perennials, SF = suffruticose, VS = volcanic substrate, RS = recycled crushed brick substrate, PL = preformed plastic drainage/storage layer, ML = mineral drainage/storage layer.

Figure 10.
Variation of the actual crop coefficient (Kc act) during the experiment as affected by plant mix (A), substrate (B), and drainage/storage layer (C). SE = Sedum mix, HP = herbaceous perennials, SF = suffruticose, VS = volcanic substrate, RS = recycled crushed brick substrate, PL = preformed plastic drainage/storage layer, ML = mineral drainage/storage layer. On each date, values with different letters are significantly different according to Tukey’s HSD test (p < 0.05). *, **, and *** = significant for p-values of <0.05, <0.01, and <0.001 according to the analysis of variance (ANOVA). ns = not significant.

Figure 11.
Interaction effect of plant mix × drainage/storage layer and substrate × drainage/storage layer in April 2016 (A,B, respectively) and June 2016 (C,D, respectively) on the actual crop coefficient (Kc act). Histogram values with different letters indicate significant differences according to Tukey’s HSD test (p < 0.05).

Publisher’s Note: MDPI stays neutral with regard to jurisdictional claims in published maps and institutional affiliations. |
© 2020 by the authors. Licensee MDPI, Basel, Switzerland. This article is an open access article distributed under the terms and conditions of the Creative Commons Attribution (CC BY) license (http://creativecommons.org/licenses/by/4.0/).
Share and Cite
MDPI and ACS Style
Zanin, G.; Bortolini, L. Performance of Three Different Native Plant Mixtures for Extensive Green Roofs in a Humid Subtropical Climate Context. Water 2020, 12, 3484. https://doi.org/10.3390/w12123484
AMA Style
Zanin G, Bortolini L. Performance of Three Different Native Plant Mixtures for Extensive Green Roofs in a Humid Subtropical Climate Context. Water. 2020; 12(12):3484. https://doi.org/10.3390/w12123484
Chicago/Turabian StyleZanin, Giampaolo, and Lucia Bortolini. 2020. "Performance of Three Different Native Plant Mixtures for Extensive Green Roofs in a Humid Subtropical Climate Context" Water 12, no. 12: 3484. https://doi.org/10.3390/w12123484
Note that from the first issue of 2016, this journal uses article numbers instead of page numbers. See further details here.