Sustainability Assessment of Water Resources in Beijing


Faculty of Geographical Science, Beijing Normal University, Beijing 100875, China
*
Author to whom correspondence should be addressed.
Water 2020, 12(7), 1999; https://doi.org/10.3390/w12071999
Submission received: 1 June 2020
/
Revised: 10 July 2020
/
Accepted: 12 July 2020
/
Published: 14 July 2020
(This article belongs to the Section Water Resources Management, Policy and Governance)
Abstract
:A sustainability assessment of water resources is essential for maintaining regional sustainable development. In this study, a comprehensive assessment of changes in the sustainability of the water resource system in Beijing from 2008 to 2018 was conducted on the basis of the driver-pressure-state-impact-response (DPSIR) model. To reflect the impacts of humans on the water consumption and pollution of water resources, the water footprint was considered. In addition, key factors that affect the sustainability of water resources were filtered by the modified entropy method. The results indicated that all drivers, pressures, states, impacts, and responses demonstrated increasing tendencies. As a result, a remarkable improvement in the sustainability of the water system, which was mitigated from an alert state to a good state, was achieved due to the comprehensive effect of the indexes. From these results, we inferred that the sustainability of regional water resources could only be achieved through a comprehensive consideration of regional social, economic, and environmental water systems and climate change. Therefore, formulating medium- and long-term urban, economic, and water development plans and adjusting medium- and short-term water utilization programs could contribute to the sustainable utilization of regional water resources.
1. Introduction
Water resources are key ecosystem components that sustain life and all social and economic processes. Water resource scarcity is an important global issue in the 21st century [1,2,3,4]. Along with the global trends of fast population growth, rapid urbanization, and climate change, it is becoming increasingly difficult to provide a sufficient supply of water with high quality to meet urban demand [5,6,7]. China is one of the most water-stressed countries in the world [8]. The imbalance between the supply and demand of water resources has threatened the sustainable development of many cities in Northern China, especially Beijing [9,10]. A synthesis of the grim situation clearly indicates that there is an urgent need to measure and maintain the sustainability of water resource systems in Beijing.
The quantification of water resource sustainability plays a critical role in defining and implementing sustainable water management. The main objectives are to ensure that water resource systems are designed and managed to fully contribute to providing water of sufficient quantity and quality for agricultural, industrial, and municipal uses to meet the growing demands posed by social economic development, both now and in the future, while maintaining the ecological, environmental, and hydrological integrity [11]. The definition of water sustainability urges water resource managers to consider every impact of water-related programs and requires them to make difficult decisions regarding the selection, maintenance, and treatment of water sources in light of the increasing scarcity and prevalence of contamination in both surface water and groundwater [12]. Therefore, a comprehensive assessment that combines environmental, economic, and social criteria has become a high priority for sustainable water resource management to cope with complex and uncertain water-related issues [13,14].
In general, methods used for a water resource sustainability evaluation include modeling [15], geospatial analysis [16], specific indexes [17,18,19], and the indicator-based method [20]. Most of them were developed based on existing definitions of sustainable development and sustainability principles proposed by various individuals and institutions [14]. However, understanding pressures from social, economic, and human activities and impacts on social processes through the adoption of appropriate environmental assessment tools is more important for regional water resource sustainability assessments [21]. Under such circumstances, the indicator-based sustainability assessment method is usually used to measure the sustainability of water resources. According to this method, the framework composed by indicators and indexes for a sustainability assessment ought to be considered first. The driver-pressure-state-impact-response (DPSIR) framework holds promise to help structure complex environmental problems and unify the conceptual exploration across social and natural sciences [22].
The DPSIR approach presents mechanisms for integrating the natural and social aspects of environmental problems with regards to sustainable development by incorporating cause–effect relationships. Due to its ability to integrate knowledge across different disciplines and help formalize different decision alternatives, the framework has been widely applied to analyze the interacting processes of human-environmental systems and help policy-makers identify viable options for managing, protecting, and assessing the progress toward sustainable development [23,24,25,26,27]. For instance, the potential for the DPSIR framework to be used as a tool to simultaneously organize sophisticated scientific research for building an understanding about coastal socioecological systems and to help stakeholders and policy-makers to articulate and manage coastal sustainability challenges was confirmed [28]. The DPSIR framework contributes to the understanding of relationships between state and driver factors while helping hydrologists, water managers, policy-makers, and the public understand and manage different water systems more effectively and sustainably [29,30]. Thus, the DPSIR framework has considerable potential in terms of exploring the relationships between water resource systems and the socioeconomic system, since it provides an organized method for analyzing the causes, consequences, and responses to changes in water systems [31,32,33]. For example, the causal chain of the DPSIR framework was explored to analyze the effectiveness of the four plausible alternative future scenarios [30]. Moreover, the DPSIR framework was applied to investigate the main causes and origins of pressures and to optimize the measures for the sustainable management of water resources in the Gallikos River Basin, North Greece [34]. According to Sun et al. [35], the indicators to evaluate the sustainability of water utilization based on the DPSIR model were established for a serious water scarcity city in Northwest China.
Moreover, when conducting a sustainability assessment of regional water resources, the water use relative to human consumption and the effect of water pollution on water resources should be considered, and the concept of the water footprint (WF) makes the quantification possible. The WF, introduced by Hoekstra et al. [36], is defined as the total volume of fresh water needed for the production of goods and services consumed by a country, region, business, or individual, including direct and indirect water use [37]. The WF is not only an indicator reflecting human impacts on water resources, including both water consumption and pollution, but can also broaden water resource evaluation systems and provide water utilization information for decision-making [38]. The WF is mainly interpreted by the concepts of blue, green, and gray water. Blue water is the water in freshwater lakes, rivers, and aquifers; green water is the part of the precipitation that does not runoff or recharge the groundwater but is stored in the soil for use by vegetation; and the gray water footprint (WFG) is the amount of fresh water required to dilute pollutants to water quality standards [39]. The WF approach provides a framework to assess the water resource utilization; however, the gray WF is rarely assessed and applied in water sustainability assessments at the regional level.
Due to the uneven spatial and temporal distributions of water resources, as well as the rapid economic development and urbanization that has occurred over the past 30 years, Beijing, the capital of China, has experienced a severe water scarcity. The current climate and socioeconomic conditions in Beijing cause serious disequilibrium between the supply and demand of water resources [40,41]. Indeed, the average amount of available per capita water resources in Beijing was less than 200 m3 in recent years (2008–2018), which is far below the international severe water shortage standard of 1000 m3 per capita [42]. As an opportunity, the Olympic and Paralympic Games, hosted in Beijing in 2008, impelled the commitments to improve and protect the city’s water resources [43]. However, whether the idea of green development persisted effectively in the water resource system and the achievement during the period retained are still indefinite. Hence, it is essential to assess the water resource sustainability of Beijing after 2008. Taking what has been discussed above, the objective of this study is to make a comprehensive assessment of the sustainability of regional water resources. An indicator system based on the DPSIR model and water footprint was simultaneously applied to synthesize the sophisticated social and economic factors that may impact the sustainability of water resources and to understand the major cause-and-effect relationships. The derived results can serve as references for stakeholders and policy-makers to articulate and manage challenges related to water resource sustainability.
2. Materials and Methods
2.1. Study Area
Beijing (115°25′–117°30′ E, 39°28′–41°5′ N) (Figure 1) is a megacity located in Northern China, covering a total area of 16,800 km2 with constructive land, water area, woodland, grassland, agricultural area, and bare rock area that accounted for 20.79%, 2.49%, 35.94%, 8.03%, 22.65%, and 0.01%, respectively, in 2018 [44]. Beijing belongs to the typical semi-arid and semi-humid climate zone, with a warm and temperate continental monsoon climate. The average annual precipitation in Beijing was only 580.52 mm (2008–2018), which decreased gradually at a rate of 3.3% compared to the average precipitation from 1956 to 2000. Moreover, the amount of precipitation ranges from more than 600 mm in the northeast and southwest to approximately 500 mm in the south, and this variation is correlated with the decrease in elevation from the mountains to the plain. In addition, the precipitation from June to September accounts for 81% of the total annual amount [45]. The sparse and uneven intra-annual distribution of precipitation aggravates the deficiency of water resources in Beijing [9]. On the other hand, high urbanization levels, rapid economic development, and a growing population pose severe pressures on the demand for water resources. During the period of 1990 to 2018, the gross domestic product (GDP) of Beijing increased from 50.08 billion Yuan to 3032 billion Yuan, while the total population grew from 10.86 million to more than 21.54 million (including registered permanent residents and the floating population).
Beijing has faced an extremely imbalanced situation regarding its water supply and demand for a long time. The total available water resource was 3.55 billion m3 in 2018, while the total water consumption was 3.93 billion m3, with agricultural, industrial, domestic, and environmental water consumptions accounting for 11%, 8%, 47%, and 34%, respectively. Domestic water consumption accounted for the largest proportion; moreover, the average annual (2008–2018) available per capita water resources (referring to surface and groundwater resources in this study) of Beijing was currently approximately 142.43 m3.
Beijing has obtained its needed supply of water resources at the cost of overexploiting groundwater over the years [46]. However, the long-term and large-scale mining of groundwater has caused the groundwater level to continue declining, triggering a series of environmental issues, such as underground funnels, ground subsidence, and ecological degradation [47,48,49]. The amount of groundwater resources was 2.11 billion m3 in 2018, which was approximately 17.39% less than the mean annual amount. The groundwater depth of Beijing was 38.28 m in 1980, but it then declined to 23.03 m by 2018, causing a groundwater depression funnel with an area of 621 km2.
Water scarcity has afflicted the city for decades, and solving this problem is a major challenge. Many measures have been adopted to cope with this issue, such as water-saving agricultural practices, sewage treatment, wastewater reuse, the utilization of recycled water, and transferring water from adjacent regions. Among them, the South-to-North Water Transfer Project, the world’s largest water transfer project, has alleviated the water resource shortage to a large extent since its operation began [50,51]. Nevertheless, a comprehensive evaluation of the sustainability of water resources spanning a long-term period by utilizing multiple environmental and economic indicators has been missing.
2.2. Data
The data used in this study mainly include meteorological, socioeconomic, and water use data. The meteorological data were obtained from the China Meteorological Data Sharing Services System (http://data.cma.cn). The socioeconomic data were taken from the Beijing Statistical Yearbook [52] and China Statistical Yearbook [53]. The hydrologic data were obtained from the Beijing Water Statistical Yearbook [54] and Beijing Water Resources Bulletin [55]. Based on the data availability, a study period ranging from 2008 to 2018 was selected.
2.3. Methods
2.3.1. The DPSIR Model
A sound theoretical framework is the primary ingredient for a water resources sustainability assessment. The analytical framework used in this study was the driver-pressure-state-impact-response (DPSIR) model, which was originally developed in the 1970s as a stress-response model [56]. Then, the European Environment Agency enriched the model by adding the driving forces and the impact components for the adaptive management of socioecological systems [57].
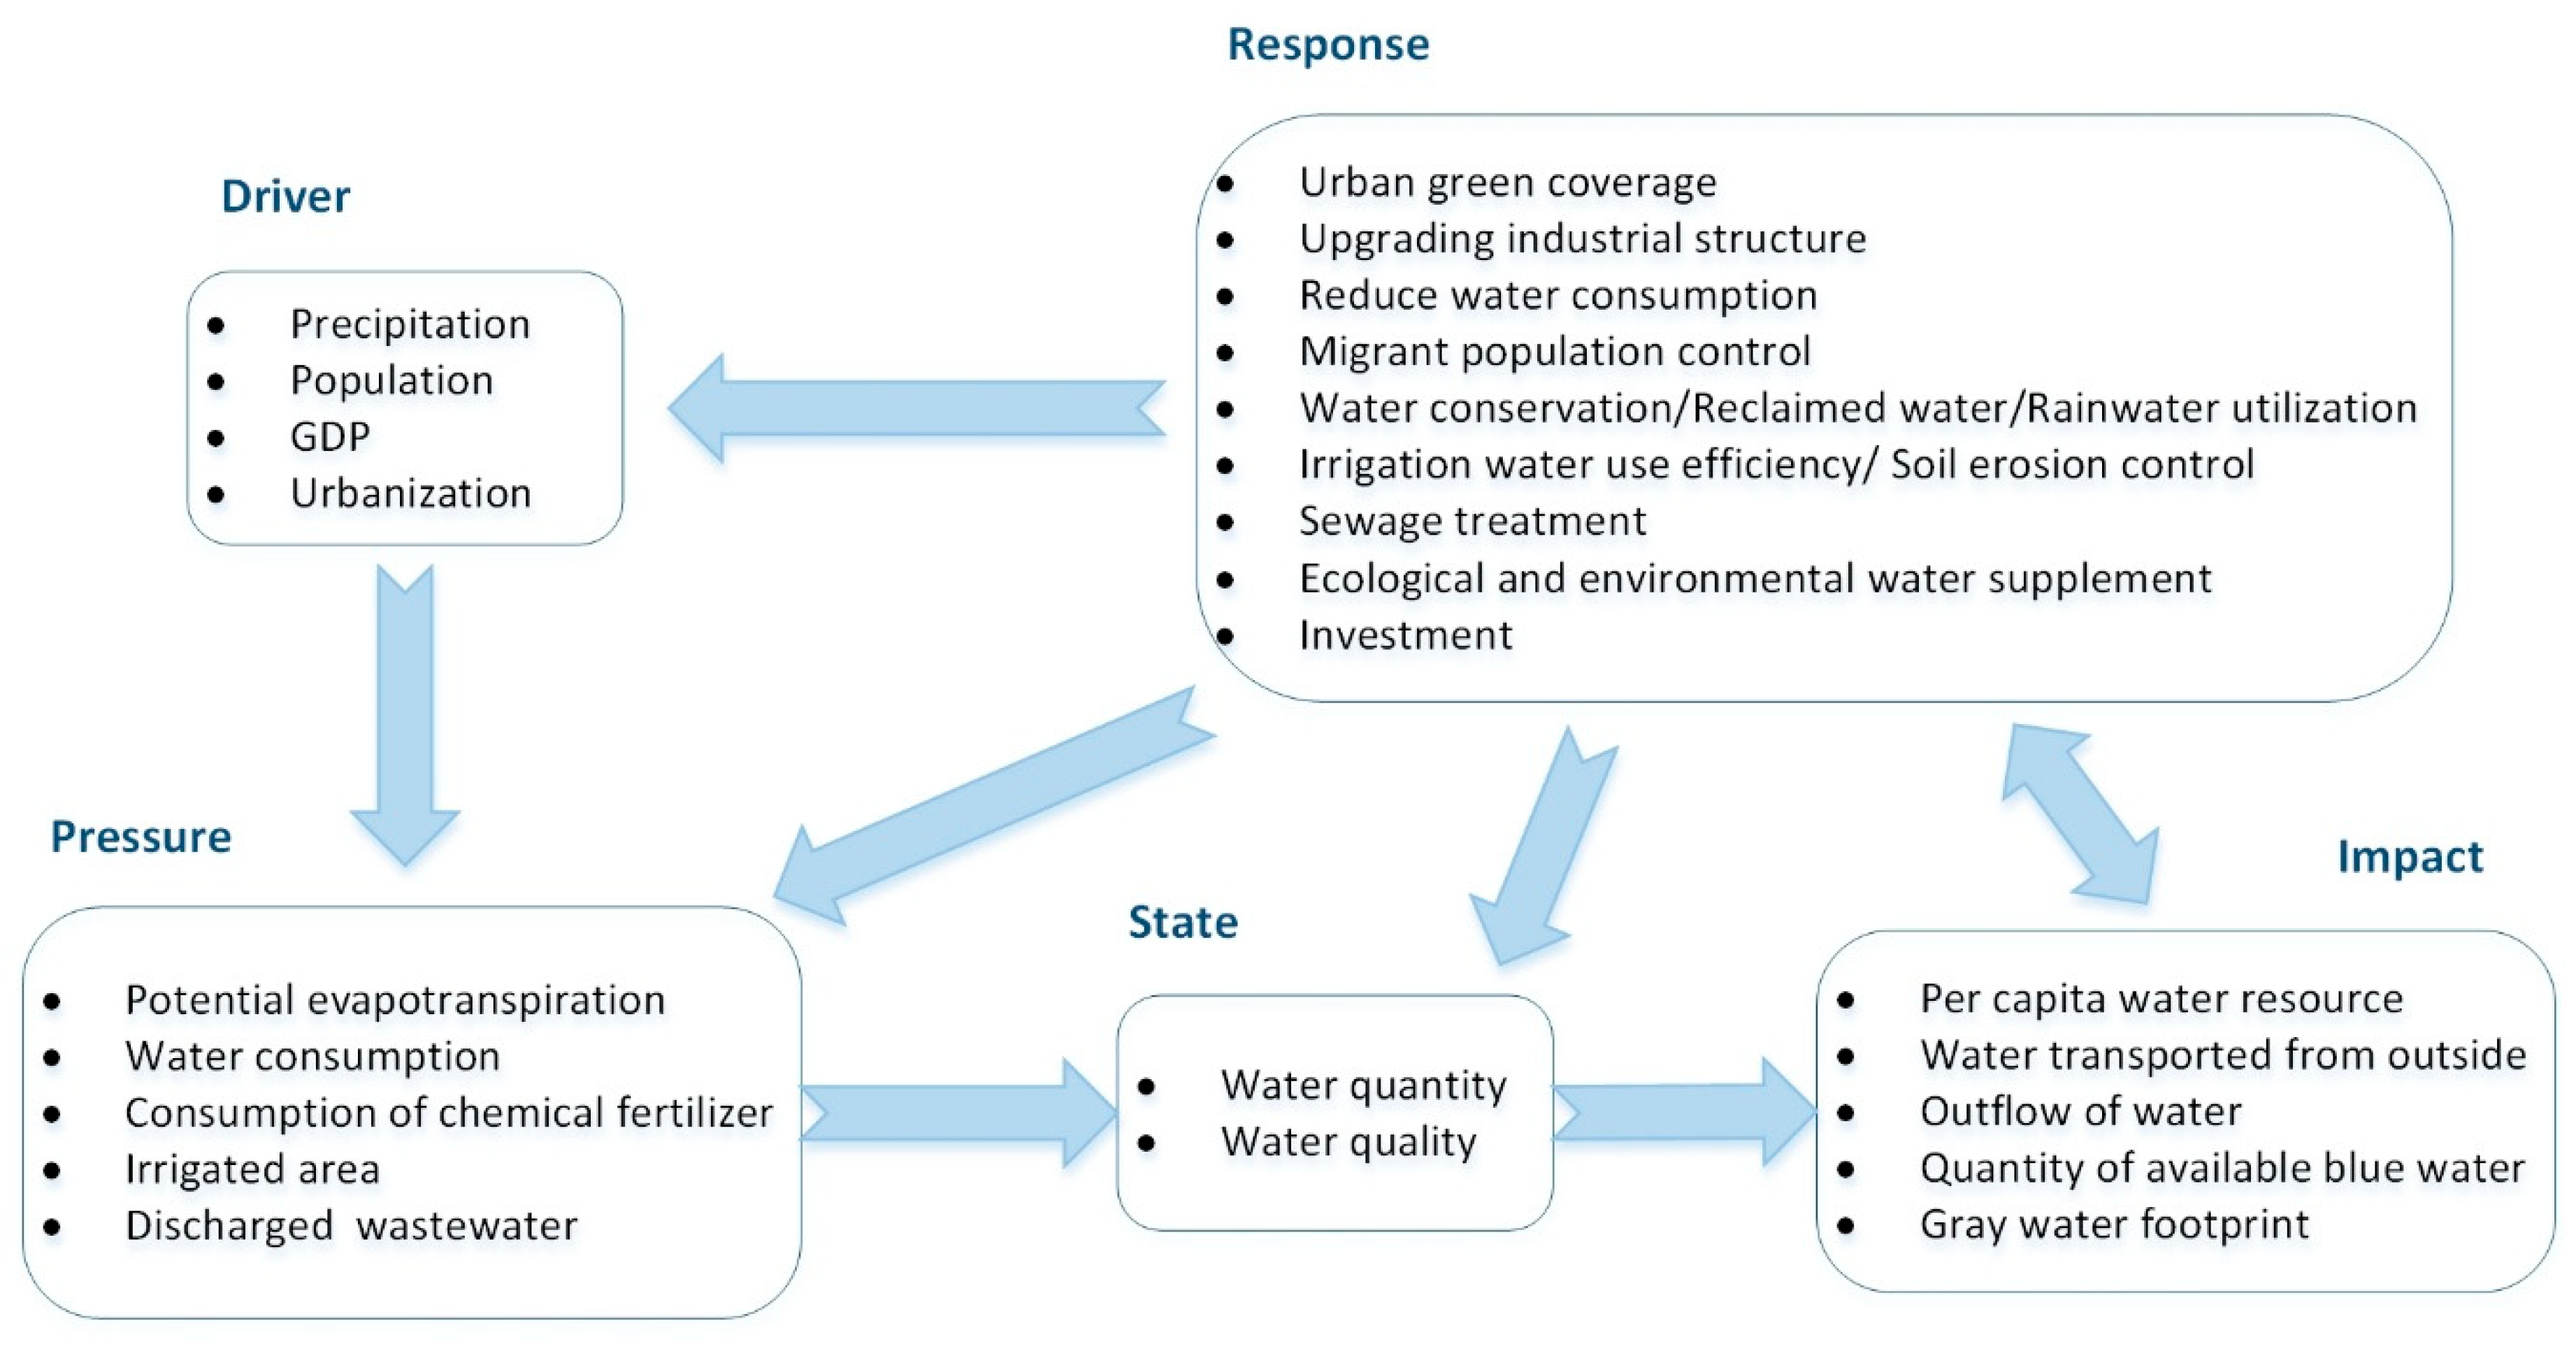
The present interpretation of this model links cause-effect relationships among the driver, pressure, state, impact, and response indexes [58]. More specifically, the DPSIR model presents a causal chain of the driving forces (D) that concern the underlying needs of society, economy, population development, and so forth. To fulfill these needs, relevant human activities in socioeconomic processes may increase/mitigate pressures (P) (e.g., pollutants and emissions) on the environment. Pressures affect the physical, chemical, and/or biological states (S) of the environment. The environmental changes then have impacts (I) on the ecosystems, human health, and other socioeconomic aspects, correspondingly. The responses (R) refer to the actions that derive from the unwanted impacts to alleviate the pressures and enhance the quality of the changing complex environment and can be targeted at any stage of the model [57].
The DPSIR model contributes to comprehensively understanding and analyzing environmental problems by integrating the natural and socioeconomic factors [59]. In this study, the model was adopted as the main method to analyze relationships and interactions among humans, society, and the environment in Beijing in order to understand the sustainability status of the water resources. According to the method, an indicator-based system, which can be interpreted as a hierarchical structure with 3 layers (the indicator layer, the index layer, and the comprehensive layer), was built from the 5 categories. The components of the DPSIR framework were evaluated through the comprehensive literature review on the socioecological system in Beijing by focusing on the sustainability of water resources and the associated effects on the environment and society.
2.3.2. The Modified Entropy Method
Once the conceptual framework is built, weights for each indicator need to be determined to analyze the sustainability of the water resources. This means that the derived comprehensive evaluation results were achieved by the transmission and calculation of the weights from the indicator layer to the index layer. Therefore, the calculation of the weights is one of the important parts of a water resource sustainability assessment, as this calculation greatly affects the evaluation results. In this study, a modified entropy method was used to determine the weight of each indicator for the DPSIR model. After that, the calculation procedure of each index was proceeded according to the weights of the containing indicators. As a result, key social and ecological factors that have influenced the water resource sustainability can be extracted.
The entropy method was originally applied in thermodynamics as a physical conception and was subsequently introduced into information theory [60]. Entropy is a measurement scale of the uncertainty of a system. As the amount of information increases, the uncertainty, or the entropy value, decreases and vice versa. Considering the nature of information entropy, the random property and disorder degree of a system can be easily estimated by calculating the entropy value. Entropy can also be used to determine the discrete degree of each factor. The factor with a large discrete degree provides abundant useful information and should, thus, be given much weight. Therefore, the entropy method is an objective weighting assignment method [61] in which the weight of each factor is determined by the amount of information. Compared with the subjective weighting method, it provides a relatively high degree of credibility and precision and has been widely used [62,63]. The specific steps to apply the method are as follows:
(1) There is an evaluation matrix with m × n elements, where m is the year when the indicator is evaluated, and n is the number of indicators.
(2) Indicators with negative effects should be converted into the same positive trend when a comprehensive evaluation is performed, as different attributes can be found in the evaluation matrix. In this study, the following equation was applied to transform the negative indicators into positive indicators.
where is the converted value of the indicators with negative effects. After that, to eliminate the differences in indicators and retain the degree of difference between the variables, data were nondimensionalized by using the averaging method according to the following equation.
where is the normalized value of each indicator, and is the mean of . After the standardization procedure, the normalized matrix Y was obtained.
(3) Entropy was defined as the importance of the indicators in the sustainability of water resources; the greater the value of entropy is, the smaller the indicator weight is. The formula to calculate the entropy weight can be expressed as follows.
where . is the entropy value of each indicator, and ≥ 0; is the frequency of the jth indicator in the ith sample, .
(4) Then, the modified entropy method was applied to calculate the weights, as a large error would be caused by the marginal modification of in the traditional entropy method [64]. The weights of the indicators can be calculated by the following improved equation.
where is the weight of the jth indicator, , and ; is the mean of .
Once the weights of the indicators are calculated, the calculation procedure of each index Wj can be proceeded according to the following equation.
2.3.3. Water Footprint Accounting
The water footprint was applied to reflect the volume of water consumption and pollution in this study. It was calculated using the framework provided by Hoekstra et al. [39]. For the blue water footprint, a modified method that takes the water consumption during the water transfer process into account was used [65]. The water footprint of the crop was calculated according to the evapotranspiration of water supplied from precipitation during the crop-growing period [39]. The crop coefficient was obtained through Zhao et al. [66].
The WFG refers to the volume of water that is required to assimilate the pollutant load to the acceptable water quality standard [67]. The accounting process of the gray water footprint can be found in Hoekstra et al. [39]. In this study, the gray water footprint of three main sectors, including the agricultural, industrial, and domestic sectors, in the region was mainly considered. In accordance with the amount of pollutants discharged into the river, nitrogen (N) was chosen as the main critical pollutant for the agricultural sector [68], and the chemical oxygen demand (COD) was chosen for the industrial and domestic sectors [69]. By using Equation (10), the gray water footprint for the industrial (WFG-i) and domestic sectors (WFG-d) could be calculated, and the gray water footprint for agriculture (WFG-a) could be calculated by Equation (11).
where L is the emission load of the pollutant, kg/a, Cmax is the highest pollutant concentration reaching the environmental water quality standard, kg/m3, and Cnat is the initial pollutant concentration of the receiving water bodies, referring to the pollutant concentration under natural conditions, kg/m3. In this study, the water quality standard of grade III, indicating that water is suitable for fish, aquaculture, and swimming, from the Environmental Quality Standards for Surface Water [70] was selected as the water quality standard to quantify the WFG [71]. One of the most frequently used indicators for water quality in China is the proportion of the river length with a water quality standard below grade III [69]. According to this standard, the maximum concentration (Cmax) of the COD is 20 mg/L. Due to a lack of data, the Cnat of both the COD and N was assumed to be 0, as suggested by Hoekstra et al. [39].
where Appl refers to the amount of the applied chemicals. α is the proportion of pollution caused by the amount of the chemical that entered the water body to the application amount of that chemical. In that case, α was equal to the N-leaching rate, and 7.4% was chosen as the leaching runoff fraction of N for Northern China [72].
After that, the largest gray water footprint value estimated from different pollutants was used, since water can dilute two different pollutants, N and the COD, at the same time.
WFG = max (WFG-a, WFG-i + WFG-d).
2.4. Uncertainty and Shortcomings
Uncertainty may exist when assessing a water resource sustainability by using an indicator-based method, e.g., in the selection of individual indicators, data quality, normalization, weighting, etc. [73]. Firstly, the selection of indicators is of vital importance, since composite indicators provide a starting point for analysis. Although a framework is provided by the DPSIR model to select the indicators for the driver, pressure, state, impact, and response indexes, the process is unavoidably subjective. For example, in agricultural activities, the uncontrolled development of fields was considered as pressure in the vulnerability assessment of wetland landscape ecosystem services [25], while the crop-sown area was treated as one of the driver indicators in the sustainability assessment of water resources for a water-shorted region [35]. Moreover, data acquisition and data quality, which determine the range of the study period, as well as the credibility, also make the whole analysis uncertain. Similarly, uncertainty is inevitable in this study. To overcome this problem, efforts were made. For example, the indictors of the DPSIR framework were selected based on a comprehensive literature review and a consultation with experts, the data used in this study was obtained from a yearbook or website published by the authoritative Chinese government and bureaus, and the entropy-weighting method was applied to avoid the influence of subjective factors with higher precision. However, the uncertainty that stems from data normalization was not mentioned in this study, which may be the focus of a future work.
In addition, the DPSIR model has been criticized as being too deterministic, most importantly by addressing its simplified, linear, and unidirectional causal chains that may not capture the complexity of real socioecological dynamics [27,74,75]. The criticism hinders the uptake of the model by quantitative scientists to some extent. To respond to the criticism, attention should be focused on the links among the indexes of DPSIR by applying specific socioeconomic and environmental bases so as to understand the cause-effect dynamics [34,76]. Besides, in this study, the value of the framework lies in its successful utility for providing a clear and specific structure to systematically explore the implications in social-economic-environmental interactions and governance approaches for a water resource sustainability assessment.
3. Results
In this study, a three-layer (the indicator layer, the index layer, and the comprehensive layer) indicator system was established to evaluate the sustainability of water resources based on the DPSIR model. In accordance with the indicators and indexes, a comprehensive assessment of the sustainability of the water resource system in the city of Beijing was conducted based on the modified entropy method.
3.1. The DPSIR Framework for Beijing
In this study, the analysis of water resource sustainability was performed using the systemic DPSIR model (Figure 2). The primary goal of the model is to provide clear and specific information about the driving forces, the resulting environmental pressures, the state of the environment, the impacts resulting from environmental changes, and the socioeconomic responses to the changes.
The driver index can be interpreted as natural factors and anthropogenic activity that may exert pressures on water resources, changing the spatial and temporal patterns of the water resource. The natural factor mainly includes precipitation, by which water resources are formed. Population growth, economic development, and urbanization were identified as the main underlying drivers of urban expansion and the main pressures on water resources [77,78]. The drivers in this study included indexes such as per capita GDP, permanent population density, precipitation, the Engel coefficient, and the rate of urbanization. It is worth noting that the reflection of the living standard of a region can be interpreted by the Engel coefficient. A higher Engel coefficient indicates the region is poorer; conversely, a low Engel coefficient indicates a higher standard of living. In contrast, urbanization was chosen as a synthetic indicator reflecting the integrated development of society, economy, culture, science, and technology.
The pressure index reflects the forces explicitly contributing to the changes of the water systems, and this index is caused by the influence of the drivers. Generally, a climate change introduces exogenous pressures. The integrated impact of a climate change and precipitation decrease was expressed by potential evapotranspiration (ET0) in this study. On the other hand, the pressures associated with the immediate drivers mainly included water abstraction and consumption. In addition, factors such as increasing irrigation, industrial and domestic demands, and nonpoint source pollution, which may degrade the state of a water body, could be considered as pressures. Therefore, this study considered the pressure index referring to the need for water resources and the index impacting water quality due to natural, social, and economic developments. It included the consumption of chemical fertilizer, the volume of discharged ammonia nitrogen, the volume of the COD emission, the irrigated area, ET0, the total annual water consumption, the water consumption per 10,000 Yuan GDP, the population of the water consumption, and the volume of discharged wastewater.
The state index refers to the condition of the water system resulting from both natural and anthropogenic factors. This study considered indexes for the state of the water system as the chemical or ecological characteristics of the water system and the quantity of available water resources. Specifically, the volume of both surface and groundwater resources, the groundwater depth in the plain area, the water footprint of crops, the ratio of the river length, the reservoir storage amount, and the lake area that met the water quality standard to the total evaluated corresponding water bodies were used to express the state of the water resources.
When the state of the water resources changes, the resulting changes in the ecosystem may impact the welfare of individuals and communities [79]. The impact index refers to the environmental, social, and economic impacts that affect ecosystem services and human welfare due to the changing state of the water system. The impact in this study can be expressed by the following indexes: the quantity of available blue water, the water transported from the South-to-North Project, the outflow of water, the gray water footprints, and the per capita water resource.
The response index refers to the measures taken to improve the state of the water system. The measures may act towards any element of the framework to guarantee a higher efficiency and sustainability of the local water resource system [57]. Similarly, apart from the physical measures acting directly during the processes of development and water resource use, the responses that are applied to encourage changes in behaviors through community participation and involvement should be considered. The response measures in this study included the reduction of the permanent migrant population, the sewage treatment capacity, the tertiary industry as a % of the GDP, the investment of water infrastructure construction, the ecological and environmental water supplements, the water saved, the rate of reused water from the industry above a designated size, the comprehensive utilization capacity of rain, the decreasing rate of water consumption per 10,000 Yuan GDP, the volume of reclaimed water, the water efficiency of irrigation, the soil and water erosion-controlled areas, and the urban green coverage. It is noteworthy that the reduction of the permanent migrant population was implemented, considering the great pressure that population has brought on the water resources carrying capacity in Beijing [80]. As mentioned earlier, domestic water consumption accounted for the largest proportion in total water consumption. Therefore, control of the permanent migrant population could be an effective way to reduce water use. While the comprehensive utilization capacity of rain means the ability to collect rainwater as a source of reclaimed water from both sealed surfaces and traditional rainwater drainage systems, the function of collected rainwater in water conservation, groundwater recharge, and the reduction of urban water disasters should not be neglected [81].
3.2. Weight of the Indicators in the DPSIR Framework
In this study, the weights for the indicators of the DPSIR model were decided based on the modified entropy method (Table 1). By calculating the weight of each indicator, key factors that have influenced the water resource sustainability were filtered. The table shows that the weight for each driver indicator results in the following hierarchy: permanent population density, precipitation, Engel’s coefficient, and so forth. This result indicates that the main drivers causing changes to the water system are population, precipitation, and regional economic development. The weight ranking of the pressure index displays that the main pressure on the water system was the use of chemical fertilizers and the volume of discharged pollutants. In detail, the amount of chemical fertilizer applied per unit area of cultivated land in Beijing was 397.20 kg/hm2 in 2017, far higher than the internationally recognized safe limit of 225 kg/hm2. The high fertilization intensity and the lack of management practices to control pollutant sources may lead to the eutrophication of water bodies through leaching [82,83]. The results demonstrated that agricultural chemical fertilizers and industrial sewage posed more threats to the water system than did the other factors. The sequence of the weights for the state indicators presented that the main indicator was the ratio of the river length with water reaching the water quality standard to the total evaluated river length, the quantity of the regional water resources, and the ratio of the reservoir storage capacity reaching the water quality standard to the gross reservoir capacity. This finding is in accordance with the actual practice in China, since the river system is all-round across the board. For the impact index, the water transported from the South-North Water Transfer Project, the quantity of available blue water, and the outflow of water were the main indicators reflecting the effects of the socioeconomic developments on the local water resources. The weights for the response indicators are ranked as follows: the permanent migrant population, the sewage treatment capacity, the tertiary industry as a % of the GDP, the investment of water infrastructure construction, etc. These results mean that measures relevant to population control, sewage treatment, industrial upgrading, and investment strengthening make great differences in water resource sustainability.
3.3. Sustainability Assessment of the Water Resource System
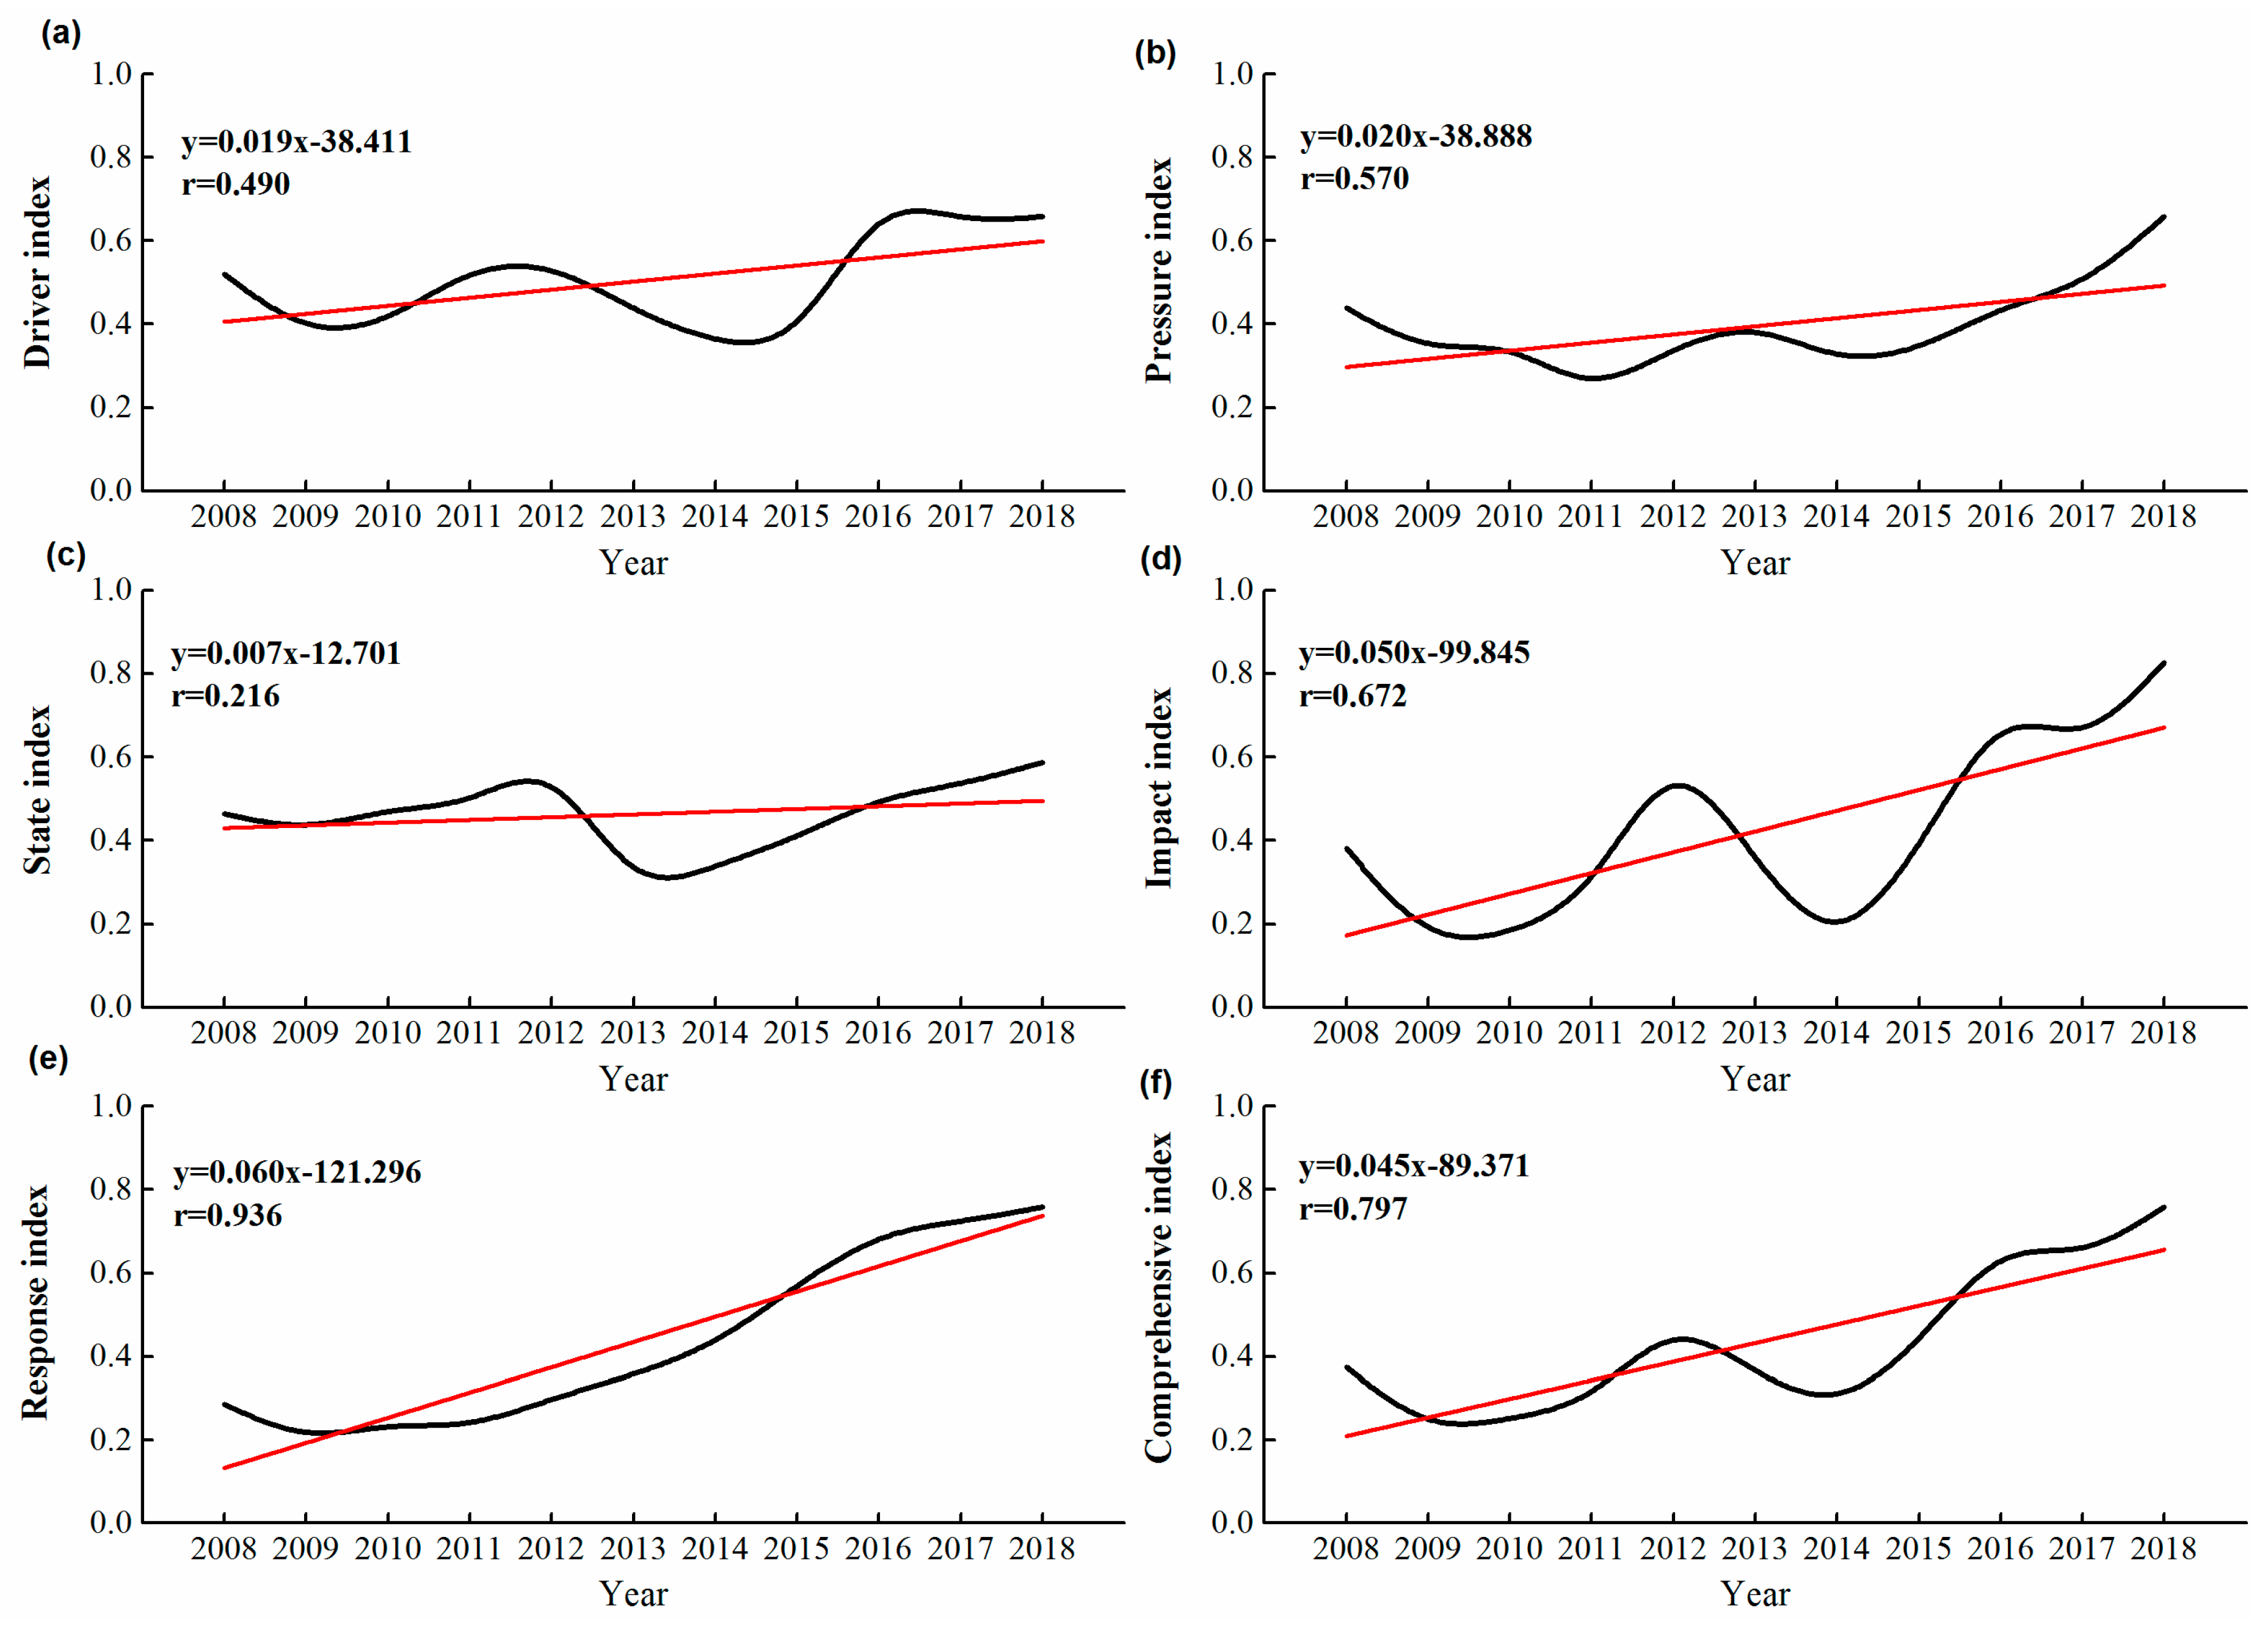
The quantification and analysis of the comprehensive index in the DPSIR were based on the weight of each index, which includes the annual change during the study period. Figure 3 illustrates that the driver index of the water resource sustainability increased slightly overall because of an increase in the per capita GDP and rate of urbanization, representing an improvement in resident living standards. This result indicates an increase in the driver of local water consumption because of social and economic developments and a change in residential consumption. The pressure on local water systems also increased because of the increase in the driver index. The local water resource system faced pressure from both the water demand and water pollution due to the increasing water use, in addition to the increasing amount of wastewater discharged from industrial and residential sources. For example, the local wastewater effluent increased from 132,095 × 104 m3 in 2008 to 203,703 × 104 m3 in 2018, with a rate of increase of 54.21%. Meanwhile, the state of water resources presents a gentle improving trend under the driver and increasing pressure on water resources, with a state of 0.50 in 2008 and 0.63 in 2018. The results clearly show improving conditions in both the chemical and ecological characteristics of the water system and the quantity of available water resources.
Driver and pressure have significant influences on water resource systems. The impact index of the water resource system increased steadily overall in 2008–2018, indicating the rising influence of water resources in maintaining the operations of the socioeconomic system. Among the indicators, the per capita water resource decreased from 198.5 m3/person to 164.61 m3/person, reflecting the descending trend of available water. To mitigate the water shortage situation, the amount of water transported from the South-to-North Water Transfer Project increased instead. Moreover, the gray water footprint, which is the volumetric indicator of water pollution, decreased from 5.06 × 10⁹ m3 in 2008 to 2.60 × 10⁹ m3 in 2018.
To face the increasing pressure on the water resource system caused by social and economic developments, the Beijing government has adopted a series of measures to maintain the sustainability of its water resources. These measures include upgrading economic structures, increasing the proportion of the tertiary industry, reducing water consumption, improving water use efficiency in production and the ratio of wastewater treatment, increasing water conservation investments, and so forth. For example, in the agricultural sector, the efficiency of irrigation water has increased by 9.4%, while the soil and water erosion-controlled areas roughly doubled from 2008 to 2018. Along with scientific and technological progress, the industrial sector has paid more attention to water reuse. The rate of reused water reached 95.8% in 2018 compared with a value of 89.1% in 2014. Moreover, great achievements were made in unconventional water resource utilization, as the volume of reclaimed water use reached 107,633 × 104 m3 in 2018 in comparison to a value of 60,000 × 104 m3 in 2008, and the comprehensive utilization capacity of rain increased from 2588.3 × 104 m3 to 6786.3 × 104 m3, respectively. The rising trend of the local response indicator was mainly due to the combined effect of these actions, which increased from 0.29 in 2008 to 0.76 in 2018 (Figure 3).
There was an overall upward trend in the water resource sustainability of Beijing because of the influence of indexes along with the drivers, pressures, state, impacts and responses. The results show that the response measures improved the water use efficiency and regional water resource system sustainability, although there were great pressures brought to the regional water resource system. It is noteworthy that, when a comprehensive evaluation was performed by the DPSIR model, the following grading strategy could be used as a reference [84]: (0.8, 1.0) represent the ideal state, (0.6, 0.8) represent good conditions, (0.4, 0.6) represent the alert state, (0.2, 0.4) represent the poor state, and (0, 0.2) represent the bad state. Figure 3 shows that the comprehensive index improved significantly, from 0.28 in 2009 to 0.70 in 2018, indicating that the sustainability of water resources improved from an alert state to good conditions.
4. Discussion
In this study, the driver, pressure, state, impact, and response factors that influenced the sustainability of the water resource system in Beijing from 2008 to 2018 were analyzed using the DPSIR framework based on the internal correlation among the water resources and socioeconomic factors.
What can be further inferred from Figure 3 is that the increasing rates of the drivers, pressures, and state indexes are quite low, which is unlike the decreasing trends observed in other places. For example, the results showed that the increasing drivers of population growth and socioeconomic development, coupled with the pressure of climate change and water demand, have resulted in the degradation of the water quantity and quality in an arid mountain region in Northern Oman [31]. Moreover, it was found that the status of the water resources in the city of Bayannur of Northwest China continued to decrease due to the increasing driving and pressure indicators [35]. Nevertheless, the findings in this study seem in accordance with those in Zhang et al. [33]. In their study, the relative stability and slight improvement in the status subsystem of water resource security was achieved despite the increasing pressures. The results actually reflect the feedback of the comprehensive measures taken by the Beijing government and the Beijing water authorities. Most indicators have been changing for the better since the awareness of maintaining water resource sustainability has increased and relevant measures have been adopted. Precisely because of the synthetic effects among these effective measures (indicators), the interannual variation in each DPSIR index has manifested a slight increasing tendency. For example, the rapidly growing population in Beijing, resulting in great pressure on the water supply, is deemed an obstacle to urban development and management [85]. To relieve the tight relationship between population expansion and water resources, the deconstruction of the noncapital functions of Beijing was vigorously and orderly promoted according to the “Master Plan of Beijing (2016–2035)”. Influenced by this strategy, the size of the permanent migrant resident population in Beijing has been declining since 2015 (the time node can also be seen in Figure 3e) [86]. Along with the shrinking size of the permanent migrant population, the permanent resident population of Beijing declined in 2017 and 2018 at rates of 0.10% and 0.76%, respectively. In other words, in the DPSIR framework, by controlling the input of the permanent migrant population (in the response index), the permanent population density (in the driver index) decreased from 1541 people/km2 in 2015 to 1136 people/km2 in 2018, and the pressure from the water consumption by the population dropped at a rate of 0.76%. As a result, the per capita water resources increased from 123.29 m3/person in 2015 to 164.61 m3/person in 2018. Although there was an increasing trend in per capita water resources, domestic water consumption still took up a greater proportion than production and ecological water consumption. To be specific, domestic water consumption increased from 7.45 × 10⁸ m3 in 2008 to 9 × 10⁸ m3 in 2018. Furthermore, it was interesting to find that the domestic water consumption in urban areas accounted for a larger proportion than that in rural areas. Meanwhile, the domestic water consumption in urban areas increased from 5.43 × 10⁸ m3 in 2008 to 7.77 × 10⁸ m3 in 2018, while the domestic water consumption in rural areas presented a decreasing tendency with rate of 39.11%.
Moreover, it is remarkable that the shape of the interannual variation of the drivers, the state, the impact, and the comprehensive index presented the same fluctuation tendency, which was analogous to the “W” type. What can be seen from both Figure 3 is that 2009 and 2014 formed the lowest turning points of the W-shaped curves. The reason for the decreasing W trend mainly lies in the deficiency of water resources caused by the sharp decreases in precipitation in 2009 and 2014. The precipitation in Beijing from 2008 to 2018 exhibited a W-shaped fluctuating trend. Specifically, all of 2009, 2010, and 2014 were low-flow years with precipitation amounts of 448 mm, 524 mm, and 439 mm, respectively, which were far lower than the long-term average value of 580 mm. To quantify the similarity of the curves, the discrete Fréchet distance between two curves using only the nodes along the curves for the measurements was calculated [87,88]. The smaller the value, the more similar the two curves were. According to the results, the distances between the driver, pressure, state, impact, response, and comprehensive indexes and the precipitation were 0.45, 0.51, 0.40, 0.51, 0.57, and 0.50, respectively. Moreover, the similarity was further illustrated in Figure 4 by extracting the main fluctuation tendency of the aforementioned indexes and precipitation. The same fluctuation trend of the drivers, the state, the impact, and the comprehensive indexes and the precipitation can be discovered from both the Fréchet distance and Figure 4. The decrease in precipitation led to an insufficient recharge of the runoff; as a result, problems such as insufficient volumes of both surface and groundwater resources and deficient per capita water resources arose in the corresponding years [89]. As a result, the changes in these indicators composed the final similar variation trend of the indexes. What can be further derived from the results is that potential influences would be brought to the water resources because of the driver of precipitation, the permanent population density, and so forth. Pressure on the water system increased because of the increase in the driver factors. Increased pressures on water resource systems led to a gradual improvement in the sustainable states of the water resource systems, thereby affecting the sustainability of the social, economic, and ecological environmental aspects related to water resource systems.
Actually, the above discussion directly states the sensitivity of the water resource system to climate change, as runoff is a key factor in the hydrological cycle and water resource system and is extensively influenced by climate change [90,91,92]. It was found that climate change can lead to an increased vulnerability of regional water resources under the same intensity of the water use [93]. Relying on the supply of precipitation, the differences in the water resource distributions in Beijing are rather notable in both time and space. Large amounts of water use and uneven spatial and temporal distributions of water resources have made the situation of water scarcity worse. To solve this problem, the South-to-North Water Transfer Project, a major strategic project to change the situation of floods and droughts in South China and severe water shortages in the North, was designed to furnish part of the abundant water resources in the Yangtze River to North China and Northwest China [94]. Currently, approximately 1 billion m3 of water is delivered to Beijing annually to satisfy the demands, and a total amount of 4.05 billion m3 water has been received by October 2018 since the midline of the project first activated in December 2014. The received water has been mainly distributed according to the principle of “drinking, storing, and replenishing” for municipal and industrial supplies, with 2.67 billion m3 (accounting for 66%) used for the water supplies of waterworks, 666 million m3 (16%) stored in reservoirs in Miyun and Huairou for unexpected needs, 270 million m3 (7%) reserved in groundwater sources, and 441 million m3 (11%) replenished for rivers and lakes in urban areas [95]. The project has provided tremendous help in solving water resource problems. It was discovered that part of the groundwater supply would be gradually replaced, and the groundwater level would gradually recover, in various degrees in Beijing after the implementation of the project [96]. In this study, water derived from the South-to-North Water Transfer Project is the most influential indicator that affects the sustainability of the water resources in Beijing. The results indicate that the impacts of the input water on the ecosystems and other socioeconomic aspects are profound and representative.
Although multiple measures have been taken to protect the sustainability of the regional water resource system, the results show that there is still much room for sustainable water resource management to attain an ideal state in light of the achievement of good conditions since 2016. It is certain that the sustainability of regional water resources can only be achieved through a comprehensive consideration of the regional social, economic, environmental, and water systems and climate changes. This is actualized by formulating regional medium- and long-term urban, economic, and water development plans. Studies have shown that substantial environmental improvements under the scenarios aimed at long-term resilience and sustainability could be achieved either through individual choices or innovation and technology [30]. In addition, a number of medium- and short-term development goals, such as water saving and conservation projects or technological measures for water resource exploitation, utilization, reasonable allocation, and control, should be adjusted in a timely manner through a series of response measures by both the government and the water authorities of Beijing. Specifically, from the point of social factors, the deconstruction of the noncapital functions of Beijing should be implemented continuously, since the effects of population reduction are conspicuous; in an economic development aspect, a great promotion in the deep transformations of the development pattern, restructured economy, and upgrading of the industrial structure to reduce the industrial scale involved in high water consumption and high pollution are essential; from the perspectives of scientific and technological factors, measures aimed at improving the water usage efficiency in the industry and agriculture, increasing the ratio of wastewater treatments, controlling the emissions of agricultural nonpoint source nutrients, and improving the comprehensive utilization capacity of rain should be upgraded [97,98,99,100]. Moreover, the consciousness of saving water should be established deeply by educating and propagating in the cultural aspects [101].
In addition, Figure 3 shows that all the values were significantly high in 2008; then, the DPSIR and comprehensive index experienced noticeable drops afterwards. These declines are mainly because a series of exceptional management measures, as well as relevant laws and standards related to water saving, pollutant control, urban sewage treatment, and water conservation, were adopted to maintain the sustainability of the water system for the Beijing Olympic Games in 2008. As a result, good results were achieved, and the sustainable index increased significantly because of the implementation of these measures [102,103]. Nevertheless, it seems that the management measures during the Olympics did not continue to be effective, since all the indexes descended strikingly in 2009. These results indicate that environmental governance is a step-by-step process, and special policies in a special period cannot play a long-term role in the sustainable development of water resources. Therefore, long-term governance measures that are situation-specific are needed to ensure the steady progress of urban sustainable water resource developments.
5. Conclusions
The quantification of water resource sustainability in Beijing, a megacity with severe water scarcity issues, plays a critical role in implementing sustainable water management. In this study, a comprehensive assessment of the water resource sustainability in Beijing was conducted from 2008 to 2018. To achieve this, an evaluation indicator system based on the DPSIR model was established to explore the relationships between the water resource and socioeconomic system in terms of the driver, pressure, states, impacts, and response aspects. Moreover, the concept of the water footprint was introduced to quantify the water use relative to human consumption and the effect of water pollution on the water resources. To focus on the key social and ecological factors that have influenced the water resources, a modified entropy method was applied to calculate the weight of the indicators.
Results showed that the effects of the driving forces to water resource systems were increasing while moving ahead with socioeconomic factors. Meanwhile, influenced by the sustained stimulation effect of the driver index, the pressure on the local water systems increased, whereas a gradual improvement in the sustainability of the water system in Beijing, which was mitigated from the alert state into good conditions, was achieved due to the responding measures. Results also demonstrated that the water resource system in Beijing was sensitive to precipitation, since the DPSIR indexes displayed the same fluctuation tendency with precipitation. Furthermore, water derived from the South-to-North Water Transfer Project was found to be the most influential indicator that affects the sustainability of the water resources in Beijing.
The evaluation results indicated that there still remains much room for water resource management to attain an ideal sustainable state. It is noteworthy that the sustainable water resources state of Beijing can only be achieved in the future through an integrated consideration of socioeconomic, environmental, and water resource systems and the sustainability of the water resource policies. The following suggestions for sustainable water resource utilization can be attained in this study. Firstly, attention should be paid to the changes of the concept, since the achievement of sustainable goals is a step-by-step process, and special policies in special periods cannot play a long-term role in the sustainable development of water resources. According to this, regional medium- and long-term urban, economic, and water development plans should be formulated to comprehensively coordinate the variations in regional social, economic, environmental (including water systems), and climate changes. In addition, a number of medium- and short-term development programs, such as water saving and conservation projects or technological measures for water resource exploitation, utilization, reasonable allocation, and control, should be adjusted in a timely manner through matching the response measures by both the government and the water authorities of Beijing.
The results also suggested that the specific causal relationship highlighted by the DPSIR model was a feasible and powerful tool for quantitatively evaluating water resource sustainability levels, which can be used not only to determine the critical factors that affect the sustainability of water resources but, also, to develop integrated sustainable water management strategies. However, limited by data availability, only a few socioeconomic and environmental indicators were considered, while cultural factors, such as the water saving consciousness of residents, were less involved in this study. Additionally, the application of the DPSIR framework proposed in this study needs further discussion as the existing differences under different natural environments and socioeconomic regions. Thus, a further study that aims to prove the feasibility of the DPSIR model ought to consider comprehensive socioeconomic, environmental, and cultural factors—those that address the consciousness and concept.
Author Contributions
Conceptualization, supervision, and project administration, B.L.; methodology, formal analysis, and writing—original draft preparation and review and editing, H.Y.; and resources and visualization, Z.Y. All authors have read and agreed to the published version of the manuscript.
Funding
This research received no external funding.
Acknowledgments
The authors would like to thank the anonymous reviewers for their valuable comments.
Conflicts of Interest
The authors declare no conflicts of interest.
References
- Arnell, N.W. Climate change and global water resources. Glob. Environ. Chang. 1999, 9, S31–S49. [Google Scholar] [CrossRef]
- Iglesias, E.; Blanco, M. New directions in water resources management: The role of water pricing policies. Water Resour. Res. 2008, 44. [Google Scholar] [CrossRef] [Green Version]
- Tang, Q. Global change hydrology: Terrestrial water cycle and global change. Sci. China Earth Sci. 2020, 63, 459–462. [Google Scholar] [CrossRef]
- Marris, E. ‘Water scarcity’ affects four billion people each year. Nature 2016, 19370. [Google Scholar] [CrossRef]
- Brookshire, D.S. Water resources issues in the developing countries. Water Resour. Res. 1993, 29, 1883–1888. [Google Scholar] [CrossRef]
- Susskind, L. Climate change: Adaptation vs mitigation. Nature 2009, 478, 447–449. [Google Scholar]
- Vörösmarty, C.J.; McIntyre, P.B.; Gessner, M.O.; Dudgeon, D.; Prusevich, A.; Green, P.; Glidden, S.; Bunn, S.E.; Sullivan, C.A.; Liermann, C.R.; et al. Global threats to human water security and river biodiversity. Nature 2010, 467, 555–561. [Google Scholar] [CrossRef]
- Long, K.S.; Pijanowski, B.C. Is there a relationship between water scarcity and water use efficiency in China? A national decadal assessment across spatial scales. Land Use Policy 2017, 69, 502–511. [Google Scholar] [CrossRef]
- Jia, P.; Zhuang, D.; Wang, Y. Impacts of temperature and precipitation on the spatiotemporal distribution of water resources in Chinese mega cities: The case of Beijing. J. Water Clim. Chang. 2017, 8, 593–612. [Google Scholar] [CrossRef] [Green Version]
- Van Dijk, M.P.; Zhang, M. Urban water management paradigms in Chinese cities. Sustainability 2019, 11, 3001. [Google Scholar] [CrossRef] [Green Version]
- Loucks, D.P.; Glaswell, J.S. Sustainability Criteria for Water Resource Systems, 1st ed.; Cambridge University Press: Cambridge, UK, 1999; p. 249. [Google Scholar]
- Harken, B.; Chang, C.F.; Dietrich, P.; Kalbacher, T.; Rubin, Y. Hydrogeological modeling and water resources management: Improving the link between data, prediction, and decision making. Water Resour. Res. 2019, 55, 10340–10357. [Google Scholar] [CrossRef]
- Argent, R.M. An overview of model integration for environmental applications- components, frameworks and semantics. Environ. Model. Softw. 2004, 19, 219–234. [Google Scholar] [CrossRef]
- Juwana, I.; Muttil, N.; Perera, B.J.C. Indicator-based water sustainability assessment—A review. Sci. Total Environ. 2012, 438, 357–371. [Google Scholar] [CrossRef] [PubMed] [Green Version]
- Haro-Monteagudo, D.; Palazón, L.; Beguería, S. Long-term sustainability of large water resource systems under climate change: A cascade modeling approach. J. Hydrol. 2020, 582, 1–13. [Google Scholar] [CrossRef]
- Glavan, M.; Cvejić, R.; Tratnik, M.; Pintar, M. Geospatial analysis of water resources for sustainable agricultural water use in Slovenia. In Current Perspectives in Contaminant Hydrology and Water Resources Sustainability; Bradley, P.M., Ed.; InTech: Rijeka, Croatia, 2013; pp. 199–219. [Google Scholar]
- Lawrence, P.; Meigh, J.; Sullivan, C. The Water Poverty Index: An international comparison. In Keele Economics Research Papers; Keele Economics: Staffordshire, UK, 2002; pp. 1–17. [Google Scholar]
- Juwana, I.; Perera, B.J.C.; Muttil, N. A water sustainability index for West Java—Part 2: Refining the conceptual framework using Delphi technique. Water Sci. Technol. 2010, 62, 1641–1652. [Google Scholar] [CrossRef] [PubMed]
- Chaves, H.M.L.; Alipaz, S. An integrated indicator based on basin hydrology, environment, life, and policy: The Watershed Sustainability Index. Water Resour. Manag. 2007, 21, 883–895. [Google Scholar] [CrossRef]
- Wang, Q.; Li, S.; Li, R. Evaluating water resource sustainability in Beijing, China: Combining PSR model and matter-element extension method. J. Clean. Prod. 2019, 206, 171–179. [Google Scholar] [CrossRef]
- Walmsley, J.J. Development of Sustainability Indactors for Catchment Management Information Systemshesis. Ph.D. Thesis, University of the Free State, Bloemfontein, South Africa, 2002; pp. 55–157. [Google Scholar]
- Gregory, A.J.; Atkins, J.P.; Burdon, D.; Elliott, M. A problem structuring method for ecosystem-based management: The DPSIR modelling process. Eur. J. Oper. Res. 2013, 227, 558–569. [Google Scholar] [CrossRef]
- Majorošová, M. DPSIR Framework—A decision—Making tool for municipalities. Slovak J. Civ. Eng. 2016, 24, 45–50. [Google Scholar] [CrossRef] [Green Version]
- Albert, C.; Albert, C.; Von Haaren, C.; Othengrafen, F.; Krätzig, S.; Saathoff, W. Scaling policy conflicts in ecosystem services governance: A framework for spatial analysis. J. Environ. Pol. Plan. 2017, 19, 574–592. [Google Scholar] [CrossRef]
- Malekmohammadi, B.; Jahanishakib, F. Vulnerability assessment of wetland landscape ecosystem services using driver-pressure-state-impact-response (DPSIR) model. Ecol. Indic. 2017, 82, 293–303. [Google Scholar] [CrossRef]
- Schönach, P.; Nygrén, N.A.; Tammeorg, O.; Heikkinen, M.; Holmroos, H.; Massa, I.; Niemistö, J.; Tapio, P.; Horppila, J. The past, present, and future of a lake: Interdisciplinary analysis of long-term lake restoration. Environ. Sci. Policy 2018, 81, 95–103. [Google Scholar] [CrossRef]
- Gari, S.R.; Newton, A.; Icely, J.D. A review of the application and evolution of the DPSIR framework with an emphasis on coastal social-ecological systems. Ocean Coast. Manag. 2015, 103, 63–77. [Google Scholar] [CrossRef] [Green Version]
- Lewison, R.L.; Rudd, M.A.; Al-Hayek, W.; Baldwin, C.; Beger, M.; Lieske, S.N.; Jones, C.; Satumanatpan, S.; Junchompoo, C.; Hines, E. How the DPSIR framework can be used for structuring problems and facilitating empirical research in coastal systems. Environ. Sci. Policy 2016, 56, 110–119. [Google Scholar] [CrossRef] [Green Version]
- Gleick, P.H.; Palaniappan, M. Peak water limits to freshwater withdrawal and use. Proc. Natl. Acad. Sci. USA 2010, 107, 11155–11162. [Google Scholar] [CrossRef] [PubMed] [Green Version]
- Henriques, C.; Garnett, K.; Weatherhead, E.K.; Lickorish, F.A.; Forrow, D.; Delgado, J. The future water environment—Using scenarios to explore the significant water management challenges in England and Wales to 2050. Sci. Total Environ. 2015, 512–513, 381–396. [Google Scholar] [CrossRef] [PubMed]
- Al-Kalbani, M.S.; Price, M.F.; O’Higgins, T.; Ahmed, M.; Abahussain, A. Integrated environmental assessment to explore water resources management in Al Jabal Al Akhdar, Sultanate of Oman. Reg. Environ. Chang. 2016, 16, 1345–1361. [Google Scholar] [CrossRef]
- Roy, K.; Gain, A.K.; Mallick, B.; Vogt, J. Social, hydro-ecological and climatic change in the southwest coastal region of Bangladesh. Reg. Environ. Chang. 2017, 17, 1895–1906. [Google Scholar] [CrossRef]
- Zhang, J.Y.; Wang, L.C. Assessment of water resource security in Chongqing City of China: What has been done and what remains to be done? Nat. Hazards 2015, 75, 2751–2772. [Google Scholar] [CrossRef]
- Mattas, C.; Voudouris, K.; Panagopoulos, A. Integrated Groundwater Resources Management Using the DPSIR Approach in a GIS Environment Context: A Case Study from the Gallikos River Basin, North Greece. Water 2014, 6, 1043–1068. [Google Scholar] [CrossRef] [Green Version]
- Sun, S.K.; Wang, Y.B.; Liu, J.; Cai, H.J.; Wu, P.T.; Geng, Q.L.; Xu, L.J. Sustainability assessment of regional water resources under the DPSIR framework. J. Hydrol. 2016, 532, 140–148. [Google Scholar] [CrossRef]
- Hoekstra, A.Y.; Hung, P.Q. Virtual Water Trade: A Quantification of Virtual Water Flows between Nations in Relation to International Crop Trade, 11st ed.; National Institute for Public Health and the Environment: Delft, The Netherlands, 2002; p. 15. [Google Scholar]
- Hoekstra, A.Y.; Mekonnen, M.M. The water footprint of humanity. Proc. Natl. Acad. Sci. USA 2012, 109, 3232–3237. [Google Scholar] [CrossRef] [Green Version]
- Ercin, A.E.; Aldaya, M.M.; Hoekstra, A.Y. Corporate water footprint accounting and impact assessment: The case of the water footprint of a sugar-containing carbonated beverage. Water Resour. Manag. 2011, 25, 721–741. [Google Scholar] [CrossRef]
- Hoekstra, A.Y.; Chapagain, A.K.; Aldaya, M.M.; Mekonnen, M.M. The Water Footprint Assessment Manual: Setting the Global Standard; Earthscan: London, UK, 2011; Volume 31, p. 224. [Google Scholar]
- Huang, K.; Wang, Z.Y.; Yu, Y.J.; Yang, S.S. Assessing the environmental impact of the water footprint in Beijing, China. Water Policy 2015, 17, 777. [Google Scholar] [CrossRef]
- Zhai, Y.Z.; Guo, Y.L.; Zhou, J.; Guo, N.; Wang, J.S.; Teng, Y.G. The spatio-temporal variability of annual precipitation and its local impact factors during 1724-2010 in Beijing, China. Hydrol. Process. 2014, 28, 2192–2201. [Google Scholar] [CrossRef]
- Falkenmark, M.; Lundqvist, J.; Widstrand, C. Macro-scale water scarcity requires micro-scale approaches. Nat. Resour. Forum 1989, 13, 258–267. [Google Scholar] [CrossRef] [PubMed]
- United Nations Environment Programme. Independent Environmental Assessment: Beijing 2008 Olympic Games; United Nations Environment Programme: Beijing, China, 2009; pp. 70–77. [Google Scholar]
- Liu, H.; Liu, J.; Yang, W.; Chen, J.; Zhu, M. Analysis and prediction of land use in Beijing-Tianjin-Hebei region: A study based on the improved convolutional neural network model. Sustainability 2020, 12, 3002. [Google Scholar] [CrossRef] [Green Version]
- Li, F.X.; He, L. The effects of dominant driving forces on summer precipitation during different periods in Beijing. Atmosphere 2017, 8, 44. [Google Scholar] [CrossRef] [Green Version]
- Ma, Z.; Fang, Z.; Xie, X.; Chai, F.; Zhang, Q. Study on feature storage and storage capacity of underground reservoir based on GMS in MHS area of Beijing, China. Arab. J. Geosci. 2015, 8, 10359–10369. [Google Scholar] [CrossRef]
- Lin, Z.; Gong, H.L.; Teatini, P.; Li, X.J.; Dai, Z.X. Land Subsidence due to groundwater withdrawal in the northern Beijing plain, China. Eng. Geol. 2015, 193, 243–255. [Google Scholar]
- Sun, F.; Yang, Z.S.; Huang, Z.F. Challenges and solutions of urban hydrology in Beijing. Water Resour. Manag. 2014, 28, 3377–3389. [Google Scholar] [CrossRef]
- Zhang, Y.Q.; Gong, H.L.; Gu, Z.Q.; Rong, W.; Zhao, W.J. Characterization of land subsidence induced by groundwater withdrawals in the plain of Beijing city, China. Hydrogeol. J. 2014, 22, 397–409. [Google Scholar] [CrossRef]
- Yang, Y.; Li, G.M.; Dong, Y.H.; Li, M.; Yang, J.Q.; Zhou, D.; Yang, Z.S.; Zheng, F.D. Influence of South to North Water Transfer on groundwater dynamic change in Beijing plain. Environ. Earth Sci. 2012, 65, 1323–1331. [Google Scholar] [CrossRef]
- Xu, X.Z.; Song, G.D.; Dang, T.M.; Liu, J.W.; Zhang, H.W.; Gao, H.; Liu, Y.K. Environment and sustainability of the Middle Route, South-to-North Water Transfer Project in China: A close look. Environ. Dev. Sustain. 2018, 20, 2415–2426. [Google Scholar] [CrossRef]
- Beijing Municipal Bureau of Statistics. NBS Survey Office in Beijing Beijing Statistical Yearbook, 2009–2019th ed.; China Statistics Press: Beijing, China; Beijing Info Press: Beijing, China, 2009–2019.
- China National Bureau of Statistics China Statistical Yearbook, 2009–2019th ed.; China Statistical Press: Beijing, China, 2009–2019.
- Beijing Water Authority Beijing Water Statistical Yearbook, 2016–2018th ed.; Beijing Water Authority: Beijing, China, 2016–2018.
- Zhou, Z.; Liu, W.G.; Tang, N.; Jiao, Z.Z.; Li, M.S. Water Resources Bulletin, 2008–2018th ed.; Beijing Water Authority: Beijing, China, 2008–2018.
- Organization for Economic Co-operation and Development. OECD Environmental Indicators: Development, Measurement and Use; Organization for Economic Co-operation and Development: Paris, France, 2003; pp. 13–15. [Google Scholar]
- Smeets, E.; Weterings, R. Environmental Indicators: Typology and Overview; European Environment Agency: Copenhagen, Denmark, 1999; p. 19. [Google Scholar]
- Semeoshenkova, V.; Newton, A.; Rojas, M.; Piccolo, M.C.; Bustos, M.L.; Huamantinco Cisneros, M.A.; Berninsone, L.G. A combined DPSIR and SAF approach for the adaptive management of beach erosion in Monte Hermoso and Pehuen Co (Argentina). Ocean Coast. Manag. 2017, 143, 63–73. [Google Scholar] [CrossRef]
- Fernandez, S.; Bouleau, G.; Treyer, S. Bringing politics back into water planning scenarios in Europe. J. Hydrol. 2014, 518, 17–27. [Google Scholar] [CrossRef] [Green Version]
- Shannon, C.E. A mathematical theory of communications. Bell Syst. Tech. J. 1948, 27, 623–656. [Google Scholar] [CrossRef]
- Zou, Z.H.; Yun, Y.; Sun, J.N. Entropy method for determination of weight of evaluating indicators in fuzzy synthetic evaluation for water quality assessment. J. Environ. Sci. 2006, 18, 1020–1023. [Google Scholar] [CrossRef]
- Guan, F.Y.; Liu, C.Z.; Xie, F.M.; Chen, H.Y. Evaluation of the competitiveness of China’s commercial banks based on the G-CAMELS evaluation system. Sustainability 2019, 11, 1791. [Google Scholar] [CrossRef] [Green Version]
- Wang, X.D.; Yang, Z.Y. Application of fuzzy optimization model based on entropy weight method in atmospheric quality evaluation: A case study of Zhejiang province, China. Sustainability 2019, 11, 2143. [Google Scholar] [CrossRef] [Green Version]
- Ouyang, S.; Shi, Y.L. A new improved entropy method and its application in power quality evaluation. Autom. Electr. Syst. 2013, 37, 156–159. [Google Scholar] [CrossRef]
- Sun, S.K.; Wu, P.T.; Wang, Y.B.; Zhao, X.N.; Liu, J.; Zhang, X.H. The impacts of interannual climate variability and agricultural inputs on water footprint of crop production in an irrigation district of China. Sci. Total Environ. 2013, 444, 498–507. [Google Scholar] [CrossRef]
- Zhao, N.N.; Liu, Y.; Cai, J.B.; Paredes, P.; Rosa, R.D.; Pereira, L.S. Dual crop coefficient modelling applied to the winter wheat–summer maize crop sequence in North China Plain: Basal crop coefficients and soil evaporation component. Agric. Water Manag. 2013, 117, 93–105. [Google Scholar] [CrossRef]
- Chapagain, A.K.; Hoekstra, A.Y.; Savenije, H.H.G.; Gautam, R. The water footprint of cotton consumption: An assessment of the impact of worldwide consumption of cotton products on the water resources in the cotton producing countries. Ecol. Econ. 2006, 60, 186–203. [Google Scholar] [CrossRef]
- Cheng, C.W.; Shi, Y.; Wen, T.J. The True Cost of Nitrogen; School of Agriculture Economics and Rural Development, Renmin Universtiy of China: Beijing, China, 2013; Volume 2010, p. 38. [Google Scholar]
- Minisry of Environmental Protection. Report on the State of the Environment in China; Ministry of Ecology and Environment: Beijing, China, 2018; pp. 18–24.
- Ministry of Environment Protection of China Environmental Quality Standards for Surface Water; GB3838-2002; Ministry of Environment Protection (Ed.) Standards Press of China: Beijing, China, 2002; p. 12. [Google Scholar]
- Zeng, Z.; Liu, J.G.; Savenije, H.H.G. A simple approach to assess water scarcity integrating water quantity and quality. Ecol. Indic. 2013, 34, 441–449. [Google Scholar] [CrossRef]
- Ju, X.T.; Xing, G.X.; Chen, X.P.; Zhang, S.L.; Zhang, L.J.; Liu, X.J.; Cui, Z.L.; Yin, B.; Christie, P.; Zhu, Z.L.; et al. Reducing environmental risk by improving N management in intensive Chinese agricultural systems. Proc. Natl. Acad. Sci. USA 2009, 106, 3041–3046. [Google Scholar] [CrossRef] [PubMed] [Green Version]
- Nardo, M.; Saisana, M.; Saltelli, A.; Tarantola, S. Handbook on Constructing Composite Indicators: Methodology and User Guide; Organization for Economic Co-operation and Development: Ispra, Italy, 2008; Volume 2020. [Google Scholar]
- O’Connor, M.; Spangenberg, J.H. A methodology for CSR reporting: Assuring a representative diversity of indicators across stakeholders, scales, sites and performance issues. J. Clean. Prod. 2008, 16, 1399–1415. [Google Scholar] [CrossRef]
- Svarstad, H.; Petersen, L.K.; Rothman, D.; Siepel, H.; Wätzold, F. Discursive biases of the environmental research framework DPSIR. Land Use Policy 2008, 25, 116–125. [Google Scholar] [CrossRef]
- Song, X.; Frostell, B. The DPSIR framework and a pressure-oriented water quality monitoring approach to ecological river restoration. Water 2012, 4, 700–712. [Google Scholar] [CrossRef]
- Alig, R.J.; Kline, J.D.; Lichtenstein, M. Urbanization on the US landscape: Looking ahead in the 21st century. Landsc. Urban Plan 2004, 69, 219–234. [Google Scholar] [CrossRef]
- Deng, X.Z.; Huang, J.K.; Rozelle, S.; Uchida, E. Growth, population and industrialization, and urban land expansion of China. J. Urban Econ. 2008, 63, 96–115. [Google Scholar] [CrossRef]
- Atkins, J.P.; Burdon, D.; Elliott, M.; Gregory, A.J. Management of the marine environment: Integrating ecosystem services and societal benefits with the DPSIR framework in a systems approach. Mar. Pollut. Bull. 2011, 62, 215–226. [Google Scholar] [CrossRef]
- Wang, Z.; Yuan, K.; Wang, J. Research of population carrying capacity of Beijing based on the resources and environment constraints. China Popul. Resour. Environ. 2016, 26, 351–354. [Google Scholar]
- Chen, W.; Gao, S. Research on rainwater management from the perspective of sponge city. In Environmental Science and Material Application 2018; IOP: Xi’an, China, 2019; p. 5. [Google Scholar]
- Geng, R.; Wang, X.; Sharpley, A.N.; Meng, F. Spatially-distributed cost-effectiveness analysis framework to control phosphorus from agricultural diffuse pollution. PLoS ONE 2015, 10, e0130607. [Google Scholar] [CrossRef] [PubMed]
- Yao, W. Macroscopic factor decomposition of non-point source pollution of chemical fertilizer: Scale, structure and constraint. Nat. Environ. Pollut. Technol. 2019, 18, 323–327. [Google Scholar]
- Shao, C.; Guan, Y.; Chu, C.; Shi, R.; Ju, M.; Shi, J. Trends analysis of ecological environment security based on DPSIR model in the coastal zone: A survey study in Tianjin, China. Int. J. Environ. Res. 2014, 8, 765–778. [Google Scholar]
- Zeng, X.T.; Zhao, J.Y.; Wang, D.Q.; Kong, X.M.; Zhu, Y.; Liu, Z.P.; Dai, W.; Huang, G.H. Scenario analysis of a sustainable water-food nexus optimization with consideration of population-economy regulation in Beijing-Tianjin-Hebei region. J. Clean. Prod. 2019, 228, 927–940. [Google Scholar] [CrossRef]
- Hong, X.L.; Chen, Z.G. Beijing Population Situation Analysis Report (2018); Social Sciences Academic Press: Beijing, China, 2018; p. 26. [Google Scholar]
- Eiter, T.; Mannila, H. Computing Discrete Frechet Distance; Information Systems Department, Technical University of Vienna: Vienna, Austria, 1994; pp. 1–7. [Google Scholar]
- Mosig, A.; Clausen, M. Approximately matching polygonal curves with respect to the Frechet Distance. Comput. Geom. 2005, 30, 113–127. [Google Scholar] [CrossRef] [Green Version]
- Chen, Z.; Jiang, W.G.; Wang, W.J.; Deng, Y.; He, B.; Jia, K. The impact of precipitation deficit and urbanization on variations in water storage in the Beijing-Tianjin-Hebei urban agglomeration. Remote Sens. 2018, 10, 4. [Google Scholar] [CrossRef] [Green Version]
- Liu, J.G.; Mooney, H.; Hull, V.; Davis, S.J.; Gaskell, J.; Hertel, T.; Lubchenco, J.; Seto, K.C.; Gleick, P.; Kremen, C.; et al. Systems integration for global sustainability. Science 2015, 347, 6225. [Google Scholar] [CrossRef] [Green Version]
- Bao, Z.X.; Zhang, J.Y.; Liu, J.F.; Wang, G.Q.; Yan, X.L.; Wang, X.J.; Zhang, L.R. Sensitivity of hydrological variables to climate change in the Haihe River basin, China. Hydrol. Process. 2012, 26, 2294–2306. [Google Scholar] [CrossRef]
- Piao, S.L.; Ciais, P.; Huang, Y.; Shen, Z.H.; Peng, S.S.; Li, J.S.; Zhou, L.P.; Liu, H.Y.; Ma, Y.C.; Ding, Y.H.; et al. The impacts of climate change on water resources and agriculture in China. Nature 2010, 467, 43–51. [Google Scholar] [CrossRef] [PubMed]
- Xia, J.; Qiu, B.; Li, Y. Water resources vulnerability and adaptive management in the Huang, Huai and Hai river basins of China. Water Int. 2012, 37, 523–536. [Google Scholar] [CrossRef]
- General Office of the State Council General layout of South to North Water Diversion Project. Available online: http://www.gov.cn/ztzl/2006-01/02/content_145297.htm (accessed on 1 May 2020).
- He, Y.P.; Li, S.J.; Li, Y.; Li, X.S.; Liu, C.J. Effect of South-to-North water transfer project on recharge and water level in Chaobai river area. Beijing Water 2019, 3, 21–26. [Google Scholar]
- Zhang, M.L.; Hu, L.T.; Yao, L.L.; Yin, W.J. Numerical studies on the influences of the South-to-North Water Transfer Project on groundwater level changes in the Beijing Plain, China. Hydrol. Process. 2018, 32, 1858–1873. [Google Scholar] [CrossRef]
- Yang, J.; Liang, J.P.; Yang, G.H.; Feng, Y.Z.; Ren, G.X.; Ren, C.J.; Han, X.H.; Wang, X.J. Characteristics of non-point source pollution under different land use types. Sustainability 2020, 12, 2012. [Google Scholar] [CrossRef] [Green Version]
- Kim, J.Y.; Furumai, H. Assessment of rainwater availability by building type and water use through GIS-based scenario analysis. Water Resour. Manag. 2012, 26, 1499–1511. [Google Scholar] [CrossRef]
- Ma, J.; Chen, X.; Shi, Y. Distinguishing the main pollution source an efficient way in agricultural non-point source pollution control. Adv. Mater. Res. 2011, 347–353, 2195–2199. [Google Scholar] [CrossRef]
- Zhang, X.Q.; Hu, M.C.; Chen, G.; Xu, Y.P. Urban rainwater utilization and its role in mitigating urban waterlogging problems—A case study in Nanjing, China. Water Resour. Manag. 2012, 26, 3757–3766. [Google Scholar] [CrossRef]
- Akpinar, M.G.; Gul, M.; Ceylan, R.F.; Gulcan, S. Evaluation of the factors affecting water-saving attitudes of urban life on the verge of the next century: A case study of the Mediterranean region of Turkey. J. Water Sanit. Hyg. Dev. 2018, 8, 340–348. [Google Scholar] [CrossRef]
- Zhang, J.C.; Liu, L.Y. Green Olympics: A Promise of Blue Water and Blue Sky, 1st ed.; Science Press: Beijing, China, 2008; pp. 68–89. [Google Scholar]
- Zhou, S.X.; Xu, L. Olympic Beijing; Beijing University of Technology Press: Beijing, China, 2007; pp. 127–138. [Google Scholar]
Figure 1.
Location of the study area.

Figure 2.
The driver-pressure-state-impact-response (DPSIR) framework for Beijing.

Figure 3.
Inter-annual variation of the DPSIR index. (a) Inter-annual variation of the driver index, (b) inter-annual variation of the pressure index, (c) inter-annual variation of the state index, (d) inter-annual variation of the impact index, (e) inter-annual variation of the response index, and (f) inter-annual variation of the comprehensive index.

Figure 4.
The main fluctuation tendency of the DPSIR indexes and the precipitation.


Table 1.
Components of the indicators for each driver-pressure-state-impact-response (DPSIR) index and the interpretations. COD: chemical oxygen demand.
Table 1.
Components of the indicators for each driver-pressure-state-impact-response (DPSIR) index and the interpretations. COD: chemical oxygen demand.
| Index | Indicators | Units | Property | Weight Ranking |
|---|---|---|---|---|
| Driver | Permanent population density | People/km2 | - | 1 |
| Precipitation | mm | + | 2 | |
| Engel’s coefficient | % | + | 3 | |
| Per capita GDP | Yuan | + | 4 | |
| Rate of urbanization | % | + | 5 | |
| Pressure | Consumption of chemical fertilizer | 104 tons | - | 1 |
| Volume of discharged ammonia nitrogen | 104 tons | - | 2 | |
| Volume of the COD emission | 104 tons | - | 3 | |
| Irrigated area | 103 hectares | - | 4 | |
| Potential evapotranspiration | mm | - | 5 | |
| Total annual water consumption | 108 m3 | - | 6 | |
| Water consumption per 10,000 Yuan GDP | m3 | - | 7 | |
| Population of water consumption | 104 people | - | 8 | |
| Volume of discharged wastewater | 104 m3 | - | 9 | |
| State | Ratio of river length with water reaching water quality standard to total evaluated river length | % | + | 1 |
| Volume of surface water resources | 108 m3 | + | 2 | |
| Ratio of reservoir storage capacity meeting acceptable water quality standards to gross reservoir capacity | % | + | 3 | |
| Volume of groundwater resources | 108 m3 | + | 4 | |
| Groundwater depth in plain area | m | + | 5 | |
| Water footprint of crops | m3/ton | + | 6 | |
| Ratio of lake area meeting acceptable water quality standards to total evaluated river area | % | + | 7 | |
| Impact | Water transported from the South-to-North Water Diversion Project | 108 m3 | + | 1 |
| Quantity of available blue water | 108 m3 | + | 2 | |
| Outflow of water | 108 m3 | + | 3 | |
| Gray water footprint | 109 m3 | - | 4 | |
| Per capita water resource | m3/person | + | 5 | |
| Response | Permanent migrant population | 104 people | - | 1 |
| Sewage treatment capacity | 104 m3/day | + | 2 | |
| Tertiary industry as % of GDP | % | + | 3 | |
| Investment of water infrastructure construction | 108 Yuan | + | 4 | |
| Ecological and environmental water supplement | 108 m3 | + | 5 | |
| Water saved | 104 m3 | + | 6 | |
| Rate of reused water from industry above designated size | % | + | 7 | |
| Comprehensive utilization capacity of rain | 104 m3 | + | 8 | |
| Decrease rate of water consumption per 10,000 Yuan GDP | % | + | 9 | |
| Volume of reclaimed water | 104 m3 | + | 10 | |
| Water efficiency of irrigation | - | + | 11 | |
| Soil and water erosion-controlled area | 103 hectares | + | 12 | |
| Urban green coverage | % | + | 13 |
© 2020 by the authors. Licensee MDPI, Basel, Switzerland. This article is an open access article distributed under the terms and conditions of the Creative Commons Attribution (CC BY) license (http://creativecommons.org/licenses/by/4.0/).
Share and Cite
MDPI and ACS Style
Yu, H.; Yang, Z.; Li, B. Sustainability Assessment of Water Resources in Beijing. Water 2020, 12, 1999. https://doi.org/10.3390/w12071999
AMA Style
Yu H, Yang Z, Li B. Sustainability Assessment of Water Resources in Beijing. Water. 2020; 12(7):1999. https://doi.org/10.3390/w12071999
Chicago/Turabian StyleYu, Haijiao, Zihan Yang, and Bo Li. 2020. "Sustainability Assessment of Water Resources in Beijing" Water 12, no. 7: 1999. https://doi.org/10.3390/w12071999
Note that from the first issue of 2016, this journal uses article numbers instead of page numbers. See further details here.