Article

Spatial and Temporal Dynamics of Water Hyacinth and Its Linkage with Lake-Level Fluctuation: Lake Tana, a Sub-Humid Region of the Ethiopian Highlands

1
Faculty of Civil and Water Resources Engineering, Bahir Dar Institute of Technology, Bahir Dar University, Bahir Dar Box 26, Ethiopia
2
Texas A&M AgriLife Research, Temple, TX 76502, USA
3
Amhara Design and Supervision Works Enterprise (ADSWE), Bahir Dar P.O. Box 1921, Ethiopia
4
Department of Earth & Environment, Florida International University, Miami, FL 33199, USA
*
Author to whom correspondence should be addressed.
Water 2020, 12(5), 1435; https://doi.org/10.3390/w12051435
Submission received: 14 April 2020 / Revised: 11 May 2020 / Accepted: 13 May 2020 / Published: 18 May 2020
(This article belongs to the Special Issue Lake Ecology and Restoration)

Abstract

:
Water hyacinth originated from the Amazon Basin and has expanded to other parts of the world since the 1800s. In Ethiopia, the weed is affecting the socio-economic activities of the people whose livelihood is directly or indirectly dependent on Lake Tana. Still, the area covered by water hyacinth and the impact of water level fluctuation on the expansion of water hyacinth has not been known clearly. Therefore, the main objective of this study was to determine the spatiotemporal distribution of water hyacinth and relation with lake-level fluctuation. The area covered by water hyacinth was determined using monthly Sentinel-2 images, which were collected from November 2015 to December 2019. The impact of water level fluctuation on the expansion of water hyacinth was evaluated using hourly water level data converted to a monthly average to correlate with the area covered by the water hyacinth. In addition, MOD13Q1.006 data was used to evaluate the trend of the Normalized Difference Vegetation Index (NDVI) and its linkage with the weed. The maximum areas covered by water hyacinth were 278.3, 613.6, 1108.7, 2036.5, and 2504.5 ha in Feb 2015, October 2016, September 2017, December 2018, and in December 2019, respectively. Its areal coverage was declining from the northern corridors and increasing in eastern shores of the lake. The lake-level fluctuation was observed in the range of 1.5 to 3.98 m in this study. The annual mean maximum spatial values of the NDVI were in the range of 0.27 and 0.47. The area covered by water hyacinth was increasing significantly (P < 0.05) and positively correlated with the seasonal lake-level fluctuation. High water level enabled the expansion of the weed by extending its suitable habitat of shallow water to the flood plain. Based on the results of this study, lake-level fluctuations can have an adverse impact on the expansion of the weed.

1. Introduction

Water hyacinth (Eichhornia crassipes [Mart.] Solms) originated from the Amazon Basin, South America. The species of this invasive weed was discovered by a German Naturalist, C. Von Martius, who was studying the flora of Brazil in 1823–1824. The weed has spread in large areas of the world since the 1800s [1,2,3]. It is one of the world’s worst invasive weeds, categorized as one of the hundred most harmful invasive species, and one of the top ten worst weed in the globe [2,4,5,6,7].
The most suitable environment for the growth of water hyacinth ranges from tropical desert to subtropical or warm temperate desert to rainforest zones [8,9]. The expansion rate of water hyacinth is very quick and its eradication is very difficult since it can double its biomass every 5 days. In addition, its seeds can germinate after remaining for 20 years or more buried in muds or sand deposits in the shore of water bodies without decaying [4,10]. Due to its increasing mesophyll conductance, soluble protein content per unit area, and specific leaf weight, water hyacinth has a maximum photosynthetic capacity [11].
Water hyacinth has several impacts on the socio-economic, livelihood of communities and the aquatic environment [12,13,14,15,16,17]. It affects the productivity of zooplankton and phytoplankton and causes aquatic hypoxia (deficiency of oxygen) [18]. Its impact on the hydrologic cycle is through evapotranspiration [19], as the rate of evapotranspiration of water hyacinth is higher than the evaporation of open water surface areas [19,20] but the rate of evapotranspiration in wetlands is almost similar to open water surface [21]. Water hyacinth can severely affect the habitat of fishes due to deoxygenation. The weed can also reduce the concentration of nitrogen, phosphorus, heavy metals, and other contaminants in water bodies [7,22,23].
In Ethiopia, water hyacinth was first introduced as an ornamental plant around Aba-Samuel Dam in 1965 [24,25]. Its rapid spread in Awash River, Abay River, Baro-Akobo River, and Rift Valley basin has become a serious problem for water resource management [25,26]. To date, water hyacinth has reached the entire Ethiopian Rift Valley system and is associated with a decline of macrophyte biodiversity [27]. It is affecting human health, lake water quantity and quality, fishing, irrigation, navigation, livestock and aquatic biodiversity in Ethiopia [24,26,28,29,30,31]. Although the source and the exact time of its appearance in Lake Tana is not exactly known, water hyacinth was officially recognized as an invasive species by a group of experts of Bahir Dar University in September 2011 [32]. The weed impacts the fishing, transportation, tourism, agriculture, water quality and quantity, and animal grazing in the floodplains which is connected to the lakeshore [33,34,35,36,37,38,39,40]. The invasive weed has been expanding quickly in the north, northeast, and east shore of Lake Tana [40,41]. In Lake Tana, the growth of the invasive weed is highly favored by suitable environmental and water quality conditions [40,41]. According to Dersseh et al. [40], the major growth factors, such as temperature, pH, salinity, total phosphorus, total nitrogen, and the depth of the lake, have been found in optimal conditions for the growth and expansion of water hyacinth.
Lakes connected to rivers have a long inundation period and the morphology of water hyacinth responds to the annual lake-level fluctuations [42]. Previous studies showed that the water level of Lake Tana fluctuates annually and seasonally in relation to changes in precipitation and inflows from the tributary rivers [43]. A previous study [44] showed that the Normalized Difference Vegetation Index (NDVI) of water hyacinth ranges between 0.81 and 0.94 and its value was low in spring (April and May) and rapidly increased after June. NDVI is an index that is dimensionless, developed in the 1970s, and it estimates photosynthetic active biomass based on the difference and sum of reflectance in spectral bands of red and near-infrared (NIR) [44].
The coverage of water hyacinth in Lake Tana has not been known clearly through scientific methods and techniques. The reporting of the invaded area has been the source of conflict among stakeholders [40]. Previous surveying reports showed that the coverage of the invasive weed was in the range of 20,000 and 50,000 ha [45]. To monitor, evaluate and map the current invaded area, Geographic Positioning System (GPS) tracking techniques and ArcGIS tools were employed, from 4–14 Oct 2018 and found to be 2279.4 ha excluding the invaded areas of the flood plain [40]. The main challenges in the estimation of the invaded area of the lake are the weed’s dynamic nature and its quick mobility, similar leaf characteristics with a few other aquatic vegetations and its scattered nature on large areas of the lake, which limits the use of satellite imageries with coarse spatial and spectral resolutions.
The application of remote sensing with high spatial and spectral resolution imageries and ArcGIS tools have been found to be crucial in resolving the above problems [18,46,47,48,49]. Different previous studies have been conducted in the use of multispectral remote sensing data in identifying invasive alien plant species [50,51,52,53]. Although the application of multispectral remote sensing is vital in identifying the invasive alien species including water hyacinth, the cost of acquisition for commercial sensors is a great challenge for sub-Saharan African countries [49,54]. Only very few studies have been done and checked the detection and discrimination capacity of LandSat8 satellite data [49,55,56]. The classification of water hyacinth using huge satellite images in ArcGIS is not easy because of the long-time data collection process, slow computer processing capacity, and the need for highly skilled specialists. To resolve these problems, employing the application of the Google Earth Engine platform is a simple solution, and it has been employed in several studies [57,58,59,60,61,62].
The specific objectives of this study were to (1) map and analyze the spatiotemporal dynamics of water hyacinth in Lake Tana (2015–2019), (2) examine the linkage between the invaded areas of the lake and the lake hydrology (water level), and (3) investigate the temporal linkage of NDVI and the area covered by water hyacinth. Therefore, the study will contribute to the estimation of the invaded area through the application of multispectral satellite data in the Google Earth Engine platform. It will also assist the effort of monitoring and evaluation of the seasonal status of the invasive weed over the lake. Finally, it will help the government and stakeholders to employ strategies to limit water hyacinth expansion through the management of the lake level.

2. Materials and Methods

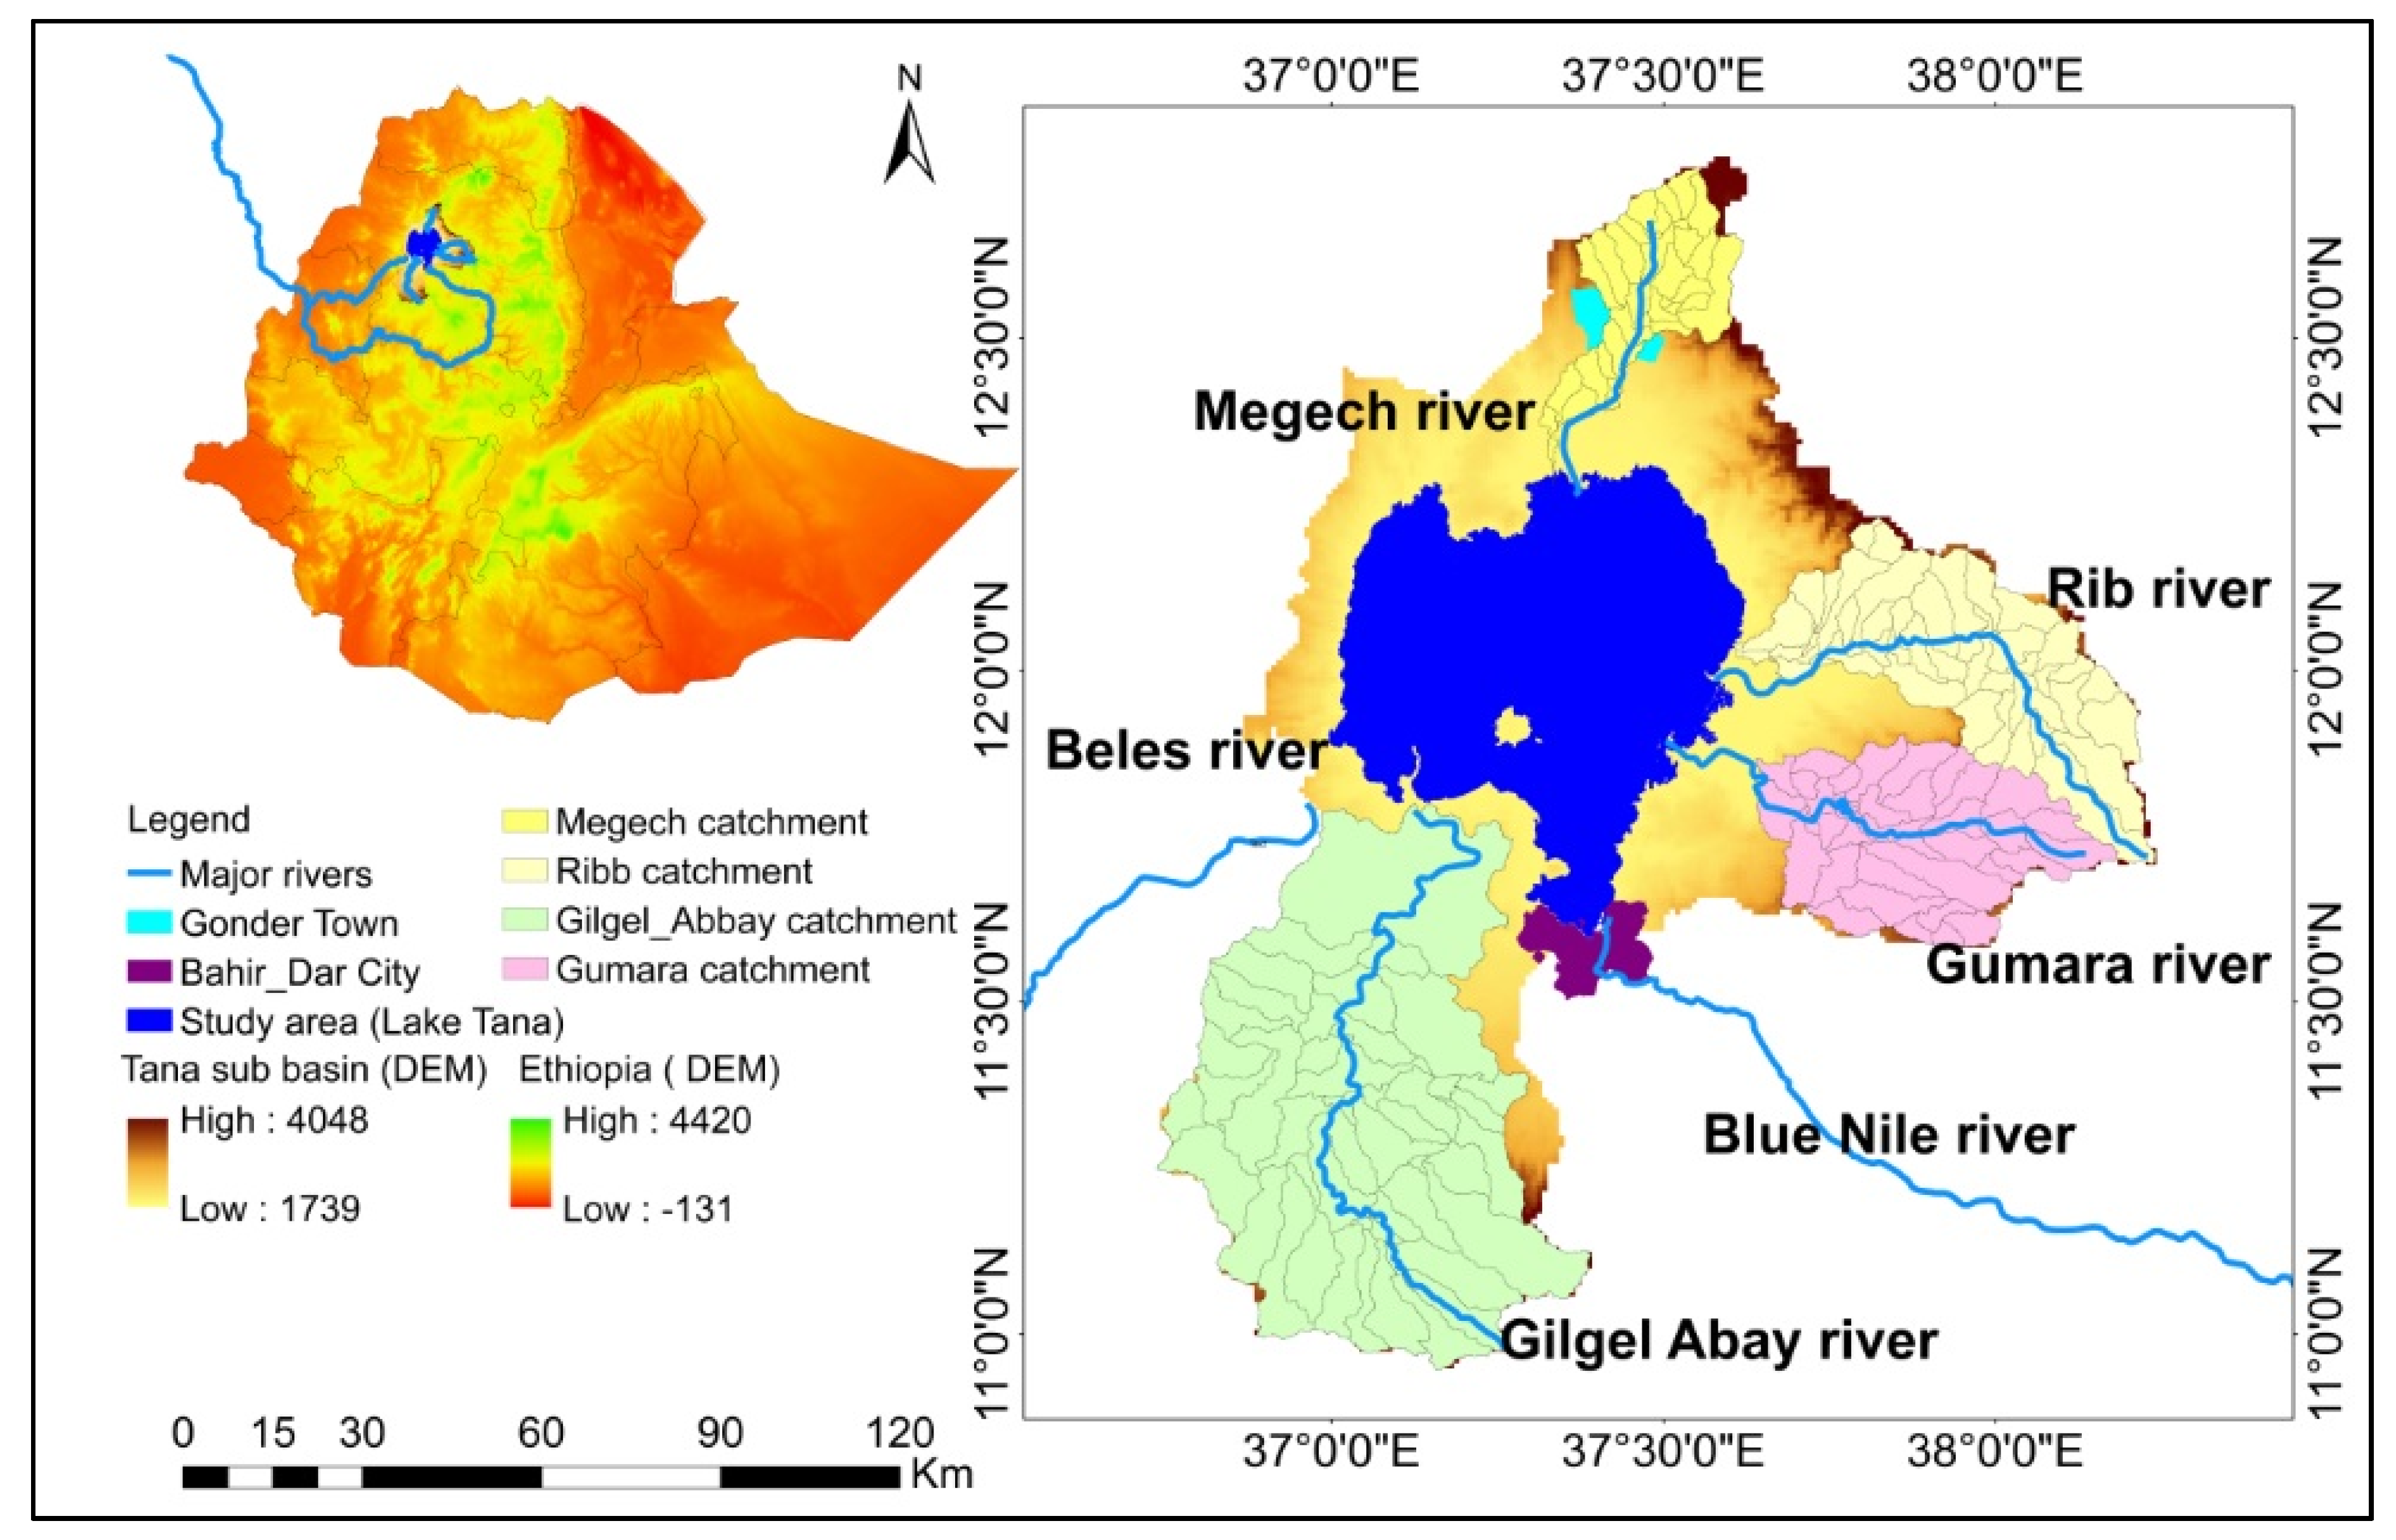
2.1. Study Area Description

Lake Tana is found in northwestern Ethiopia, with the average elevation of 1786 meters above means sea level (m a.s.l.). Geographically, it is located in the range of 10°45′54.1″ N, 36°10′24.9″ E and 12°50′15.9″ N, 38°50′54.48″ E (Figure 1) [40]. It is the largest lake in Ethiopia and the third largest lake in the Nile Basin with an estimated area of 3156 km2 and a total drainage area of 15,000 km2 [63]. The lake occupies a large depression in the north-central plateau of Amhara with a maximum and average depth of 14 and 9 m, respectively. The shallow part of the Lake Tana is mainly found in its northeast corner and eastern shore [40,64]. The lake has 84 to 92 km of length from north to south and is 66 km wide from east to west [40,63,65]. It has 37 islands and most of them have monasteries with historical, cultural, and religious sites that have tourist attraction values [66,67].
In Lake Tana, more than 50 macrophytes, 85 phytoplankton, and 25 zooplankton species are registered [68]. More than 40 seasonal rivers and four permanent major rivers such as Gilgel Abay (Little Blue Nile), Gumara, Rib and Megech from their watersheds drain into the lake, contributing 95% of surface water flow to the lake [63,65,66]. The sediment budgets of Gilgel Abay, Gumara, Rib and Megech rivers are 14.3 Mt. yr−1, 8.2 Mt. yr−1, 3.9 Mt. yr−1, and 0.9 Mt. yr−1 respectively [69]. The lake has been listed in the top 250 lake regions of global importance for biodiversity [68]. Previous studies showed that 27 fish species (including 20 endemic species) are found in the lake [66]. The lake contributes water for Tana Beles Integrated Hydropower to generate about 460 MW, which is the largest energy source for the country. Due to its social, cultural, historical, and economic values, the lake is registered as a World Natural Biosphere Reserve heritage by UNESCO in June 2015.
The mean annual rainfall of Lake Tana catchment is estimated at about 1280 mm, mean actual evapotranspiration is about 773 mm, and water yield is estimated at about 392 mm [70]. The annual water inflow to the lake was estimated to be 3843 million m3 yr−1 from rainfall, 3970 million m3 yr−1 from gauged rivers, and 2729 million m3 yr−1 from ungauged rivers [71]. According to [71], the annual evaporation from the lake and annual outflow at the outlet of the Blue Nile River were estimated as 5182.5 million and 4714 million m3 yr−1, respectively. A suitable area for the growth and expansion of water hyacinth based on six major factors has been estimated in the range of 21,000 and 30,000 ha. [40].

2.2. Dataset and Data Collection Methods

2.2.1. Sentinel-2 MSI-Level 1C Top-of-Atmosphere Reflectance

To determine the area of the lake covered by water hyacinth, monthly Sentinel-2 images with a 10 m spatial resolution have been collected starting from November 2015 to December 2019 by employing the Google Earth Engine platform with a simple JavaScript code writing. The radiometric and geometric correction of images is critical for the aquatic science application [54,72]. Sentinel-2 MSI-level 1C top-of-atmosphere reflectance has been employed for the water hyacinth classification because top-of-atmosphere (TOA) reflectance products have been orthorectified, and radiometrically and geometrically calibrated [54,73]. It is available to the scientific community with granules size of 100 by 100 km, tile format, termed as Level-1C (L1C) products [54,74]. Sentinel-2 data are acquired on 13 spectral bands in the VNIR and SWIR: four bands at 10 m: 490 nm (B2), 560 nm (B3), 665 nm (B4), 842 nm (B8), six bands at 20 m: 705 nm (B5), 740 nm (B6), 783 nm (B7), 865 nm (B8a), 1610 nm (B11), 2190 nm (B12) and three bands at 60 m: 443 nm (B1), 945 nm (B9) and 1375 nm (B10). Radiometric resolution is the capacity of the instrument to distinguish differences in light intensity or reflectance.
The classification of images was done using four classes in the dry season (January to April) and the pre-rainy season (May and June) (water, water hyacinth, other vegetation, and bare lands) and three classes in the rainy season (July, August) and post-rainy season (September, October, November, and December) (water, water hyacinth, other vegetation). The water class includes both turbid and clear water. The other vegetation class includes all vegetation except water hyacinth and bare land includes sediment deposition, cultivated land and any rocky land surfaces. The main focus of this study was to estimate the area of the lake covered by water hyacinth in each given month. The main challenge was getting cloud-free imagery in 2016 (July and August), 2017 (June), 2018 (July) and 2019 (June), and, as the result, these months were not considered during our classification. To evaluate the rate of expansion of water hyacinth, especially the maximum annual expansion rate, a simple calculation was made by considering the areal coverages of the current and the previous year. The classification was focused only on the lake and it did not include the water hyacinth in the flood plain and the surrounding wetlands. The annual expansion rate of the water hyacinth was calculated by comparing the maximum water hyacinth coverage of successive years for example for 2016:
M a x   a r e a   o f   W H   i n   2016 M a x   a r e a   o f   W H   i n   2015 M a x   a r e a   o f   W H   i n   2015 100 % = 120.5 %
Accuracy assessment was done using the Random Forest algorithm. The classification accuracy assessment is critical to evaluate the misclassification and correct classification errors [75]. The total training points were 294 to classify the image. To evaluate the overall accuracy, the number of pixels was 500,000, and, for validation, the same number of pixels (500,000) was tested. The number of pixels for the entire study area was about 31,100,000.

2.2.2. MOD13Q1.006 Terra Vegetation Indices 16-Day Global 250 m

Vegetation indices are important parameters to detect Global and regional changes and can be used to compute land cover classifications and vegetation extent [76]. To evaluate the trend of NDVI and its correlation with the trend of the area of the lake covered by water hyacinth, the freely available MOD13Q1.006 Terra Vegetation Indices 16-Day Global 250 m data with a spatial resolution of 250 m and temporal frequency of 16-day composite [77,78] was used. The MODIS NDVI products are computed from atmospherically rectified bi-directional surface reflectance that has been corrected for water, clouds, overwhelming pressurized canned products, and cloud shadows. [77]. The Moderate Resolution Imaging Spectroradiometer (MODIS-TERRA) dataset (250–1000 m resolution) starting from 2000 to present is better quality but provides shorter NDVI time series than the others [79]. For this study, images from 2011–2019 were processed.

2.2.3. Lake-Level Data

To evaluate the impact of lake-level fluctuation on the expansion of water hyacinth on Lake Tana condition, hourly lake-level data were collected starting from May 2016 to September 2019 from the Tana Sub-basin Organization (TaSBo).

2.3. Data Analysis

The classification and image analysis of the area of the lake was done in the Google Earth Engine platform by writing a simple JavaScript code. In this platform, time-series images that are collected from Sentinel-2 satellite were classified using a supervised classification technique. To calculate the water hyacinth covered areas, the classified images in each month in the Google Earth Engine (GEE) platform were processed in the spatial analyst tool (extraction) and Conversion tools (from raster to polyline) of ArcGIS software. The estimated values have been analyzed by using descriptive and analytical statistical tools. The actual coverage of water hyacinth was estimated in a survey done from 4–14 October 2018, the water-hyacinth-invaded area was estimated as 2279.4 ha of the lake, excluding the infestation area in the flood plain [40].
The computation of the NDVI in the GEE platform is based on the following equation:
NDVI = ρ NIR ρ RED ρ NIR + ρ RED
where ρ NIR   and   ρ RED are the surface bidirectional reflectance factors for MODIS red (648 nm) and infrared (858 nm) bands, respectively [80].
Lake-level fluctuation and the NDVI were analyzed using descriptive statistics. The final task was looking at the correlation among the invaded area, non-invaded area, lake level, and NDVI. Analytical statistics was used to evaluate this correlation. The other important thing in this study was to evaluate the trend of the area of the lake covered by water hyacinth. Therefore, the Mann–Kendall trend test was used because it is a preferable and widely used statistical method for non-parametric tests to detect the trend of time series results [81].

3. Results and Discussion

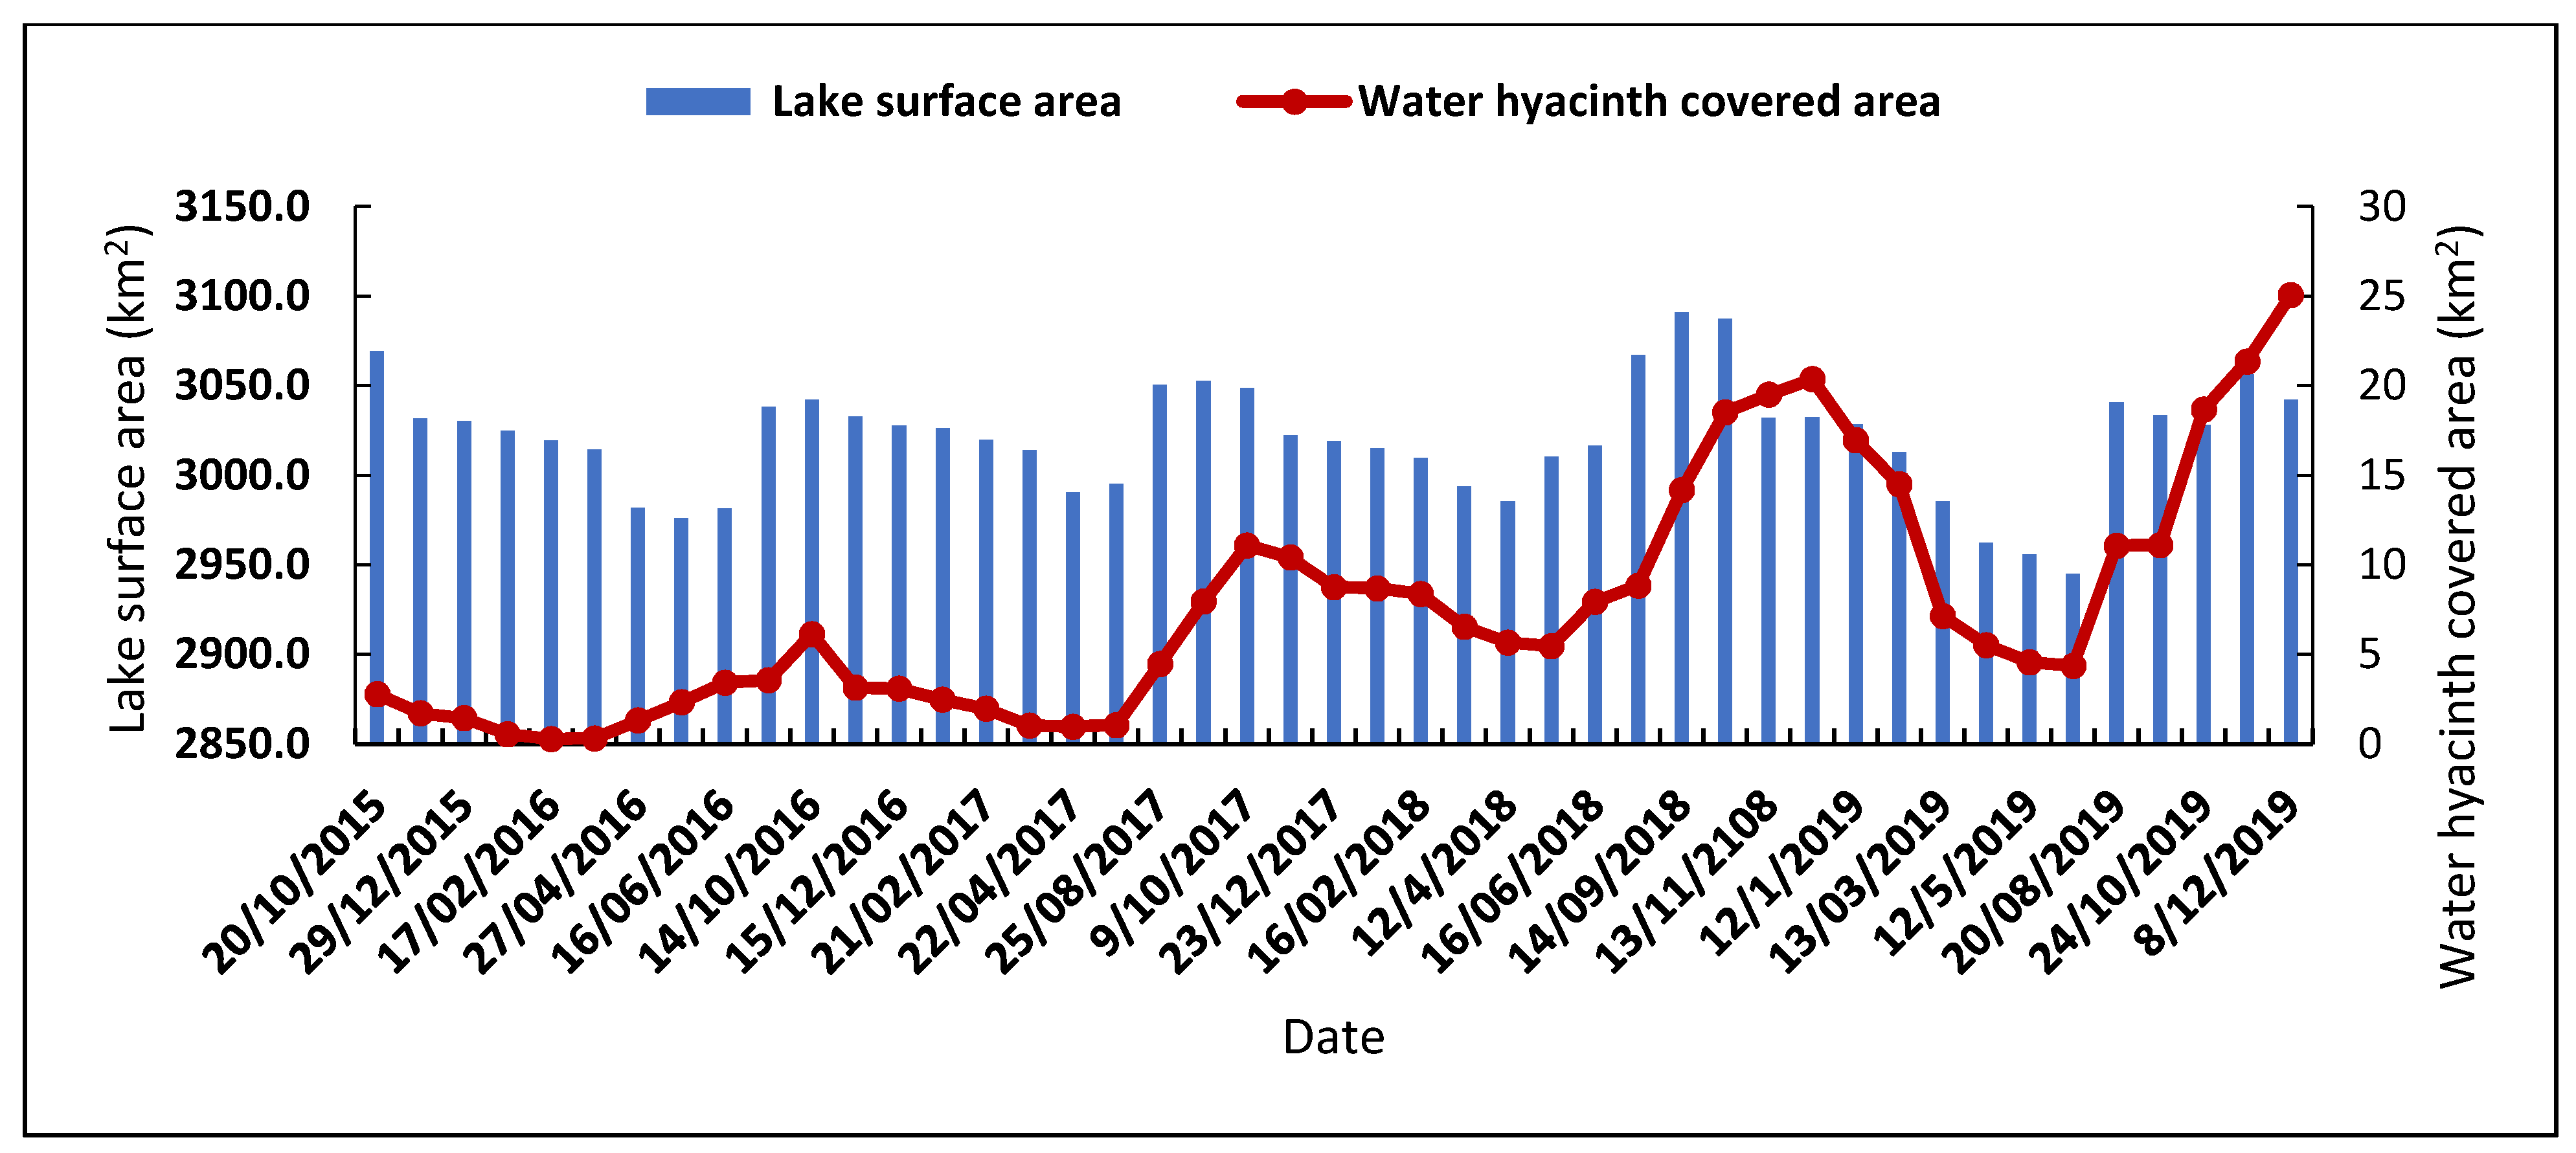
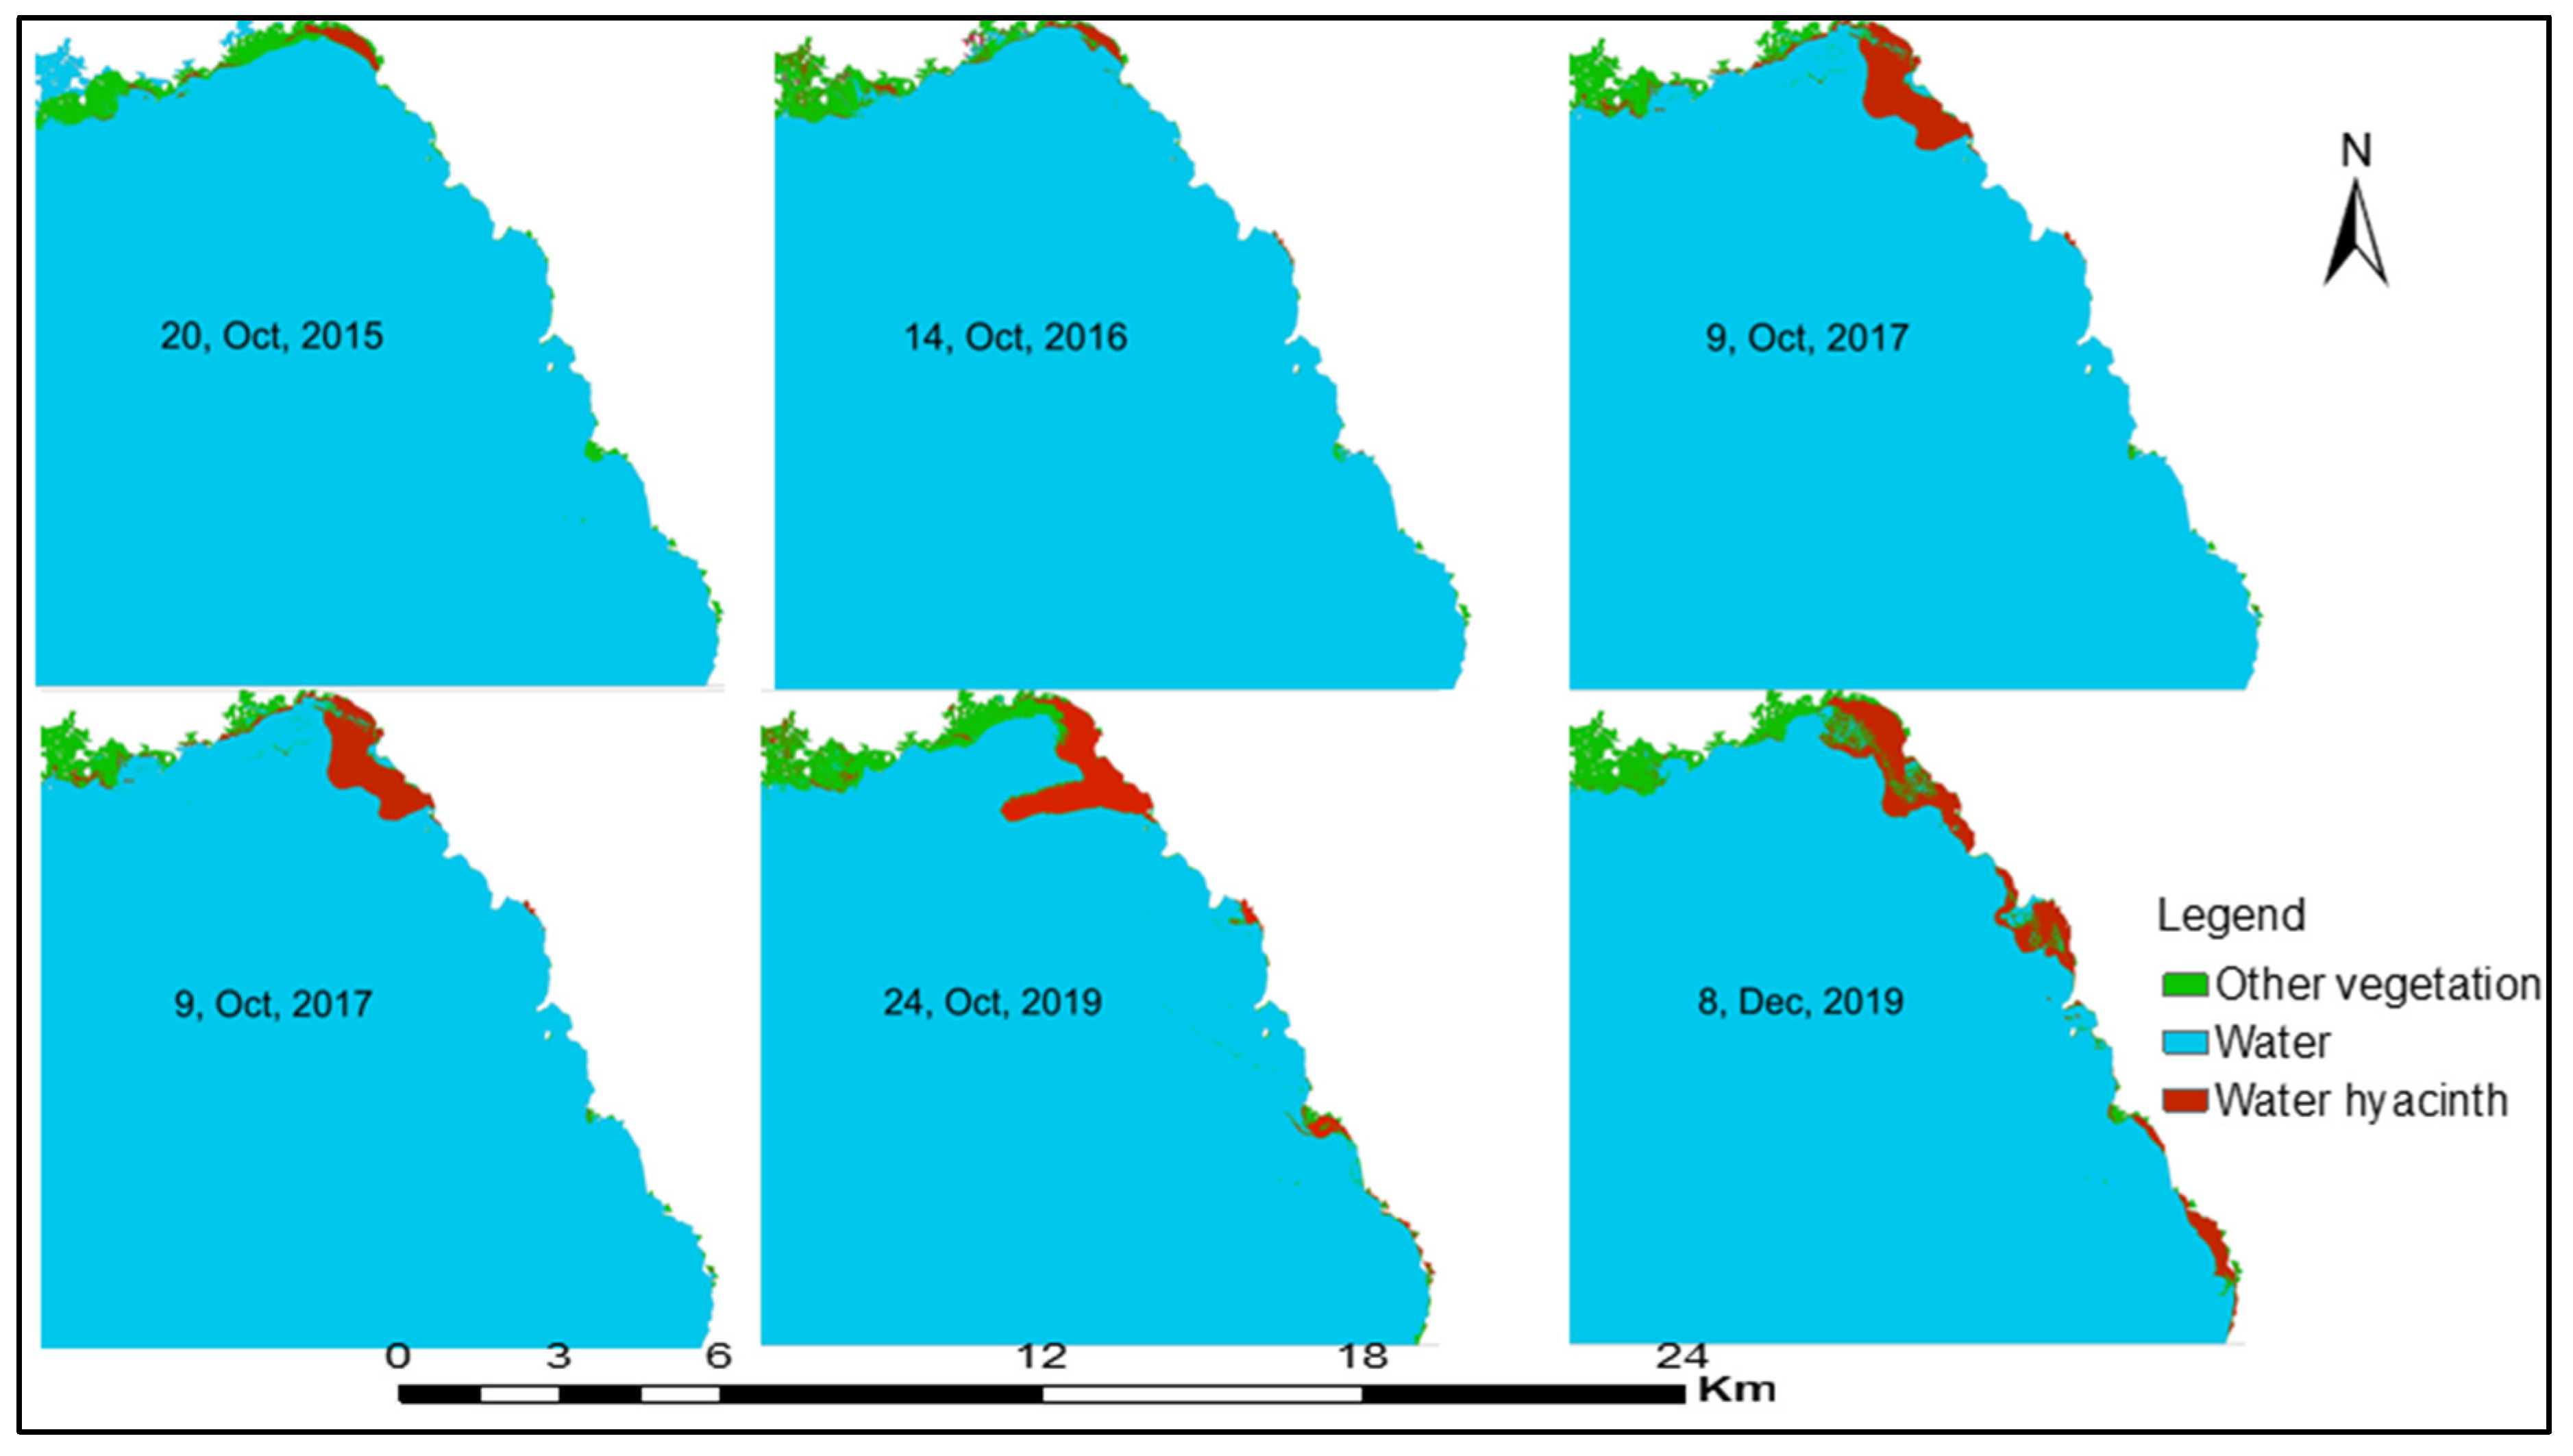
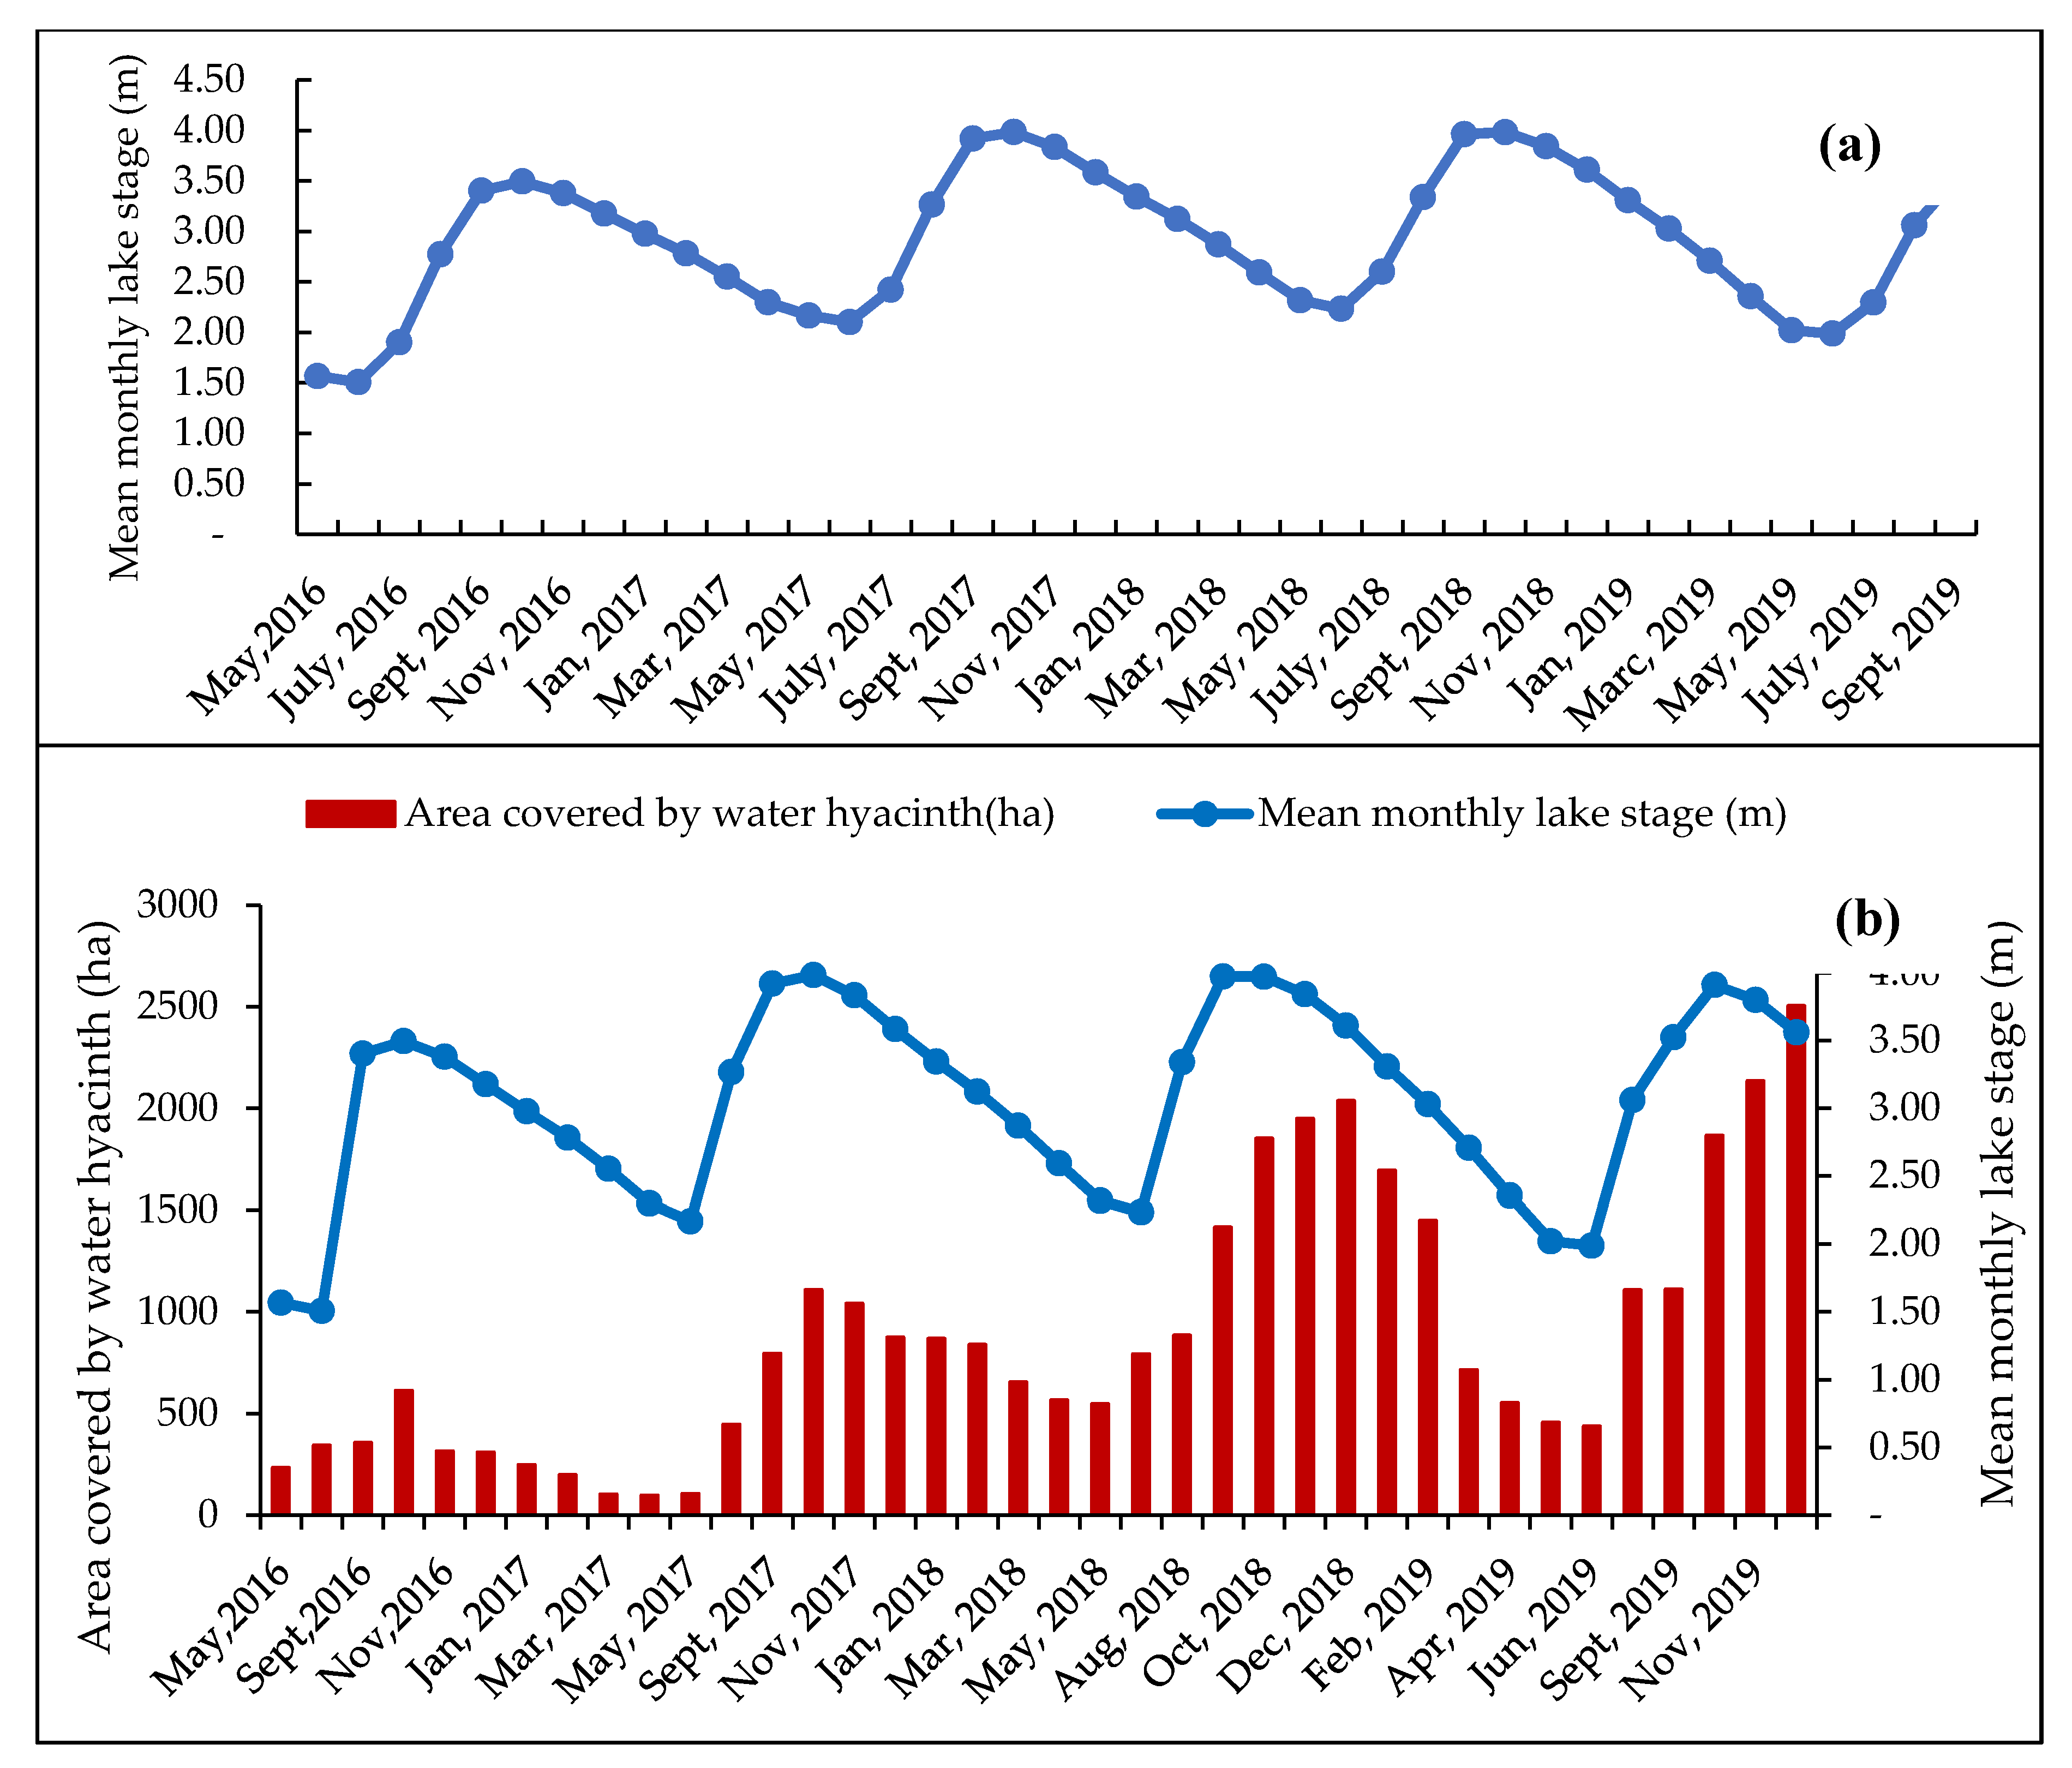
3.1. Water Hyacinth Areal Coverage

The annual maximum areal coverages of the water hyacinth were 278.3, 613.6, 1108.7, 2036.5, and 2504.5 ha in February 2015, October 2016, September 2017, December 2018, and in December 2019, respectively (Table 1). The annual minimum areal coverage of the water hyacinth was 28.1, 97.3, 546.6, and 436.7 ha in February 2016, April 2017, May 2018, and June 2019, respectively (Table 1). There is an increasing trend in the maximum areal coverage in all the study years and minimum areal coverage except in 2019. The image classification accuracy was evaluated and found in the range of 95% to 100%.
The annual rate of expansion of the water hyacinth was computed by comparing successive years. Table 1 showed that the annual expansion rates of the invasive weed were 120.5%, 80.7%, 83.7%, and 23% in 2016, 2017, 2018, and 2019, respectively. The minimum lake surface areas, which include the lake area covered by water hyacinth and water, were 2976.1 ha, 2990.4 ha, 2985.3 ha and 2945 ha in May 2016, April 2017, April 2018 and June 2019, respectively. The maximum lake surface areas were 3069.3 ha, 3042.1 ha, 3052.6ha, 3090.8 ha, and 3056.3 ha in October 2015, October 2016, September 2017, September 2018, and November 2019, respectively. The annual expansion rate in 2019 was not as high as in 2016, 2017 or 2018, which means the rate of expansion of the invasive weed was decreasing. The brownish color in the dry season photo (Figure 2a) affected the classification accuracy since the classifier considered this as not water hyacinth covered. In the dry season, especially from February to April, the weed leaves the lake and goes to the outlets of the rivers or streams (Figure 2b). The reason for the low expansion rate in 2019 was due to intensive water hyacinth removal campaigns by the government and people but poor disposal of collected/harvested water hyacinth (Figure 2c) resulted in poor detection of the water hyacinth from the images. The color of the leaves of the weed changed to evergreen at the end of the rainy season (Figure 2d).
The area covered by water hyacinth and the lake surface area was positively correlated with Pearson’s correlation coefficient (r) of 0.41, which indicates a positive correlation between the water-hyacinth-covered area and lake surface area. According to the Mann–Kendall trend test analysis (P < 0.05), the area covered by water hyacinth has been increasing significantly, whereas the lake surface area has been decreasing insignificantly (Figure 3).
The government and the community have tried to remove the invasive weed since 2012 by employing manual and mechanical removal methods, but the expansion rate of the invasive weed has been becoming severe from time to time and affecting the livelihood of the people by invading rice farmlands, free-grazing lands, boat transporting and fishing activities. The reason for high growth and annual expansion rate of the invasive weed is due to the conducive environment for the weed. Factors such as the levels of total nitrogen, total phosphorus, pH, salinity, temperature, and depth were suitable for the expansion of the weed [40]. Previous studies showed that sunlight and air temperature have a substantial impact on the growth of water hyacinth by affecting the nutrient uptake rate of the weed [82,83]. Even though further study is required, one of the reasons for the high expansion of water hyacinth from September to December might be a suitable condition in terms of the sunlight of the surrounding environment, which facilitates its photosynthesis process.
The spatial distribution of water hyacinth has been substantial on the northeastern and eastern shore of the lake (Figure 4). This result is in line with a recent vulnerability potential assessment study that showed that these shores are suitable for water hyacinth growth in terms of nutrients (total phosphorus and total nitrogen) [40]. At the beginning of the study period, it was restricted in the northeastern corridors of the lake but later it has been decreasing in the north shore and severely spreading to the eastern and southeastern shore of the lake which is characterized by large watersheds and flood plain. The reason for the expansion of the weed to the north-eastern and eastern shore of the lake is that, when the lake level increases in the rainy and post-rainy seasons, water hyacinth will expand to the shallow water section of the flood plain. Previous studies showed that water hyacinth has a nutrient removal potential in static and flowing water bodies [84,85,86,87,88]. This potential helped the weed to expand to the shallow nutrient reach section of the flood plain and further pose environmental problems to the seasonally flooded agricultural areas of the lake shore.

3.2. Lake-Level Fluctuation

Previous studies showed that the fluctuation of water level in shallow lakes can affect the function of a lacustrine ecosystem [89]. Lake water level can be fluctuated due to overexploitation of water bodies by humans, climatic and hydrological conditions of lake water bodies [90]. The water level of Lake Tana has been fluctuating and began declining from 1985 to 2006 [91]. The lake-level fluctuation of Lake Tana is not sensitive to rainfall fluctuation [63]. Chara-Chara weir which was constructed at the outlet of the Blue Nile for the purpose of hydroelectric generation, regulates the flow and hence the lake level. The lake level increases at the end of the rainy season and decline at the end of the dry season. To check its fluctuation, the current hourly lake-level data from Tana Sub Basin Office, which was measured at Bahir Dar Station, was analyzed. To compare the lake-level result with the water hyacinth infestation area, the mean monthly values from May 2016 to September 2019 (Figure 5a) were computed. This comparison could not consider all the results of the water hyacinth infestation area due to the lack of time series lake-level data from 2015 to 2019 in all months.
The maximum and the minimum mean monthly lake levels were observed in October, and May to June, respectively (Figure 5b). The result of this study indicated that the expansion of water hyacinth and the lake level had a strong positive correlation coefficient (r) of 0.69. According to this result, lake-level fluctuation affects the expansion of water hyacinth on Lake Tana. If the lake level increases, the lake water expands to the flood plain, which is the most suitable area for the growth and expansion of water hyacinth because of the lake water in the flood plain is too shallow and rich in sediment deposit.

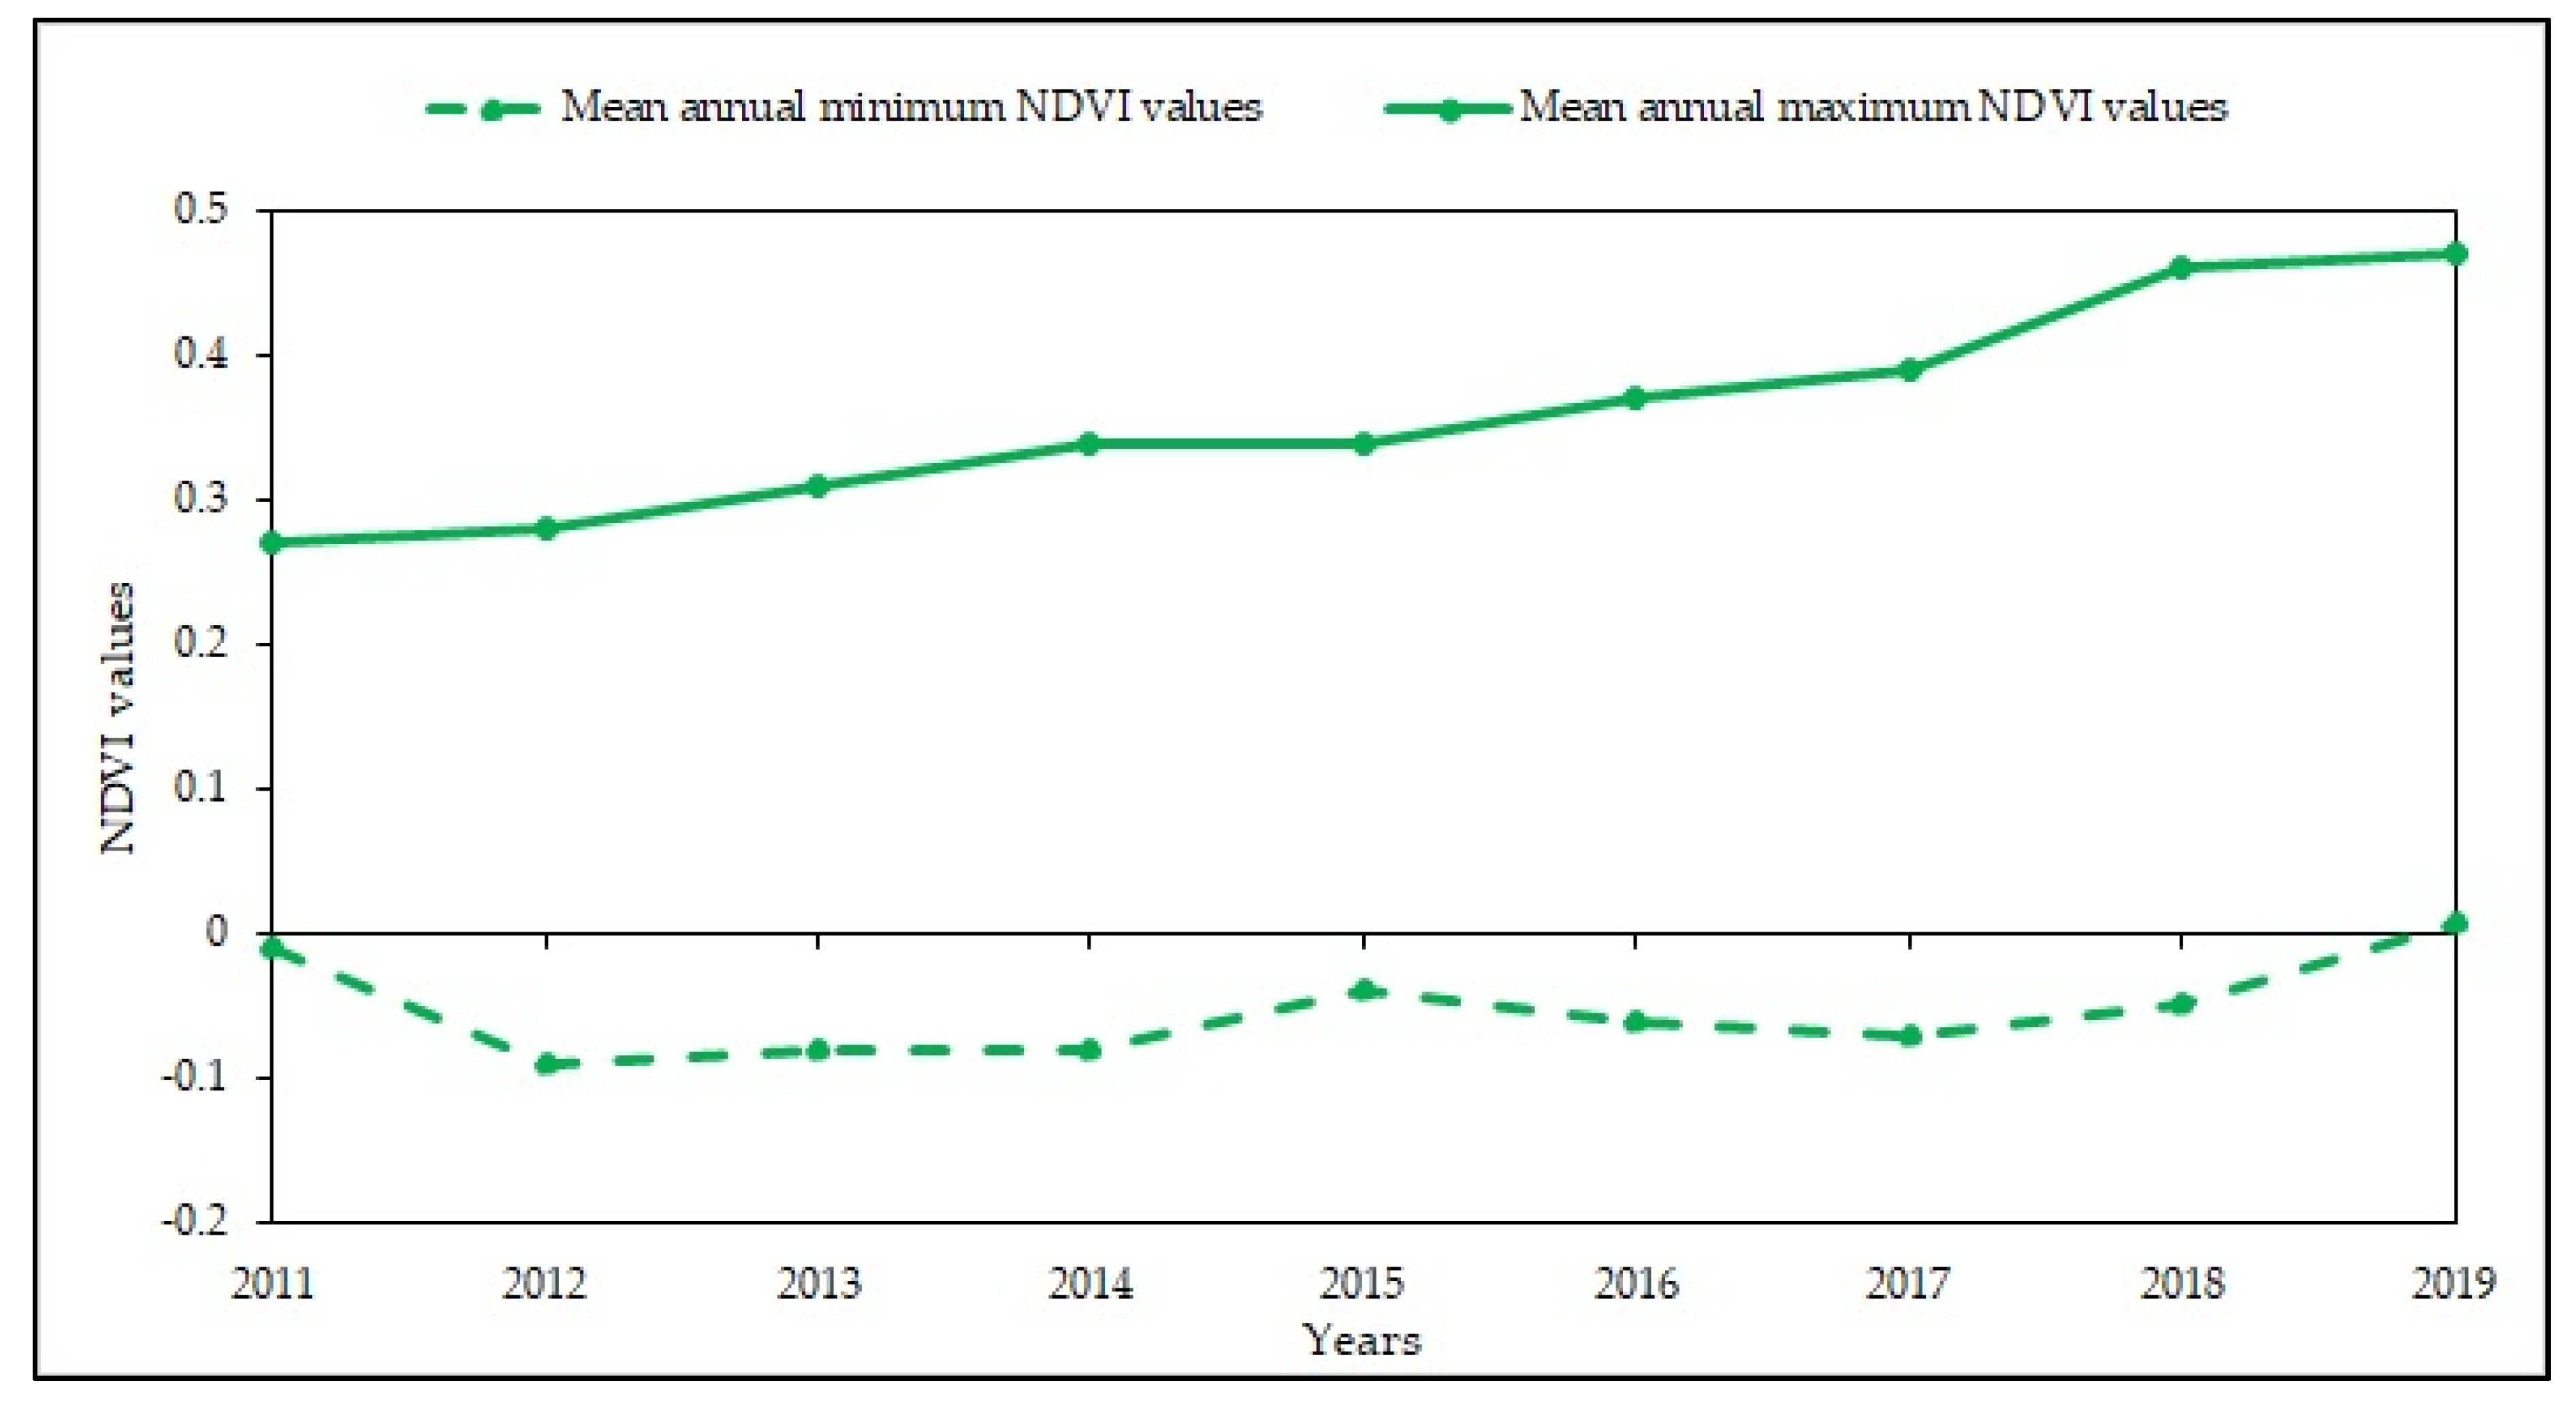
3.3. Normalized Difference Vegetation Indices (NDVI)

Previous studies showed that NDVI has a strong positive correlation with the concentration of total phosphorus (TP) and total nitrogen (TN) in shallow lakes [92]. Nutrients like total phosphorus (TP) and total nitrogen (TN) are the most important factors for the eutrophication process of water bodies, including lakes [64]. The NDVI is an indicator of the biomass of any surfaces (land and water) and is seasonally variable [93,94]. The aim of evaluating the NDVI of Lake Tana was to see its trend and seasonal variability in relation to the expansion of water hyacinth on the lake.
The minimum values of NDVI have been observed in July in all the study years (2011–2019). From the results described in part 3.1, the water hyacinth covered area in this month was also negligible which was proved through remote sensing application and intensive field survey all over the lake. The reason for low NDVI could be the exitance of clear water which is free from phytoplankton and macrophytes in the lake and similar studies showed the same results as the result of this study [95]. The maximum NDVI values have been observed from October to December when the water hyacinth infestation has been severing on the lake.
The maximum NDVI values have been increasing significantly, and, at the end of the study year, the increment has been reached at 74% (Figure 6). The trend of NDVI was significantly increasing at (P < 0.05) according to the Mann–Kendall trend analysis test. The NDVI shows an increasing pattern that complements the increasing trend of water hyacinth expansion area on Lake Tana. Even though it needs further study in the future, the increment of the vegetation index might be due to the expansion of water hyacinth in the lake and it shows that the lake has been polluting and eutrophic.

4. Conclusions

The Google Earth Engine platform application has been found as the simplest way to collect geometrically and radiometrically corrected imageries and to classify water surface covers through time series imageries. Even though the government and the community have spent a considerable amount of time removing the invasive weed mechanically and manually over a long period of time, the invasive weed has been increasing significantly. The average annual expansion rate of the weed was approximately double from 2015 to 2019. The maximum infestation area of water hyacinth on the lake was in the range of 278.3 ha and 2504.5 ha from 2015 to 2019. The peak season for water hyacinth expansion on Lake Tana was from the post-rainy season (September to November) to the beginning of the dry season (December). The movement of the weed is very dynamic; it moves quickly on a daily basis by wind. The spatial distribution of the invasive weed has been critical in the northeast and eastern shore of the lake with a new invasion area in the eastern shore of the lake.
The NDVI of Lake Tana has been increasing and it is an indication of the eutrophication status of the lake. The peak season for the NDVI was from November to December when the water hyacinth expansion was highest. The lake level has been fluctuating seasonally and its peak values were observed at the post-rainy season when the area covered by water hyacinth was high.
When the lake level increases, the lake water expands to the flood plain, and, as a result, the invasive weed gets more shallow depth, which is suitable for its growth. Its minimum values were observed at the pre-rainy season in the study years when the expansion of the weed declines. When the lake level decreases, the lake water shrinks and the expansion of the weed will be limited to the shallow areas of the lake, such as the outlets of the rivers and wetlands of the lake shore. Lake level and area covered by water hyacinth had a strong and positive correlation, which indicates that the lake-level fluctuation had a substantial impact on the expansion of water hyacinth on Lake Tana.
According to the result of this study, the expansion of the weed will continue and may cover large area of the lake, unless the government and the community take continuous and intensive integrated control measures. To save the lake from the further invasion by water hyacinth, the government shall apply a preventive strategy on the western and southern shore of the lake and a removal and control strategy in the north and eastern shore of the lake. According to this result, the best controlling season is the post-rainy season, which is before the flowering of the invasive weed. However, in this season, the weed expands severely and its biomass is high so that the removal is laborious. To solve this problem, the most important strategy for controlling the weed shall be removing the weed in the dry season (February to April) when the coverage of the weed is minimum and applying continuous monitoring and evaluation strategy. To minimize the expansion rate, the lake-level fluctuation shall be well managed at the outlet of the Blue Nile in the post-rainy season.

Author Contributions

Conceptualization, M.G.D. and A.M.M; Data curation, M.G.D., W.B.A; Formal analysis, M.G.D.; Investigation, M.G.D.; Methodology, M.G.D., A.W.W, A.M.M; Resources, M.G.D., A.W.W, W.B.A.; Supervision, A.M.M, A.W.W., S.A.T. M.A.M.; Validation, M.G.D.; Writing—original draft, M.G.D.; Writing—review & editing, M.G.D., A.W.W., M.A.M., S.A.T., W.B.A. and A.M.M. and D.A.M. All authors have read and agreed to the published version of the manuscript.

Funding

This research was funded by the International Center for Tropical Agriculture (CIAT) under the International Livestock Research Institute (ILRI) for ground truth data collection, monitoring, and evaluation of the study area.

Acknowledgments

We thank the Tana Sub Basin Office (TaSBO) for giving us additional secondary data. Special thanks are also expressed to the International Center for Tropical Agriculture (CIAT) under the International Livestock Research Institute (ILRI) for its support funding for ground truth data collection and monitoring of the study site.

Conflicts of Interest

The authors declare no conflict of interest.

References

  1. Van Driesche, R. Biological Control of Invasive Plants in the Eastern United States; Forest Service, Forest Health Technology Enterprise Team, US Department of Agriculture: Washington, DC, USA, 2002.
  2. Ruiz Téllez, T.; López, E.; Granado, G.; Pérez, E.; Morán-López, R.; Guzman, J. The water hyacinth, Eichhornia crassipes: an invasive plant in the Guadiana River Basin (Spain). Aquat. Invasions 2008, 3, 42–53. [Google Scholar] [CrossRef]
  3. Hill, M.P.; Olckers, T. Biological control initiatives against water hyacinth in South Africa: constraining factors, success and new courses of action. In ACIAR Proceedings; ACIAR: Carins, Australia, 2000. [Google Scholar]
  4. Patel, S. Threats, management and envisaged utilizations of aquatic weed Eichhornia crassipes: An overview. Rev. Environ. Sci. Bio/Technol. 2012, 11, 249–259. [Google Scholar] [CrossRef]
  5. Shanab, S.M.; Shalaby, E.A.; Lightfoot, D.A.; El-Shemy, H.A. Allelopathic effects of water hyacinth [Eichhornia crassipes]. PLoS ONE 2010, 5, e13200. [Google Scholar] [CrossRef]
  6. Bhattacharya, A.; Haldar, S.; Chatterjee, P.K. Geographical distribution and physiology of water hyacinth (Eichhornia crassipses) the invasive hydrophyte and a biomass for producing xylitol. Int. J. ChemTech Res. 2015, 7, 1849–1861. [Google Scholar]
  7. Villamagna, A.; Murphy, B.J.F.B. Ecological and socio-economic impacts of invasive water hyacinth (Eichhornia crassipes): A review. Freshw. Biol. 2010, 55, 282–298. [Google Scholar] [CrossRef]
  8. Gaikwad, R.P.; Gavande, S. Major factors contributing growth of water hyacinth in natural water bodies. Int. J. Eng. Res. 2017, 6, 304–306. [Google Scholar] [CrossRef]
  9. Charudattan, R.; Labrada, R.; Center, T.D.; Kelly-Begazo, C. Strategies for Water Hyacinth Control. In Report of a Panel of Experts Meeting, 11–14 September, 1995; FAO: Fort Lauderdale, FL, USA, 1996. [Google Scholar]
  10. Frezina, N.C.A. Assessment and utilization of water hyacinth in the water bodies of Tamil Nadu. Int. J. Sci. Res. Rev. 2013, 2, 58–77. [Google Scholar]
  11. Patterson, D.T.; Duke, S.O.J.P.; Physiology, C. Effect of growth irradiance on the maximum photosynthetic capacity of water hyacinth [Eichhornia crassipes (Mart.) Solms]. Plant Cell Physiol. 1979, 20, 177–184. [Google Scholar]
  12. Mailu, A. Preliminary assessment of the social, economic and environmental impacts of water hyacinth in Lake Victoria Basin and status of control. In ACIAR Proceedings 2000; ACIAR: Carins, Australia, 1998. [Google Scholar]
  13. Masifwa, W.F.; Twongo, T.; Denny, P.J.H. The impact of water hyacinth, Eichhornia crassipes (Mart) Solms on the abundance and diversity of aquatic macroinvertebrates along the shores of northern Lake Victoria, Uganda. Hydrobiologia 2001, 452, 79–88. [Google Scholar] [CrossRef]
  14. Brendonck, L.; Maes, J.; Rommens, W.; Dekeza, N.; Nhiwatiwa, T.; Barson, M.; Callebaut, V.; Phiri, C.; Moreau, K.; Gratwicke, B.; et al. The impact of water hyacinth (Eichhornia crassipes) in a eutrophic subtropical impoundment (Lake Chivero, Zimbabwe). II. Species diversity. Archiv für Hydrobiol. 2003, 158, 389–405. [Google Scholar]
  15. De Groote, H.; Ajuonu, O.; Attignon, S.; Djessou, R.; Neuenschwander, P. Economic impact of biological control of water hyacinth in Southern Benin. Ecol. Econ. 2003, 45, 105–117. [Google Scholar] [CrossRef]
  16. Ashton, P.J.; Scott, W.E.; Steyn, D.J.; Wells, R.J. The chemical control programme against the water hyacinth Eichhornia crassipes (Mart.) Solms on Hartbeespoort Dam: Historical and practical aspects. S. Afr. J. Sci. 1979, 75, 303–306. [Google Scholar]
  17. Fernández, O.A.; Sutton, D.L.; Lallana, V.H.; Sabbatini, M.R.; Irigoyen, J.H. Aquatic Weed Problems and Management in South and Central America; FAO; Oxford University Press: Oxford, UK, 1989. [Google Scholar]
  18. Thamaga, K.H.; Dube, T. Remote sensing of invasive water hyacinth (Eichhornia crassipes): A review on applications and challenges. Remote Sens. Appl. Soc. Environ. 2018, 10, 36–46. [Google Scholar] [CrossRef]
  19. Van der Weert, R.; Kamerling, G.E. Evapotranspiration of water hyacinth (Eichhornia crassipes). J. Hydrol. 1974, 22, 201–212. [Google Scholar] [CrossRef]
  20. Timmer, C.E.; Weldon, L.W. Evapotranspiration and pollution of water by water hyacinth. Hyacinth Control J. 1967, 6, 34–37. [Google Scholar]
  21. Abtew, W.; Dessu, S.B. The Grand Ethiopian Renaissance Dam on the Blue Nile; Springer: Berlin/Heidelberg, Germany, 2019. [Google Scholar]
  22. Balirwa, J.-S.; Wanda, F.-M.; Muyodi, F.-J. Impacts of water hyacinth and water quality change on beneficial uses of Lake Victoria, Uganda. In Proceedings of the 13th World Lake Conference, Wuhan, China, 1–5 November 2009. [Google Scholar]
  23. Kateregga, E.; Sterner, T.J.E.I. Indicators for an invasive species: Water hyacinths in Lake Victoria. Ecol. Indic. 2007, 7, 362–370. [Google Scholar] [CrossRef]
  24. Firehun, Y.; Struik, P.C.; Lantinga, E.A.; Taye, T. Water hyacinth in the Rift Valley water bodies of Ethiopia: Its distribution, socio-economic importance and management. Int. J. Curr. Agric. Res. 2014, 3, 67–75. [Google Scholar]
  25. Tegene, S.; Ayele, N. Prevalence and intensity of water hyacinth infestation in the water bodies of Rift Valley, Ethiopia. J. Agric. Nat. Resour. Sci. 2014, 1, 118–126. [Google Scholar]
  26. Yirefu, F.; Tafesse, A.; Gebeyehu, T.; Tessema, T. Distribution, impact and management of water hyacinth at Wonji-Shewa Sugar Factory. J. Adv. Agric. 2007, 1, 41–52. [Google Scholar]
  27. Mengistu, B.B.; Unbushe, D.; Abebe, E. Invasion of Water Hyacinth (Eichhornia crassipes) Is Associated with Decline in Macrophyte Biodiversity in an Ethiopian Rift-Valley Lake—Abaya. Open J. Ecol. 2017, 7, 667. [Google Scholar] [CrossRef] [Green Version]
  28. Ingwani, E.; Gumbo, T.; Gondo, T. The general information about the impact of water hyacinth on Aba Samuel Dam, Addis Ababa, Ethiopia: Implications for ecohydrologists. Ecohydrol. Hydrobiol. 2010, 10, 341–345. [Google Scholar] [CrossRef]
  29. Tessema, T.; Ulrichs, C.; Buettner, C. Invasive Alien Plant Species in Ethiopia: Impacts, Challenges and Responses; Ethiopian Institute of Agricultural Research: Addis Ababa, Ethiopia; Faculty of Agriculture, Humboldt University of Berlin: Berlin, Germany, 2003. [Google Scholar]
  30. Shiferaw, W.; Demissew, S.; Bekele, T. Invasive alien plant species in Ethiopia: Ecological impacts on biodiversity a review paper. Int. J. Mol. Biol. 2018, 3, 169–176. [Google Scholar] [CrossRef] [Green Version]
  31. Tesfahun, A. Review in current problems of Ethiopian fishery: In case of human and natural associated impacts on water bodies. Int. J. Fish. Aquat. Stud 2018, 6, 94–99. [Google Scholar]
  32. Wondie, A.; Seid, A.; Molla, E.; Goshu, G.; Gkidan, W.; Shibabaw, A.; Genanew, M. Preliminary Assessment of Water hyacinth (Eichornia crassipes) in Lake Tana. In Proceedings of the National Workshop (Biological Society of Ethiopia), Addis Ababa, Ethiopia, 2012; Available online: https://scholar.google.com.hk/scholar?hl=zh-CN&as_sdt=0%2C5&q=Preliminary+Assessment+of+Water+hyacinth+%28Eichornia+crassipes%29+in+Lake+Tana&btnG= (accessed on 16 May 2020).
  33. Tewabe, D. Preliminary survey of water hyacinth in Lake Tana, Ethiopia. Glob. J. Allergy 2015, 1, 013–018. [Google Scholar] [CrossRef] [Green Version]
  34. Asmare, E. Current Trend of Water Hyacinth Expansion and Its Consequence on the Fisheries around North Eastern Part of Lake Tana, Ethiopia. J. Biodivers. Endanger. Species 2017, 5, 189. [Google Scholar] [CrossRef]
  35. Tewabe, D.; Asmare, E.; Zelalem, W.; Mohamed, B. Identification of impacts, some biology of water hyacinth (Eichhornia crassipes) and its management options in Lake Tana, Ethiopia. Neth. J. Agric. Sci. 2017, 5, 8–15. [Google Scholar] [CrossRef] [Green Version]
  36. Dejen, E.; Anteneh, W.; Vijverberg, J. The decline of The Lake Tana (Ethiopia) fisheries: Causes and possible solutions. Land Degrad. Dev. 2017, 28, 1842–1851. [Google Scholar] [CrossRef] [Green Version]
  37. Gebremedhin, S.; Getahun, A.; Anteneh, W.; Bruneel, S.; Goethals, P. A drivers-pressure-state-impact-responses framework to support the sustainability of fish and fisheries in Lake Tana, Ethiopia. Sustainability 2018, 10, 2957. [Google Scholar] [CrossRef] [Green Version]
  38. Gezie, A.; Assefa, W.W.; Getnet, B.; Anteneh, W.; Dejen, E.; Mereta, S.T. Potential impacts of water hyacinth invasion and management on water quality and human health in Lake Tana watershed, Northwest Ethiopia. Biol. Invasions 2018, 20, 2517–2534. [Google Scholar] [CrossRef]
  39. Abera, M.J.J.A.R.D. Impact of Water Hyacinth, Eichhornia crassipes (Martius) (Pontederiaceae) in Lake Tana Ethiopia: A Review. J. Aquac. Res. Dev. 2018, 9, 2. [Google Scholar]
  40. Dersseh, M.G.; Kibret, A.A.; Tilahun, S.A.; Worqlul, A.W.; Moges, M.A.; Dagnew, D.C.; Abebe, W.B.; Melesse, A.M. Potential of Water Hyacinth Infestation on Lake Tana, Ethiopia: A Prediction Using a GIS-Based Multi-Criteria Technique. Water 2019, 11, 1921. [Google Scholar] [CrossRef] [Green Version]
  41. Melesse, A.M.; Abtew, W.; Senay, G. Extreme Hydrology and Climate Variability: Monitoring, Modelling, Adaptation and Mitigation; Elsevier: Amsterdam, The Netherlands, 2019. [Google Scholar]
  42. Neiff, J.J.; Casco, S.L.; Poi de Neiff, A. Response of Eichhornia crassipes (Pontederiaceae) to water level fluctuations in two lakes with different connectivity in the Paraná River floodplain. Revista de Biol. Trop. 2008, 56, 613–623. [Google Scholar] [PubMed] [Green Version]
  43. Chebud, Y.A.; Melesse, A.M. Modelling lake stage and water balance of Lake Tana, Ethiopia. Hydrol. Process. Int. J. 2009, 23, 3534–3544. [Google Scholar] [CrossRef]
  44. Robles, W.; Madsen, J.D.; Wersal, R.M. Estimating the biomass of waterhyacinth (Eichhornia crassipes) using the normalized difference vegetation index derived from simulated Landsat 5 TM. Invasive Plant Sci. Manag. 2015, 8, 203–211. [Google Scholar] [CrossRef] [Green Version]
  45. Anteneh, W.; Tewabe, D.; Assefa, A.; Zeleke, A.; Tenaw, B.; Wassie, Y. Water Hyacinth Coverage Survey Report on Lake Tana Biosphere Reserve; Technical Report Series 2; World Health Organization: Bahir Dar, Ethiopia, 2015. [Google Scholar]
  46. Hestir, E.L.; Khanna, S.; Andrew, M.E.; Santos, M.J.; Viers, J.H.; Greenberg, J.A.; Rajapakse, S.S.; Ustin, S.L. Identification of invasive vegetation using hyperspectral remote sensing in the California Delta ecosystem. Remote Sens. Environ. 2008, 112, 4034–4047. [Google Scholar] [CrossRef]
  47. Everitt, J.H.; Yang, C.; Escobar, D.E.; Webster, C.F.; Lonard, R.I.; Davis, M.R. Using remote sensing and spatial information technologies to detect and map two aquatic macrophytes. J. Aquat. Plant Manag. 1999, 37, 71–80. [Google Scholar]
  48. Yang, C.; Everitt, J.H. Evaluating airborne hyperspectral imagery for mapping water hyacinth infestations. J. Appl. Remote Sens. 2007, 1, 013546. [Google Scholar] [CrossRef]
  49. Dube, T.; Mutanga, O.; Sibanda, M.; Bangamwabo, V.; Shoko, C. Evaluating the performance of the newly-launched Landsat 8 sensor in detecting and mapping the spatial configuration of water hyacinth (Eichhornia crassipes) in inland lakes, Zimbabwe. Phys. Chem. Earth Parts A/B/C 2017, 100, 101–111. [Google Scholar] [CrossRef]
  50. Carson, H.W.; Lass, L.W.; Callihan, R.H. Detection of yellow hawkweed (Hieracium pratense) with high resolution multispectral digital imagery. Weed Technol. 1995, 9, 477–483. [Google Scholar] [CrossRef]
  51. Mladinich, C.S.; Bustos, M.R.; Stitt, S.; Root, R.; Brown, K.; Anderson, G.L.; Hager, S. The use of Landsat 7 Enhanced Thematic Mapper Plus for mapping leafy spurge. Rangel. Ecol. Manag. 2006, 59, 500–506. [Google Scholar] [CrossRef]
  52. Cuneo, P.; Jacobson, C.; Leishman, M.R. Landscape-scale detection and mapping of invasive African Olive (Olea europaea L. ssp. cuspidata Wall ex G. Don Ciferri) in SW Sydney, Australia using satellite remote sensing. Appl. Veg. Sci. 2009, 12, 145–154. [Google Scholar] [CrossRef]
  53. Kimothi, M.M.; Anitha, D.; Vasistha, H.B.; Soni, P.; Chandola, S.K. Remote sensing to map the invasive weed, Lantana camara in forests. Trop Ecol. 2010, 51, 67–74. [Google Scholar]
  54. Pahlevan, N.; Sarkar, S.; Franz, B.A.; Balasubramanian, S.V.; He, J. Sentinel-2 MultiSpectral Instrument (MSI) data processing for aquatic science applications: Demonstrations and validations. Remote Sens. Environ. 2017, 201, 47–56. [Google Scholar] [CrossRef]
  55. Dube, T.; Mutanga, O.; Sibanda, M.; Bangamwabo, V.; Shoko, C. Testing the detection and discrimination potential of the new Landsat 8 satellite data on the challenging water hyacinth (Eichhornia crassipes) in freshwater ecosystems. Appl. Geogr. 2017, 84, 11–22. [Google Scholar] [CrossRef]
  56. Shekede, M.D.; Kusangaya, S.; Schmidt, K. Spatio-temporal variations of aquatic weeds abundance and coverage in Lake Chivero, Zimbabwe. Phys. Chem. Earth Parts A/B/C 2008, 33, 714–721. [Google Scholar] [CrossRef]
  57. Attermeyer, K.; Flury, S.; Jayakumar, R.; Fiener, P.; Steger, K.; Arya, V.; Wilken, F.; van Geldern, R.; Premke, K. Invasive floating macrophytes reduce greenhouse gas emissions from a small tropical lake. Sci. Rep. 2016, 6, 20424. [Google Scholar] [CrossRef]
  58. Muro, J.; Strauch, A.; Fitoka, E.; Tompoulidou, M.; Thonfeld, F. Mapping Wetland Dynamics with SAR-Based Change Detection in the Cloud. IEEE Geosci. Remote Sens. Lett. 2019, 16, 1536–1539. [Google Scholar] [CrossRef]
  59. Gorelick, N.; Hancher, M.; Dixon, M.; Ilyushchenko, S.; Thau, D.; Moore, R. Google Earth Engine: Planetary-scale geospatial analysis for everyone. Remote Sens. Environ. 2017, 202, 18–27. [Google Scholar] [CrossRef]
  60. Moore, R.; Hansen, M. Google Earth Engine: A new cloud-computing platform for global-scale earth observation data and analysis. In AGU Fall Meeting Abstracts; AGU: Washington, DC, USA, 2011. [Google Scholar]
  61. Shelestov, A.; Lavreniuk, M.; Kussul, N.; Novikov, A.; Skakun, S. Exploring Google Earth Engine platform for big data processing: Classification of multi-temporal satellite imagery for crop mapping. Front. Earth Sci. 2017, 5, 17. [Google Scholar] [CrossRef] [Green Version]
  62. Kumar, L.; Mutanga, O.J.R.S. Google Earth Engine applications since inception: Usage, trends, and potential. Remote Sens. 2018, 10, 1509. [Google Scholar] [CrossRef] [Green Version]
  63. Kebede, S.; Travi, Y.; Alemayehu, T.; Marc, V. Water balance of Lake Tana and its sensitivity to fluctuations in rainfall, Blue Nile basin, Ethiopia. J. Hydrol. 2006, 316, 233–247. [Google Scholar] [CrossRef]
  64. Dersseh, M.G.; Melesse, A.M.; Tilahun, S.A.; Abate, M.; Dagnew, D.C. Water hyacinth: Review of its impacts on hydrology and ecosystem services—Lessons for management of Lake Tana. In Extreme Hydrology and Climate Variability; Elsevier: Amsterdam, The Netherlands, 2019; pp. 237–251. [Google Scholar]
  65. Dessie, M.; Verhoest, N.E.; Pauwels, V.R.; Adgo, E.; Deckers, J.; Poesen, J.; Nyssen, J. Water balance of a lake with floodplain buffering: Lake Tana, Blue Nile Basin, Ethiopia. J. Hydrol. 2015, 522, 174–186. [Google Scholar] [CrossRef]
  66. Vijverberg, J.; Sibbing, F.A.; Dejen, E. Lake Tana: Source of the Blue Nile, in the Nile; Springer: Berlin/Heidelberg, Germany, 2009; pp. 163–192. [Google Scholar]
  67. Cheesman, R.E. Lake Tana and Its Islands. Geogr. J. 1935, 85, 489–502. [Google Scholar] [CrossRef]
  68. Wondie, A.J.E. Improving management of shoreline and riparian wetland ecosystems: The case of Lake Tana catchment. Ecohydrol. Hydrobiol. 2010, 10, 123–131. [Google Scholar] [CrossRef]
  69. Zimale, F.A.; Moges, M.A.; Alemu, M.L.; Ayana, E.K.; Demissie, S.S.; Tilahun, S.A.; Steenhuis, T.S. Budgeting suspended sediment fluxes in tropical monsoonal watersheds with limited data: The Lake Tana basin. J. Hydrol. Hydromech. 2018, 66, 65–78. [Google Scholar] [CrossRef] [Green Version]
  70. Setegn, S.G.; Srinivasan, R.; Melesse, A.M.; Dargahi, B. SWAT model application and prediction uncertainty analysis in the Lake Tana Basin, Ethiopia. Hydrol. Process. 2010, 24, 357–367. [Google Scholar] [CrossRef]
  71. Wale, A.; Rientjes TH, M.; Gieske AS, M.; Getachew, H.A. Ungauged catchment contributions to Lake Tana’s water balance. Hydrol. Process. Int. J. 2009, 23, 3682–3693. [Google Scholar] [CrossRef]
  72. Drusch, M.; Del Bello, U.; Carlier, S.; Colin, O.; Fernandez, V.; Gascon, F.; Hoersch, B.; Isola, C.; Laberinti, P.; Martimort, P.; et al. Sentinel-2: ESA’s optical high-resolution mission for GMES operational services. Remote Sens. Environ. 2012, 120, 25–36. [Google Scholar] [CrossRef]
  73. Vuolo, F.; Żółtak, M.; Pipitone, C.; Zappa, L.; Wenng, H.; Immitzer, M.; Weiss, M.; Baret, F.; Atzberger, C. Data service platform for Sentinel-2 surface reflectance and value-added products: System use and examples. Remote Sens. 2016, 8, 938. [Google Scholar] [CrossRef] [Green Version]
  74. Meygret, A.; Baillarin, S.; Gascon, F.; Hillairet, E.; Dechoz, C.; Lacherade, S.; Martimort, P.; Spoto, F.; Henry, P.; Duca, R. SENTINEL-2 image quality and level 1 processing. In Earth Observing Systems XIV. International Society for Optics and Photonics; SPIE: San Diego, CA, USA, 2009. [Google Scholar]
  75. Stehman, S.V. Selecting and interpreting measures of thematic classification accuracy. Remote Sens. Environ. 1997, 62, 77–89. [Google Scholar] [CrossRef]
  76. Van Leeuwen, W.J.; Huete, A.R.; Laing, T.W. MODIS vegetation index compositing approach: A prototype with AVHRR data. Remote Sens. Environ. 1999, 69, 264–280. [Google Scholar] [CrossRef]
  77. Didan, K. MOD13Q1: MODIS/Terra vegetation indices 16-day L3 global 250 m grid SIN V006. NASA EOSDIS Land Processes DAAC Accessed 2014, 6. [Google Scholar]
  78. Petus, C.; Lewis, M.; White, D.J.E.I. Monitoring temporal dynamics of Great Artesian Basin wetland vegetation, Australia, using MODIS NDVI. Ecol. Indic. 2013, 34, 41–52. [Google Scholar] [CrossRef]
  79. Pettorelli, N.; Vik, J.O.; Mysterud, A.; Gaillard, J.M.; Tucker, C.J.; Stenseth, N.C. Using the satellite-derived NDVI to assess ecological responses to environmental change. Trends Ecol. Evol. 2005, 20, 503–510. [Google Scholar] [CrossRef]
  80. Huete, A.R. A soil-adjusted vegetation index (SAVI). Remote Sens. Environ. 1988, 25, 295–309. [Google Scholar] [CrossRef]
  81. Hamed, K.H. Trend detection in hydrologic data: The Mann–Kendall trend test under the scaling hypothesis. J. Hydrol. 2008, 349, 350–363. [Google Scholar] [CrossRef]
  82. Urbanc-Berčič, O.; Gaberščik, A. The influence of temperature and light intensity on activity of water hyacinth (Eichhornia crassipes (Mart.) Solms.). Aquat. Bot. 1989, 35, 403–408. [Google Scholar]
  83. Gopal, B.J.C. Aquatic Plant Studies 1. Water Hyacinth; Elsevier Science: Amsterdam, The Netherlands, 1987. [Google Scholar]
  84. Rogers, H.H.; Davis, D. Nutrient removal by waterhyacinth. Weed Sci. 1972, 20, 423–428. [Google Scholar] [CrossRef]
  85. Cornwell, D.A.; Zoltek, J., Jr.; Patrinely, C.D.; Furman, T.D.; Kim, J.I. Nutrient removal by water hyacinths. J. Water Pollut. Control Fed. 1977, 57–65. [Google Scholar]
  86. Sheffield, C.J. Water hyacinth for nutrient removal. Hyacinth Control J. 1967, 6, 27–30. [Google Scholar]
  87. Wang, Z.; Zhang, Z.; Zhang, J.; Zhang, Y.; Liu, H.; Yan, S. Large-scale utilization of water hyacinth for nutrient removal in Lake Dianchi in China: The effects on the water quality, macrozoobenthos and zooplankton. Chemosphere 2012, 89, 1255–1261. [Google Scholar] [CrossRef] [PubMed]
  88. De Busk, T.; Williams, L.; Ryther, J.H. Removal of Nitrogen and Phosphorus from Waste Water in a Waterhyacinth-Based Treatment System. J. Environ. Qual. 1983, 12, 257–262. [Google Scholar] [CrossRef]
  89. Coops, H.; Beklioglu, M.; Crisman, T.L. The role of water-level fluctuations in shallow lake ecosystems–workshop conclusions. Hydrobiologia 2003, 506, 23–27. [Google Scholar] [CrossRef]
  90. Zohary, T.; Ostrovsky, I. Ecological impacts of excessive water level fluctuations in stratified freshwater lakes. Inland Waters 2011, 1, 47–59. [Google Scholar] [CrossRef]
  91. Ligdi, E.E.; El Kahloun, M.; Meire, P. Ecohydrological status of Lake Tana—A shallow highland lake in the Blue Nile (Abbay) basin in Ethiopia. Ecohydrol. Hydrobiol. 2010, 10, 109–122. [Google Scholar] [CrossRef]
  92. Zhu, J.; Wang, X.; Zhang, L.; Cheng, H.; Yang, Z. System dynamics modeling of the influence of the TN/TP concentrations in socioeconomic water on NDVI in shallow lakes. Ecol. Eng. 2015, 76, 27–35. [Google Scholar] [CrossRef]
  93. Piao, S.; Fang, J.; Zhou, L.; Guo, Q.; Henderson, M.; Ji, W.; Li, Y.; Tao, S. Interannual variations of monthly and seasonal normalized difference vegetation index (NDVI) in China from 1982 to 1999. J. Geophys. Res. Atmos. 2003, 108, 1–13. [Google Scholar] [CrossRef]
  94. Reed, B.; Budde, M.; Spencer, P.; Miller, A.E. Integration of MODIS-derived metrics to assess interannual variability in snowpack, lake ice, and NDVI in southwest Alaska. Remote Sens. Environ. 2009, 113, 1443–1452. [Google Scholar] [CrossRef]
  95. Ahmed, S.; Kaiser, M.F. Monitoring Water Pollution of Lake Maryout on the Mediterranean Coast of Egypt. Int. J. Remote Sens. Appl. 2014, 4, 36–40. [Google Scholar] [CrossRef]
Figure 1. Elevation map of Ethiopia (left) and the Tana sub basin (right) with gauged catchments and Lake Tana (the study area which was prepared by using the maximum historical lake level at 1788.2 m a.s.l).
Water 12 01435 g001
Figure 2. The color change of leaves of water hyacinth in the dry season (a), the permanent infestation area in the river mouth in the dry season (b), poor disposal on the lake embankment (c) and evergreen water hyacinth growth stage (d) (Photo by Minychl G. Dersseh, 29 December 2019).
Water 12 01435 g002
Figure 3. Monthly graphical presentation of water hyacinth covered area and lake surface area since 2015.
Water 12 01435 g003
Figure 4. Spatial and temporal map of annual maximum area covered by water hyacinth in the north, northeast and eastern shore of the Lake Tana from 2015–2019.
Water 12 01435 g004
Figure 5. Graphical presentation of the mean monthly lake stage (a) and the correlation between area covered by water hyacinth and mean monthly lake stage (b) from 2016–2019.
Water 12 01435 g005
Figure 6. Spatial annual maximum and minimum values of the Normalized Difference Vegetation Index (NDVI) on Lake Tana starting from January 2011 to November 2019.
Water 12 01435 g006
Table 1. Annual maximum and minimum water hyacinth covered areas and lake surface areas, and rate of water hyacinth expansion (2015–2019).
YearLake Surface Area (km2)Area Covered by Water Hyacinth (ha)Rate of Expansion (%)
MinMaxMinMax
2015ND*3069.3ND*278.3-
20162976.13042.128.1613.6120.5
20172990.43052.697.31108.780.7
20182985.33090.8546.62036.583.7
201929453056.3436.72504.523
ND* means no data in the months.

