Identification of High-Risk Areas for the Spread of Highly Pathogenic Avian Influenza in Central Luzon, Philippines

 and
and 
Abstract
:1. Introduction
2. Materials and Methods
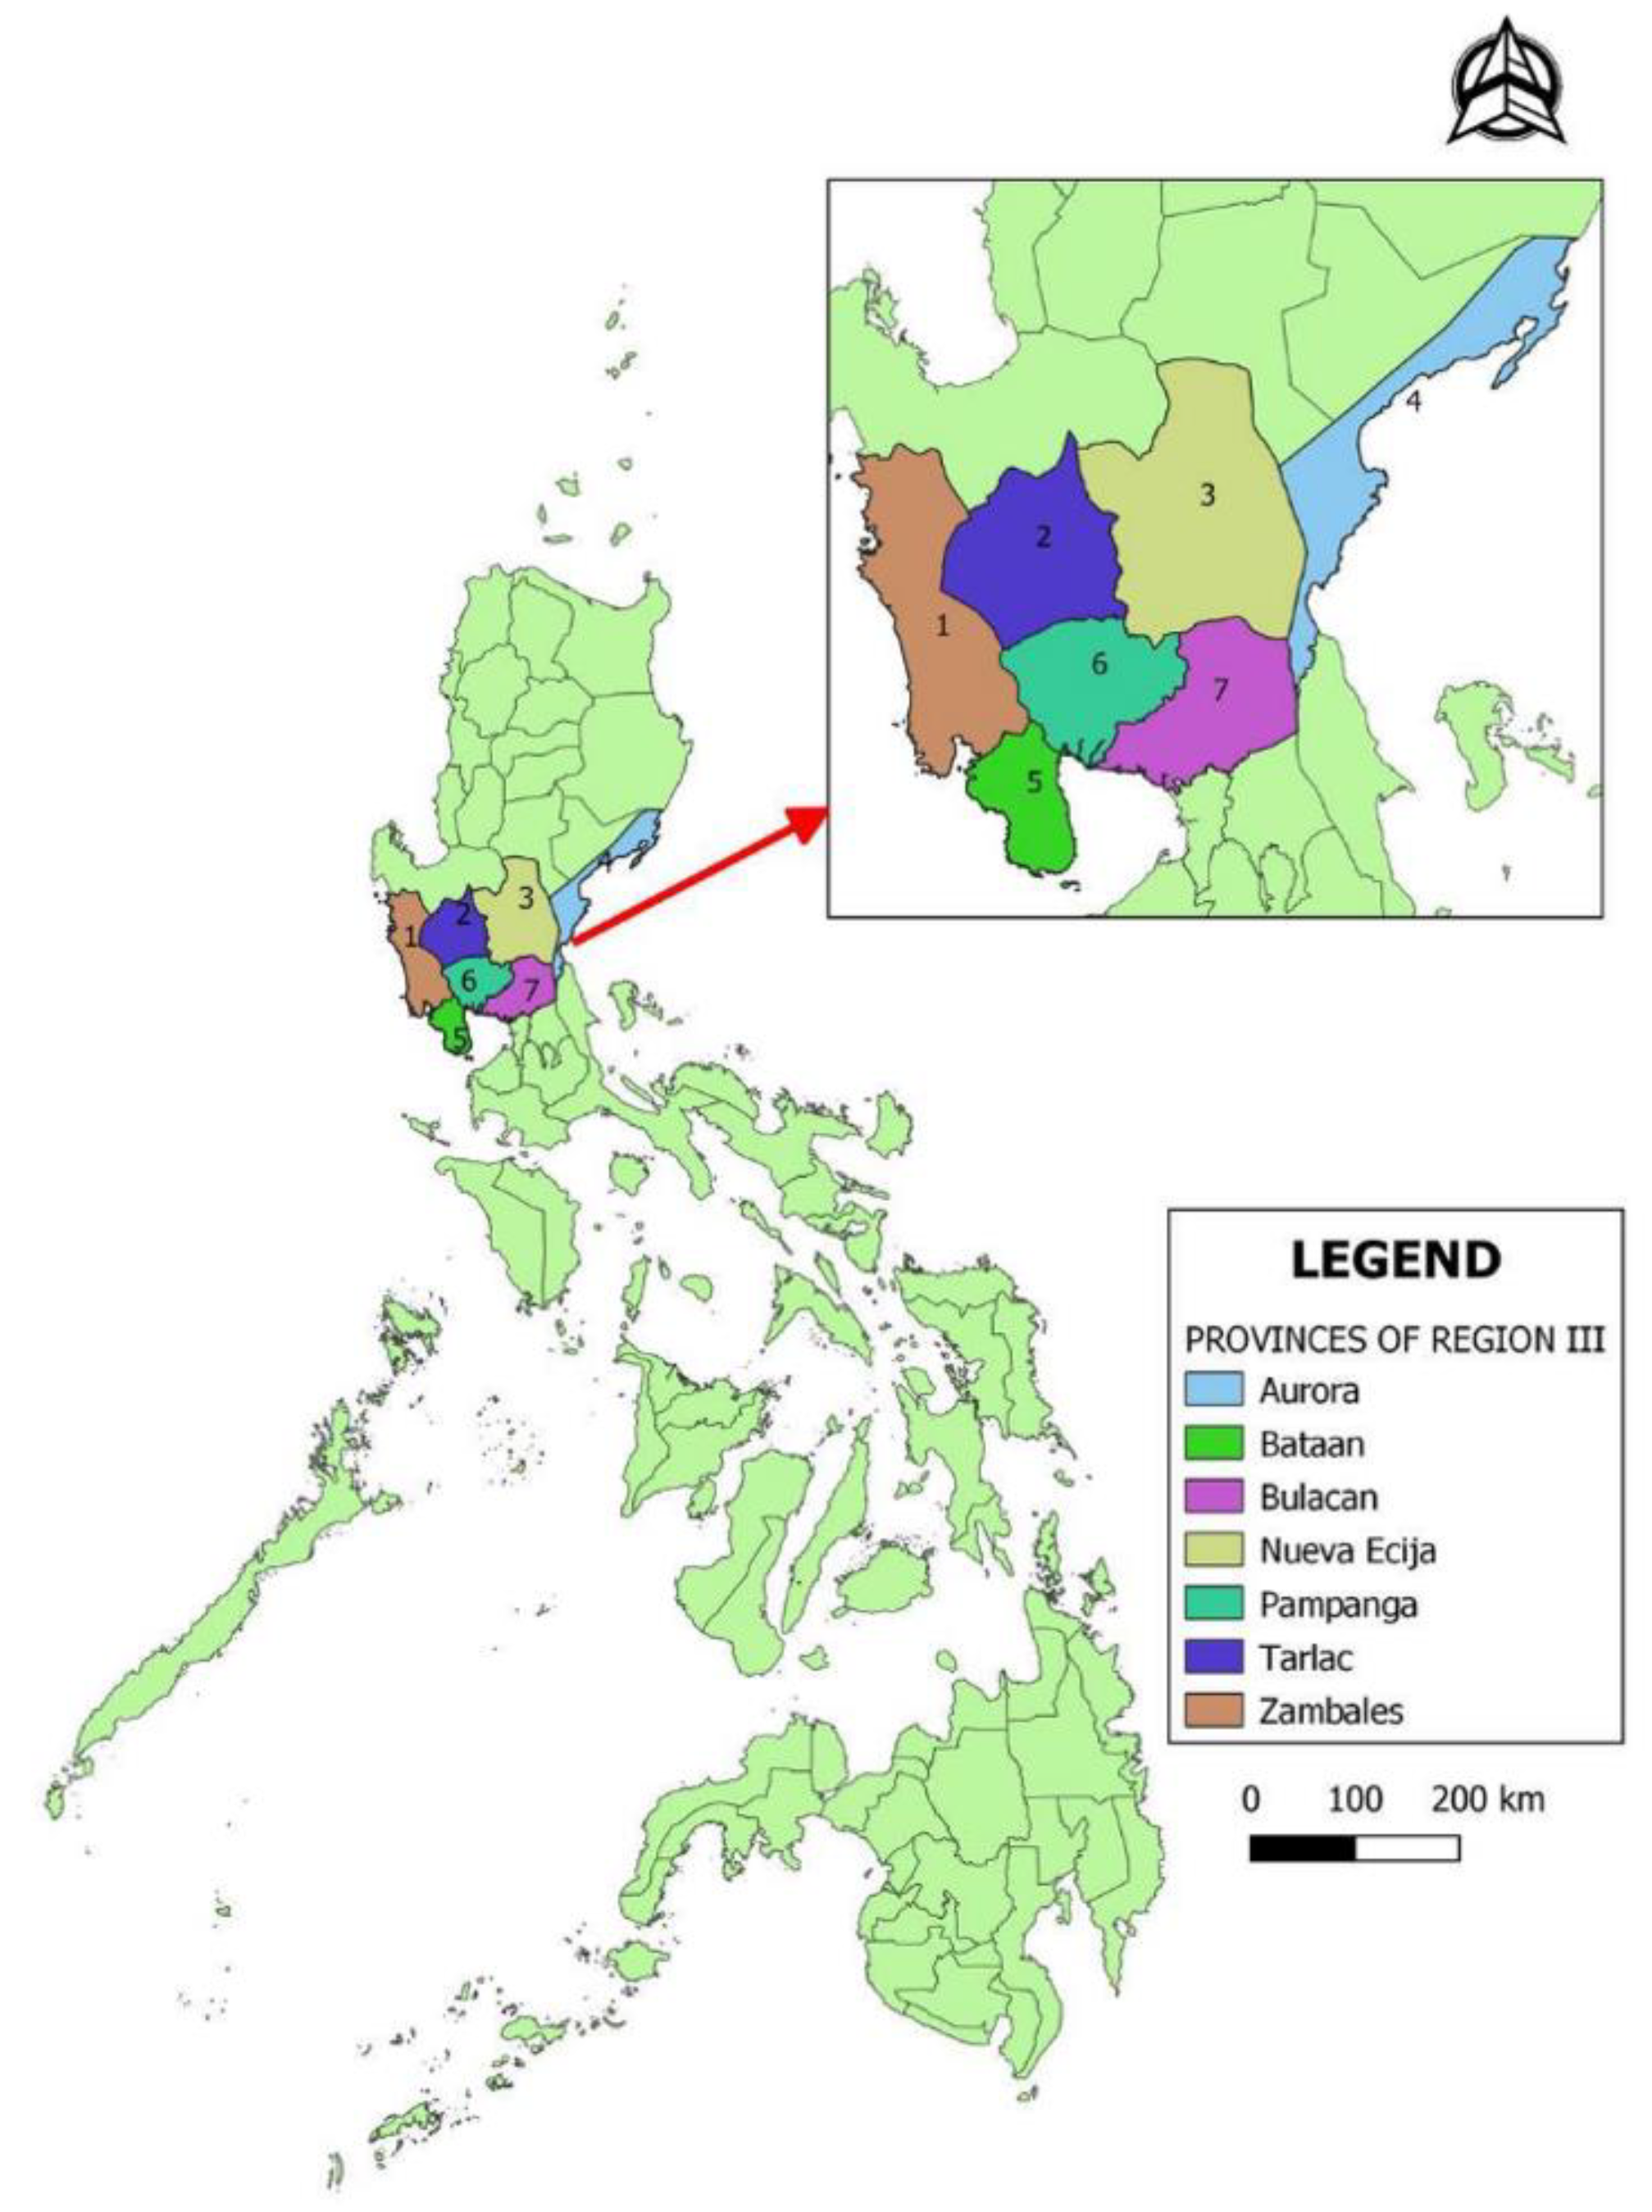
2.1. Study Area
2.2. Data Sources
2.3. Model Formulation
3. Assumptions
4. Results
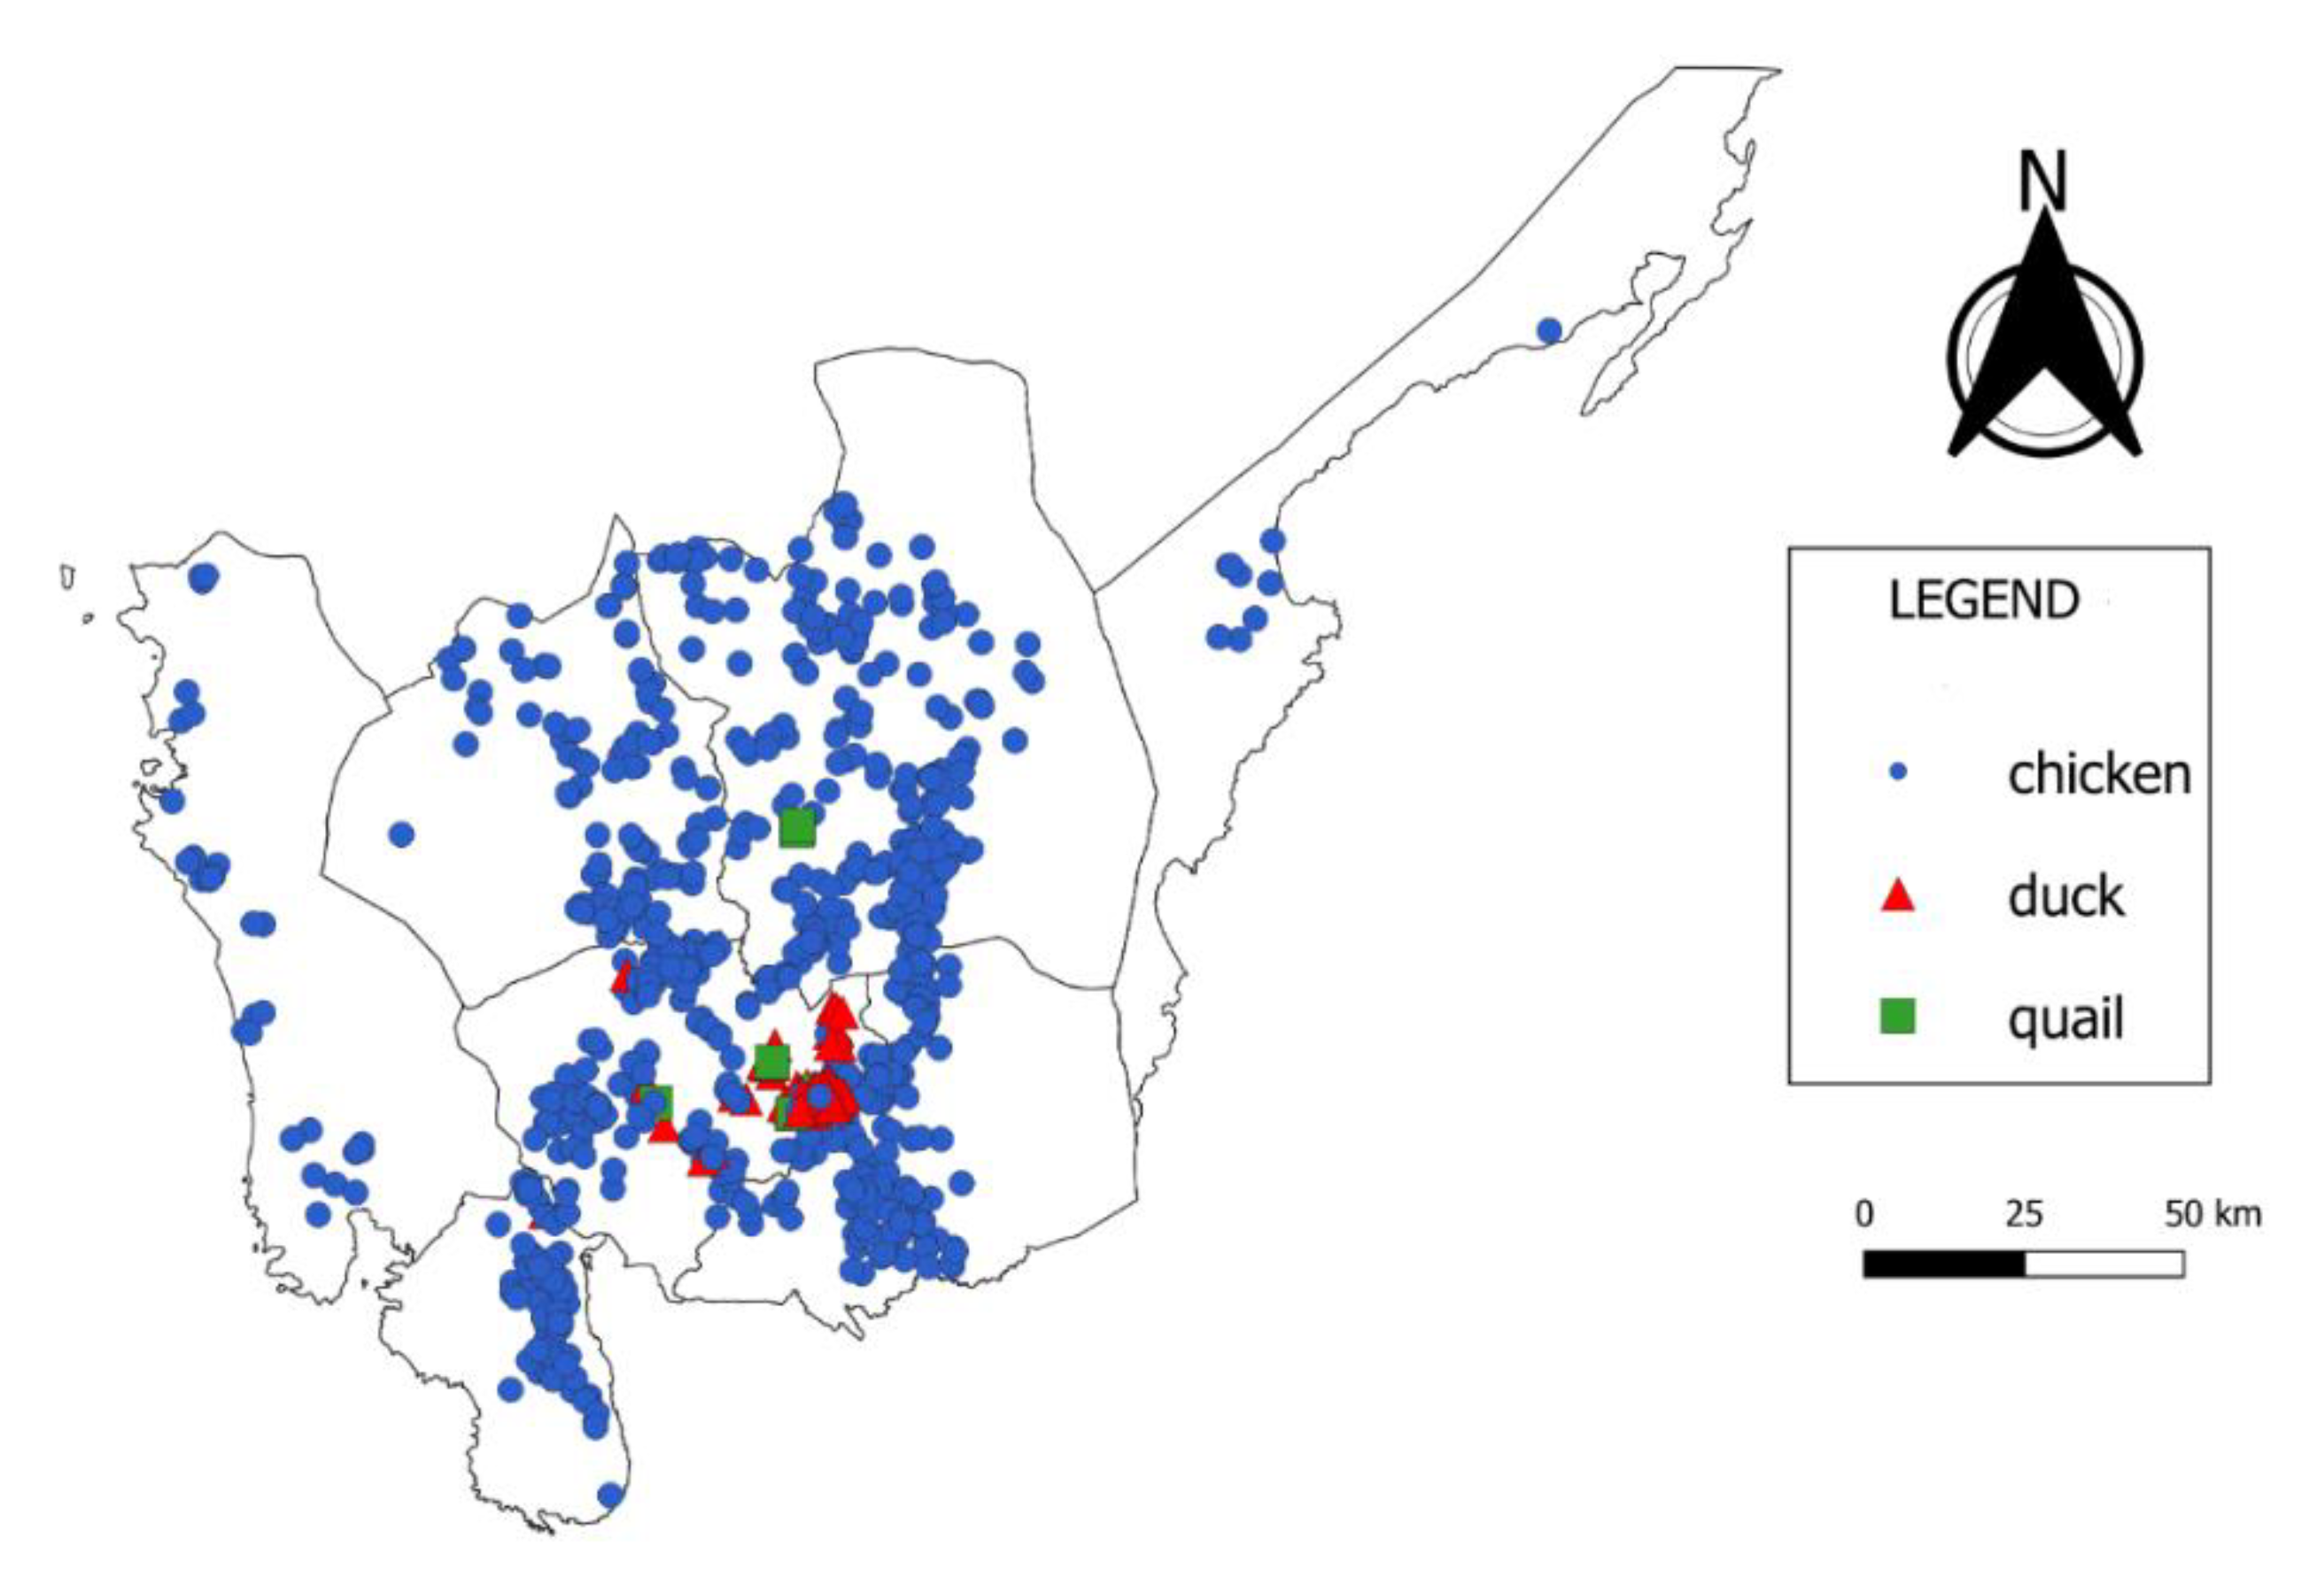
4.1. Farm Location
4.2. Farm Practices
4.3. Transmission Parameters
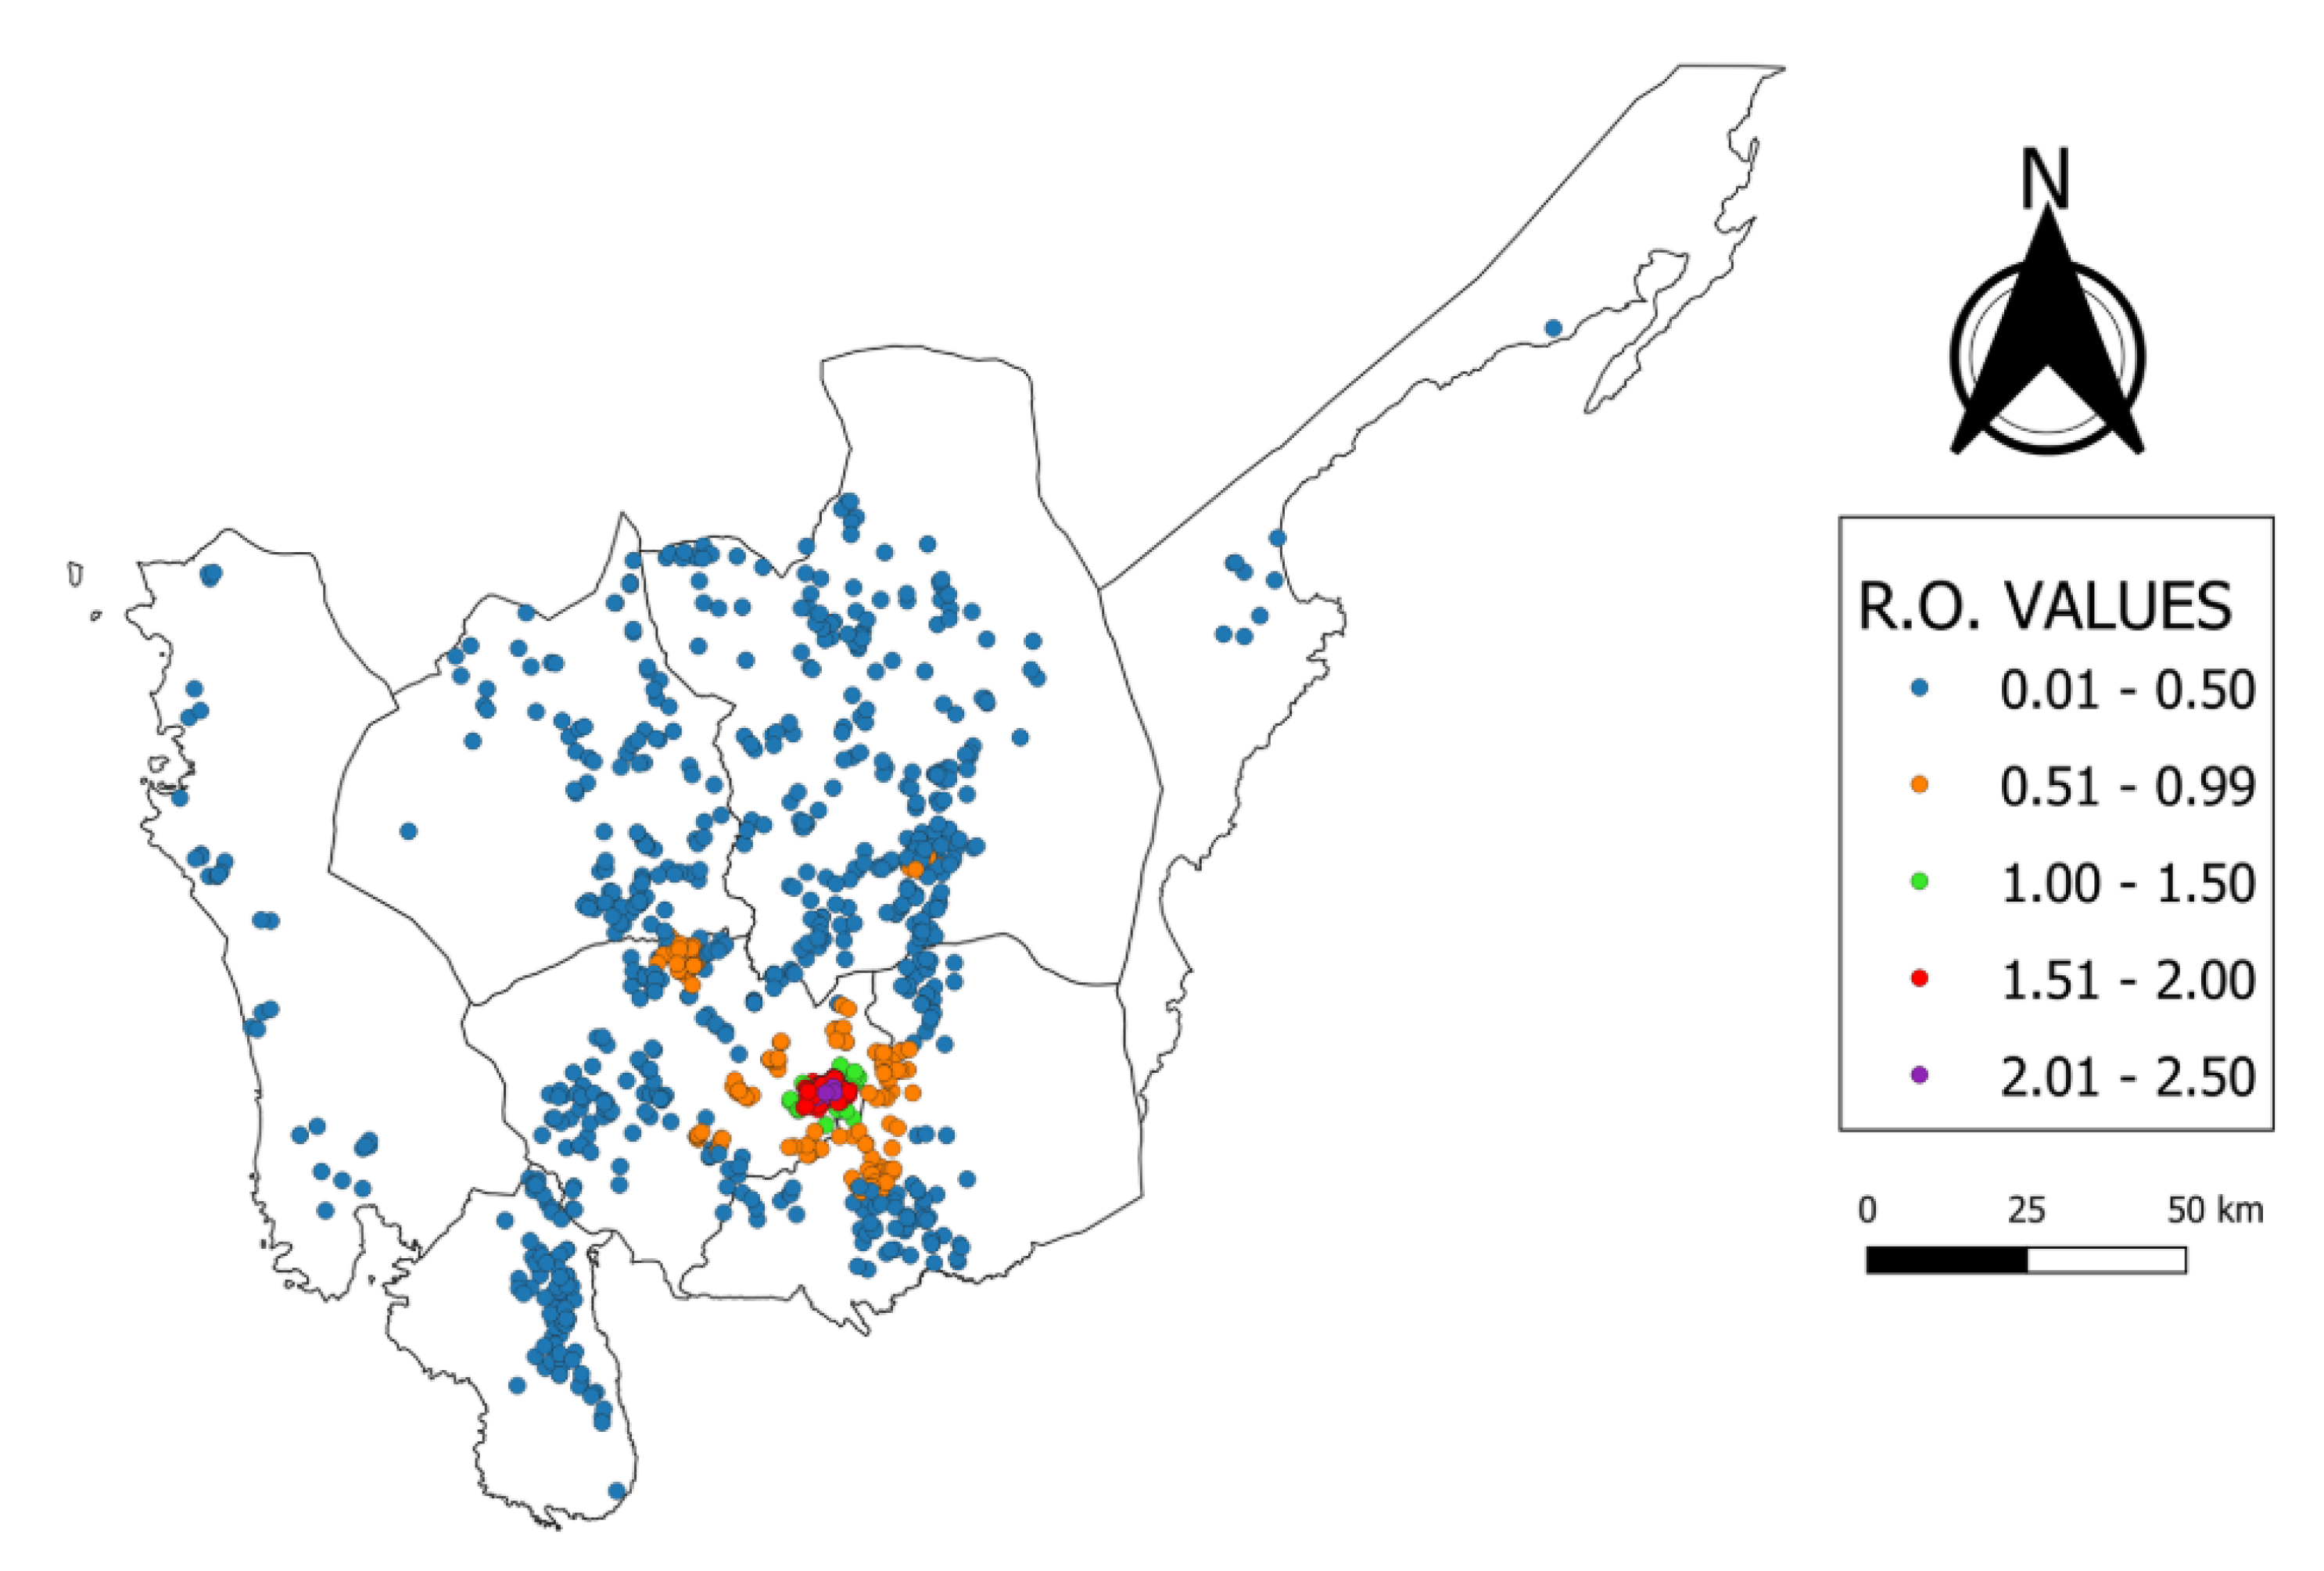
4.4. Farm-Level Basic Reproductive Ratio Values
5. Discussion
6. Conclusions
Author Contributions
Funding
Acknowledgments
Conflicts of Interest
Data Availability
References
- Lee, H.; Lao, A. Transmission dynamics and control strategies assessment of avian influenza A (H5N6) in the Philippines. Infect. Dis. Model. 2018, 3, 35–59. [Google Scholar]
- Loth, L.; Gilbert, M.; Osmani, M.G.; Kalam, A.M.; Xiao, X. Risk factors and clusters of highly pathogenic avian influenza H5N1 outbreaks in Bangladesh. Prev. Vet. Med. 2010, 96, 104–113. [Google Scholar] [CrossRef] [Green Version]
- Loth, L.; Gilbert, M.; Wu, J.; Czarnecki, C.; Hidayat, M.; Xiao, X. Identifying risk factors of highly pathogenic avian influenza (H5N1 subtype) in Indonesia. Prev. Vet. Med. 2011, 102, 50–58. [Google Scholar] [CrossRef] [Green Version]
- Pfeiffer, D.U.; Minh, P.Q.; Martin, V.; Epprecht, M.; Otte, M.J. An analysis of the spatial and temporal patterns of highly pathogenic avian influenza occurrence in Vietnam using national surveillance data. Vet. J. 2007, 174, 302–309. [Google Scholar] [CrossRef] [PubMed]
- Dhingra, M.S.; Dissanayake, R.; Negi, A.B.; Oberoi, M.; Castellan, D.; Thrusfield, M.; Linard, C.; Gilbert, M. Spatio-temporal epidemiology of highly pathogenic avian influenza (subtype H5N1) in poultry in eastern India. Spat. Spatiotemporal. Epidemiol. 2014, 11, 45–57. [Google Scholar] [CrossRef] [PubMed]
- Boender, G.J.; Hagenaars, T.J.; Bouma, A.; Nodelijk, G.; Elbers, A.R.W.; De Jong, M.C.M.; Van Boven, M. Risk maps for the spread of highly pathogenic avian influenza in poultry. PLoS Comput. Biol. 2007, 3, e71. [Google Scholar] [CrossRef] [PubMed] [Green Version]
- Boender, G.J.; Elbers, A.R.W.; De Jong, M.C.M. Spread of avian influenza in The Netherlands: Identifying areas at high risk. Vet. Ital. 2007, 43, 605–609. [Google Scholar] [PubMed]
- Hayama, Y.; Yamamoto, T.; Kobayashi, S.; Muroga, N.; Tsutsui, T. Evaluation of the transmission risk of foot-and-mouth disease in Japan. Virology 2015, 9, 1167–1170. [Google Scholar] [CrossRef] [PubMed] [Green Version]
- McCullagh, M. Detecting hotspots in time and space. Int. Symp. Exhib. Geoinf. 2006, 349, 1–18. [Google Scholar]
- Keeling, M.J.; Woolhouse, E.J.; Shaw, D.J.; Matthews, L.; Chase-Topping, M.; Haydon, D.T.; Cornell, S.J.; Kappey, J.; Wilesmith, J.; Grenfell, B.T. Dynamics of the 2001 UK foot and mouth epidemic: Stochastic dispersal in a heterogeneous landscape. Science 2001, 294, 813–817. [Google Scholar] [CrossRef] [Green Version]
- Boender, G.J.; Van Roermund, H.J.; De Jong, M.C.M.; Hagenaars, T.J. Transmission risks and control of foot-and-mouth disease in The Netherlands: Spatial patterns. Epidemics 2010, 2, 36–47. [Google Scholar] [CrossRef] [PubMed]
- Tildesley, M.J.; Keeling, M.J. Is R 0 a good predictor of final epidemic size: Foot-and-mouth disease in the UK. J. Theor. Biol. 2009, 258, 623–629. [Google Scholar] [CrossRef] [PubMed] [Green Version]
- LeMenach, A.; Legrand, J.; Grais, R.F.; Viboud, C.; Valleron, A.-J.; Flahault, A. Modeling spatial and temporal transmission of foot-and-mouth disease in France: Identification of high-risk areas. Vet. Res. 2005, 36, 699–712. [Google Scholar] [CrossRef] [PubMed] [Green Version]
- Hartemink, N.A.; Purse, B.V.; Meiswinkel, R.; Brown, H.E.; De Koeijer, A.; Elbers, A.R.W.; Boender, G.J.; Rogers, D.J.; Heesterbeek, J.A.P. Mapping the basic reproduction number (R0) for vector-borne diseases: A case study on bluetongue virus. Epidemics 2009, 1, 153–161. [Google Scholar] [CrossRef]
- Ster, I.C.; Ferguson, N.M. Transmission parameters of the 2001 foot and mouth epidemic in Great Britain. PLoS ONE 2007, 2, e502. [Google Scholar]
- Boender, G.J.; Meester, R.; Gies, E.; De Jong, M.C.M. The local threshold for geographical spread of infectious diseases between farms. Prev. Vet. Med. 2007, 82, 90–101. [Google Scholar] [CrossRef]
- Diekmann, O.; Heesterbeek, J.A.P.; Metz, J.A.J. On the definition and the computation of the basic reproduction ratio R o in models for infectious diseases in heterogeneous populations. J. Math. Biol. 1990, 28, 365–382. [Google Scholar] [CrossRef] [Green Version]
- Bersales, L.G.S. Duck situation report January–December 2018. Philipp. Stat. Auth. 2019, 1–37, ISSN 2546-0625. [Google Scholar]
- Bersales, L.G.S. Chicken situation report January–December 2018. Philipp. Stat. Auth. 2019, 1–45, ISSN 2546-0625. [Google Scholar]
- Truscott, J.; Garske, T.; Chis-ster, I.; Guitian, J.; Pfeiffer, D.; Snow, L.; Wilesmith, J.; Ferguson, N.M.; Ghani, A.C. Control of a highly pathogenic H5N1 avian influenza outbreak in the GB poultry flock. Proc. R. Soc. B Biol. Sci. 2007, 1623, 2287–2295. [Google Scholar] [CrossRef] [Green Version]
- Bonney, P.J.; Malladi, S.; Boender, G.J.; Weaver, J.T.; Ssematimba, A.; Halvorson, D.A.; Cardona, C.J. Spatial transmission of H5N2 highly pathogenic avian influenza between Minnesota poultry premises during the 2015 outbreak. PLoS ONE 2018, 13, e0204262. [Google Scholar] [CrossRef] [PubMed] [Green Version]
- Dorigatti, I.; Mulatti, P.; Rosà, R.; Pugliese, A.; Busani, L. Modelling the spatial spread of H7N1 avian in fl uenza virus among poultry farms in Italy. Epidemics 2010, 2, 29–35. [Google Scholar] [CrossRef] [PubMed]
- Hayama, Y.; Yamamoto, T.; Kobayashi, S.; Muroga, N.; Tsutsui, T. Mathematical model of the 2010 foot-and-mouth disease epidemic in Japan and evaluation of control measures. Prev. Vet. Med. 2013, 112, 183–193. [Google Scholar] [CrossRef] [PubMed]
- Keeling, M.J. Models of foot-and-mouth disease. Proc. R. Soc. B Biol. Sci. 2005, 272, 1195–1202. [Google Scholar] [CrossRef] [Green Version]
- R Development Core Team. R: A Language and Environment for Statistical Computing; R Foundation for Statistical Computing: Vienna, Austria, 2008; ISBN 3-900051-07-0. [Google Scholar]
- QGIS Development Team QGIS Geographic Information System. Open Source Geospatial Foundation Project 2019. Available online: http://www.qgis.org (accessed on 5 January 2020).
- Swayne, D.E.; Beck, J.R. Experimental study to determine if low-pathogenicity and high-pathogenicity avian influenza viruses can be present in chicken breast and thigh meat following intranasal virus inoculation. Avian Dis. 2005, 49, 81–85. [Google Scholar] [CrossRef]
- Tian, G.; Zhang, S.; Li, Y.; Bu, Z.; Liu, P.; Zhou, J.; Li, C.; Shi, J.; Yu, K.; Chen, H. Protective efficacy in chickens, geese and ducks of an H5N1-inactivated vaccine developed by reverse genetics. Virology 2005, 341, 153–162. [Google Scholar] [CrossRef] [Green Version]
- Van Der Goot, J.A.; Koch, G.; De Jong, M.C.M.; Van Boven, M. Quantification of the effect of vaccination on transmission of avian influenza (H7N7) in chickens. Proc. Natl. Acad. Sci. USA 2005, 102, 18141–18146. [Google Scholar] [CrossRef] [Green Version]
- Hénaux, V.; Samuel, M.D.; Bunck, C.M. Model-based evaluation of highly and low pathogenic avian influenza dynamics in wild birds. PLoS ONE 2010, 5, e10997. [Google Scholar] [CrossRef]
- Spekreijse, D.; Bouma, A.; Koch, G.; Stegeman, J.A. Airborne transmission of a highly pathogenic avian influenza virus strain H5N1 between groups of chickens quantified in an experimental setting. Vet. Microbiol. 2011, 152, 88–95. [Google Scholar] [CrossRef] [Green Version]
- Van der Goot, J.A.; De Jong, M.C.M.; Koch, G.; Boven, V.M. Comparison of the transmission characteristics of low and high pathogenicity avian influenza A virus (H5N2). Epidemiol. Infect. 2003, 131, 1003–1013. [Google Scholar] [CrossRef]
- Dorea, F.C.; Vieira, A.R.; Hofacre, C.; Waldrip, D.; Cole, D.J. Stochastic model of the potential spread of highly pathogenic avian influenza from an infected commercial broiler operation in Georgia. Avian Dis. 2010, 5, e172–e173. [Google Scholar] [CrossRef]
- Elbers, A.A.R.W.; Fabri, T.H.F.; De Vries, T.S.; De Wit, J.J.; Pijpers, A.; Koch, G. The highly pathogenic Avian influenza A (H7N7) virus epidemic in The Netherlands in 2003—Lessons learned from the first five outbreaks. Avian Dis. 2004, 48, 691–705. [Google Scholar] [CrossRef] [PubMed]
- Savill, N.J.; Rose, S.G.S.; Woolhouse, M.E.J.; Interface, J.R.S.; Savill, N.J.; Rose, S.G.S.; Woolhouse, M.E.J. Detection of mortality clusters associated with highly pathogenic avian influenza in poultry: A theoretical analysis. J. R. Soc. Interf. 2008, 5, 1409–1419. [Google Scholar] [CrossRef] [PubMed] [Green Version]
- Jiao, P.; Cui, J.; Song, Y.; Song, H.; Zhao, Z.; Wu, S.; Qu, N.; Wang, N.; Ouyang, G.; Liao, M. New reassortant H5N6 highly pathogenic avian influenza viruses in Southern China, 2014. Front. Microbiol. 2016, 7, 1–12. [Google Scholar] [CrossRef]
- Lee, E.K.; Lee, Y.N.; Kye, S.J.; Lewis, N.S.; Brown, I.H.; Sagong, M.; Heo, G.B.; Kang, Y.M.; Cho, H.K.; Kang, H.M.; et al. Characterization of a novel reassortant H5N6 highly pathogenic avian influenza virus clade 2.3.4.4 in Korea, 2017 correspondence. Emerg. Microbes Infect. 2018, 7, 1–8. [Google Scholar]
- Moore, D.A.; Carpenter, T.E. Spatial analytical methods and GIS: Use in health research and epidemiology. Epidemiol. Rev. 1999, 21, 143–161. [Google Scholar] [CrossRef] [Green Version]
- Ahmed, S.S.U.; Ersbøll, A.K.; Biswas, P.K.; Christensen, J.P. The space-time clustering of highly pathogenic avian influenza (HPAI) H5N1 outbreaks in Bangladesh. Epidemiol. Infect. 2010, 138, 843–852. [Google Scholar] [CrossRef] [Green Version]
- Tiensin, T.; Ahmed, S.S.U.; Rojanasthien, S.; Songserm, T.; Ratanakorn, P.; Chaichoun, K.; Kalpravidh, W.; Wongkasemjit, S.; Patchimasiri, T.; Chanachai, K.; et al. Ecologic risk factor investigation of clusters of Avian influenza A (H5N1) virus infection in Thailand. J. Infect. Dis. 2009, 199, 1735–1743. [Google Scholar] [CrossRef] [Green Version]
- Gilbert, M.; Chaitaweesub, P.; Parakamawongsa, T.; Premashthira, S.; Tiensin, T.; Kalpravidh, W.; Wagner, H.; Slingenbergh, J. Free-grazing ducks and highly pathogenic Avian Influenza, Thailand. Emerg. Infect. Dis. J. 2006, 12, 227–234. [Google Scholar] [CrossRef] [Green Version]
- Wibawa, H.; Bingham, J.; Nuradji, H.; Lowther, S.; Payne, J.; Harper, J.; Junaidi, A.; Middleton, D.; Meers, J. Experimentally infected domestic ducks show efficient transmission of Indonesian H5N1 highly pathogenic Avian influenza virus, but lack persistent viral shedding. PLoS ONE 2014, 9, e83417. [Google Scholar] [CrossRef]
- Tiensin, T.; Nielen, M.; Vernooij, H.; Songserm, T.; Kalpravidh, W.; Chotiprasatintara, S.; Chaisingh, A.; Wongkasemjit, S.; Chanachai, K.; Thanapongtham, W.; et al. Transmission of the highly pathogenic Avian influenza virus H5N1 within flocks during the 2004 epidemic in Thailand. J. Infect. Dis. 2007, 196, 1679–1684. [Google Scholar] [CrossRef] [PubMed] [Green Version]
- Nguyen, D.C.; Uyeki, T.M.; Jadhao, S.; Maines, T.; Shaw, M.; Matsuoka, Y.; Smith, C.; Rowe, T.; Lu, X.; Hall, H.; et al. Isolation and characterization of Avian influenza viruses, including highly pathogenic H5N1, from poultry in live bird markets in Hanoi, Vietnam, in 2001. J. Virol. 2005, 79, 4201–4212. [Google Scholar] [CrossRef] [PubMed] [Green Version]
- Sturm-Ramirez, K.M.; Hulse-Post, D.J.; Govorkova, E.A.; Humberd, J.; Seiler, P.; Puthavathana, P.; Buranathai, C.; Nguyen, T.D.; Chaisingh, A.; Long, H.T.; et al. Are ducks contributing to the endemicity of highly pathogenic H5N1 influenza virus in Asia? J. Virol. 2005, 79, 11269–11279. [Google Scholar] [CrossRef] [PubMed] [Green Version]
- Thanawat, T.; Prasit, C.; Thaweesak, S.; Arunee, C.; Wirongrong, H.; Chantanee, B.; Tippawon, P.; Sith, P.; Alongkorn, A.; Marius, G.; et al. Highly pathogenic Avian influenza H5N1, Thailand, 2004. Emerg. Infect. Dis. J. 2005, 11, 1664. [Google Scholar]
- Boonyapisitsopa, S.; Chaiyawong, S.; Nonthabenjawan, N. Sentinel model for influenza A virus monitoring in free-grazing ducks in Thailand. Vet. Microbiol. 2016, 182, 35–43. [Google Scholar] [CrossRef] [PubMed]
- Hulse-Post, D.J.; Sturm-Ramirez, K.M.; Humberd, J.; Seiler, P.; Govorkova, E.A.; Krauss, S.; Scholtissek, C.; Puthavathana, P.; Buranathai, C.; Nguyen, T.D.; et al. Role of domestic ducks in the propagation and biological evolution of highly pathogenic H5N1 influenza viruses in Asia. Proc. Natl. Acad. Sci. USA 2005, 102, 10682–10687. [Google Scholar] [CrossRef] [Green Version]
- Melendres, R.G. The utilization of Candaba swamp from prehistoric to present time: Evidences from archaeology, history and ethnography. Bhatter Coll. J. Multidiscip. Stud. 2014, 4, 81–93. [Google Scholar]
- Biswas, P.K.; Christensen, J.P.; Ahmed, S.S.U.; Barua, H.; Das, A.; Rahman, M.H.; Giasuddin, M.; Hannan, A.S.M.A.; Habib, A.M.; Debnath, N.C. Risk factors for infection with highly pathogenic influenza A virus (H5N1) in commercial chickens in Bangladesh. Vet. Rec. 2009, 164, 743–746. [Google Scholar] [CrossRef]
- Ward, M.P.; Maftei, D.; Apostu, C.; Suru, A. Environmental and anthropogenic risk factors for highly pathogenic avian influenza subtype H5N1 outbreaks in Romania, 2005—2006. Vet. Res. Commun. 2008, 32, 627–634. [Google Scholar] [CrossRef]
- Chunxiang, C.A.O.; Min, X.U.; Chaoyi, C.; Yong, X.U.E.; Shaobo, Z.; Liqun, F.; Wuchun, C.A.O.; Hao, Z.; Mengxu, G.A.O.; Qisheng, H.E.; et al. Risk analysis for the highly pathogenic avian influenza in Mainland China using meta-modeling. Chin. Sci. Bull. 2010, 55, 4168–4178. [Google Scholar]
- Fang, L.; Vlas, S.J.D.; Liang, S.; Looman, C.W.N.; Gong, P.; Xu, B.; Yang, H.; Richardus, J.H.; Cao, W. Environmental factors contributing to the spread of H5N1 Avian influenza in Mainland China. PLoS ONE 2008, 3, e2268. [Google Scholar] [CrossRef] [PubMed] [Green Version]
- Perez, D.R.; Lim, W.; Seiler, J.P.; Yi, G.; Peiris, M.; Shortridge, K.F.; Webster, R.G. Role of quail in the interspecies transmission of H9 influenza A viruses: Molecular changes on HA that correspond to adaptation from ducks to chickens. J. Virol. 2003, 77, 3148–3156. [Google Scholar] [CrossRef] [PubMed] [Green Version]
- Webster, R.G.; Guan, Y.; Peiris, M.; Walker, D.; Krauss, S.; Zhou, N.N.; Govorkova, E.A.; Ellis, T.M.; Dyrting, K.C.; Sit, T.; et al. Characterization of H5N1 influenza viruses that continue to circulate in geese in Southeastern China. J. Virol. 2002, 76, 118–126. [Google Scholar] [CrossRef] [PubMed] [Green Version]


| Province | Poultry Farms | Average Population |
|---|---|---|
| Aurora | 9 | 8222 |
| Bataan | 90 | 54,147 |
| Bulacan | 154 | 92,858 |
| Nueva Ecija | 268 | 57,823 |
| Pampanga | 485 | 27,257 |
| Tarlac | 112 | 87,231 |
| Zambales | 33 | 104,164 |
| R0 | Ducks | Quail | Chickens | Total |
|---|---|---|---|---|
| 0.01–0.50 | 8 | 6 | 705 | 719 |
| 0.51–0.99 | 18 | 1 | 144 | 163 |
| 1.00–1.50 | 8 | 3 | 12 | 23 |
| 1.51–2.00 | 135 | 0 | 15 | 150 |
| 2.01–2.5 | 91 | 1 | 4 | 96 |
© 2020 by the authors. Licensee MDPI, Basel, Switzerland. This article is an open access article distributed under the terms and conditions of the Creative Commons Attribution (CC BY) license (http://creativecommons.org/licenses/by/4.0/).
Share and Cite
Salvador, R.; Tanquilut, N.; Na Lampang, K.; Chaisowwong, W.; Pfeiffer, D.; Punyapornwithaya, V. Identification of High-Risk Areas for the Spread of Highly Pathogenic Avian Influenza in Central Luzon, Philippines. Vet. Sci. 2020, 7, 107. https://doi.org/10.3390/vetsci7030107
Salvador R, Tanquilut N, Na Lampang K, Chaisowwong W, Pfeiffer D, Punyapornwithaya V. Identification of High-Risk Areas for the Spread of Highly Pathogenic Avian Influenza in Central Luzon, Philippines. Veterinary Sciences. 2020; 7(3):107. https://doi.org/10.3390/vetsci7030107
Chicago/Turabian StyleSalvador, Roderick, Neil Tanquilut, Kannika Na Lampang, Warangkhana Chaisowwong, Dirk Pfeiffer, and Veerasak Punyapornwithaya. 2020. "Identification of High-Risk Areas for the Spread of Highly Pathogenic Avian Influenza in Central Luzon, Philippines" Veterinary Sciences 7, no. 3: 107. https://doi.org/10.3390/vetsci7030107