Article

Real Time Predictive and Adaptive Hybrid Powertrain Control Development via Neuroevolution

1
Department of Mechanical Engineering-Engineering Mechanics, Michigan Technological University, Houghton, MI 49931, USA
2
Department of Applied Computing, Michigan Technological University, Houghton, MI 49931, USA
3
Department of Electrical and Computer Engineering, Michigan Technological University, Houghton, MI 49931, USA
4
XLFleet, Wixom, MI 48393, USA
*
Author to whom correspondence should be addressed.
Current address: Department of Mechanical Engineering-Engineering Mechanic, Michigan Technological University, Houghton, MI 49931, USA.
Vehicles 2022, 4(4), 942-956; https://doi.org/10.3390/vehicles4040051
Submission received: 28 August 2022 / Revised: 8 September 2022 / Accepted: 16 September 2022 / Published: 22 September 2022
(This article belongs to the Special Issue Feature Papers in Vehicles)

Abstract

:
The real-time application of powertrain-based predictive energy management (PrEM) brings the prospect of additional energy savings for hybrid powertrains. Torque split optimal control methodologies have been a focus in the automotive industry and academia for many years. Their real-time application in modern vehicles is, however, still lagging behind. While conventional exact and non-exact optimal control techniques such as Dynamic Programming and Model Predictive Control have been demonstrated, they suffer from the curse of dimensionality and quickly display limitations with high system complexity and highly stochastic environment operation. This paper demonstrates that Neuroevolution associated drive cycle classification algorithms can infer optimal control strategies for any system complexity and environment, hence streamlining and speeding up the control development process. Neuroevolution also circumvents the integration of low fidelity online plant models, further avoiding prohibitive embedded computing requirements and fidelity loss. This brings the prospect of optimal control to complex multi-physics system applications. The methodology presented here covers the development of the drive cycles used to train and validate the neurocontrollers and classifiers, as well as the application of the Neuroevolution process.

1. Introduction

Hybrid electric vehicles (HEV) are often optimized and calibrated around a standard set of drive cycles such as the Environmental Protection Agency (EPA) Federal Test Procedure (FTP75), Highway Fuel Economy Test (HWFET), and Supplemental Federal Test Procedure (US06, SC03 cycles). Due to the stochastic nature of real-world driving conditions and its effect on fuel economy [1], adaptively changing torque split calibration on the fly is of interest. The academia and the automotive industry have proposed various optimal control strategy derivation techniques throughout the years [2]. Notably, Dynamic Programming (DP) has been applied to hybrid and plugin-hybrid (PHEV) control strategies [3,4]. As exact optimization methods require higher computing resources, their real-time embedded implementations are especially compromised. To remedy this, new methods have used DP as a training source for Neural Networks [5] or combined its process with Reinforcement Learning [6]. Receding Horizons of different sizes also have demonstrated lowering computing requirement of DP [7]. However, translating accurate physics within a DP language is time consuming and, in general, ignores multi-physics interactions by design. Alternatively, non-exact methods such as Model Predictive Control (MPC) based algorithms have been developed to enable real-time applications [8,9,10]. However, MPC also requires the development of a set of simplified equations of state set to reduce the optimization run-time, thus inducing inaccuracies. This also limits their application to short local rolling e-Horizons, neglecting the full route information and hence the potential for further fuel economy reduction. In this paper, we show that Neuroevolution (NE) can learn directly from the complex system behavior within its stochastic operating environment without the necessity for any system and/or subsystem model simplification. Indeed, it treats the system’s model as a black box, enabling high fidelity, multi-physics modeling to be used in the training process if desired. Recently in the powertrain field, DP and Neuroevolution have been jointly used for transmission shift optimization [11]. This paper demonstrates that a NE controller can generate optimal strategy without optimum external knowledge (such as DP) while performing faster than in real-time. We show that NE is easily parameterizable and hence effectively capable of interactive cooperation with Machine Learning (ML) based features such as drive cycle classification. In this paper’s materials Section 2, the heuristics used to generate a base controller architecture are discussed. The training data generation process is explained. Additionally, the equations defining the training plant model are provided in reference to the chosen hybrid architecture. In the Methods’ Section 3, the Neuroevolution process is presented as well as the application of clustering aimed at enhancing the NE controller adaptive behavior. Results are demonstrated across the training and validation sets and detailed drive cycle analysis is provided. Finally, the paper discusses the advantage of Neuroevolution and concludes on the future usage of this technique.

2. Materials

Ideally, a controller or agent shall instinctively react to stimuli from its immediate surrounding, shall have an understanding of how to survive in its operating environment, and be able to use short-term foresight to detect operating deviations so as to locally reassess its survival strategy. Knowledge and foresight provide the robustness needed for an agent’s “survival” in a dynamic environment. The proposed NE controller architecture is designed based upon these heuristics. While neuroevolution is theoretically capable, given a large amount of evolution time, of deriving an entirely new architecture, engineering judgment is used here to define the base NE structure. Three intelligence sources are defined to support its operation:
  • First, the NE controller input layer receives an instantaneous stream of stimuli in the form of vehicle and powertrain sensor signals.
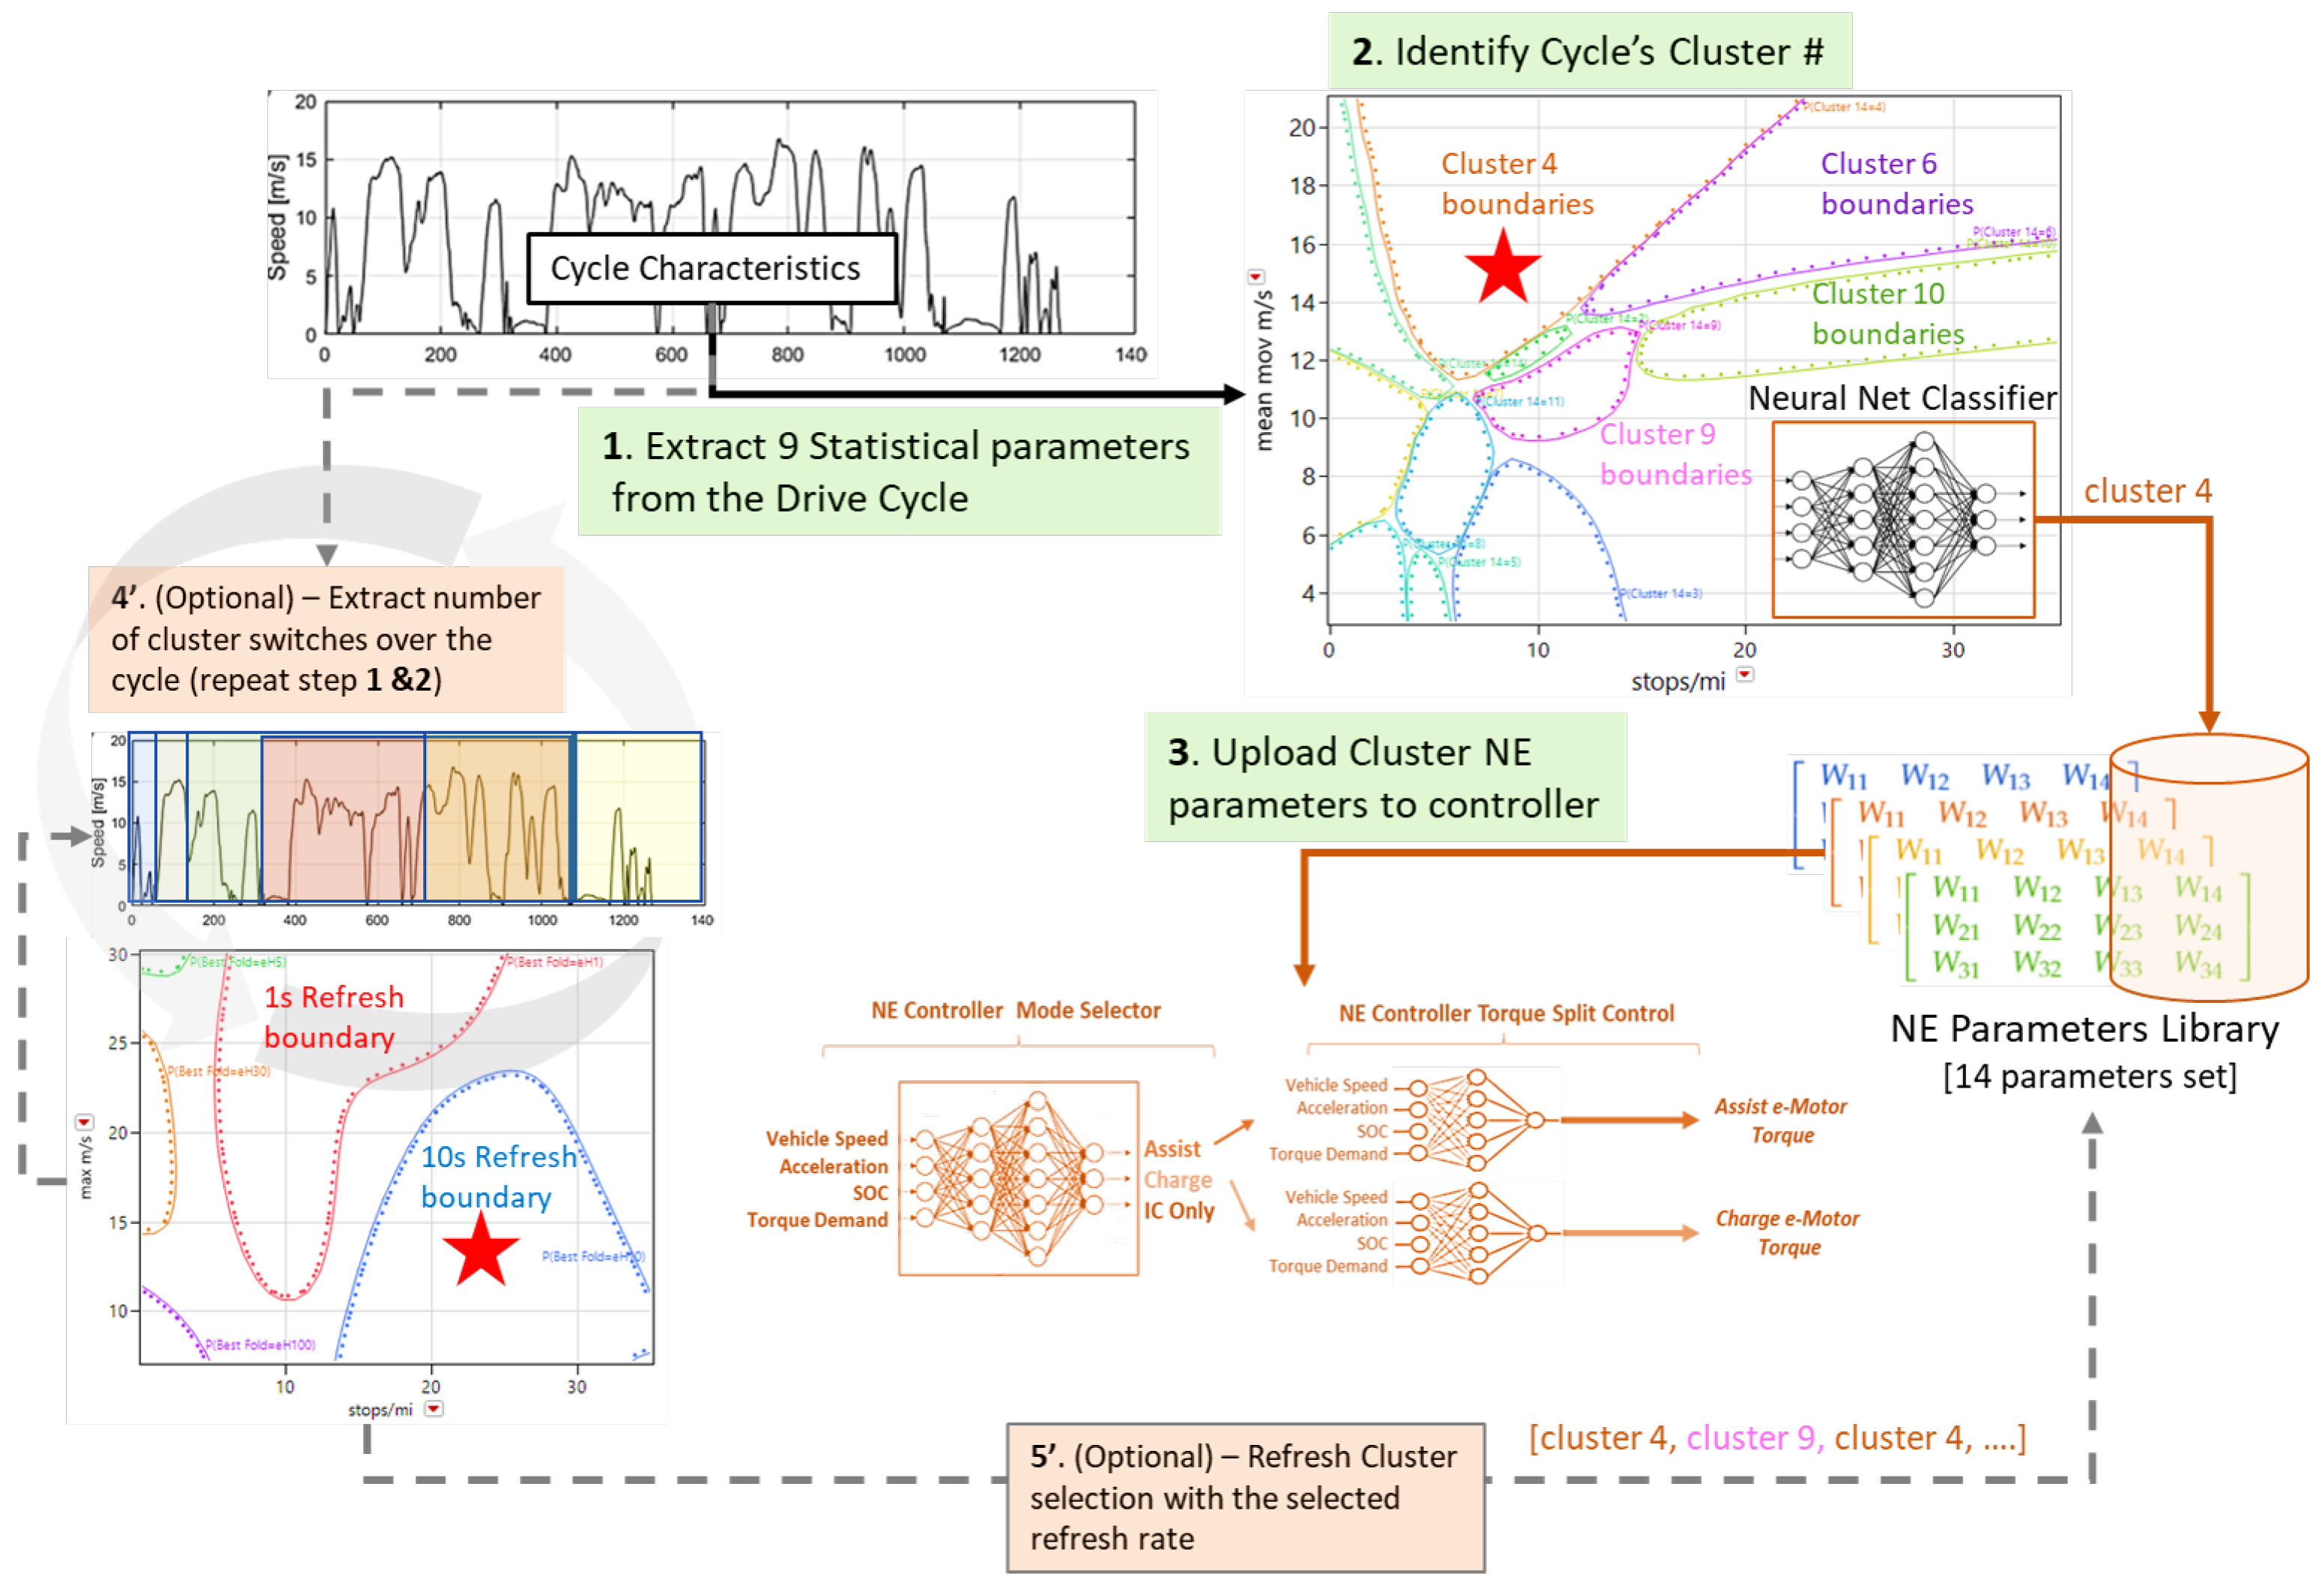
  • Second, NE internal parameters (weights, bias, and activation functions) are adaptively uploaded to the NE controller based on the current route classification results. We assume here that the route is known, for example, via a GPS based eco-routing function.
  • Third, a local e-Horizon re-classification feature fine-tunes the NE controller behavior. This provides local intelligence to temporarily modify the torque split strategy if needed.
For example, suppose that the classifier detects a highway driving type cycle at the start of a trip. The classifier uploads the NE parameters associated with highway driving characteristics to the controller. The NE parameters are refreshed if the driving characteristics are temporarily classified differently. This example may occur when traffic increases and lower and more fluctuating speeds are encountered on the route. To start the classification model development, a large number of drive cycles representing real-world operations are generated. These will also support the NE controller learning and validation phases. The development of a process to generate thousands of drive cycles using information from the vehicle target usage is proposed here. A large amount of driving data is available for this study. Real-world drive cycle histograms are generated using XLFleet’s extensive telemetry databases. The data spans from 2019–2022 across more than 4000 HEV and PHEV vehicles as used in a wide range of applications by more than a hundred distinct fleets across North America. Sample van data is shown in Figure 1. Delivery trips are extracted as our target application.
We generated additional delivery drive cycles trace by stitching donor speed traces together. The donor speed traces come from extracting “hills” from a 1 Hz drive cycle database. A hill is defined as a segment with zero starting and ending speed. Around five hundred hills are generated. A Monte Carlo (MC) simulation is used to randomly recombine these hills into a set of new cycles, as shown in Figure 2. The MC uses a uniform distribution to concatenate a random number of hills into a new drive cycle. Two thousand cycles are generated at a time through this process. Cycles not fitting the delivery van statistical target range are rejected, and so on. Finally, 2200 cycles are retained, from which two hundred are used for the NE training, and the remaining are kept for the validation phase. Note that the data includes many type of drivers and therefore no specific driver habit was targeted at this time.
The target powertrain application is a P3 HEV van with the characteristics shown in Figure 3. A backward-looking [12] quasi-static (QS) model is used for training and validation purposes. This high fidelity model was correlated with test data on real-world drive cycles and contained a proprietary XLFleet dynamic fuel map model, which accounts for engine operation rate of change. This is critical in assessing different HEV assist and charging strategies that will influence the transient characteristics of the engine and hence its dynamic fueling response. The QS method enables fast run time for training which is advantageous when offline computing power is limited. The QS simulation model is partially based on the following equations, here leading to the Torque split calculation:
  • The road force F is computed for each time step based on the target velocity v. This enables the exact same road load computation for every simulation iteration as it removes driver model noise.
    F = 1 2 · r h o · C d A · v 2 + m · g · R R · cos ( r a d ) + ( m + m e ) · a + m · g · sin ( r a d ) ,
    where ρ is the density of air, a is the acceleration, C d A is the aerodynamic coefficient multiplied by the vehicle frontal area, m and m e are the mass and equivalent mass, R R is the rolling resistance coefficient, and r a d is the road grade angle.
    m e = I v r 2 + I e · F D R R 2 · g e a r R 2 r 2 ,
    where I v and I e are the drivelines and engine inertia, F D R is the final drive ratio, r is the wheel rolling radius, and g e a r R is the current transmission gear ratio at time t.
  • The demand Torque T o at the transmission output (and e-motor) is computed as:
    T o = F · r ( F D R R ) · μ F D R ,
    where F D R R and μ F D R are the final drive ratio and efficiency, respectively.
  • T o must be matched by a combination of the engine torque T e and e-motor torque T e m :
    T o = T e · μ T R · T R + T e m ,
    where T R and μ T R are the transmission ratio and efficiency, respectively. The goal is to find the optimal torque split T r a t i o ratio at each time step to reduce fuel consumption.
    T r a t i o = T e m / T o .

3. Methods

Neuroevolution is defined as the process of tuning the behavior of a neural network architecture [13] while optimizing for an objective function, including multi-objective tasks [14]. The process includes evolving the neural network architecture, weights, biases, and activation functions. Early on, Neuroevolution learning was demonstrated for its ability to learn and master playing video games [15,16]. More recently, engineering-based publications have shown interest in Neuroevolution of Augmented Topology (NEAT) for antenna beam forming control [17], and UAV autonomous soaring applications [18]. At this time, the lack of explainability and transparency are key disadvantages to AI applications in general. Applying engineering judgment and system engineering best practices is preferred when integrating neural networks into powertrain control systems. Hence a fixed topology is defined, which resembles the current control architecture. Three base Neural Networks (Figure 4) are integrated within the base NE controller according to the heuristics and methodology presented in the introduction section:
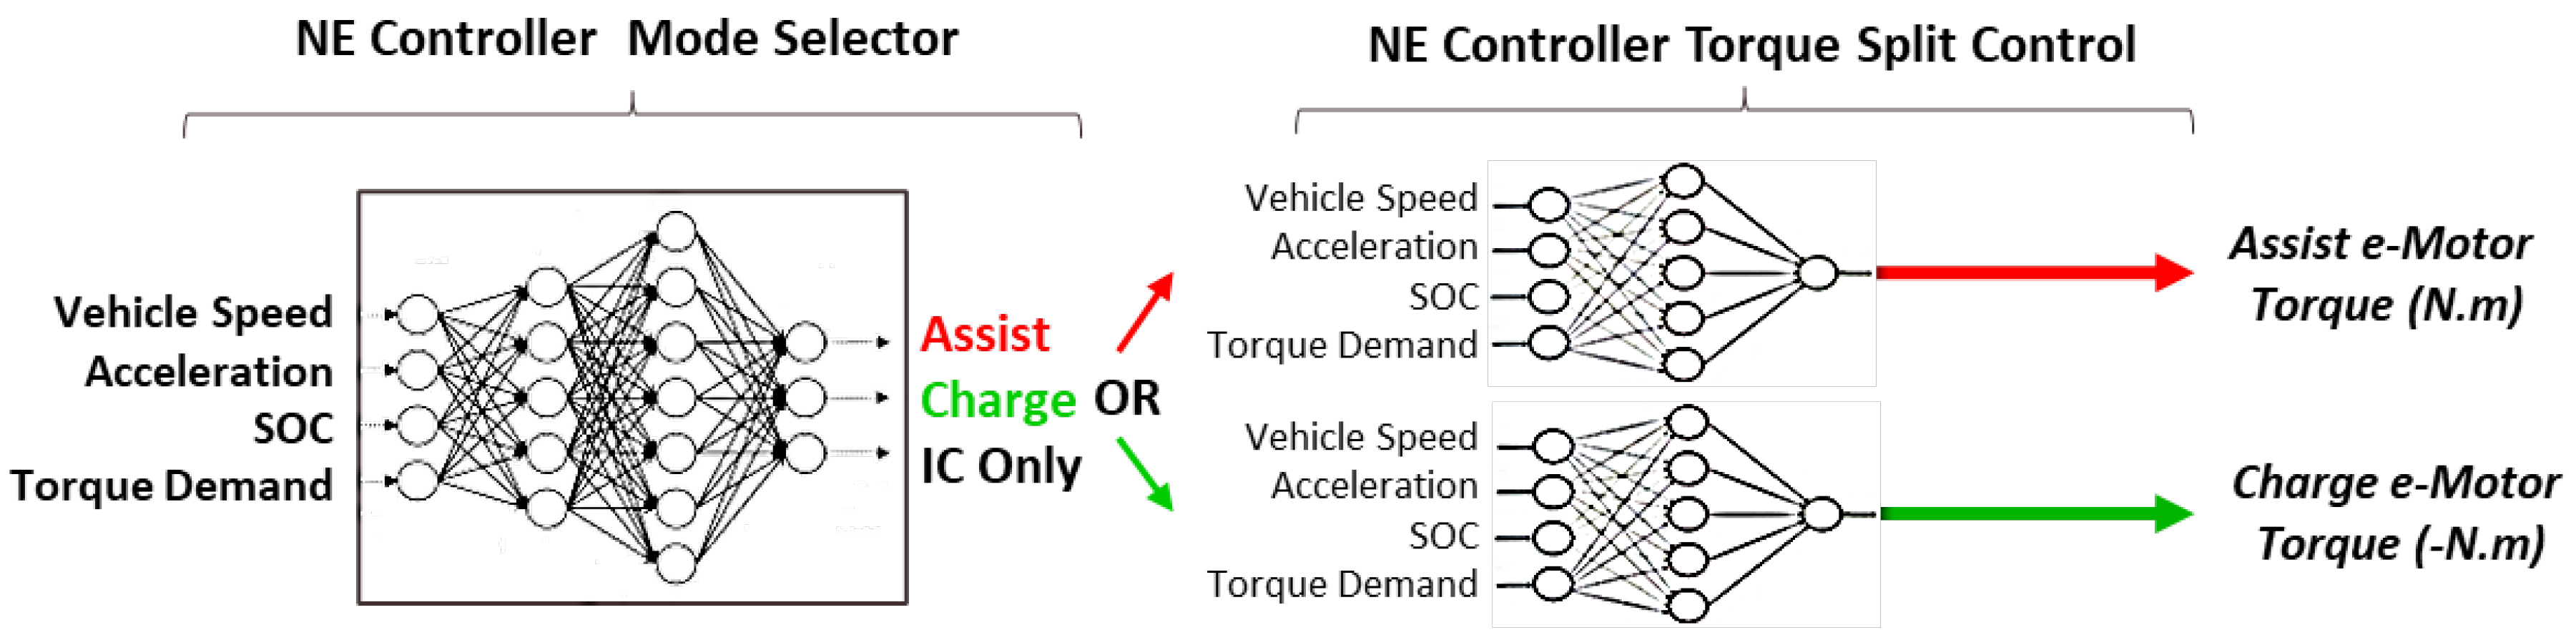
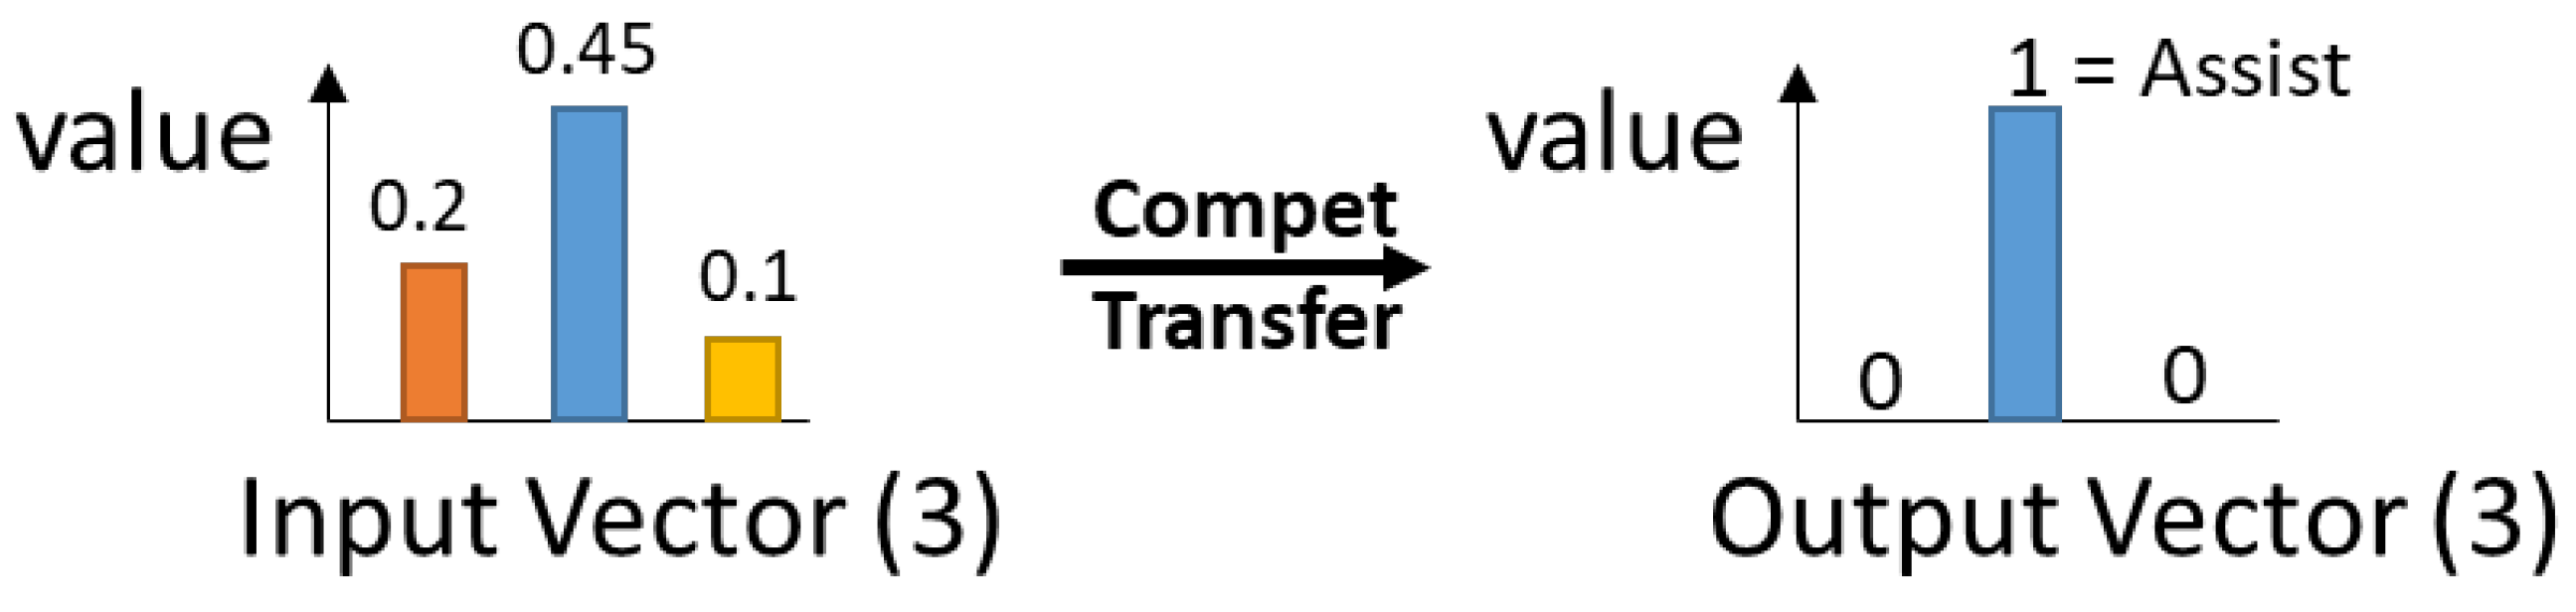
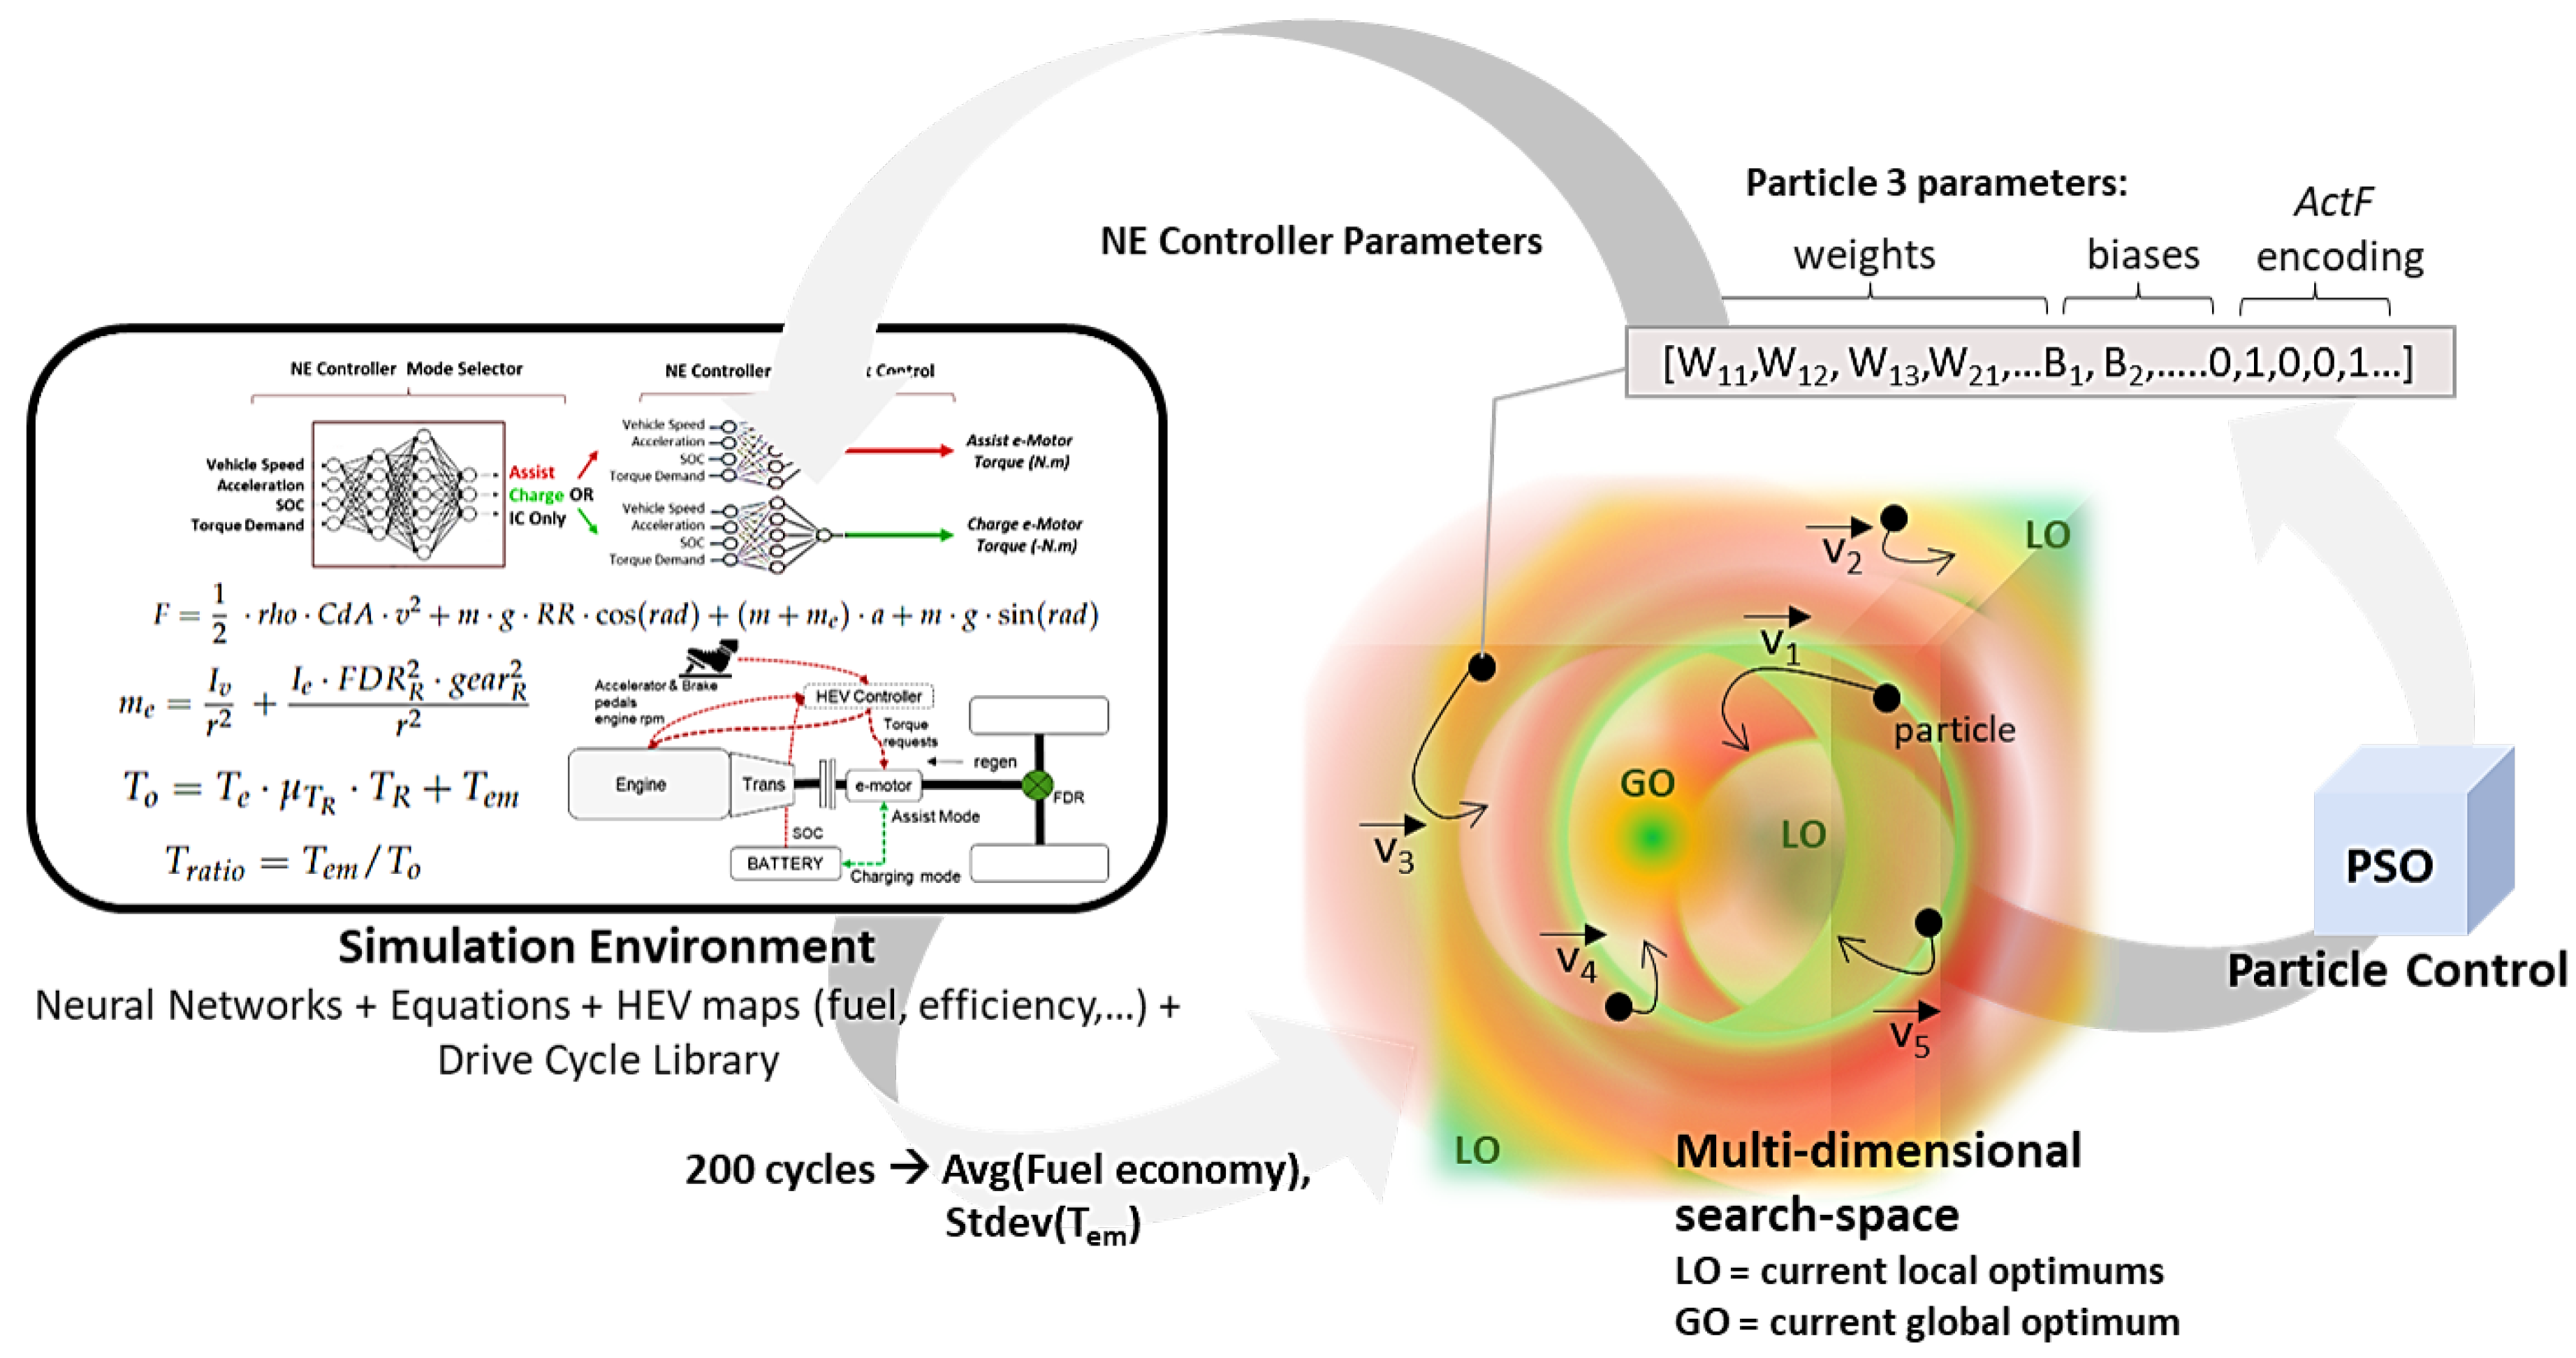
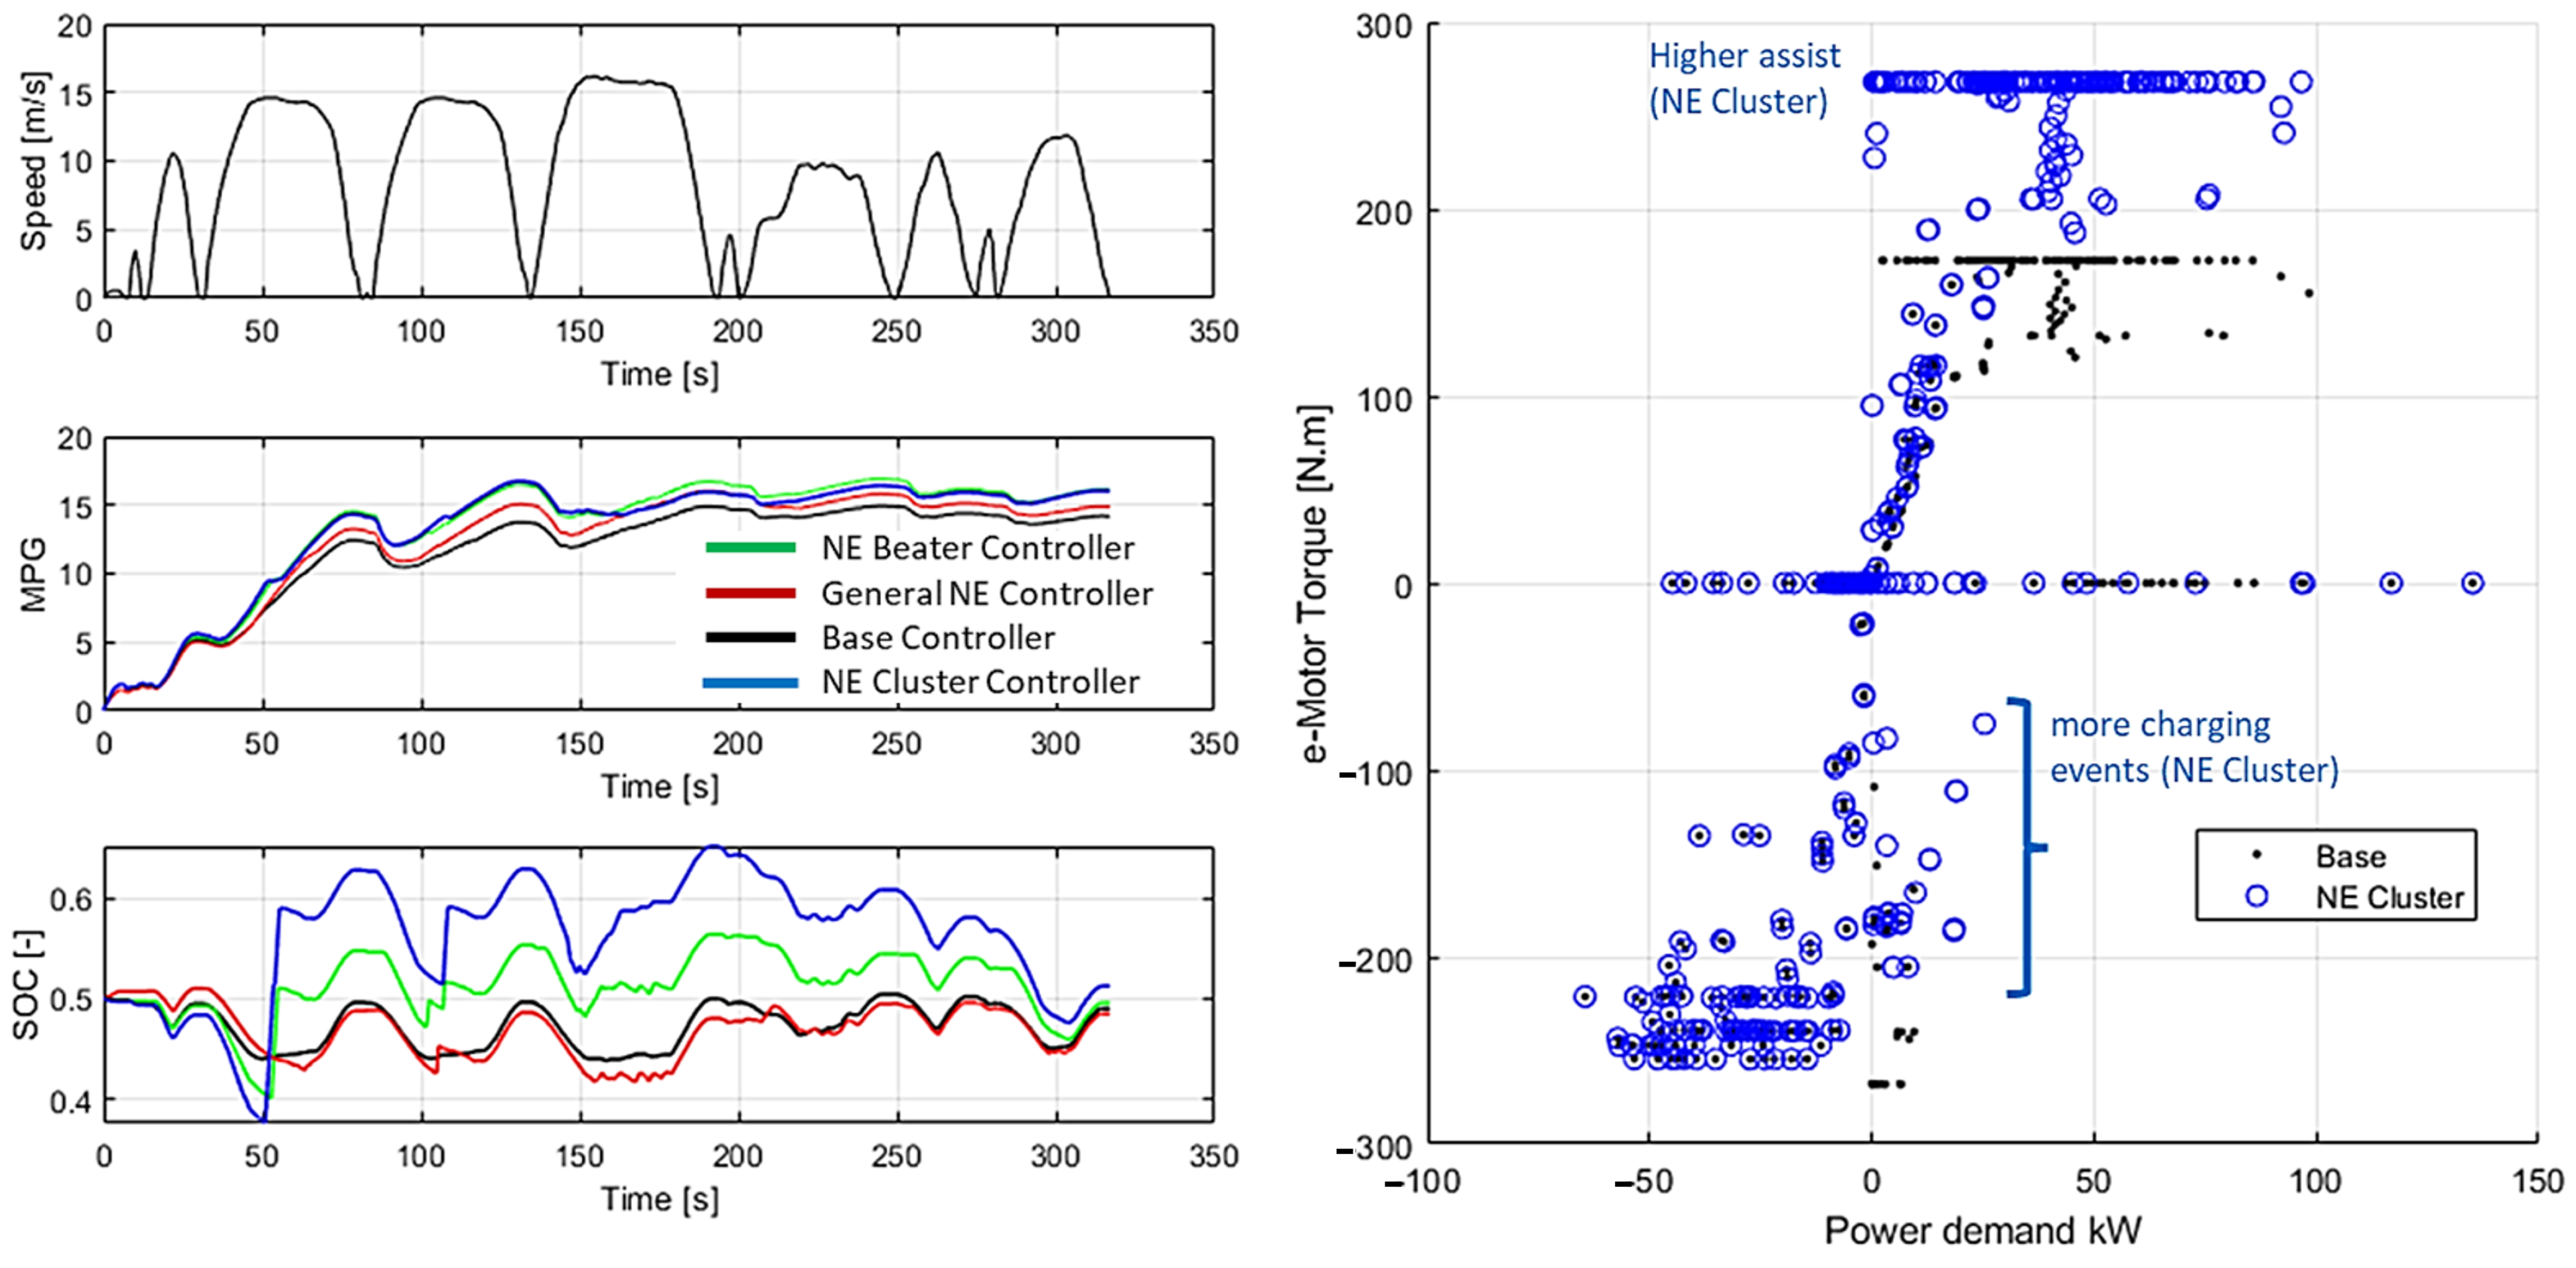
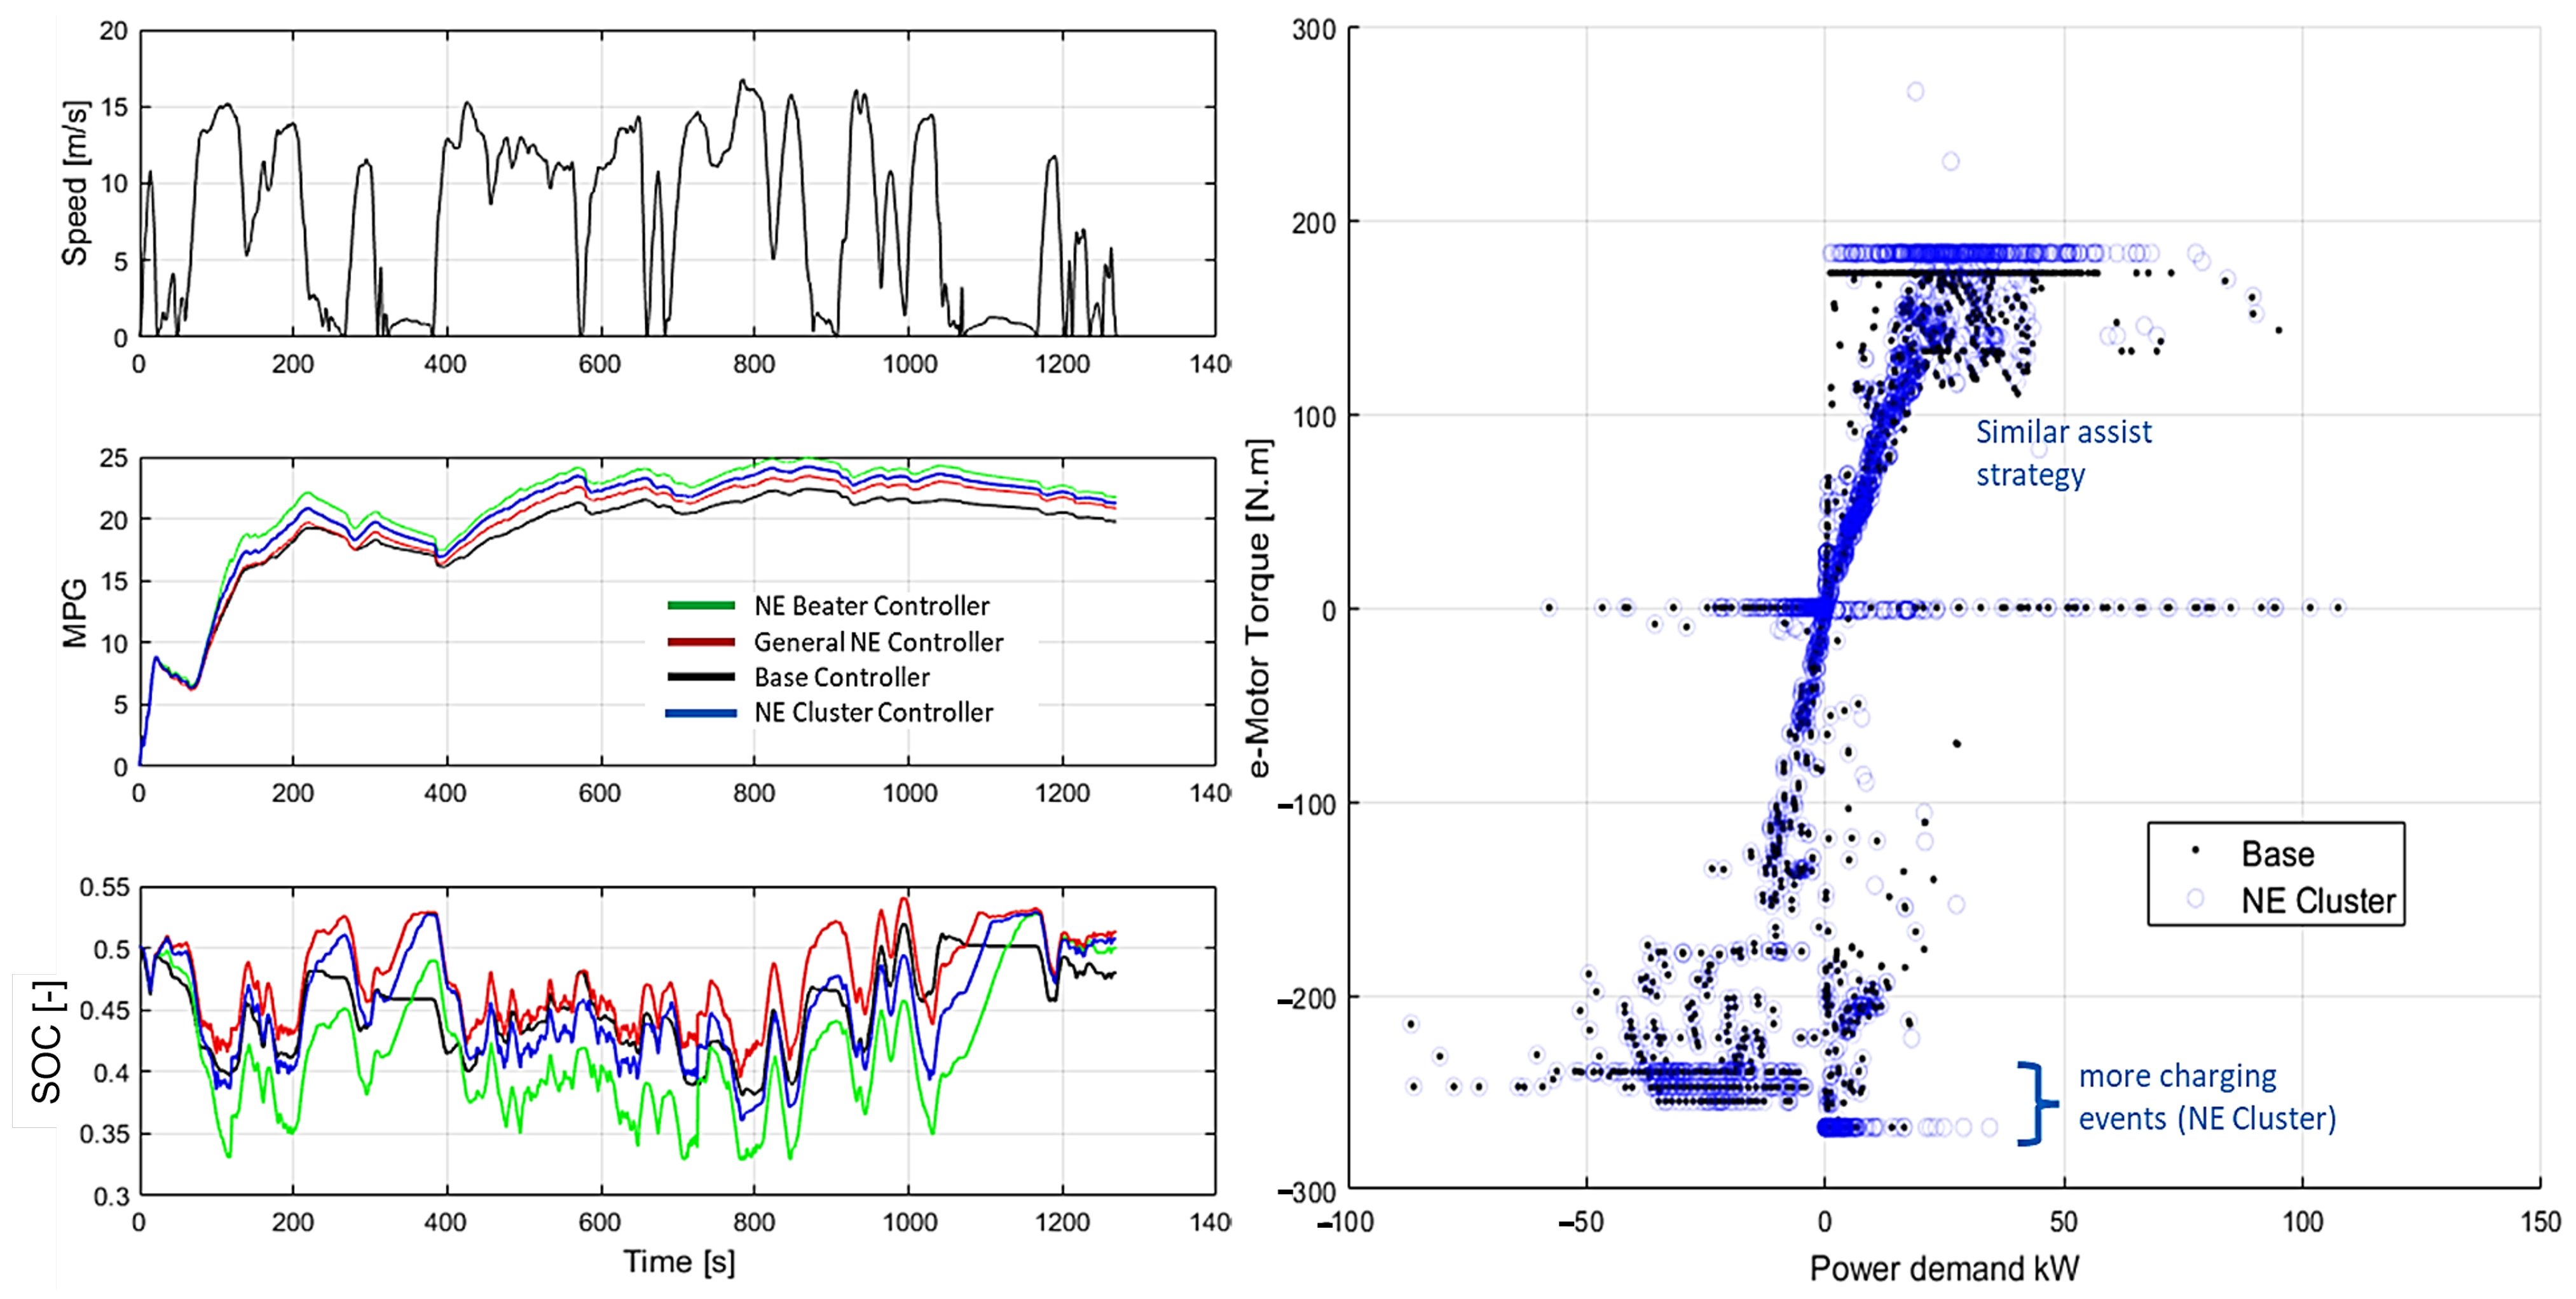
  • The mode switch neural network is used to decide between HEV modes, i.e. between operating with the Internal Combustion (IC) engine only, assisting the IC engine (including full electric mode), or charging the battery (engine charging mode). Brake regeneration is driven by the original controller braking energy strategy, which is kept unchanged. This neural network uses a competitive transfer function to select the HEV mode based on three output node values (IC only, Assist, Charge).
  • Two neural networks, one for the engine assist mode, and one for the engine charging mode, output the level of Torque split to apply relative to the driver demand and powertrain states. These are selectively activated based on the main neural network mode output. The assist neural network outputs a positive torque value in N.m, with a maximum value of 270 N.m. The charging neural network outputs a negative torque value with a maximum of −270 N.m. This provides the mechanism to charge the battery by increasing the demand on the engine. They are both deactivated when in IC-only mode, with a corresponding torque split of zero.
Each Neural Network shares the same instantaneous input information. This includes current vehicle speed and acceleration, battery state of charge (SOC), and driver torque demand. Therefore the input layer vector IN [1 × 4] is constructed as:
IN = v v m a x a a m a x s o c s o c m a x T o T o m a x ,
Note that each of the inputs is normalized to keep their range between [0, 1]. For example, a 3 node first hidden layer IH 1 output with a linear activation function is computed as:
IH 1 = IN · W 11 W 12 W 13 W 14 W 21 W 22 W 23 W 24 W 31 W 32 W 33 W 34 + B i a s I H 1 ,
The mode selection neural net output layer (with 3 nodes) uses a competitive activation function that retains the node number with the highest value. This function transfer works as shown in Figure 5.
For example, if the mode selection calls for the Assist mode, the Assist neural net will output a Torque value between 0 and 1. Assuming there are three nodes in the previously hidden layer of a two hidden layer network for simplicity, the output layer would compute as:
H O a s s i s t = A c t F [ H 1 H 2 · W o 11 W o 21 W o 31 + B i a s H O ] ,
where the A c t F is the activation function.
Therefore,
T e m = min ( H O a s s i s t · T o , T e m m a x ) ,
where T e m m a x is the maximum torque of the e-motor at the current transmission output speed. The final e-motor assist torque value further depends on the battery SOC and operating limits.
Starting with the base NE architecture, the weights, biases, and activation functions are tuned during the learning process. This step is driven by a Particle Swarm Optimization (PSO) [19]. Eighty-one weights and biases are optimized simultaneously. Each layer’s activation functions ( A c t F ) account for additional parameters with two possible values: ReLU (Rectified Linear Unit) or Linear for minimum compute cost:
L i n e a r ( a ) = a ,
R e L U ( a ) = max ( 0 , a ) .
The PSO varies these parameters using a total of 108 particles for each optimization iteration. The 200 training cycles are simulated using each particle encoded control strategy. Each particle returns the mean percent fuel economy benefit (HEV vs. base non-hybrid vehicle) to the objective function. The objective function also includes the standard deviation of T e m to minimize noisy torque responses. Based on the fuel economy benefit, the PSO refines the neural networks’ parameters until the maximum optimization time or objective function convergence is reached. The maximum optimization time is limited to ten hours on a 36-core total dual Xeon Gold computer with a 128GB RAM. The resulting optimum set of parameters will be designated here as the General NE controller parameters as they are optimized across the entire training drive cycle set.
The PSO driven training algorithm (See Figure 6) is summarized below:
  • 108 Swarm particles are initialized with random weight, bias, and activation function encoding values. If transfer learning is applied, one or more particles are initially set with the donor NE controller parameter array.
  • NE controllers are uploaded to the drive cycle simulation with their corresponding tuning parameters.
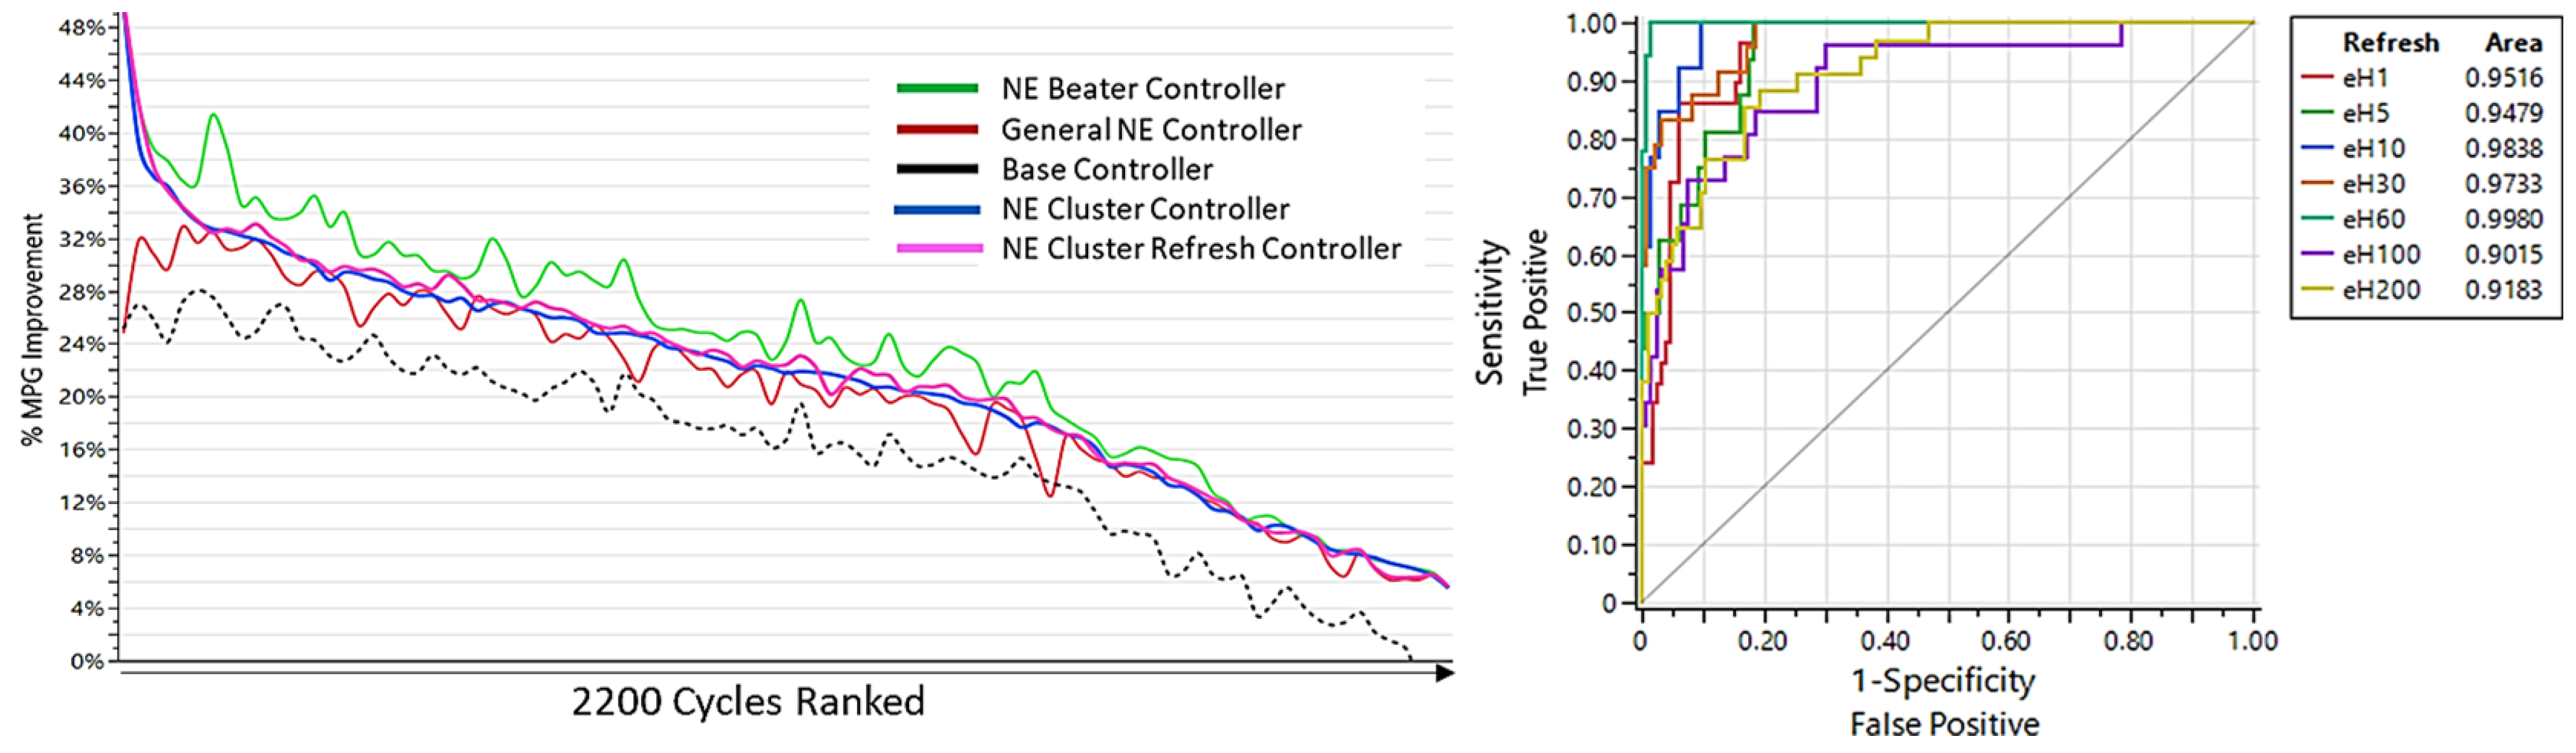
  • For each NE controller, two-hundred cycles are simulated, and the average HEV fuel economy benefit and T e m standard deviation is computed and fed back in the optimization loop.
  • The PSO algorithm modifies the tuning parameters based on the position of the local and global optimum in the search space. This causes a swarming effect while still exploring most of the search space and hence avoiding staying at local optima. This provides a good balance between global and local exploration to keep convergence time within the set limits.
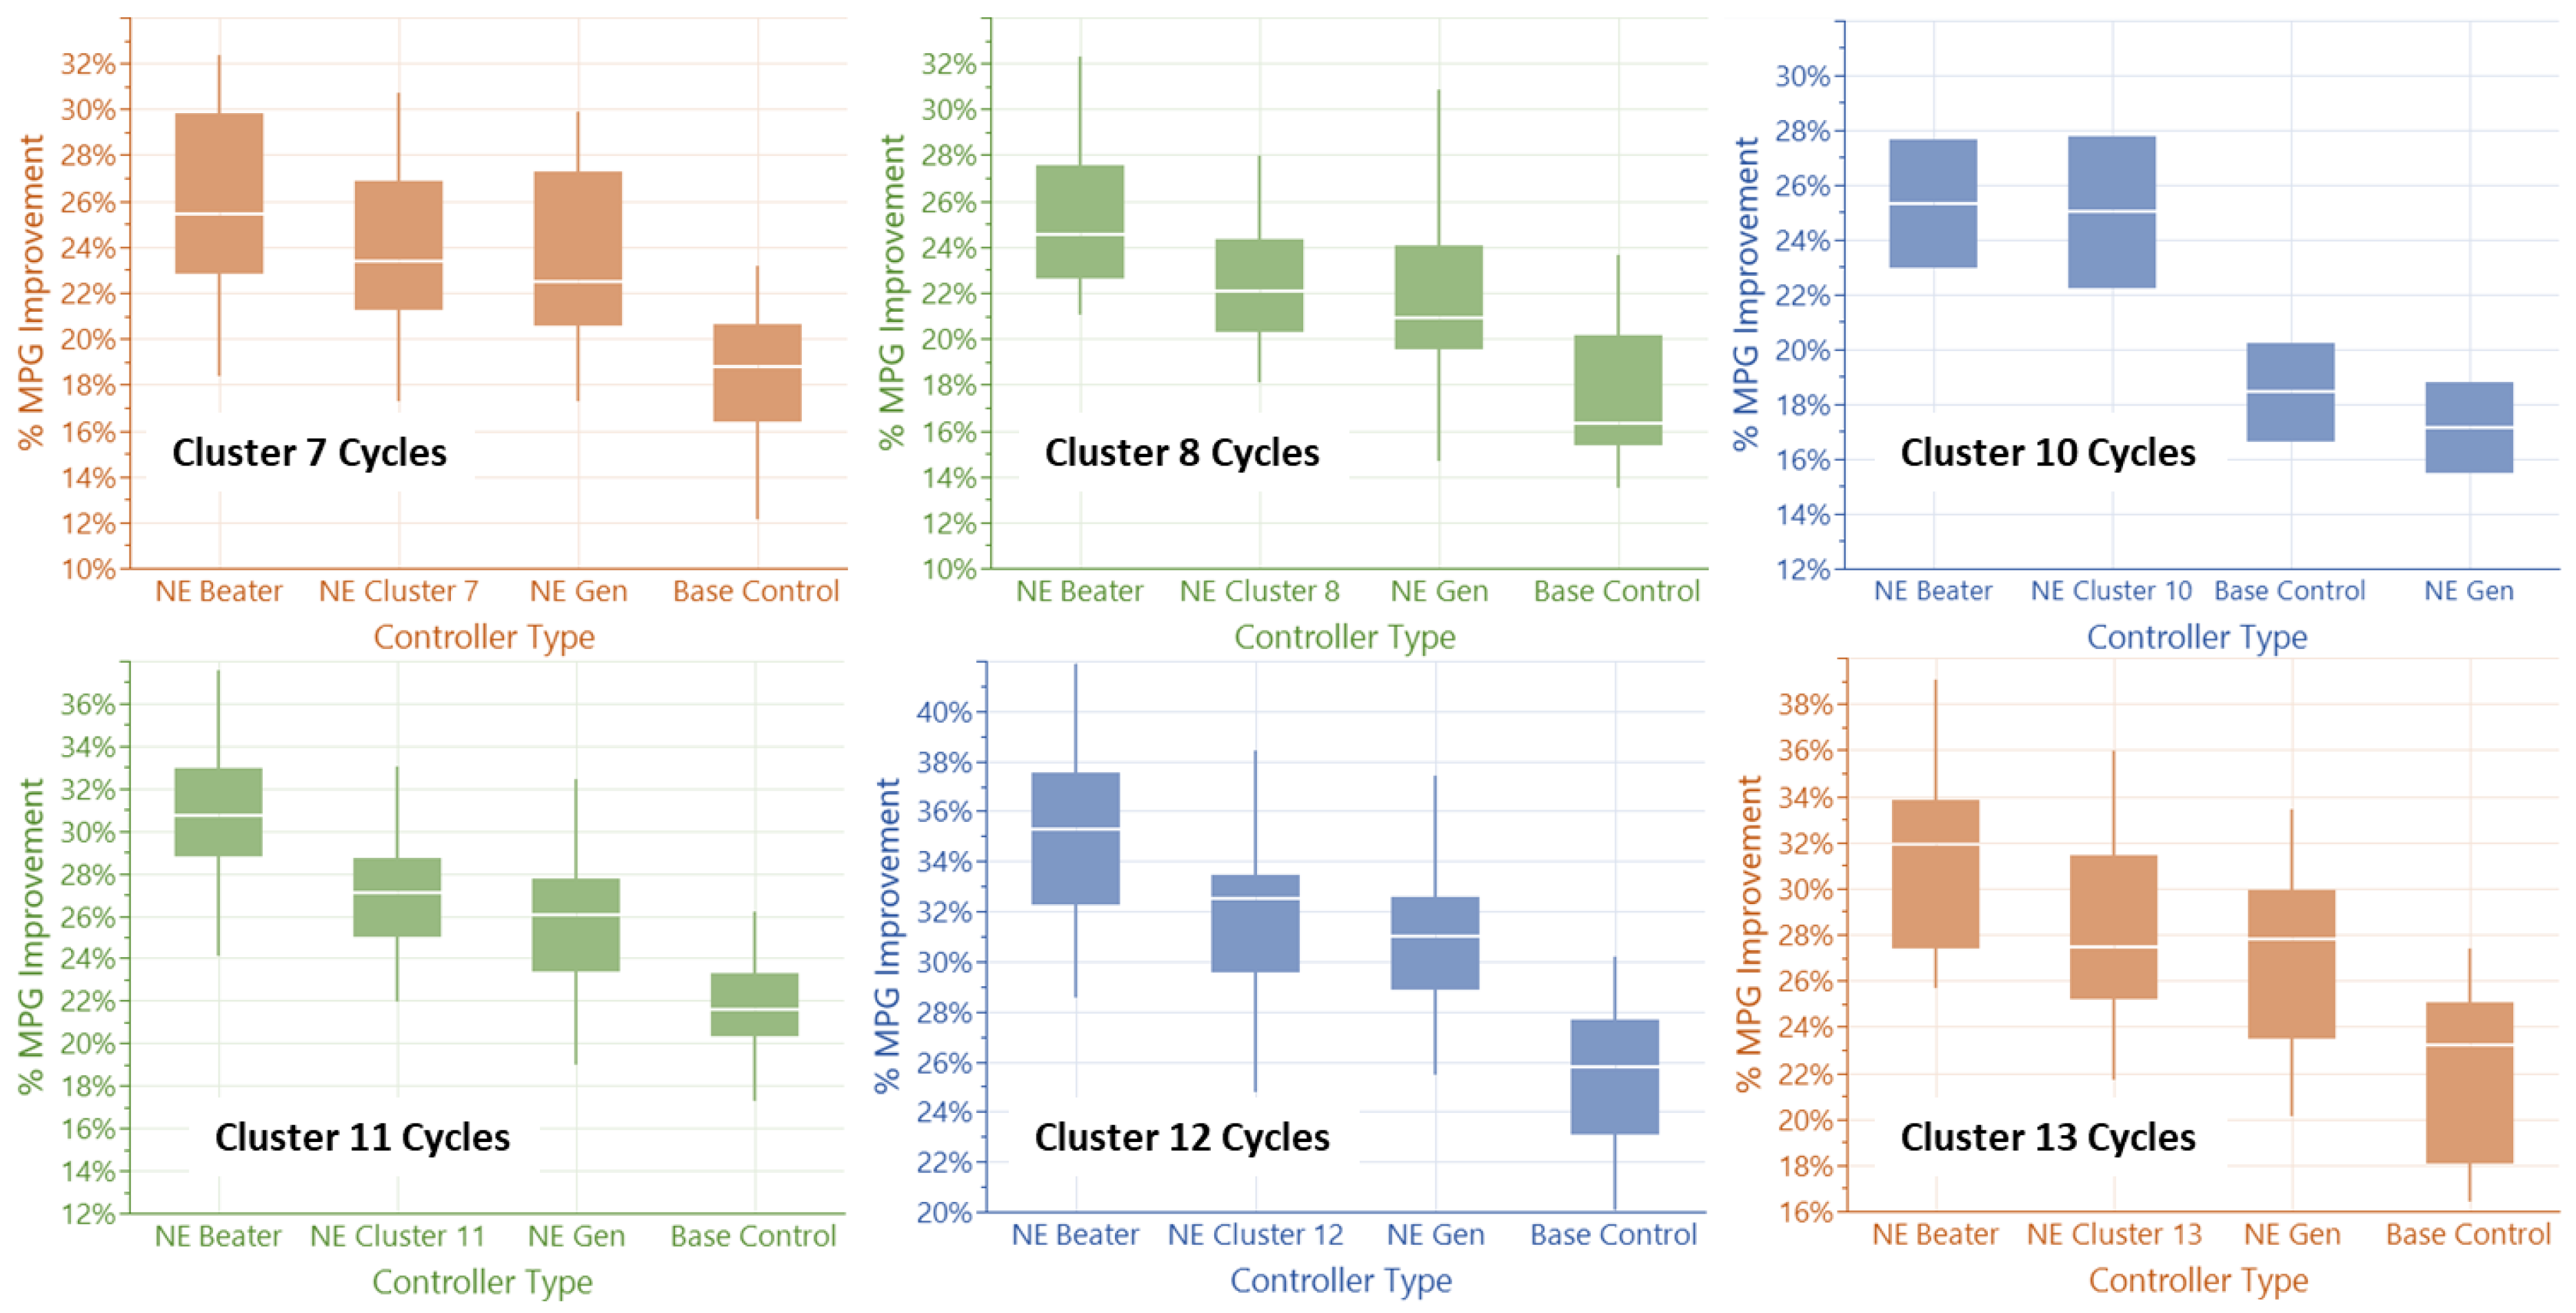
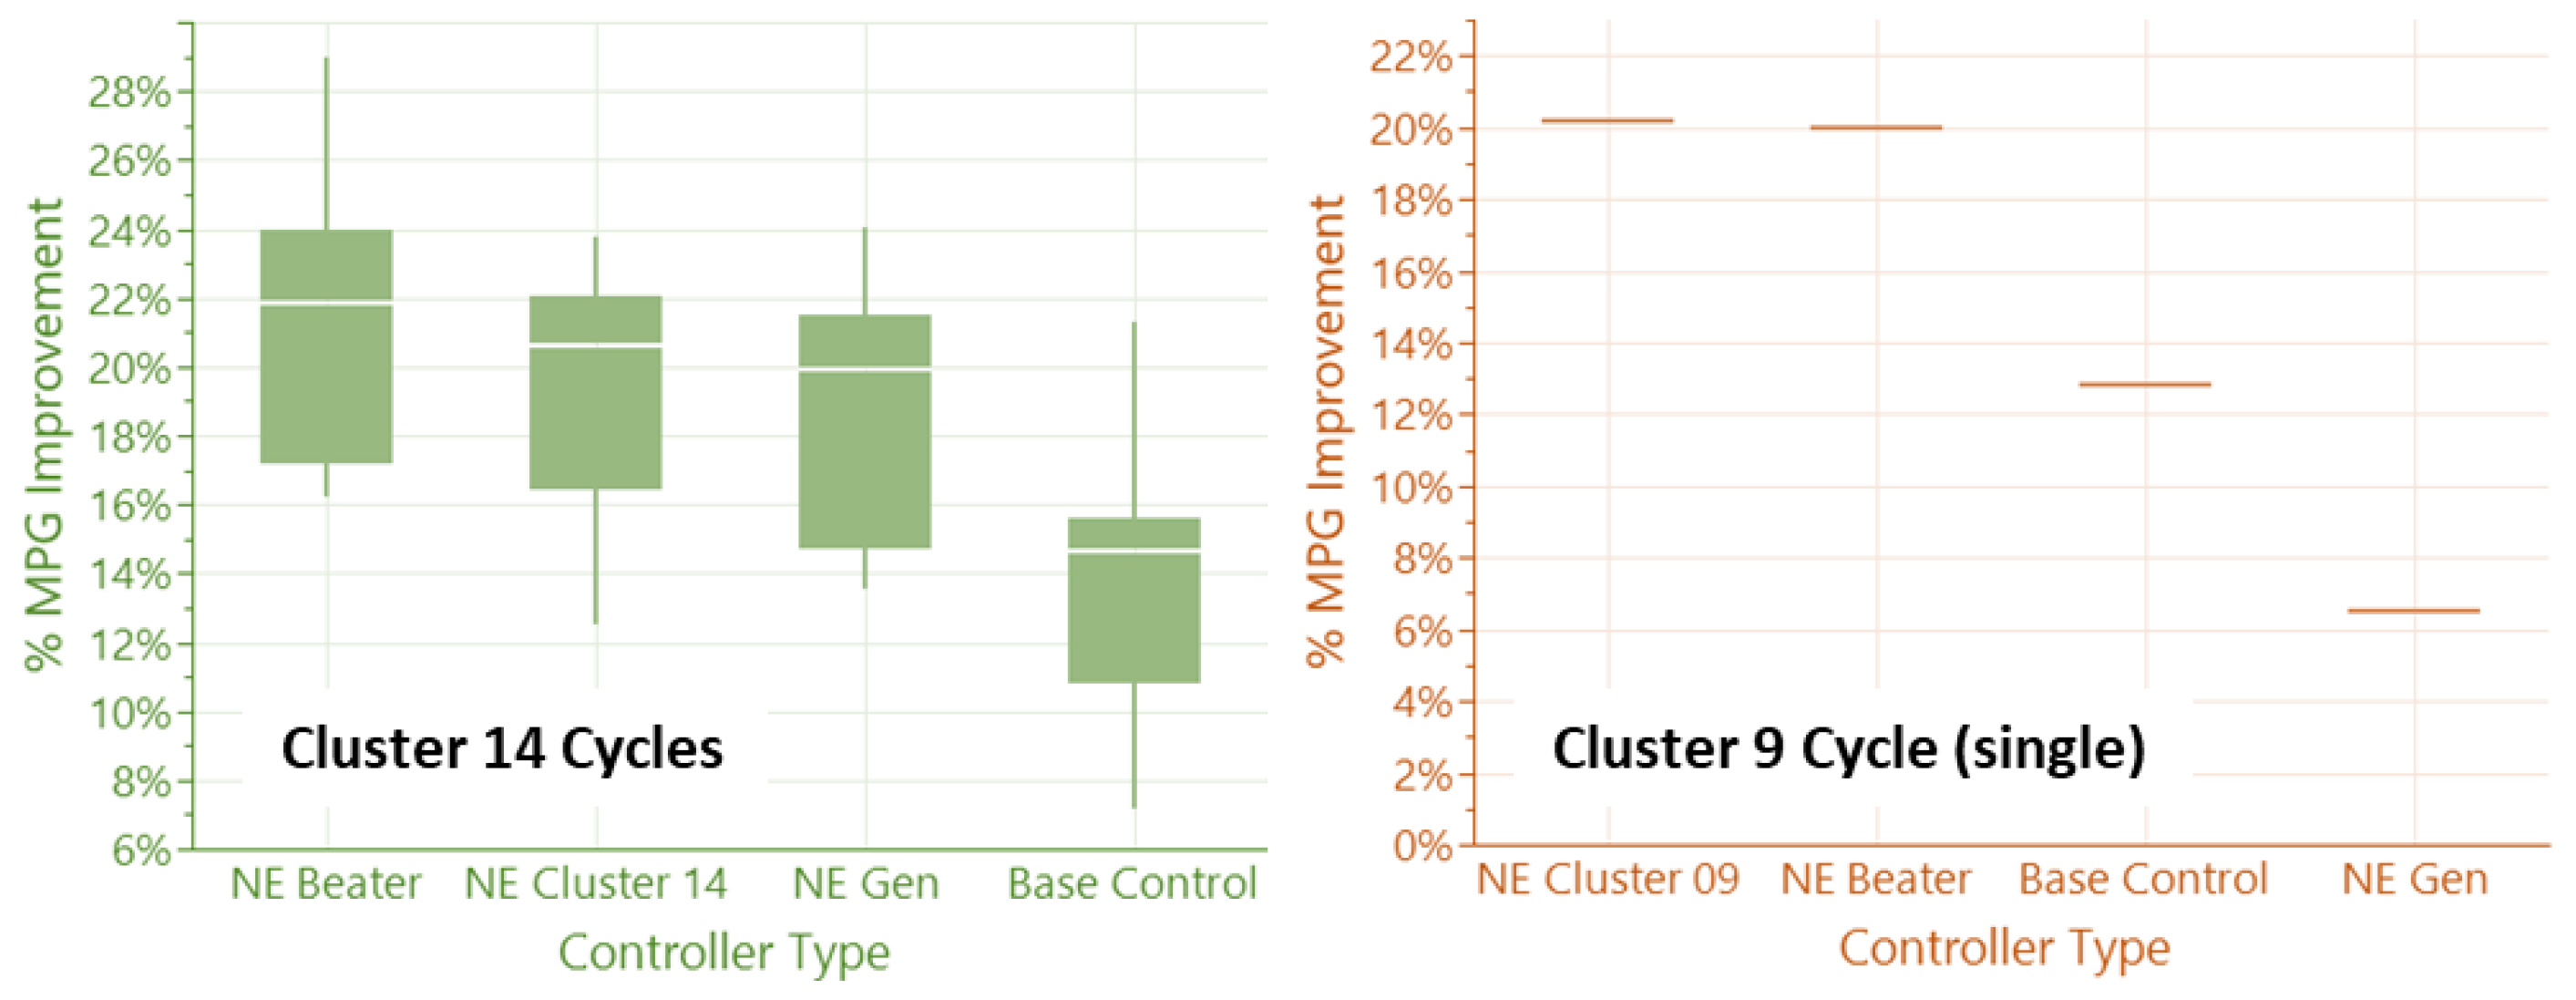
4. Results

The General NE controller outperforms the conventional controller for 95% of the cycles (see Figure 7). Note that MPG is corrected for the end of SOC for all results presented here. Similar to the conventional controller, the General NE controller is constrained by the necessary fuel economy benefit trade off across the different training drive cycles. However, it manages to perform the trade-off in a very effective manner by design since it evolved across a larger selection of scenarios. This performance is also confirmed across the 2000 validation cycles with a similar percentage of success in Figure 7.
To identify the potential fuel economy improvement or optimal gap from the general NE controller, “cycle beater” NE controllers are developed for each of the 200 training cycles. In this step, each cycle is independently used for the derivation of its own optimal NE controller parameters, using the same PSO process. One of the 108 PSO particles is initialized with the general NE controller parameters to promote transfer learning from the general solution. The PSO is only allowed to change the weight and bias of the general NE controller when generating NE Beaters. The maximum optimization time is limited to five minutes for each drive cycle. The resulting controllers consistently outperform both the general NE and the conventional controllers on their associated cycles, as seen in Figure 8.
As the NE controller performs faster than in real-time (simple linear algebra), improvements can be implemented by including Machine Learning (ML) features. Conceptually, drive cycle characteristics would allow identifying which controller to use if a choice existed. In this application, the choice would simply mean that a new set of weights and biases are uploaded to the updated controller (NE Cluster) based on driving conditions. Drive cycle characterization is a key concept in improving the adaptiveness of a control process. Early work on characterizing drive cycles includes the derivation of the Kinetic Intensity [20]. More recently, clustering was used to generate six drive cycle categories among a set of Heavy Duty cycles to improve the flexibility of an Equivalent Consumption Minimization Strategy (ECMS) [21]. We are here proposing a 2-step approach, driven by the fact that drive cycle characteristics alone are too abstracted from the target system, and hence the effectiveness of any hybrid architecture (Series, P2, P3, Powersplit, etc.) and its specific complex control abilities cannot be simplified on the basis of driving statistical data. Hence, optimal control information from the target application is needed as part of the clustering input set. The training cycle NE Beater results are hence used at this stage. K-means is used to generate drive cycle categories (clusters). Note that other methods such as Principal Component Analysis (PCA) were not tested but are obvious candidates for this step. The clusters are generated using ten characteristics for each cycle:
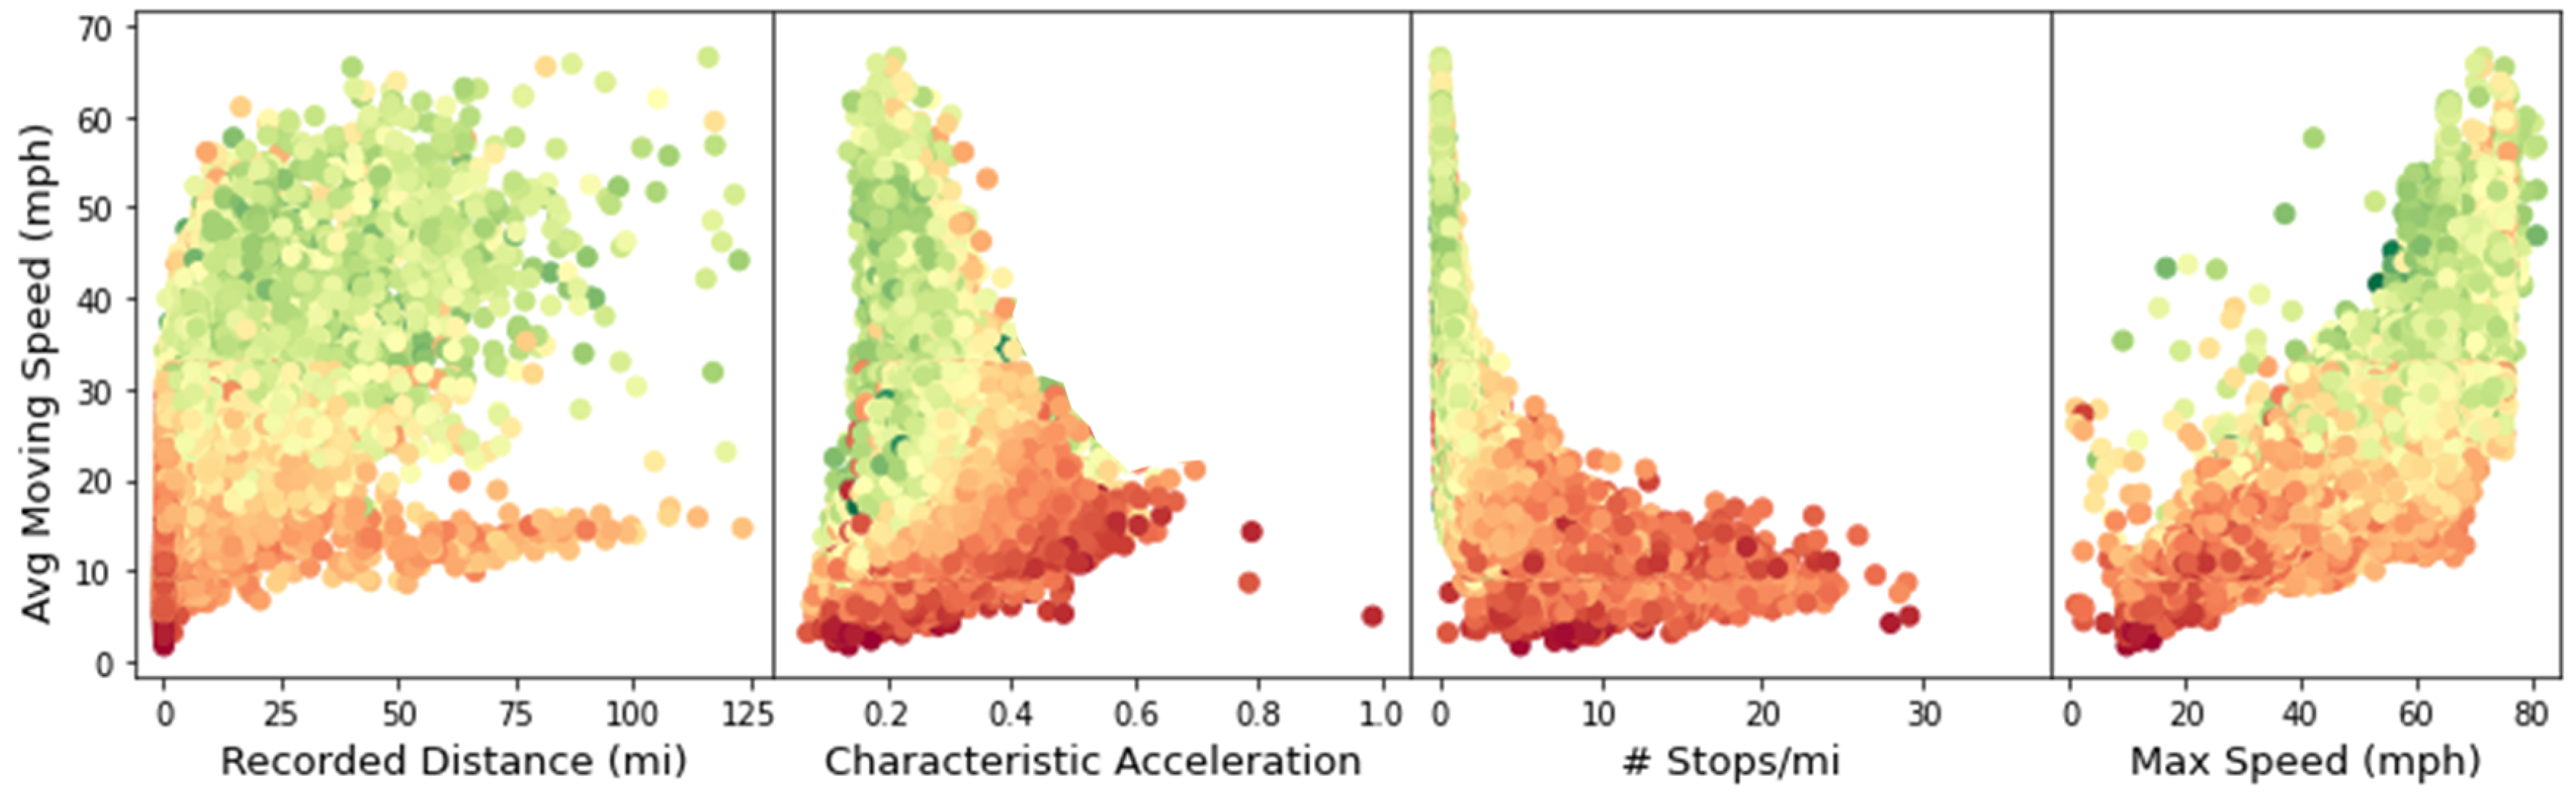
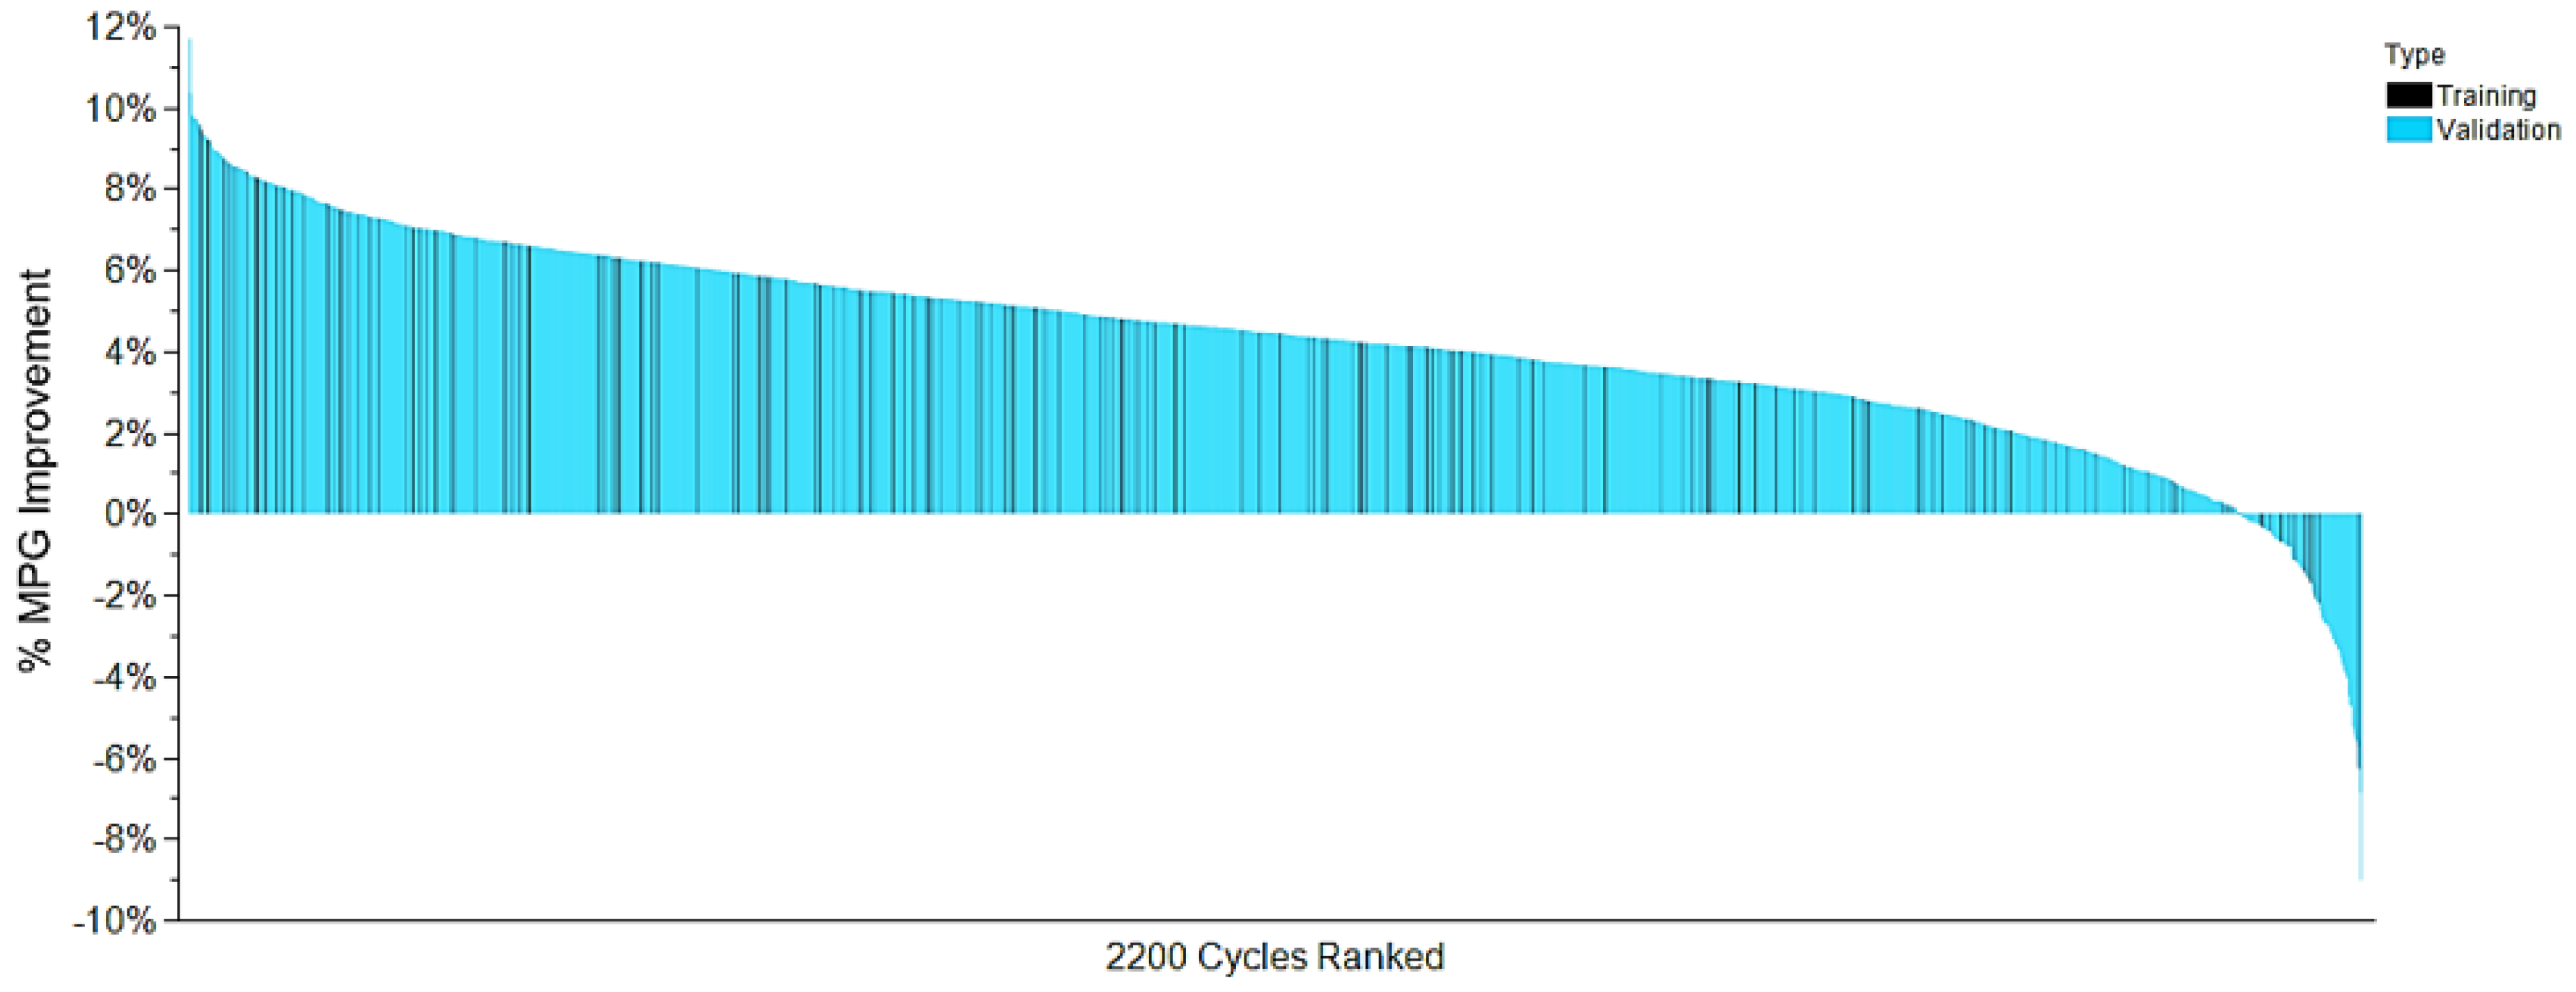
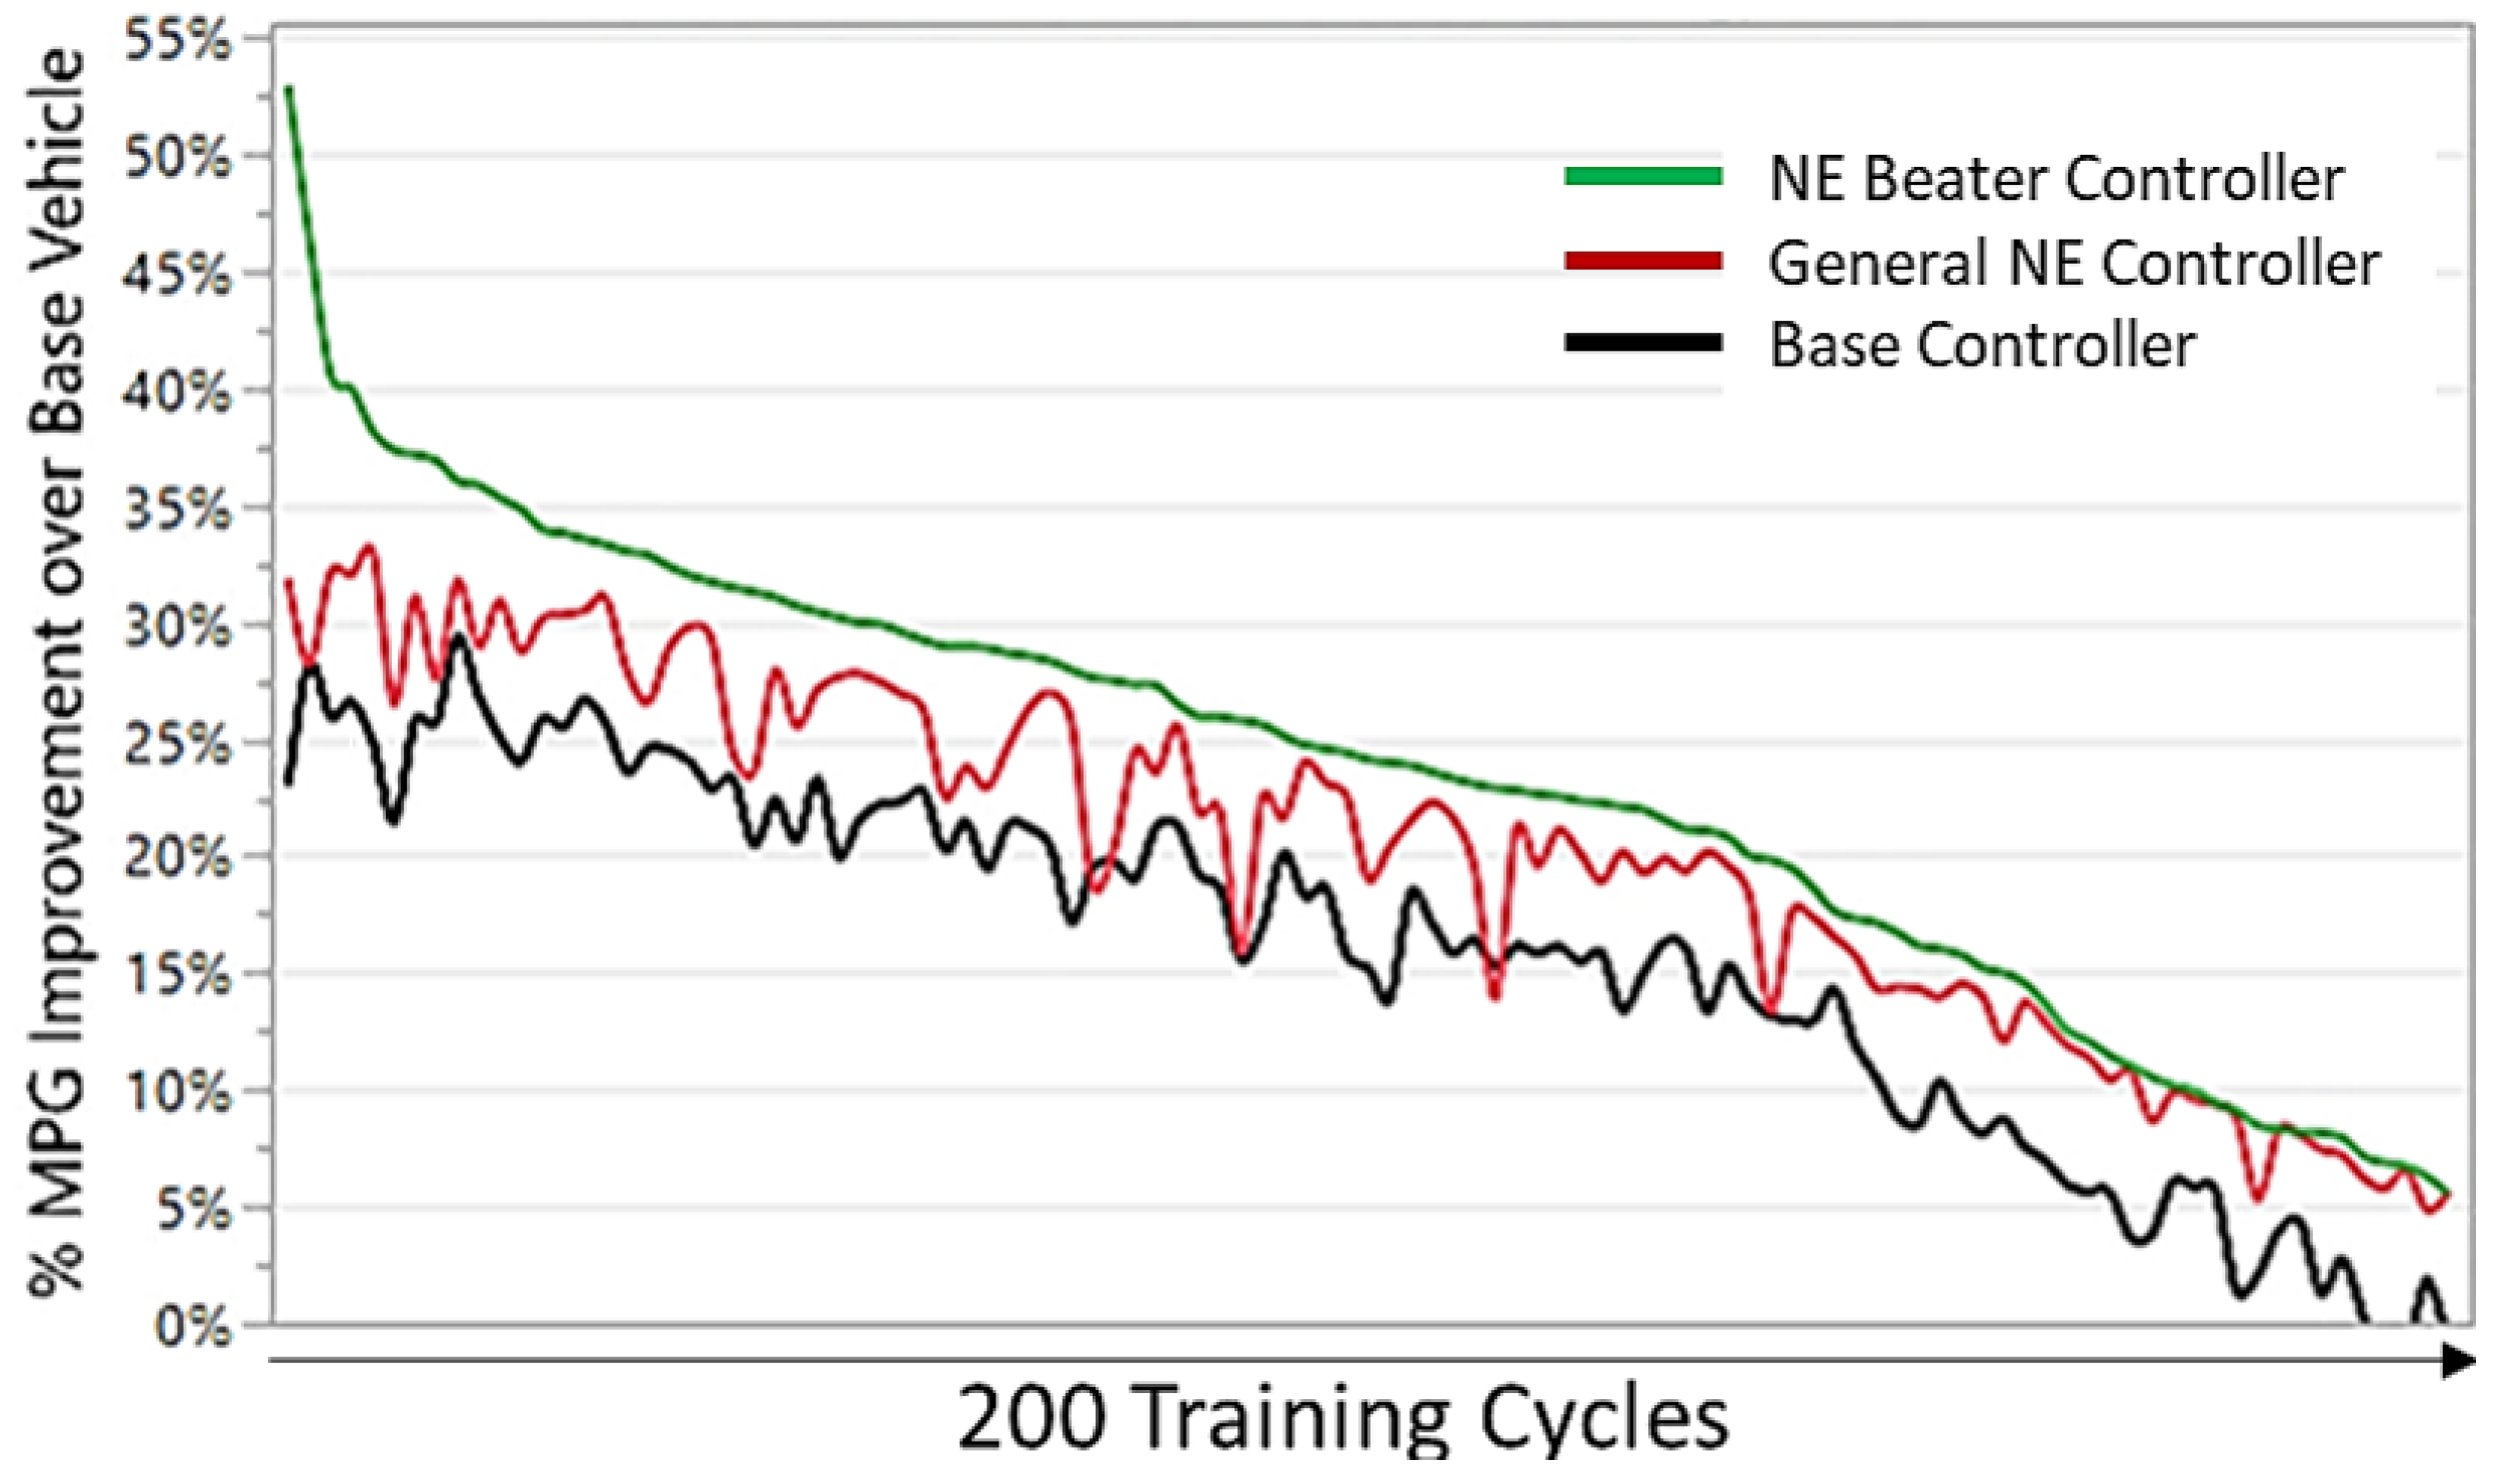
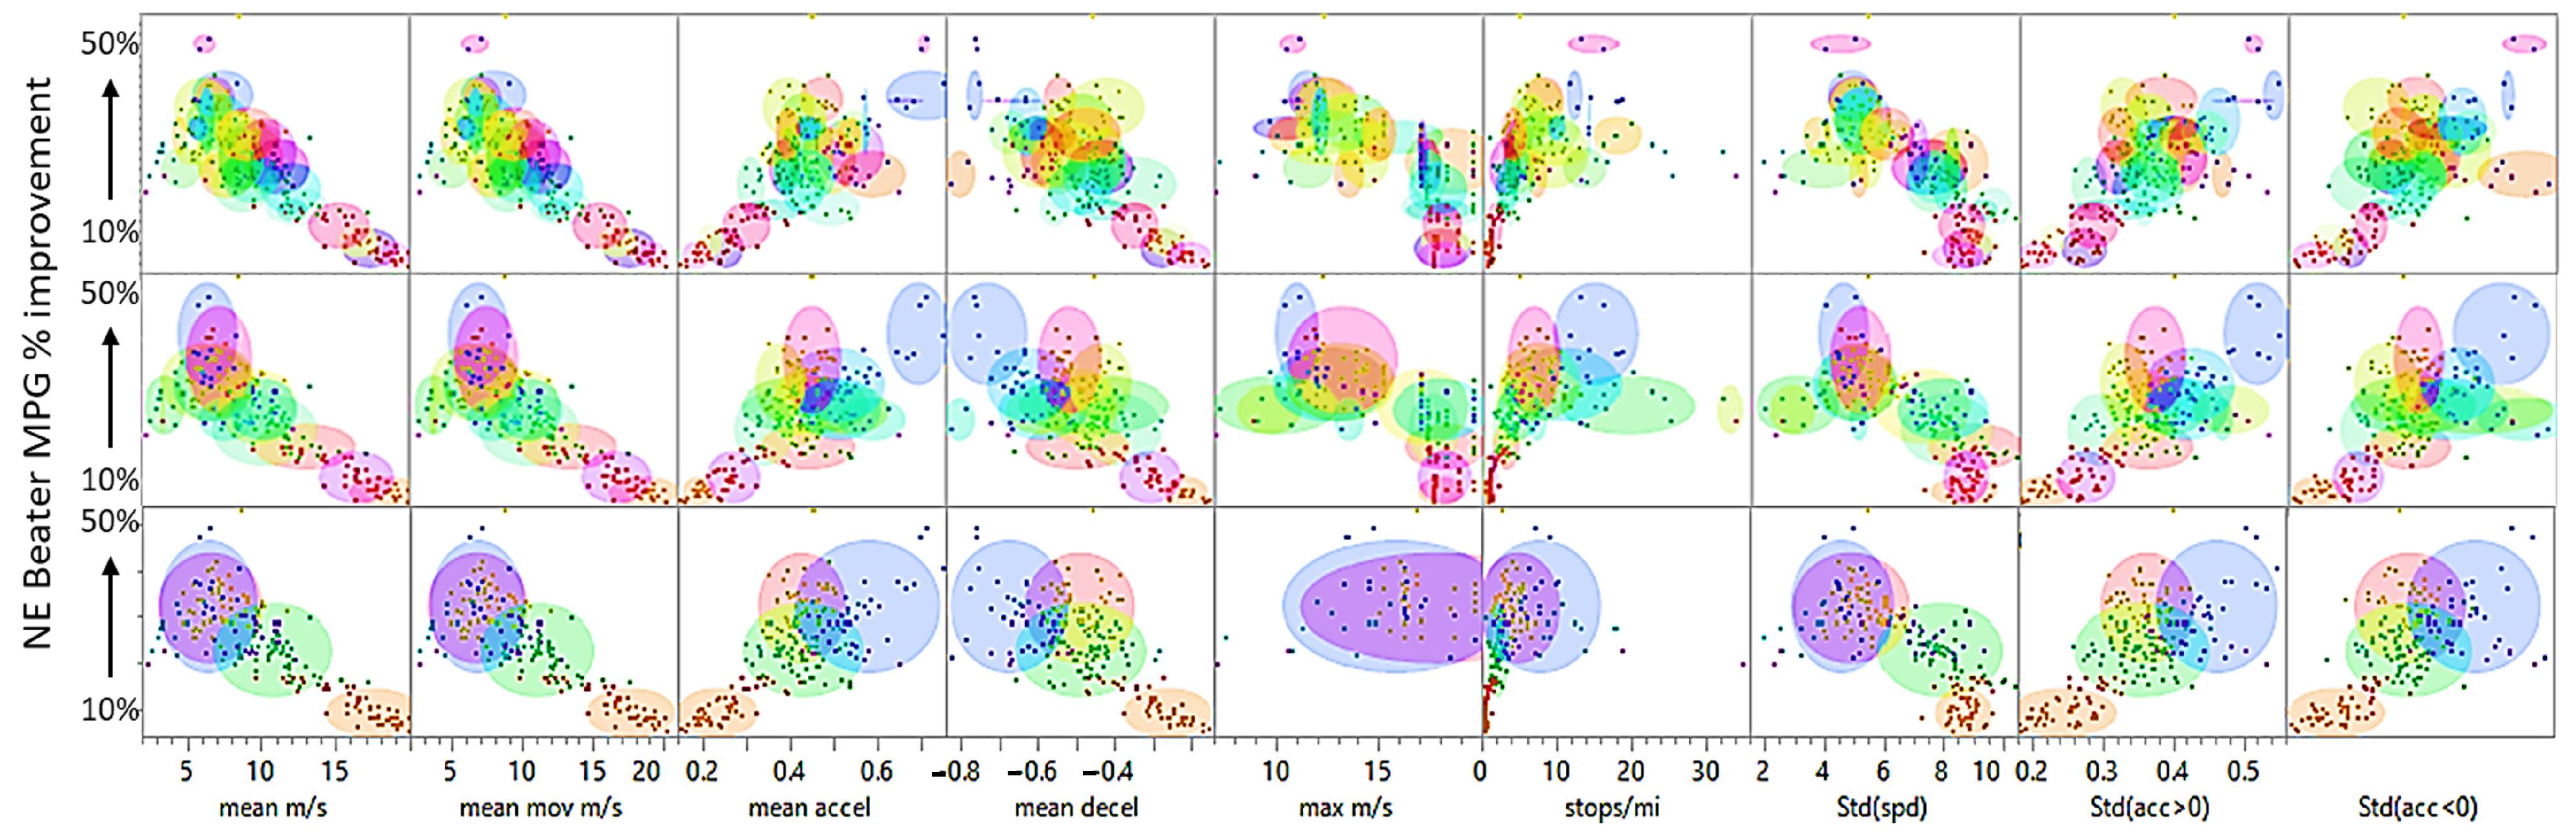
  • The achieved cycle beater MPG percent benefit.
  • The mean speed and mean moving speed (non-zero speed).
  • Maximum speed.
  • The mean acceleration and deceleration rates.
  • The number of stops per mile.
  • The speed, acceleration, and deceleration standard deviations.
Three cluster sets of different sizes are constructed as shown in Figure 9. A 44 cluster set is identified as most effective via the Optimal Cubic Clustering Criterion (CCC) [22]. A five-cluster set is used as the smallest example set. A 14-cluster set is retained as the first cluster set where only one cycle is contained within its own single cluster.
Ideally, each cycle would have its own cluster associated with its NE Beater controller parameter set. This is, however, unrealistic due to an infinite number of cycle variations in the real world. Importantly, as the cycle beater MPG percent benefit is unknown for a given route, a classification algorithm is needed to match a new set of cycle characteristics (mean speed, acceleration, etc.) to the clusters generated above in a second step. The application of such a classifier is constrained by its ability to avoid false positive results. As such, the five-cluster set achieves 100% classification success using a basic neural network. The 14-cluster set achieves low misclassification while the 44-cluster set becomes unfeasible due to poor classification performance. Their corresponding Receiver Operating Characteristic curves (ROC) are shown in Figure 10.
The five and fourteen cluster sets are chosen for the next steps. Based on their classification results, the PSO optimization is applied to each cluster using only their associated training cycle. This step generates five and fourteen NE controller weights and biases sets. While the use of a smaller number of clusters reduces misclassification to zero, it provides a limited set of parameters that barely improves from the general NE controller performance. Instead, the fourteen clusters based NE controllers (“NE Cluster controllers”) consistently achieve better performance than the General NE Controller while having low misclassification errors, and hence are retained as a realistic and effective PrEM alternative to the single General NE controller concept (see Figure 11). The other clusters are shown in Appendix A Figure A1 and Figure A2. The NE Cycle controllers generally show better performance and/or more robust performance versus cycle variation within a cluster.
The 2000 validation drive cycles are classified using the same classifier. The existing NE Cluster controllers are run across the validation cycles using the assigned cluster parameter set. While misclassification may occur, the performance of the NE Cluster controllers shows consistent improvement from the NE General controller (Figure 12) on the validation cycles as well. The clusters also significantly improve the controller robustness in minimizing cycle to cycle performance fluctuations. Note that the General NE controller manages to match the Cluster NE performance for 42% of the cycles, likely due to misclassification and using 14 clusters instead of the optimal 44 cluster scenario. This identifies the opportunity loss between achieving robust classification and approaching the NE Beater optimal gap with a high number of clusters.
Figure 13 shows the difference in strategy for cycle 3 (classified as cluster type 3) as an example. The NE Beater and NE Cluster assist early in the cycle, hence gaining fuel efficiency. They both utilize engine charging mode during the first cruise event, which reduces the earlier efficiency gain but enables more assist availability later in the cycle, especially after the 200 s mark when lower speed and increase in acceleration events are present. In Figure 14, the NE Cluster controller takes a similar assist strategy as the Base controller and uses a charging strategy in between the General NE and NE Beater controllers (cycle 176 with Cluster type 13).
As discussed in the introduction, it is possible that while a drive cycle may be classified as pertaining to a specific cluster, it may locally deviate from the global characteristics at times. This requires updating the classification results from the current position in the route to the cycle end. Recurring classification of the training drive cycles while driving is implemented by running the classification neural network at a fixed refresh rate. Several classification refresh intervals are chosen, ranging from updating the classification and hence NE parameters every 1 s to every 200 s. Allowing the NE controller parameters to be updated with time shows fuel economy improvement above a percent point for 27% of the training cycles. Again, classification would be needed to help choose the optimal refresh rate. The best performance in doing so was achieved by using the primary cluster probability for the entire route, the cycle characteristics (speed, acceleration, etc.), and the number of cluster changes required across the route as inputs. The number of cluster switches is computed by running the cluster classifier with 5 second increments across the trace. The classification accuracy is shown in Figure 15. For our application, this feature and risk of misclassification provides only marginal results and is retained as an optional piece of the final control architecture as shown in Figure 16. This option may, however, be relevant for other duty cycles and applications.

5. Discussion

Neuroevolution provides a simple methodology enabling the generation of various types of experimental controllers such as cycle beaters and general or ML-enhanced controllers within a short period of time. This provides researchers with the ability to efficiently experiment with various concepts such as the ones that resulted in the architecture proposed in this paper. One of the critical enablers of NE is the ability to use any complex system model as a black box. The complexity of the training models used is only limited by one’s available parallel computing infrastructure. This provides the ability to implement thermal, after-treatment, and other dynamic models to enhance the accuracy and comprehensiveness of the trade off analysis. This would be extremely difficult to implement within DP and MPC methods. The resulting NE controller performs faster than in real-time and therefore does not require additional processing power in the embedded systems. Indeed, the linear algebraic equations and tuning parameter arrays associated with linear activation functions can be easily translated into C code and run on the base controller without any additional computing enhancement needed. This provides a platform to rapidly transfer from the Software-in-the-loop validation phase to the hardware-in-the-loop validation phase. The resulting neural networks are shallow and computationally very efficient compared to Deep Learning networks. However, these controllers are not transparent at this time. Industry work on “explainable AI” will promote their acceptance further in the future.

6. Conclusions

This paper demonstrates that drive cycle classification, using optimal control information associated with a controller parameterization scheme enables significant and sustained improvement in HEV vehicle efficiency across a target application. The availability of test data enabled the development of specific cycles fitting a delivery van application, which were then used to train and validate a PrEM controller using Neuroevolution. The ability to create prototype controllers at a fast pace enabled a new concept to emerge, which could be the basis for future HEV controllers. Other applications and complex systems are likely to gain advantages, especially when simulation models require high complexity modeling and accuracy. Indeed Neuroevolution possesses the advantage of bridging complex multi-physics optimal control with real-time applications and will undoubtedly play a stronger role in the future.

Author Contributions

Conceptualization, methodology, formal analysis, validation, and original draft writing and editing by F.J.; Review and editing by all co-authors; Plant modeling support by T.K.; Visualization and Data Science support by B.H.; Supervision by D.R., J.B. and B.C.; Project administration and funding acquisition by D.R. and F.J. All authors have read and agreed to the published version of the manuscript.

Funding

This material is partially based upon work supported by the U.S. Department of Energy’s Office of Energy Efficiency and Renewable Energy (EERE) under the Vehicle Technologies Office (VTO) award number DE-EE0009209.

Institutional Review Board Statement

Not applicable.

Informed Consent Statement

Not applicable.

Data Availability Statement

Not applicable.

Acknowledgments

The authors would like to thank Mike Kenhard, CTO and General Manager of XLFleet, for access to XLFleet telemetry and test data. Some of this material is based on work supported by the U.S. Department of Energy’s Office of Energy Efficiency and Renewable Energy (EERE) under the Vehicle Technologies Office (VTO) award number DE-EE0009209. A special thanks to Erin Boyd, Daniel Nardozzi, and Danielle Chou at DOE for their support and guidance.

Conflicts of Interest

The authors declare no conflict of interest.

Appendix A

Figure A1. Controller performance comparison showing the improvement of the NE Cluster controller from the General NE controller. The remaining optimal gap is shown versus the NE Beater controller.
Vehicles 04 00051 g0a1
Figure A2. Controller performance comparison showing the improvement of the NE Cluster controller from the General NE controller. The remaining optimal gap is shown versus the NE Beater controller. Cluster 9, containing only one cycle, shows a slightly better performance than the NE Beater due to the transfer learning step and the extra optimization time that it was allowed to run.
Vehicles 04 00051 g0a2

References

  1. Sharer, P.; Leydier, R.; Rousseau, A. Impact of drive cycle aggressiveness and speed on HEVs fuel consumption sensitivity. SAE Technical Paper 2007-01-0281 2007. Available online: https://www.sae.org/publications/technical-papers/content/2007-01-0281/ (accessed on 20 September 2022).
  2. Panday, A.; Om Bansal, H. A Review of Optimal Energy Management Strategies for Hybrid Electric Vehicle. Hindawi Publ. Corp. Int. J. Veh. Technol. 2014, 2014. [Google Scholar] [CrossRef]
  3. Johannesson, L.; Asbogard, M.; Egardt, B. Assessing the potential of predictive control for hybrid vehicle powertrains using stochastic dynamic programming. IEEE Trans. Intell. Transp. Syst. 2007, 8, 71–86. [Google Scholar] [CrossRef]
  4. Patil, R.; Filipi, Z.; Fathy, H. Comparison of supervisory control strategies for series plug-in hybrid electric vehicle powertrains through dynamic programming. IEEE Trans. Control. Syst. Technol. 2013, 22, 502–509. [Google Scholar] [CrossRef]
  5. Huo, D.; Meckl, P. Power Management of a Plug-in Hybrid Electric Vehicle Using Neural Networks with Comparison to Other Approaches. Energies 2022, 15, 5735. [Google Scholar] [CrossRef]
  6. Wang, Y.; Jiao, X. Dual Heuristic Dynamic Programming Based Energy Management Control for Hybrid Electric Vehicles. Energies 2022, 15, 3235. [Google Scholar] [CrossRef]
  7. Wang, H.; Oncken, J.; Chen, B. Receding horizon control for mode selection and powertrain control of a multi-mode hybrid electric vehicle. In Proceedings of the IEEE 90th Vehicular Technology Conference (VTC2019-Fall), Honolulu, HI, USA, 22–25 September 2019; pp. 1–5. [Google Scholar] [CrossRef]
  8. Wang, H. Development of Dynamic Programming and Receding Horizon Control Strategies for GM Volt II Multi-Mode Hybrid Electric Vehicle; Michigan Technological University: Houghton, MI, USA, 2018. [Google Scholar] [CrossRef]
  9. Oncken, J.; Chen, B. Real-Time Model Predictive Powertrain Control for a Connected Plug-In Hybrid Electric Vehicle. IEEE Trans. Veh. Technol. 2020, 69, 8420–8432. [Google Scholar] [CrossRef]
  10. Borhan, H.; Vahidi, A.; Phillips, A.; Kuang, M.; Kolmanovsky, I.; Di Cairano, S. MPC-based energy management of a power-split hybrid electric vehicle. IEEE Trans. Control. Syst. Technol. 2011, 20.3, 593–603. [Google Scholar] [CrossRef]
  11. Bower, J.; Shahverdi, M.; Blekhman, D. Neuroevolution Based Optimization of Hybrid Transmission Shift Points. In Proceedings of the IEEE Conference on Technologies for Sustainability (SusTech), Long Beach, CA, USA, 11–13 November 2018; pp. 1–5. [Google Scholar] [CrossRef]
  12. Onori, S.; Serrao, L.; Rizzoni, G. Hybrid Electric Vehicles Energy Management Strategies, 1st ed.; Springer: Berlin/Heidelberg, Germany, 2016; pp. 10–13. [Google Scholar] [CrossRef]
  13. Lehman, J.; Miikkulainen, R. Neuroevolution. Scholarpedia 2013, 8, 30977. [Google Scholar] [CrossRef]
  14. Silva, F.; Correia, L.; Christensen, A. Evolving Artificial Neural Networks for Multi-objective Tasks; Springer International Publishing: Berlin/Heidelberg, Germany, 2013; pp. 90–101. [Google Scholar] [CrossRef]
  15. Stanley, K.; Bryant, B.; Miikkulainen, R. Real-time neuroevolution in the NERO video game. IEEE Trans. Comput. Intell. Games 2016, 9, 653–668. [Google Scholar] [CrossRef]
  16. Hausknecht, M.; Lehman, J.; Miikkulainen, R.; Stone, P. Neuroevolution Approach to General Atari Game Playing. IEEE Trans. Comput. Intell. Games 2014, 6, 355–366. [Google Scholar] [CrossRef]
  17. Kang Kim, H.; Becerra, R.; Bolufé, S.; Azurdia-Meza, C.A.; Montejo-Sánchez, S.; Zabala-Blanco, D. Neuroevolution-Based Adaptive Antenna Array Beamforming Scheme to Improve the V2V Communication Performance at Intersections. Sensors 2021, 21, 2956. [Google Scholar] [CrossRef]
  18. Kim, E.J.; Perez, R.E. Neuroevolutionary Control for Autonomous Soaring. Aerospace 2021, 8, 267. [Google Scholar] [CrossRef]
  19. De Almeida, B.; Leite, V. Particle Swarm Optimization: A Powerful Technique for Solving Engineering Problems. In Swarm Intelligence-Recent Advances, New Perspectives and Applications; IntechOpen: London, UK, 2019. [Google Scholar] [CrossRef]
  20. O’Keefe, M.; Simpson, A.; Kelly, K.; Pedersen, D. Duty Cycle Characterization and Evaluation towards Heavy Hybrid Vehicle Applications; SAE Technical Paper; SAE International: Warrendale, PA, USA, 2007. [Google Scholar] [CrossRef]
  21. Zhang, P.; Wu, X.; Du, C.; Xu, H.; Wang, H. Adaptive Equivalent Consumption Minimization Strategy for Hybrid Heavy-Duty Truck Based on Driving Condition Recognition and Parameter Optimization. Energies 2020, 13, 5407. [Google Scholar] [CrossRef]
  22. SAS Institute Inc. SAS Technical Report A-108; Cubic Clustering Criterion. 1983. Available online: https://support.sas.com/documentation/onlinedoc/v82/techreport_a108.pdf (accessed on 20 September 2022).
Figure 1. Sample Data across XLFleet trip statistics library. Color is Fuel Efficiency (green is better).
Vehicles 04 00051 g001
Figure 2. Monte Carlo approach to the generation of 2200 drive cycles for a delivery van application.
Vehicles 04 00051 g002
Figure 3. P3 HEV Powertrain architecture and conventional control schematic.
Vehicles 04 00051 g003
Figure 4. Example HEV Neuroevolved Controller base architecture with three inter-connected neural networks running concurrently. The Assist and Charge mode are mutually exclusive when selected. They directly output the demand Torque to the e-motor control module.
Vehicles 04 00051 g004
Figure 5. Competitive Transfer Function for mode switch selection.
Vehicles 04 00051 g005
Figure 6. Simulation based offline learning process driven by the PSO algorithm.
Vehicles 04 00051 g006
Figure 7. General NE Controller MPG % improvement over the Base Conventional controller across the training (in black) and validations cycles (in blue).
Vehicles 04 00051 g007
Figure 8. MPG improvement over the base IC vehicle over the 200 training cycles for three controllers: Conventional, General NE, and Cycle Beater NE(s).
Vehicles 04 00051 g008
Figure 9. Three sets of K-means clusters, 44 clusters (top), 14 clusters (middle) and 5 clusters (bottom). Each set was generated from the training drive cycle characteristics and their associated NE Beater controller performance.
Vehicles 04 00051 g009
Figure 10. Classification ROC curves are shown for each cluster set. The five-cluster set achieves 100% classification accuracy while the 44-cluster set shows poor performance. The 14-cluster set shows good classification accuracy, with Clusters 5 and 11 being the least accurate.
Vehicles 04 00051 g010
Figure 11. Controller performance comparison for Cluster 1 to 6 showing the improvement of the NE Cluster controller from the General NE controller. The remaining optimal gap is shown versus the NE Beater controller.
Vehicles 04 00051 g011
Figure 12. The Classification of each drive cycle and subsequent uploading of updated NE Controller parameters enable sustained and more robust MPG improvement (from the base conventional van) than the General NE controller by itself.
Vehicles 04 00051 g012
Figure 13. HEV operation comparison between the four hybrid controllers. The charging and assist strategy is highlighted for the base and NE Cluster controllers on the right.
Vehicles 04 00051 g013
Figure 14. HEV operation comparison between the four hybrid controllers. The charging and assist strategy is highlighted for the base and NE Cluster controllers on the right.
Vehicles 04 00051 g014
Figure 15. The Refresh option for the NE Cluster controller brings marginal benefits and requires a classifier to be used to pick the effective refresh rate. The refresh rates shown here range from 1 to 200 s intervals.
Vehicles 04 00051 g015
Figure 16. The proposed Neuroevolution based control architecture with the added classification refresh concept. Note that the classifier plot is only a static 2D view of the classification space.
Vehicles 04 00051 g016
Publisher’s Note: MDPI stays neutral with regard to jurisdictional claims in published maps and institutional affiliations.

