Article

Distinct miRNA Profile of Cellular and Extracellular Vesicles Released from Chicken Tracheal Cells Following Avian Influenza Virus Infection

by
Kelsey O’Dowd
1,2,3,†,
Mehdi Emam
3,4,†,
Mohamed Reda El Khili
5,
Amin Emad
5,
Eveline M. Ibeagha-Awemu
6,
Carl A. Gagnon
1,2,3 and
Neda Barjesteh
1,2,3,*
1
Research Group on Infectious Diseases in Production Animals (GREMIP), Department of Pathology and Microbiology, Faculty of Veterinary Medicine, University of Montreal, Saint-Hyacinthe, QC J2S 2M2, Canada
2
Swine and Poultry Infectious Diseases Research Center (CRIPA), Department of Pathology and Microbiology, Faculty of Veterinary Medicine, University of Montreal, Saint-Hyacinthe, QC J2S 2M2, Canada
3
Department of Pathology and Microbiology, Faculty of Veterinary Medicine, University of Montreal, Saint-Hyacinthe, QC J2S 2M2, Canada
4
McGill University Research Centre on Complex Traits (MRCCT), Department of Human Genetics, Faculty of Medicine, McGill University, Montreal, QC H3G 0B1, Canada
5
Department of Electrical and Computer Engineering, Faculty of Engineering, McGill University, Montreal, QC H3A 0E9, Canada
6
Sherbrooke Research & Development Centre, Agriculture and Agri-Food Canada, Sherbrooke, QC J1M 0C8, Canada
*
Author to whom correspondence should be addressed.
Equal contribution.
Vaccines 2020, 8(3), 438; https://doi.org/10.3390/vaccines8030438
Submission received: 2 July 2020 / Revised: 25 July 2020 / Accepted: 30 July 2020 / Published: 5 August 2020

Abstract

:
Innate responses provide the first line of defense against viral infections, including the influenza virus at mucosal surfaces. Communication and interaction between different host cells at the early stage of viral infections determine the quality and magnitude of immune responses against the invading virus. The release of membrane-encapsulated extracellular vesicles (EVs), from host cells, is defined as a refined system of cell-to-cell communication. EVs contain a diverse array of biomolecules, including microRNAs (miRNAs). We hypothesized that the activation of the tracheal cells with different stimuli impacts the cellular and EV miRNA profiles. Chicken tracheal rings were stimulated with polyI:C and LPS from Escherichia coli 026:B6 or infected with low pathogenic avian influenza virus H4N6. Subsequently, miRNAs were isolated from chicken tracheal cells or from EVs released from chicken tracheal cells. Differentially expressed (DE) miRNAs were identified in treated groups when compared to the control group. Our results demonstrated that there were 67 up-regulated miRNAs, 157 down-regulated miRNAs across all cellular and EV samples. In the next step, several genes or pathways targeted by DE miRNAs were predicted. Overall, this study presented a global miRNA expression profile in chicken tracheas in response to avian influenza viruses (AIV) and toll-like receptor (TLR) ligands. The results presented predicted the possible roles of some DE miRNAs in the induction of antiviral responses. The DE candidate miRNAs, including miR-146a, miR-146b, miR-205a, miR-205b and miR-449, can be investigated further for functional validation studies and to be used as novel prophylactic and therapeutic targets in tailoring or enhancing antiviral responses against AIV.

1. Introduction

Avian influenza viruses (AIVs) are negative-sense single-stranded RNA viruses belonging to the Orthomyxoviridae family. AIVs cause transmissible viral infections affecting several species of poultry, such as chickens and turkeys, as well as wildfowl. These viruses are classified into two pathotypes that are based on their pathogenesis in poultry: low pathogenic and highly pathogenic viruses. Additionally, AIVs cause respiratory infections, declines in production, and elevated mortality rates.
During the early stages of the infection, innate responses provide the first line of defense against the infections at mucosal surfaces by aiming to block the entry of the virus and viral replication. However, when the virus crosses the primary barrier, the airway epithelial cells become the target of the virus. Host cells detect the presence of viral components and, subsequently, antiviral responses will be induced. Previously, we confirmed the induction of antiviral responses in the chicken respiratory system [1,2,3]. In the absence of appropriate antiviral responses against the virus, viral replication in the host cells leads to pathological changes, such as necrosis of tracheal epithelial cells and the infiltration of inflammatory cells into the site of infection.
Furthermore, innate responses deliver information about the virulence, pathogenicity, and presence of pathogens within the host cells. In addition, immune responses influence the communication and coordination between the different host cells [4]. The induction of innate antiviral responses, the production of antiviral factors, and the regulation of viral activity are highly regulated processes that largely depend on intracellular communication mechanisms, including cell-to-cell contact, secretion of cytokines and chemokines, as well as the release of extracellular vesicles (EVs) [5]. Exosomes are membrane-encapsulated EVs measuring approximately 30 to 150 nm in diameter that can act as mediators of intracellular communication [6,7]. Studies in mammalian species have shown that EVs, including exosomes, contain a diverse array of biomolecules, including proteins, lipids, messenger RNAs (mRNAs), and microRNAs (miRNAs) [5]. They can transfer their contents to neighboring cells. In addition, there is some evidence that EVs and their contents play a role in modulating antiviral responses, but this phenomenon and the mechanism by which it occurs is poorly characterized in chickens [8,9,10,11].
MicroRNAs are conserved, small, non-coding RNA molecules that regulate the gene expression of complementary mRNA sequences, usually in the 3′ untranslated region (UTR), by base pairing, resulting in gene silencing through translational repression or target degradation [12,13]. Complete complementarity between a miRNA and its target sequence is rare in animals, but a match of as little as six base pairs in the seed region of the miRNA (nucleotides 2–8) can be sufficient to induce the suppression of gene expression [14]. As a result, a given miRNA can have multiple targets affecting multiple intracellular signaling pathways. MiRNAs have been shown to regulate several biological processes, such as development, differentiation, organogenesis, growth control, and apoptosis [15]. Extracellular miRNAs, which are packaged in exosomes, microvesicles, or apoptotic bodies, are stable and can survive in the harsh conditions of the extracellular environment. MiRNAs are also found intracellularly, but are subjected to more rapid degradation in the extracellular environment [16]. Regardless of their localization, miRNAs play an important role in cell-to-cell communication and the modulation of intracellular signaling. Furthermore, studies characterizing miRNA profiles revealed that certain miRNAs are induced upon infection with viruses and can modulate antiviral responses by targeting intracellular pathways [17,18,19,20,21]. Recent studies in humans have also demonstrated that cellular miRNAs are capable of regulating translation and replication in RNA viruses by directly binding to the virus genome [22,23,24,25,26,27]. In addition, studies in chickens have identified several miRNAs that are involved in immune responses against avian pathogens, such as avian pathogenic Escherichia coli (APEC), Newcastle disease virus (NDV), and Marek’s disease virus (MDV) [28,29,30,31]. Moreover, previous studies demonstrated the expression of miRNAs following AIV infections in chickens [32,33].
Despite an increasing understanding of the induction of antiviral responses in chickens, studies are required in order to determine the mechanisms by which EVs, and EV and cellular miRNAs influence and regulate antiviral responses. In this study, we aimed to determine the miRNA contents of EVs released from chicken tracheal cells following AIV infection. Moreover, we were interested in identifying whether the type of stimuli or infection can impact the profile of cellular and EV miRNAs. Therefore, in the current study, we characterized the profile of miRNAs and their potential targets that are involved in antiviral responses following the infection of chicken tracheal cells with AIV and stimulation with TLR3 and 4 ligands.

2. Materials and Methods

2.1. Avian Influenza Virus (AIV)

Eleven-day-old specific-pathogen-free (SPF) embryonated chicken (layer chickens, white Leghorn) eggs (Canadian Food Inspection Agency, Ottawa, ON, Canada) were used to propagate influenza virus A/Duck/Czech/56 (H4N6), a low pathogenic avian influenza virus (LPAIV) by inoculation through the allantoic cavity [34]. For the inoculation, the eggs were candled, and then the virus was injected with 100 µL of stock allantoic fluid containing 0.2 hemagglutinin units (HAU) of the H4N6 virus. The allantoic fluid was harvested 48 h post-inoculation. The virus titer was determined using end-point dilution in Madin-Darby Canine Kidney (MDCK) cells (a gracious gift from Dr. Shayan Sharif’s laboratory at the Ontario Veterinary College, University of Guelph, ON, Canada) and hemagglutinin assay (HA) [35].

2.2. Toll-Like Receptor (TLR) Ligands

Lipopolysaccharide (LPS) from Escherichia coli 026:B6 (Sigma–Aldrich, Oakville, ON, Canada) and polyinosinic:polycytidylic acid (polyI:C) (InvivoGen, San Diego, CA, USA) were used in this study. These ligands were selected, as they were previously shown to induce immune responses in chicken tracheal cells [2,36].

2.3. Tracheal Organ Culture (TOC)

Tracheal organ culture (TOC) was performed, as previously described [2]. Briefly, tracheas were aseptically collected from 19-day-old SPF chicken embryos (Canadian Food Inspection Agency, Ottawa, ON, Canada) and, subsequently, washed twice with warm Hanks’ balanced salt solution (HBSS, Gibco, Burlington, ON, Canada) in order to remove excess mucus. The connective tissues surrounding the trachea were removed by thorough dissection. Tracheas were manually dissected into 1 mm rings using razor blades and then transferred into 24-well cell culture plates containing phenol red-free complete Medium 199 (Sigma–Aldrich, Oakville, ON, Canada). Complete Medium 199 was supplemented with 10% EV-depleted and heat-inactivated fetal bovine serum (FBS, Gibco, Burlington, ON, Canada), 25 mM 4-(2-hydroxyethyl)-1-piperazineethanesulfonic acid (HEPES) buffer (Gibco, Burlington, ON, Canada), 200 U/mL penicillin/80 µg/mL streptomycin (Gibco, Burlington, ON, Canada), and 50 µg/mL gentamicin (Gibco, Burlington, ON, Canada). To prepare EV-depleted FBS, FBS was heat-inactivated at 56 °C for 30 min. and then depleted of EVs by ultracentrifugation. To this end, complete Medium 199 containing 20% FBS were centrifuged overnight (18 h) at 100,000× g at 4 °C. The top layer was collected, and the resulting 20% FBS-depleted medium was then filtered through a 0.2 μm filter and diluted to the half with complete Medium 199 without FBS to reach 10% of FBS. The rings were then incubated at room temperature on a low-speed benchtop rocker for 3 h to exclude any possible reaction and mucus production during the TOC preparation. Following the incubation, the media was replaced with fresh media. During the experiments, the ciliary activity of the tracheal rings was observed under a light microscope in order to monitor the condition of TOCs and confirm the cilia activity of TOCs.

2.4. TOC Infection with AIV (H4N6) and Stimulation with TLR Ligands

Stimulation for all treatment groups was done in complete FBS-free Medium 199 as animal sera contain non-specific inhibitors of influenza viruses [37]. For infection of TOCs with AIV (H4N6), tracheal rings were infected with 104 pfu/mL. For the stimulation of TOCs with TLR ligands, tracheal rings were stimulated with either LPS (1 µg/mL) or polyI:C (25 µg/mL) (doses were selected based on previous studies in chickens) [2,36,38]. The control groups received complete FBS-free Medium 199. The final volume for each well was 500 µL. After 2 h of stimulation, tracheal rings were washed twice and incubated at 37 °C in fresh complete FBS-free Medium 199. The tracheal rings designated for cellular miRNA extraction (TOC samples), consisting of six biological replicates (six individual embryos) per treatment group, were collected 3- and 18-h post-infection or -stimulation and stored at −80 °C in RNAlater (Invitrogen, Burlington, ON, Canada). The tracheal supernatants of the rings that were designated for EV isolation and subsequent EV miRNA extraction (EV samples) were collected 24-h post-infection or -stimulation. For EV samples, there were three biological replicates (pools of five individual embryos per replicate) for each treatment group.

2.5. Extracellular Vesicle Isolation

All of the centrifugations and ultracentrifugations were performed at 4°C. Tracheal supernatants from EV samples were centrifuged at 300× g for 10 min. to remove cellular debris. Subsequently, supernatants were recovered and centrifuged at 2000× g for 20 min. Supernatants were again recovered and ultracentrifuged at 10,000× g for 30 min. (Optima L-100XP, Beckman Coulter, Mississauga, ON, Canada). Supernatants were recovered and filtered with 0.2 µm filters (VWR, Montreal, QC, Canada). Supernatants were then ultracentrifuged at 100,000× g for 60 min. (Optima L-100XP, Beckman Coulter, Mississauga, ON, Canada). Supernatants were discarded and pellets were resuspended in FBS-free complete Medium 199 and ultracentrifuged at 100,000× g for a final 60 min. (Optima L-100XP, Beckman Coulter, Mississauga, ON, Canada). The supernatants were discarded, and the pellets were resuspended in 200 µL of phosphate-buffered saline (PBS, Gibco, Burlington, ON, Canada). Finally, for miRNA isolation from EV samples, 700 µL of QIAzol reagent (QIAGEN, Toronto, ON, Canada) were added to samples that were designated for RNA isolation and then stored at −80 °C. Samples designated for Western Blot and transmission electron microscopy analyses were stored at −80 °C in PBS.

2.6. Western Blot

Western Blot analysis was performed to confirm biomarkers compatible with EVs. The protein concentrations of the isolated EVs were determined using Micro BCA Protein Assay Kit according to manufacturer’s instructions (Thermo Fisher Scientific, Burlington, ON, Canada). EV samples were lysed with RIPA Lysis Buffer (EMD Millipore, Oakville, ON, Canada) and incubated on ice for 5 min. The samples were then treated with NuPAGE LDS Sample Buffer (4X) containing 5% 2-mercaptoethanol (Invitrogen, Burlington, ON, Canada) and denatured for 5 min. at 95 °C. Equal amounts of proteins (about 30 μg) were separated by SDS-PAGE using pre-cast Mini-PROTEAN TGX electrophoresis gels (Bio-Rad, Montreal, QC, Canada). The separated proteins were transferred onto activated polyvinylidene difluoride (PVDF) membranes (Sigma–Aldrich, Oakville, ON, Canada). The membranes were washed in Tris-buffered saline with 0.05% Tween 20 (TBS-T), blocked in 5% skimmed milk TBS-T solution, and then washed again in TBS-T. The membranes were incubated with the primary antibody overnight at 4 °C, followed by the appropriate secondary antibody diluted in TBS-T for 1h at room temperature. Proteins were detected using Clarity Max enhanced chemiluminescence (ECL) Substrate (Bio-Rad, Montreal, QC, Canada), according to the manufacturer’s instructions.
The primary antibodies used for western blot were rabbit polyclonal antibody (pAb) anti-lysosome-associated membrane protein 1 (LAMP1-lysosome marker) (ab24170, Abcam, Cambridge, MA, USA), rabbit pAb anti-tumor susceptibility gene 101 (TSG101) (ab225877, Abcam, Cambridge, MA, USA), rat monoclonal antibody (mAb) anti-glucose-regulated protein 94 (GRP94) (ab2791, Abcam, Cambridge, MA, USA), and mouse mAb conjugated HRP against β-actin (HRP SC-47778, Santa Cruz Biotechnology, Dallas, TX, USA). The secondary antibodies used for antibodies were goat-anti-rabbit IgG Fc (HRP) (4041-05, Southern Biotech, Birmingham, AL, USA) and goat pAb to rat IgG (HRP) (ab97057, Abcam Cambridge, MA, USA).

2.7. Negative Staining and Transmission Electron Microscopy (TEM)

TEM analysis was performed at the Facility for Electron Microscopy Research (FEMR), McGill University, to confirm and validate the purity of isolated EVs. Briefly, a 1:1 dilution of frozen EV samples was thawed and fixed with 2.5% glutaraldehyde in 0.1M sodium cacodylate buffer. The samples were then allowed to equilibrate at room temperature for 30 min. A 200-mesh copper TEM grid with carbon support film (Agar Scientific Ltd., Stansted, UK) was negatively glow discharged at 25 mA for 30 s (Electron Microscopy Sciences 100 Glow Discharge System, Hatfield, PA, USA) and loaded with a 5 µL droplet of sample for 3 min. Excess solution was carefully blotted off with Whatman Grade 1 filter paper and the grid was washed twice with a droplet of glycine for 1 and 2 min., respectively. The grid was then washed three times with a droplet of MilliQ water for 1 min. Finally, for negative staining, the grid was first floated on a droplet of 2% uranyl acetate (Electron Microscopy Sciences, Hatfield, PA, USA) to remove excess water and then on a second droplet for 1 min. Excess liquid was blotted off with Whatman Grade 1 filter paper. The samples were imaged by the FEI Tecnai G2 Spirit 120 kV TEM (Thermo Fisher Scientific, Hillsboro, OR, USA) equipped with a Gatan Ultrascan 4000 CCD camera Model 895 (Gatan, Inc., Warrendale, PA, USA). The micrographs were taken at appropriate magnifications to record the fine structure of EVs. The proprietary Digital Micrograph 16-bit images (DM3) were converted to unsigned 8-bit TIFF images.

2.8. MiRNA Isolation

Small RNAs were isolated while using the miRNeasy Mini Kit (QIAGEN, Toronto, ON, Canada) following the Quick-Start protocol of miRNeasy Mini Kit manufacturer’s instructions. Briefly, tracheal rings from TOC samples (stored in RNAlater) were collected, lysed in 700 µL of QIAzol reagent (QIAGEN, Toronto, ON, Canada), and homogenized for two minutes using 0.5 mm glass beads (Biospec Products Inc., Bartlesville, OK, USA) and a tissue homogenizer (MP FastPrep-24 Classic Instrument, MP Biomedicals, Solon, OH, USA). The isolated EVs from EV samples were likewise lysed in 700 µL of QIAzol reagent (QIAGEN, Toronto, ON, Canada). The samples were then deproteinized in chloroform and centrifuged for 15 min. at 12,000× g at 4 °C. The upper aqueous portion of the samples was precipitated in 95% ethanol. The samples were sequentially washed and centrifuged with RWT and RPE buffers using RNeasy Mini columns in 2 mL collection tubes (QIAGEN, Toronto, ON, Canada). Finally, the purified RNA was eluted in 27 μL RNase-free water and quality control of RNA was performed using the RNA ScreenTape Analysis kit (Agilent Technologies, Santa Clara, CA, USA) and the Agilent 4200 TapeStation Analysis Software A.02.01 SR1 (Agilent Technologies, Santa Clara, CA, USA), according to the manufacturer’s instruction. The samples were then stored at −80 °C.

2.9. Small RNA Library Preparation and Sequencing

MiRNA sequencing was performed at the Research Center of the CHU de Québec-Université Laval, Quebec, Canada. Twenty-four libraries for TOC samples (pooling of two replicates from each treatment group) to give three replicates per group and twelve libraries for EV samples to have three replicates within each group were prepared using the NEBNext Multiplex Small RNA Library Prep Set for Illumina (New England Biolabs, Ipswich, MA, USA), according to manufacturer’s instructions. The total RNA from each sample was sequentially ligated to 3′ and 5′ small RNA adapters using T4 RNA ligase (New England Biolabs, Ipswich, MA, USA). Next, cDNAs were synthesized through reverse transcription using ProtoScript II Reverse Transcriptase (New England Biolabs, Ipswich, MA, USA) and amplified by PCR. Clean up and size selection of fragments was made using the Monarch PCR & DNA Cleanup Kit (5 μg) (New England Biolabs, Ipswich, MA, USA) and 6% polyacrylamide gel. Finally, the RNA libraries were sequenced (50 bp single-end) on an Illumina HiSeq 2500 platform (rapid mode) (Illumina, San Diego, CA, USA).

2.10. MiRNA Expression Analysis

Raw sequencing reads were processed by removing adapters and low-quality sequences using Trimmomatic, a read trimming tool for Illumina NGS data [39]. We used FastQC, a quality control tool for high throughput sequencing data, and MultiQC v1.7, a tool that creates a single report for different metrics and alignment statistics across many samples, in order to assess the quality of the generated reads [40,41]. We aligned the clean reads obtained from each library to mature miRNAs and to the reference genome of Gallus gallus in miRBase version 22.1 database to identify known miRNA expression levels in each group [42]. The MirDeep2 package, which maps reads against a library of known miRNAs from miRBase, was used for miRNA quantification from the reads, coordinated by a Nextflow workflow [43,44]. Small RNA sequencing libraries were normalized to counts per million (CPM) and evaluated for expression. MiRNA differential expression modeling and calculation were then done using R and R packages edgeR, tidyverse, magrittr and ComplexHeatmap [45,46,47,48,49]. Furthermore, the identified miRNAs for each treatment group were considered differentially expressed (DE) if their normalized expression fold changes (FC) relative to the control group was greater than or equal to 1.5-fold (log2FC ≥ 0.58 or log2FC ≤ −0.58) and if their False Discovery Rate (FDR) was less than 0.05 (FDR < 0.05). Venn diagram analysis for the DE miRNAs among the different treatment groups was performed using the online tool http://bioinformatics.pbs.ugent.be/webtools/Venn/. Furthermore, the distribution and intersection of the DE miRNAs were visualized using the UpSet software (http://vcglab.org/upset) [50].

2.11. In Silico Target Gene Prediction and Pathway Analysis

We downloaded targets of Gallus gallus’ miRNAs from release 7.2 of TargetScan and version 6.0 of miRDB in order to perform functional enrichment analysis on the targets of DE miRNAs [51,52]. Next, we excluded targets with a low confidence score (below 99 ‘context++ score percentile’ for TargetScan and below 95 ‘target prediction score’ for miRDB), resulting in 4987 unique target genes for 982 miRNAs from TargetScan and 4887 unique target genes for 973 miRNAs from miRDB. Subsequently, we formed gene sets corresponding to targets of differentially expressed, up-regulated, and down-regulated miRNAs, according to TargetScan and miRDB (separately). We excluded genes that were targets of both up-regulated and down-regulated miRNAs in order to calculate the exact number of host target genes or host target pathways.
We used the KnowEnG analytical platform (https://knoweng.org/analyze) to perform pathway and gene ontology (GO) enrichment analysis on these gene sets [53,54]. KnowEnG is a computational system for analysis of ‘omic’ datasets in light of prior knowledge in the form of various biological networks. We used the KnowEnG’s gene set characterization (GSC) pipeline in the standard mode (no knowledge network) and its knowledge-guided mode with the STRING co-expression network [55]. The knowledge-guided mode of this pipeline implements DRaWR, a method that utilizes random walk with restarts (RWR) in order to incorporate gene-level biological networks in the enrichment analysis to improve identification of important pathways and GO terms [56]. For the GSC pipeline, we did not use the bootstrapping option, selected Gallus gallus as ‘species’, and used default values for all other parameters. In addition, we mapped the Gallus gallus genes to Homo sapiens genes and used them in the same manner in the GSC pipeline with ‘species’ selected as Homo sapiens. The p-values of the Fisher’s exact test corresponding to the standard mode of GSC pipeline were corrected for multiple hypotheses (Benjamini–Hochberg method) and FDR < 0.05 was considered to be significant. For the network-guided mode of GSC pipeline, the results were filtered based on the ‘Difference Score’ and those with a value larger than 0.5 were considered. The difference score is the normalized difference between the query probabilities and the baseline probabilities in the RWR algorithm, with the best score observed as one [56]. Finally, we used GraphPad Prism 8.4.3 for the illustration of the targeted pathways by the treatment group [57].
In addition, we performed the prediction of candidate miRNAs targeting influenza viral genes. The genomic sequences for the AIV strain used in this experiment, A/Duck/Czech/56 (H4N6) (genome accessions: CY130022, CY130023, CY130024, CY130025, CY130026, CY130027, CY130028, CY130029), were obtained from the Influenza Virus Resource at the National Center for Biotechnology Information [58,59]. Two platforms, miRanda and RNAhybrid, were used to scan the eight segments of the AIV viral genome for potential target sites of the identified DE miRNA. The source code for miRanda, (written in C and downloaded from http://www.microrna.org/microrna/getDownloads.do) was used with default parameters for scaling parameter (4.0), strict 5′ seed pairing (off), gap-opening penalty (−4.0), and gap-extend penalty (−9.0), and adjusted parameters for score, set to greater than or equal to 160 (sc ≥ 160), and the minimum free energy (mfe), set to less than or equal to −16 kcal/mol (en ≤ −16 kcal/mol), as previously suggested [60,61]. Identified miRNA target pairs were confirmed using RNA hybrid (http://bibiserv.techfak.uni-bielefeld.de/rnahybrid/submission.html), which illustrates hybridization based on mfe [62].

3. Results

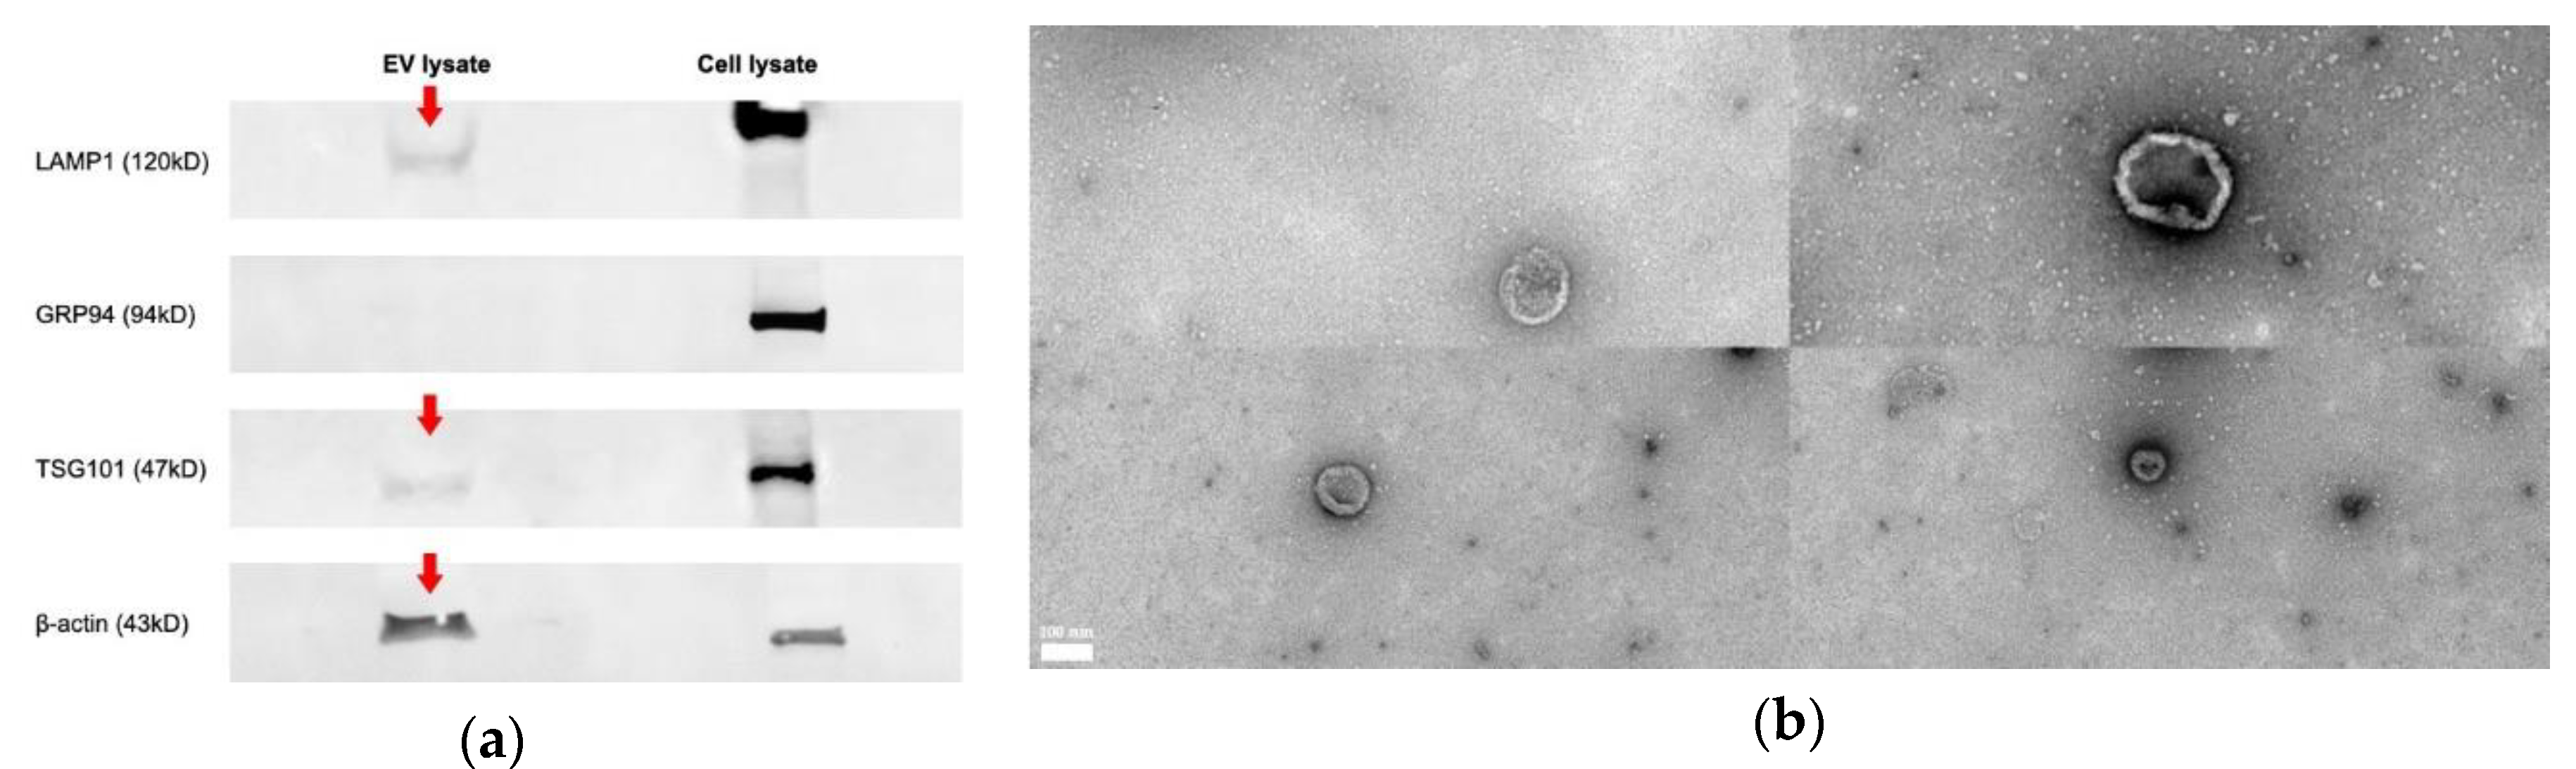
3.1. Chicken Tracheal Cells Release Extracellular Vesicles

While there is heterogeneity among EV cargo, depending on cell type and origin, the protein contents of extracellular vesicles and exosomes have been extensively studied [6].
The average protein concentration across all EV samples was 506 μg/mL. Based on the International Society for Extracellular Vesicles (ISEV)’ recommendation, our results highlighted the presence of “EV-enriched” markers and the absence of non-exosomal markers in EV samples by Western Blot analysis [63]. Our results confirmed the presence of lysosomal LAMP1, a type I transmembrane protein, in both EV and cell lysate samples (Figure 1a). The LAMP1 protein bands identified in both samples were of slightly different sizes. This was expected, as the antibody detects a band of approximately 90–130 kDa. The variability in molecular weight is observed as a result of different levels of glycosylation of the target in different cell and tissue types [64]. In addition, endosomal TSG101, a cytosolic protein, and cytoskeletal β-actin proteins were detected in EV samples (Figure 1a). Moreover, as expected, the EV samples lacked endoplasmic reticulum protein, GRP94 (Figure 1a) [63]. Finally, EVs were examined for morphological characteristics by transmission electron microscopy (TEM), which revealed vesicles of 50–150 nm in diameter with morphological characteristics of EVs (Figure 1b).

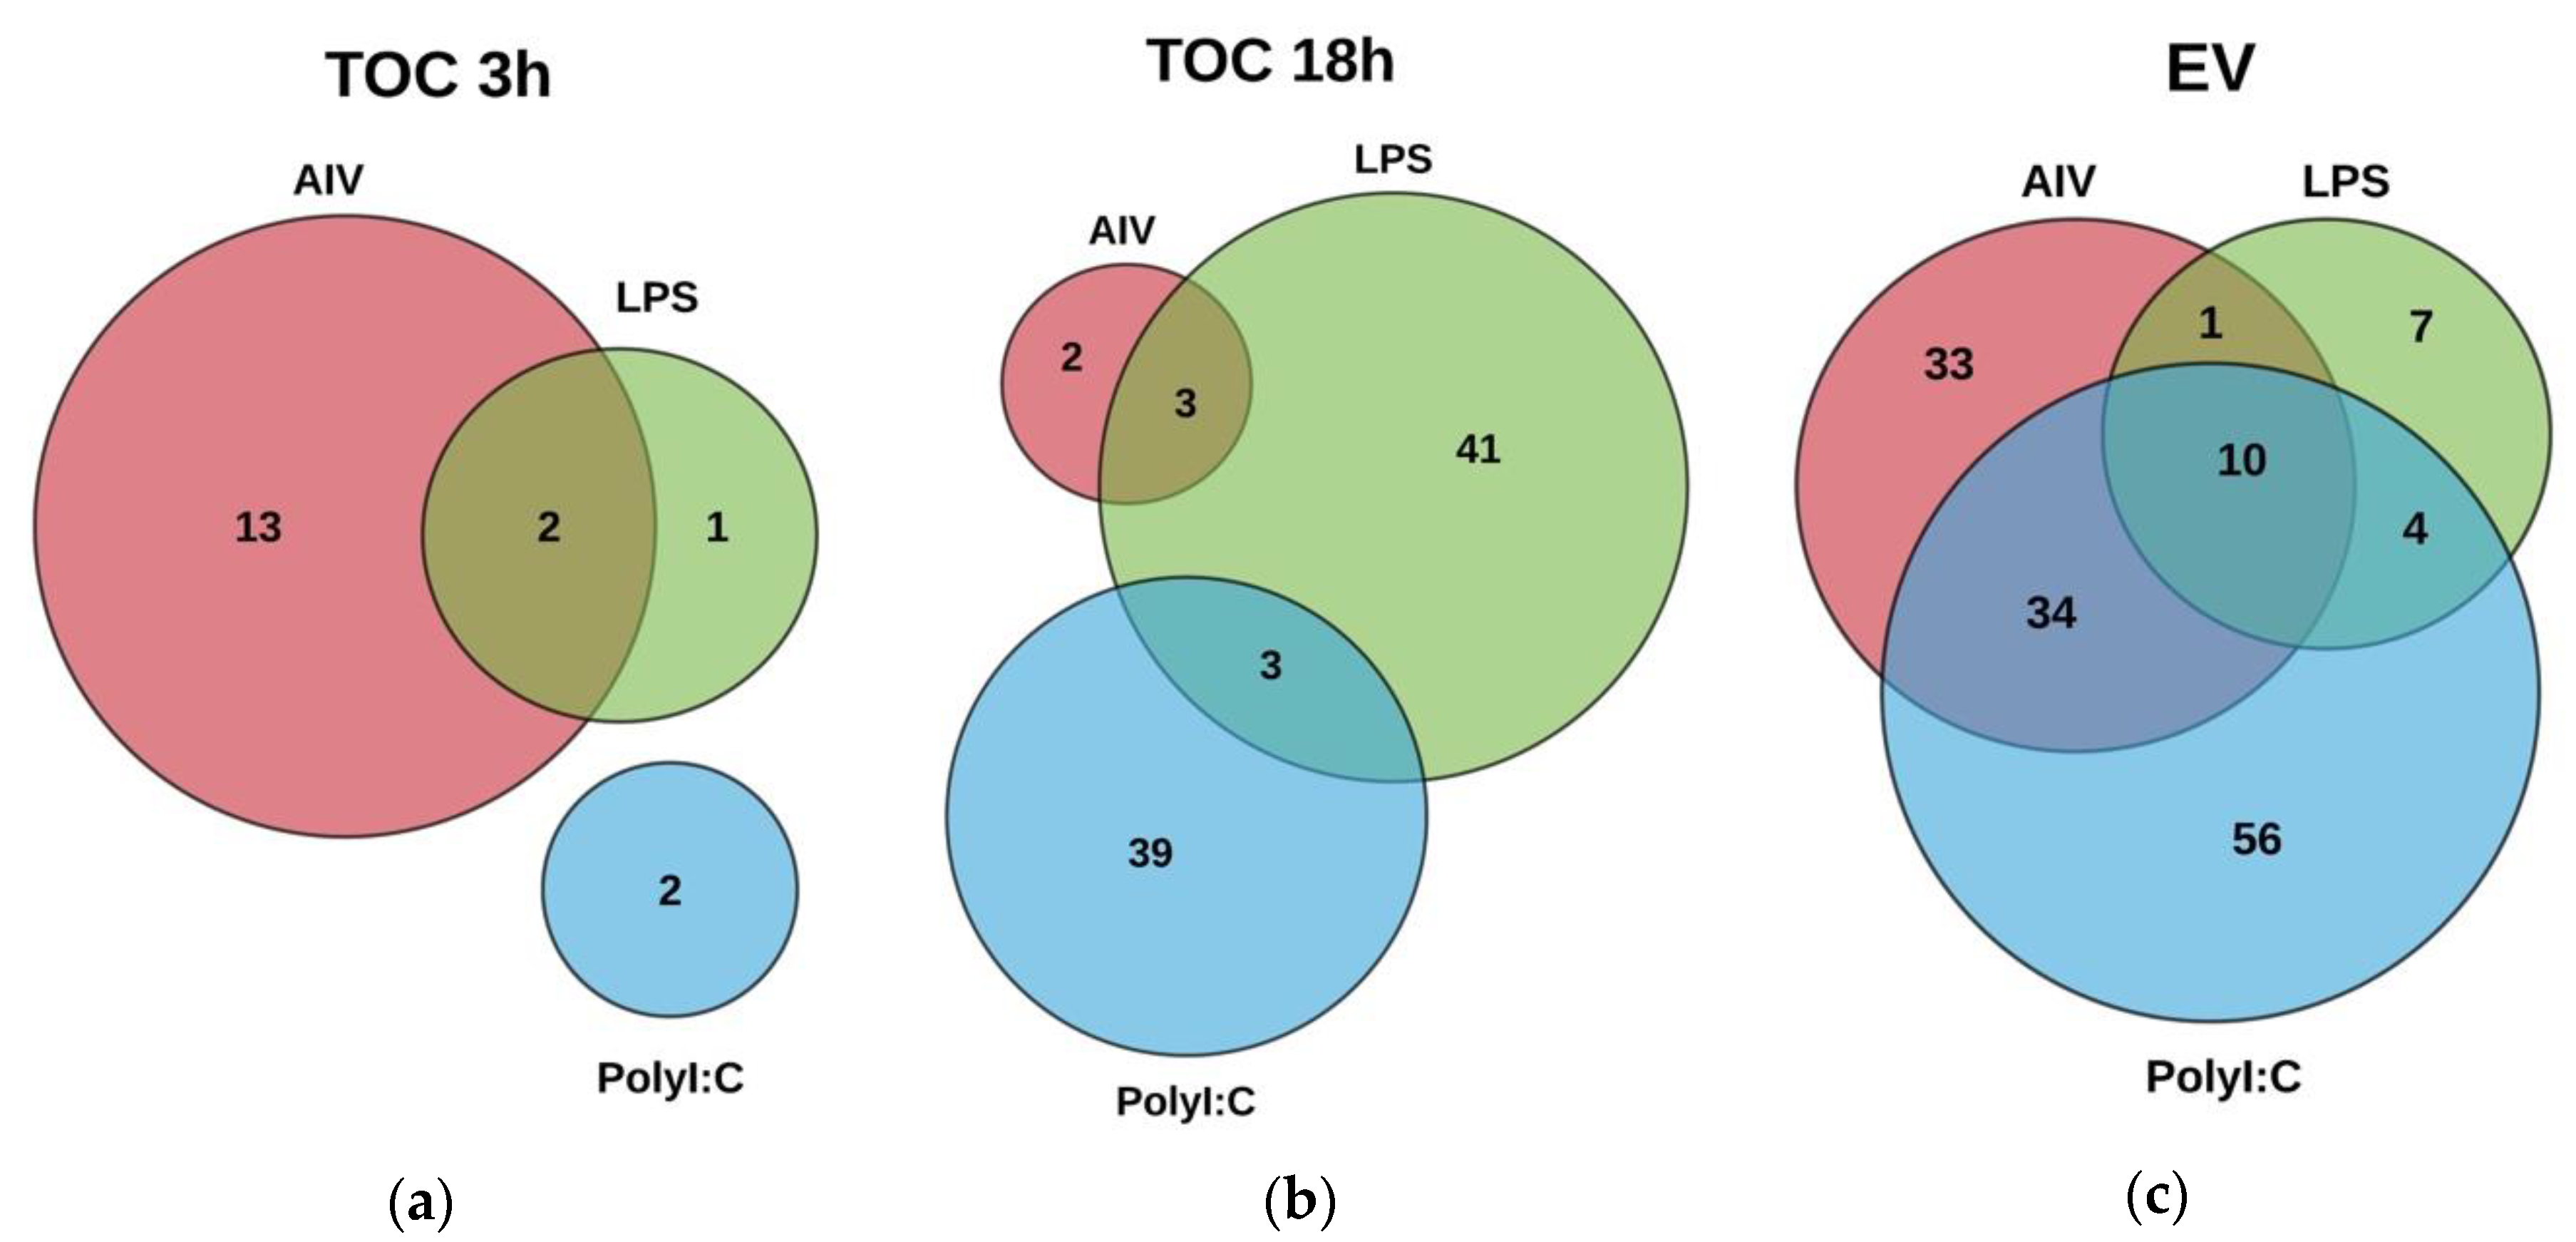
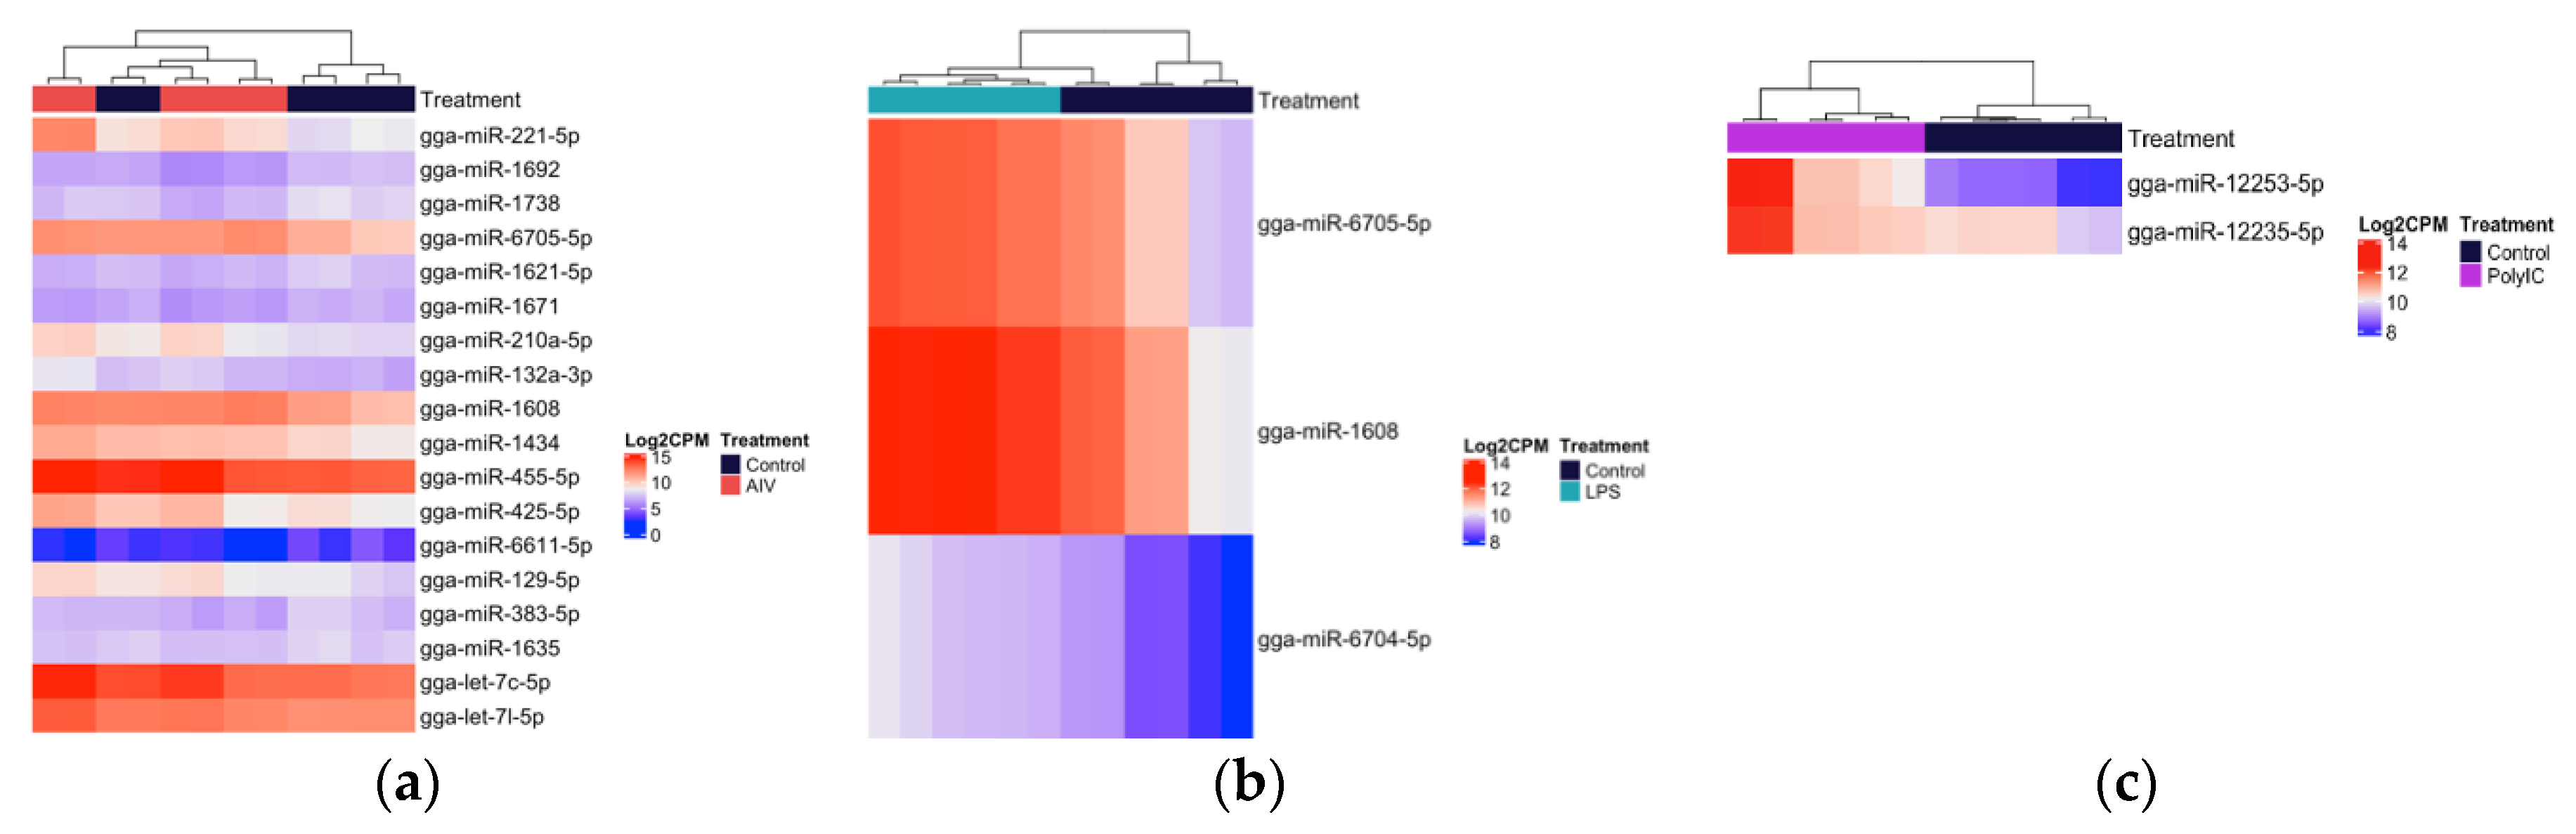
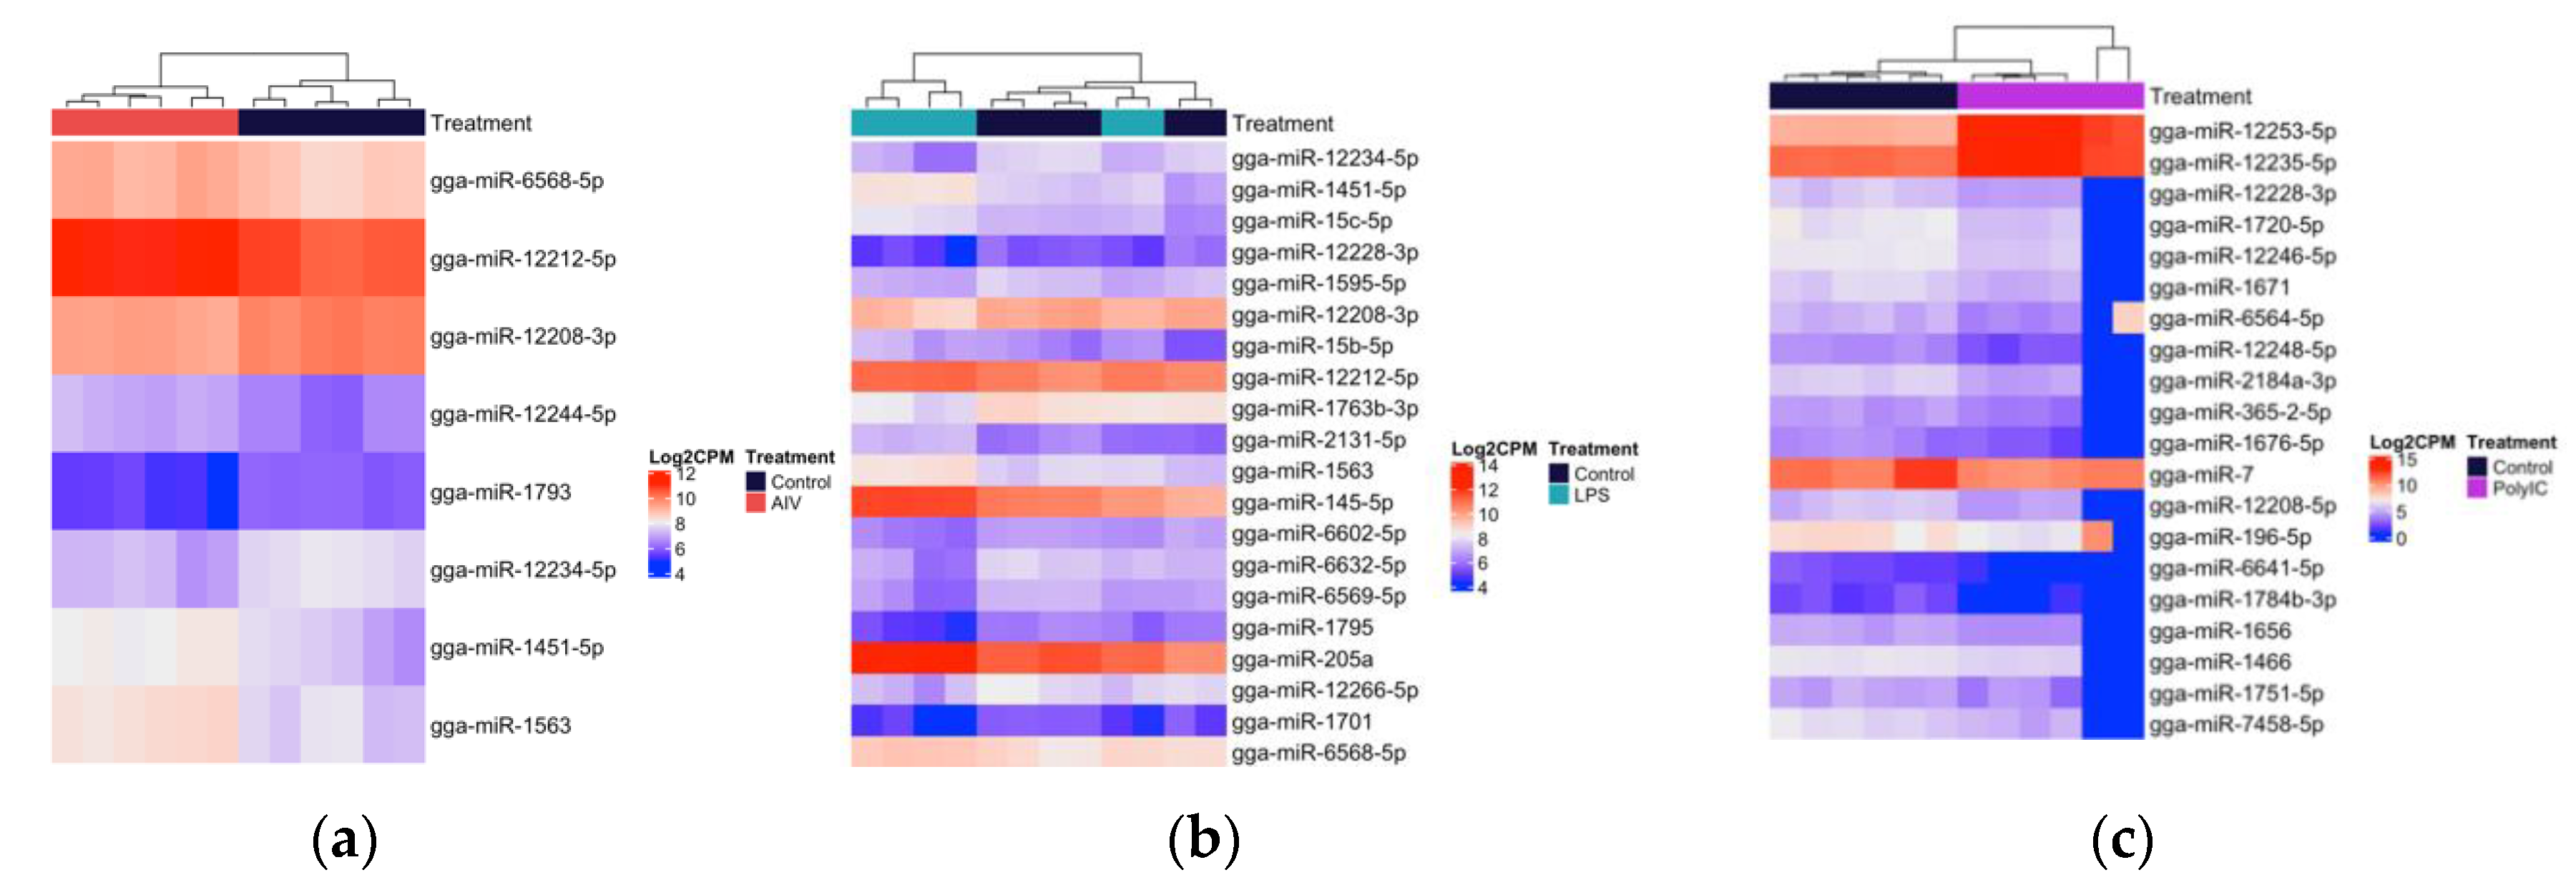
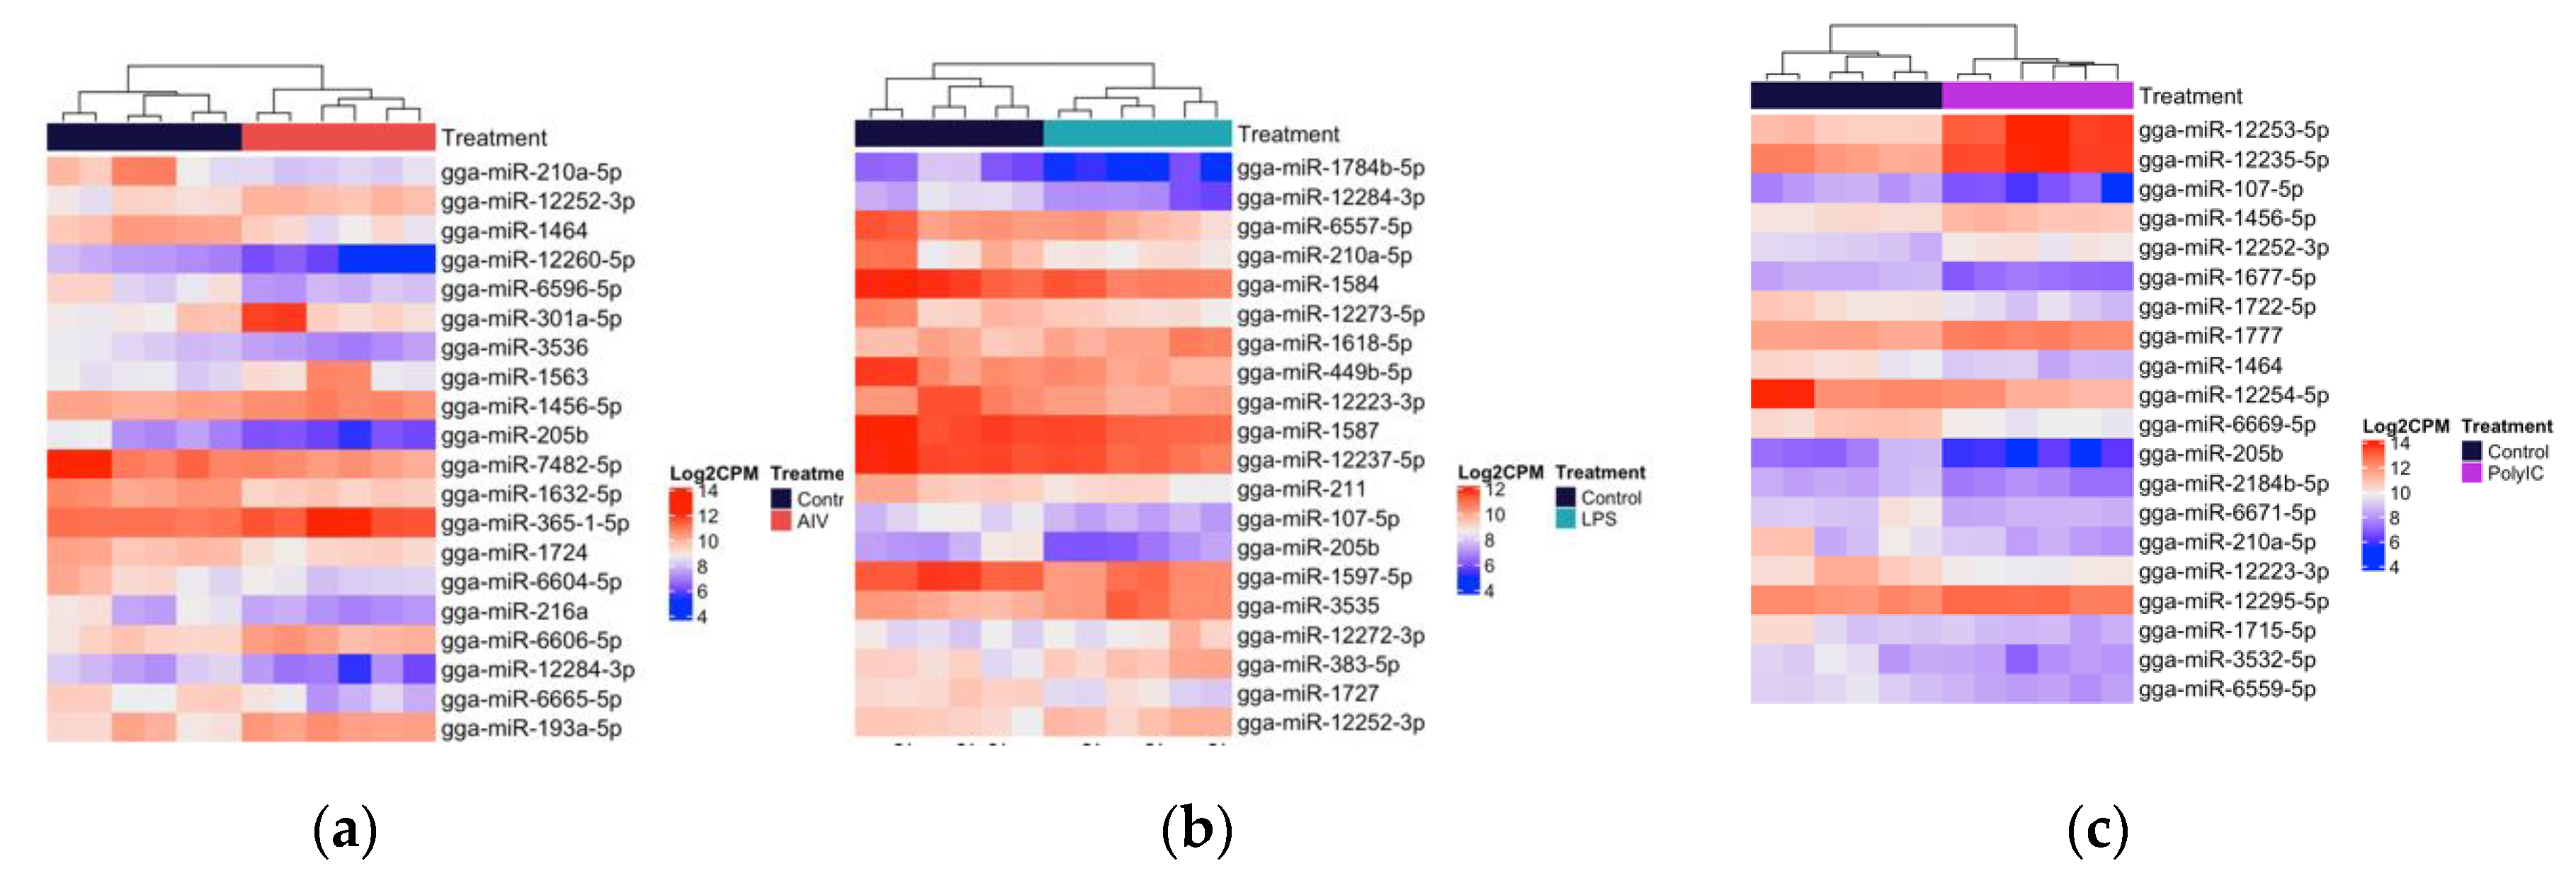
3.2. Cellular and EV Treatment Groups Have Distinct miRNAs Expression Profiles

RNA quality control of the extracted RNA determined an average RNA integrity number (RIN) of 6.0 and an average concentration of 406 ng/μL. Following small-RNA sequencing, low-quality reads were filtered and adaptor sequences were trimmed. A total of 235,810,088 clean reads were obtained from TOC samples (three libraries per treatment group). A total of 27,298,247 clean reads were obtained From EV samples (three libraries per treatment group) (Table S1). Across all samples, the distribution of the small RNA sequencing length was consistent with the known length of mature miRNA, an average of 22 nucleotides [65]. The fragment lengths were primarily concentrated at 22 nucleotides (Figure S1).
The miRNA expression profiles were evaluated in order to determine the ability of AIV infection, and LPS and polyI:C stimulation to influence the expression of cellular and EV miRNAs. A total of 692 known mature chicken miRNAs were detected. Following differential expression filtering (FC ≥ 1.5 and FDR < 0.05) and mean difference plot analysis, 228 DE unique miRNAs were identified (Figures S2–S4). In addition, some DE miRNAs were present in several treatment groups (Figure 2, Figure S5).
Within the TOC 3 h groups, a total of 18 unique DE miRNAs, of which two miRNAs were found in more than one group (Figure 3a–c). Our results demonstrated that 11, three, and two miRNAs were up-regulated, while four miRNAs were down-regulated in the TOC 3 h, AIV group (Table 1 and Table 2). There were two miRNAs, gga-miR-1608 and gga-miR-6705-5p, which were DE in both the TOC 3 h AIV and TOC 3 h LPS groups (Figure 2a, Table S2). Furthermore, within the TOC 18 h groups, our results showed a total of 88 unique DE miRNAs, of which six miRNAs were found in more than one group (Figure 4a–c). In the TOC 18 h groups, three, 32, and two miRNAs were up-regulated, and two, 15, and 40 miRNAs were down-regulated following treatment with AIV, LPS and polyI:C, respectively (Table 1 and Table 2). There were three miRNAs, gga-miR-1451-5p, gga-miR-1563, and gga-miR-12234-5p, which were DE in both TOC 18 h AIV and TOC 18 h LPS groups and three miRNAs, gga-miR-6569-5p, gga-miR-12228-3p, and gga-miR-2184a-3p, which were DE in both the TOC 18 h LPS and TOC 18 polyI:C groups (Figure 2b, Table S3).
With respect to the EV groups, a total of 145 unique DE miRNAs were identified, in which 59 miRNAs were found in more than one group (Figure 5a–c). Our results exhibited that 21, five, and 14 miRNAs were up-regulated in AIV, LPS, and polyI:C groups, respectively, while 57, 17, and 90 miRNAs were down-regulated in AIV, LPS, and polyI:C groups, respectively (Table 3 and Table 4). There were 10 miRNAs, gga-miR-107-5p, gga-miR-1784b-5p, gga-miR-449b-5p, gga-miR-205b, gga-miR-210a-5p, gga-miR-1727, gga-miR-1464, gga-miR-6665-5p, gga-miR-7482-5p, and gga-miR-12284-3p, which were DE in all EV groups. In addition, there was one miRNA, gga-miR-383-5p, which was DE in both the EV AIV and EV LPS groups. Furthermore, 34 miRNAs were DE in both EV AIV and EV polyI:C groups. Moreover, four miRNAs, gga-miR-211, gga-miR-132b-5p, gga-miR-1597-5p, and gga-miR-12223-3p were DE in both EV LPS and EV polyI:C groups (Figure 2c, Table S4).
Across all TOC 3 h, TOC 18 h, and EV groups, there were 67 up-regulated miRNAs, 157 down-regulated miRNAs, and four miRNAs, gga-miR12244-5p, gga-miR210a-5p, gga-miR30b-5p, and gga-miR-383-5p, which were found to be up-regulated in some groups and down-regulated in others. The miRNA gga-miR12244-5p was up-regulated in the TOC 18 h AIV group and down-regulated in the EV AIV group and gga-miR210a-5p was up-regulated in the TOC 3 h AIV and TOC 18 h LPS groups and down-regulated in all three EV groups. The miRNA gga-miR30b-5p was up-regulated in the TOC 18 h LPS group and down-regulated in the EV polyI:C group and, finally, gga-miR-383-5p was up-regulated in the EV AIV and EV polyI:C groups and down-regulated in the TOC 3 h AIV group (Table 1, Table 2, Table 3 and Table 4).

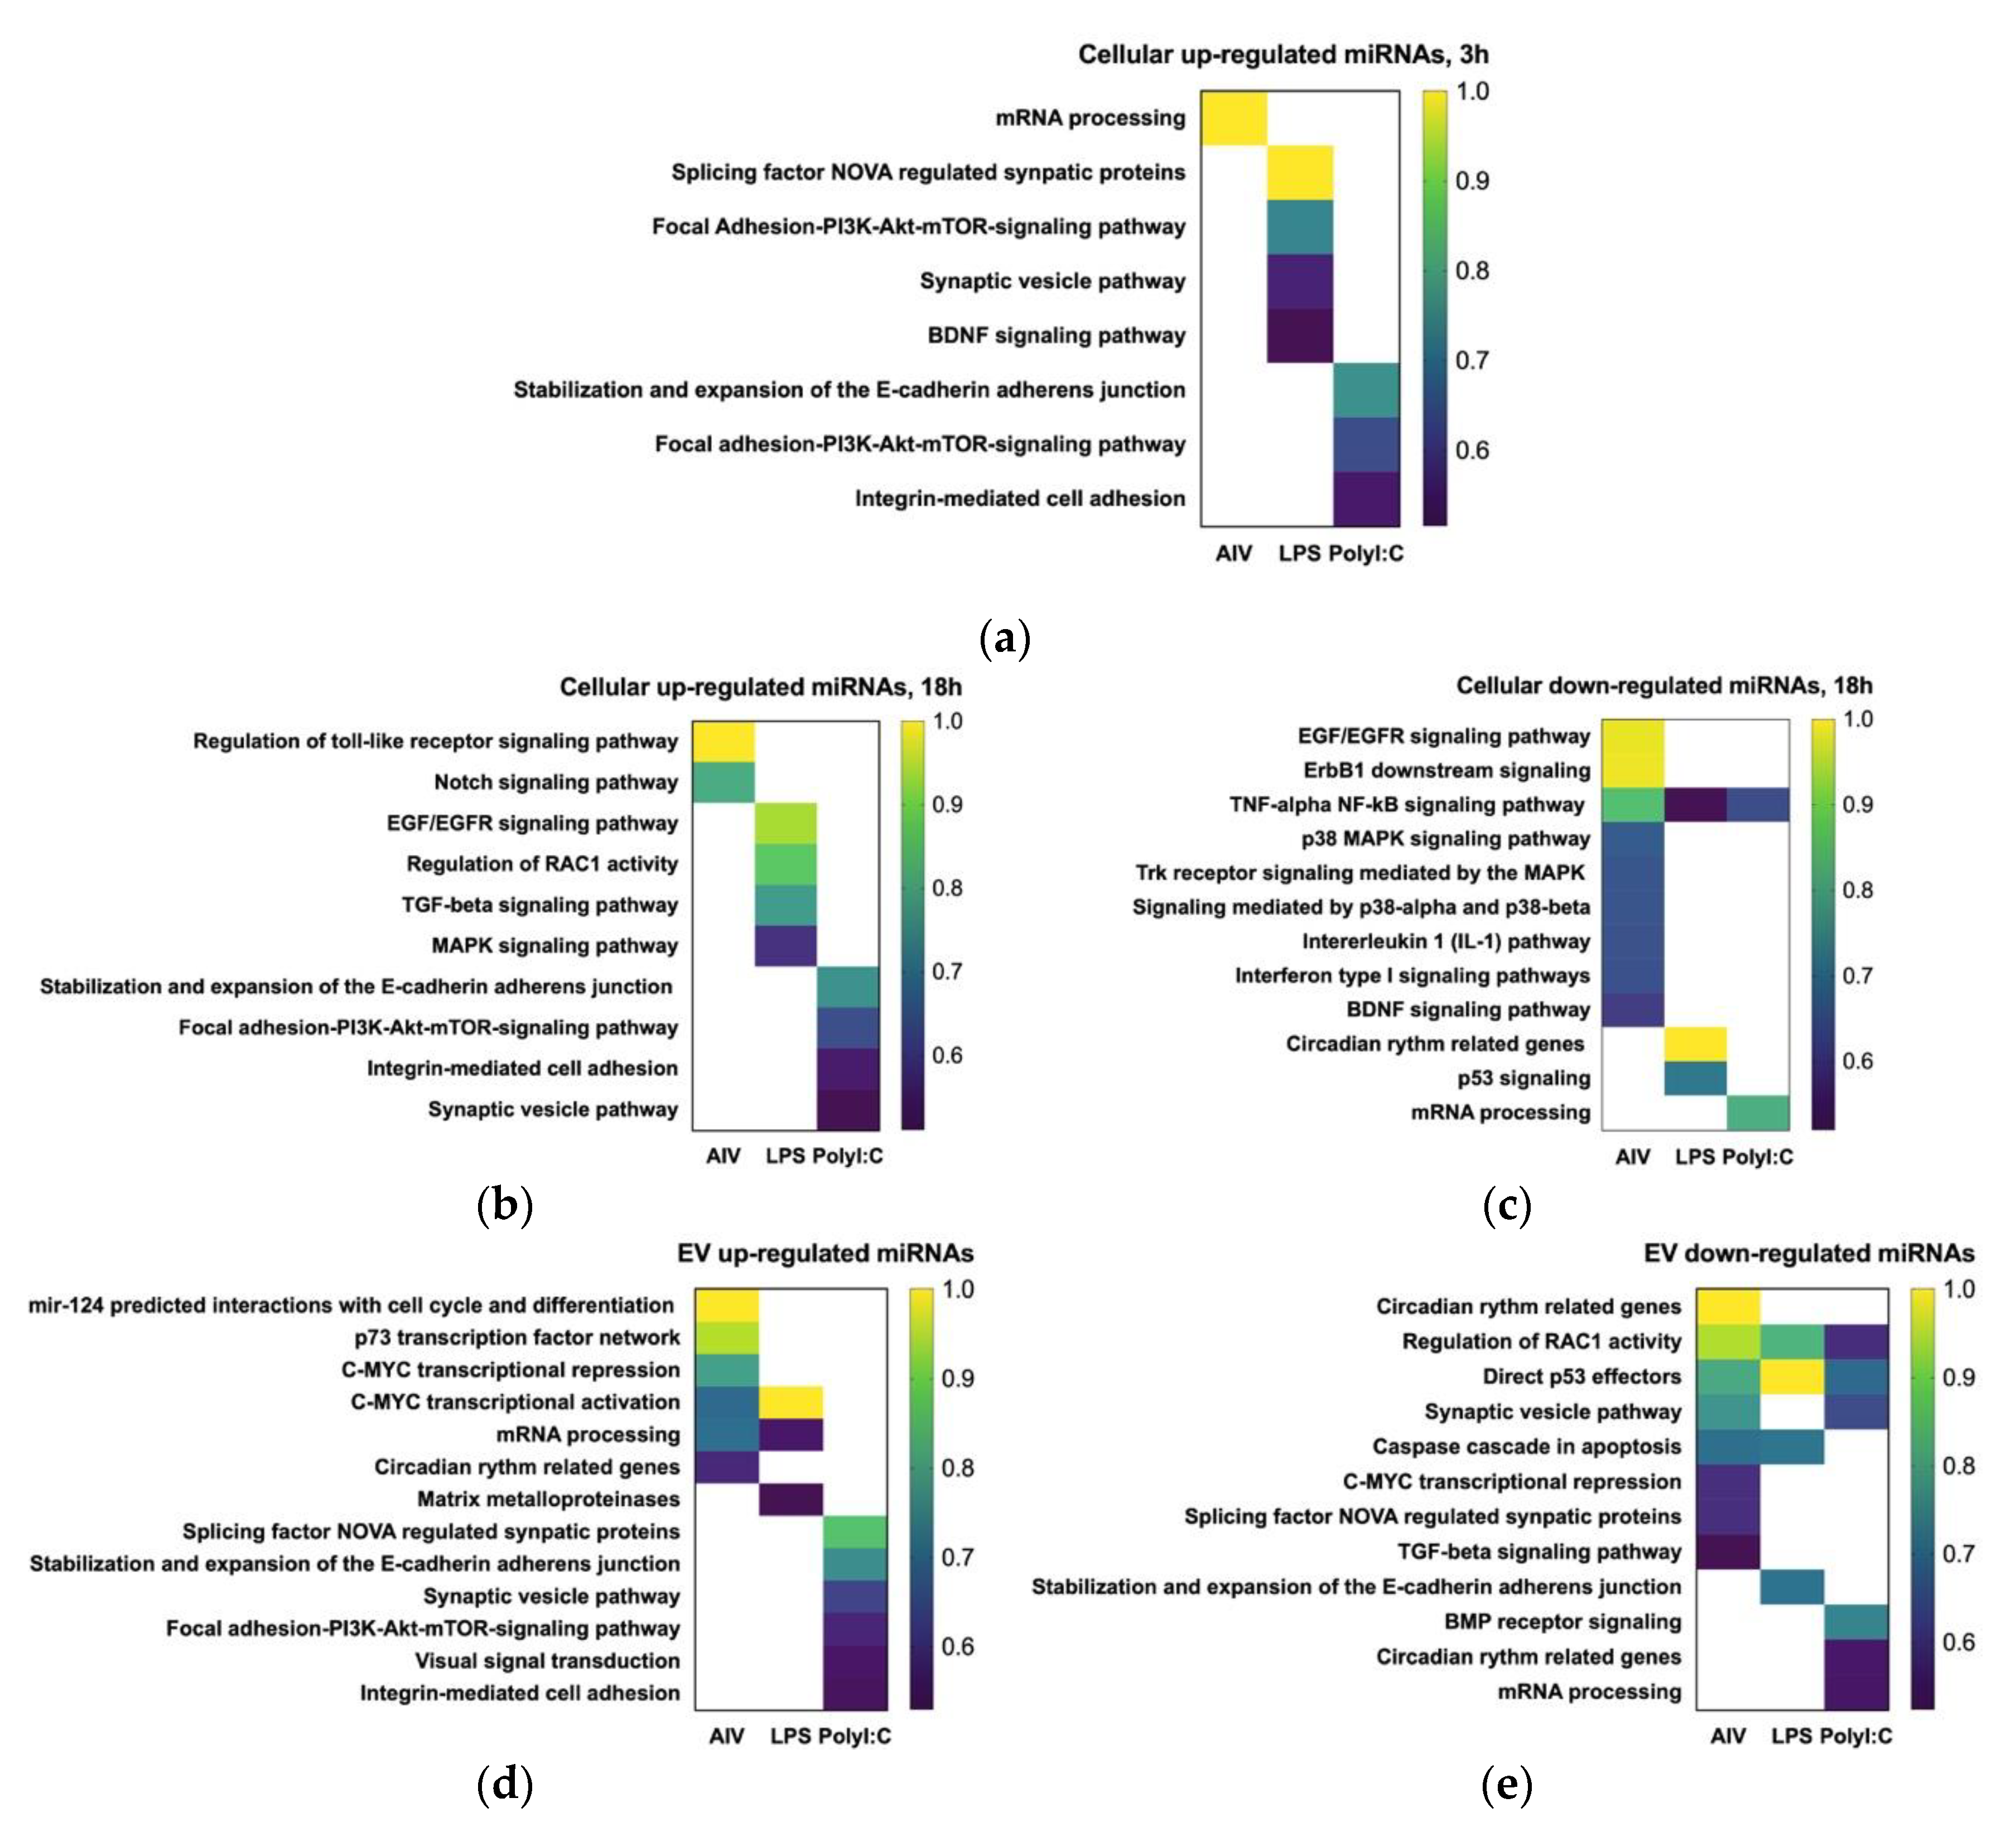
3.3. Target Gene Prediction and Functional Annotation Reveals DE miRNAs Target Multiple Pathways

The miRDB and TargetScan databases were used to predict the possible gene set or pathway targets of DE miRNAs to characterize molecular and immunoregulatory functions of DE miRNAs presented in the current study. Target genes were predicted based on Homo sapiens (human), Mus musculus (mouse), and Gallus gallus (chicken) targets. However, there was limited information on Gallus gallus targets; therefore, the results based on the chicken database are provided in the Supplementary Materials (Tables S5–S9). The results presented in this study are based on human and mice databases. A total of 105, 34, and 151 projected genes and three, four, and 14 projected pathways were targeted by 15, three, and two DE cellular miRNAs in 3 h TOC AIV, LPS, and polyI:C groups, respectively. Moreover, 25, 578, and 384 projected genes and 17, 14, and 17 projected pathways were targeted by five, 47, and 42 DE miRNAs in 18 h TOC AIV, LPS, and polyI:C treatment groups, respectively (Table 5, Table 6 and Table 7). Finally, a total of 487, 147, and 817 genes and 16, 11, and 23 pathways were identified as targets for 78, 22, and 104 DE EV miRNAs following AIV, LPS, and polyI:C treatments (EV samples), respectively (Table 5, Table 8 and Table 9). The targeted pathways related to immune responses and intracellular signaling are illustrated in Figure 6, while a complete list of targeted pathways and the respectively responsible miRNAs are provided in Table 6, Table 7, Table 8 and Table 9.
Our data demonstrated that DE miRNAs may target several genes and pathways that play roles in cell physiology, cell cycle, and immune responses. Based on the target pathway predictions obtained for the TOC 3 h groups, some miRNA may regulate several pathways, such as the brain-derived neurotrophic factor (BDNF) and PI3K-Akt-mTOR-signaling pathways. In addition, the PI3K-Akt-mTOR-signaling pathway was predicted for target genes of both the up-regulated TOC 3 h LPS and up-regulated TOC 3 h polyI:C groups, and they could be regulated by different miRNAs, such as gga-miR-6704-5p and gga-miR-12235-5p, respectively (Figure 6a, Table 6).
For TOC 18 h groups, the TNF-alpha NF-κB signaling pathway was found to be targeted by gga-miR-1793, gga-miR-7457-5p (AIV group), and gga-miR-6641-5p (LPS group) and gga-miR-7480-5p (polyI:C group). Finally, for the TOC 18 h AIV treatment group, the regulation of TLR signaling pathway was found to be targeted by gga-miR-12244-5p, which was DE following AIV infection (Figure 6b,c, Table 6 and Table 7).
The results presented here demonstrated that EV up-regulated miRNAs following AIV infection potentially could target gene sets related to mRNA processing and c-myc, while other gene sets or pathways could be targeted by EV down-regulated miRNA following AIV infection, such as the TGF-beta pathway and caspase cascade in apoptosis. Some gene sets, such as c-myc or TGF-beta signaling related genes related genes, can be regulated by both up-regulated or down-regulated EV miRNAs following AIV infection.
Our results demonstrated that certain pathways were uniquely targeted by DE miRNAs in a specific treatment group. For example, it was predicted that the p73 transcription factor network may be targeted by up-regulated miRNAs following AIV infection in EV samples. Our results predicted that the caspase cascade during the apoptosis process can be regulated by gga-miR-1784b-5p, which was down-regulated in both the EV LPS and EV polyI:C groups. DE EV miRNAs following polyI:C treatment, such as gga-miR-12235-5p, gga-miR-1632-5p, gga-miR-218-5p, and gga-miR-7482-5p, are potentially able to regulate circadian rhythm related genes, direct p53 effectors and PI3K-Akt-mTOR-signaling pathway (Figure 6d,e, Table 8 and Table 9).
It was projected that some DE miRNAs, such as gga-miR-449b-5p or gga-miR-205b may target several pathways. For example, gga-miRNA-205b can potentially regulate mRNA processing, p53 transcription factor and Ras-related C3 botulinum toxin substrate 1 (RAC1) pathway (Table 9). Furthermore, gga-miR-12284-3p was also a miRNA down-regulated in all EV groups. Our data from the target gene set prediction within all three different treatments showed that this miRNA could regulate p53 transcription factor (Table 9). The gga-miR-383-5p, which was down-regulated in the TOC 3 h treatment group, was predicted to target and potentially regulate the c-myc pathway (Table 8). In addition, this miRNA was up-regulated following infection with AIV and stimulation with LPS in the EV treatment groups and it may also target the c-myc pathway based on the EV data (Table 9).

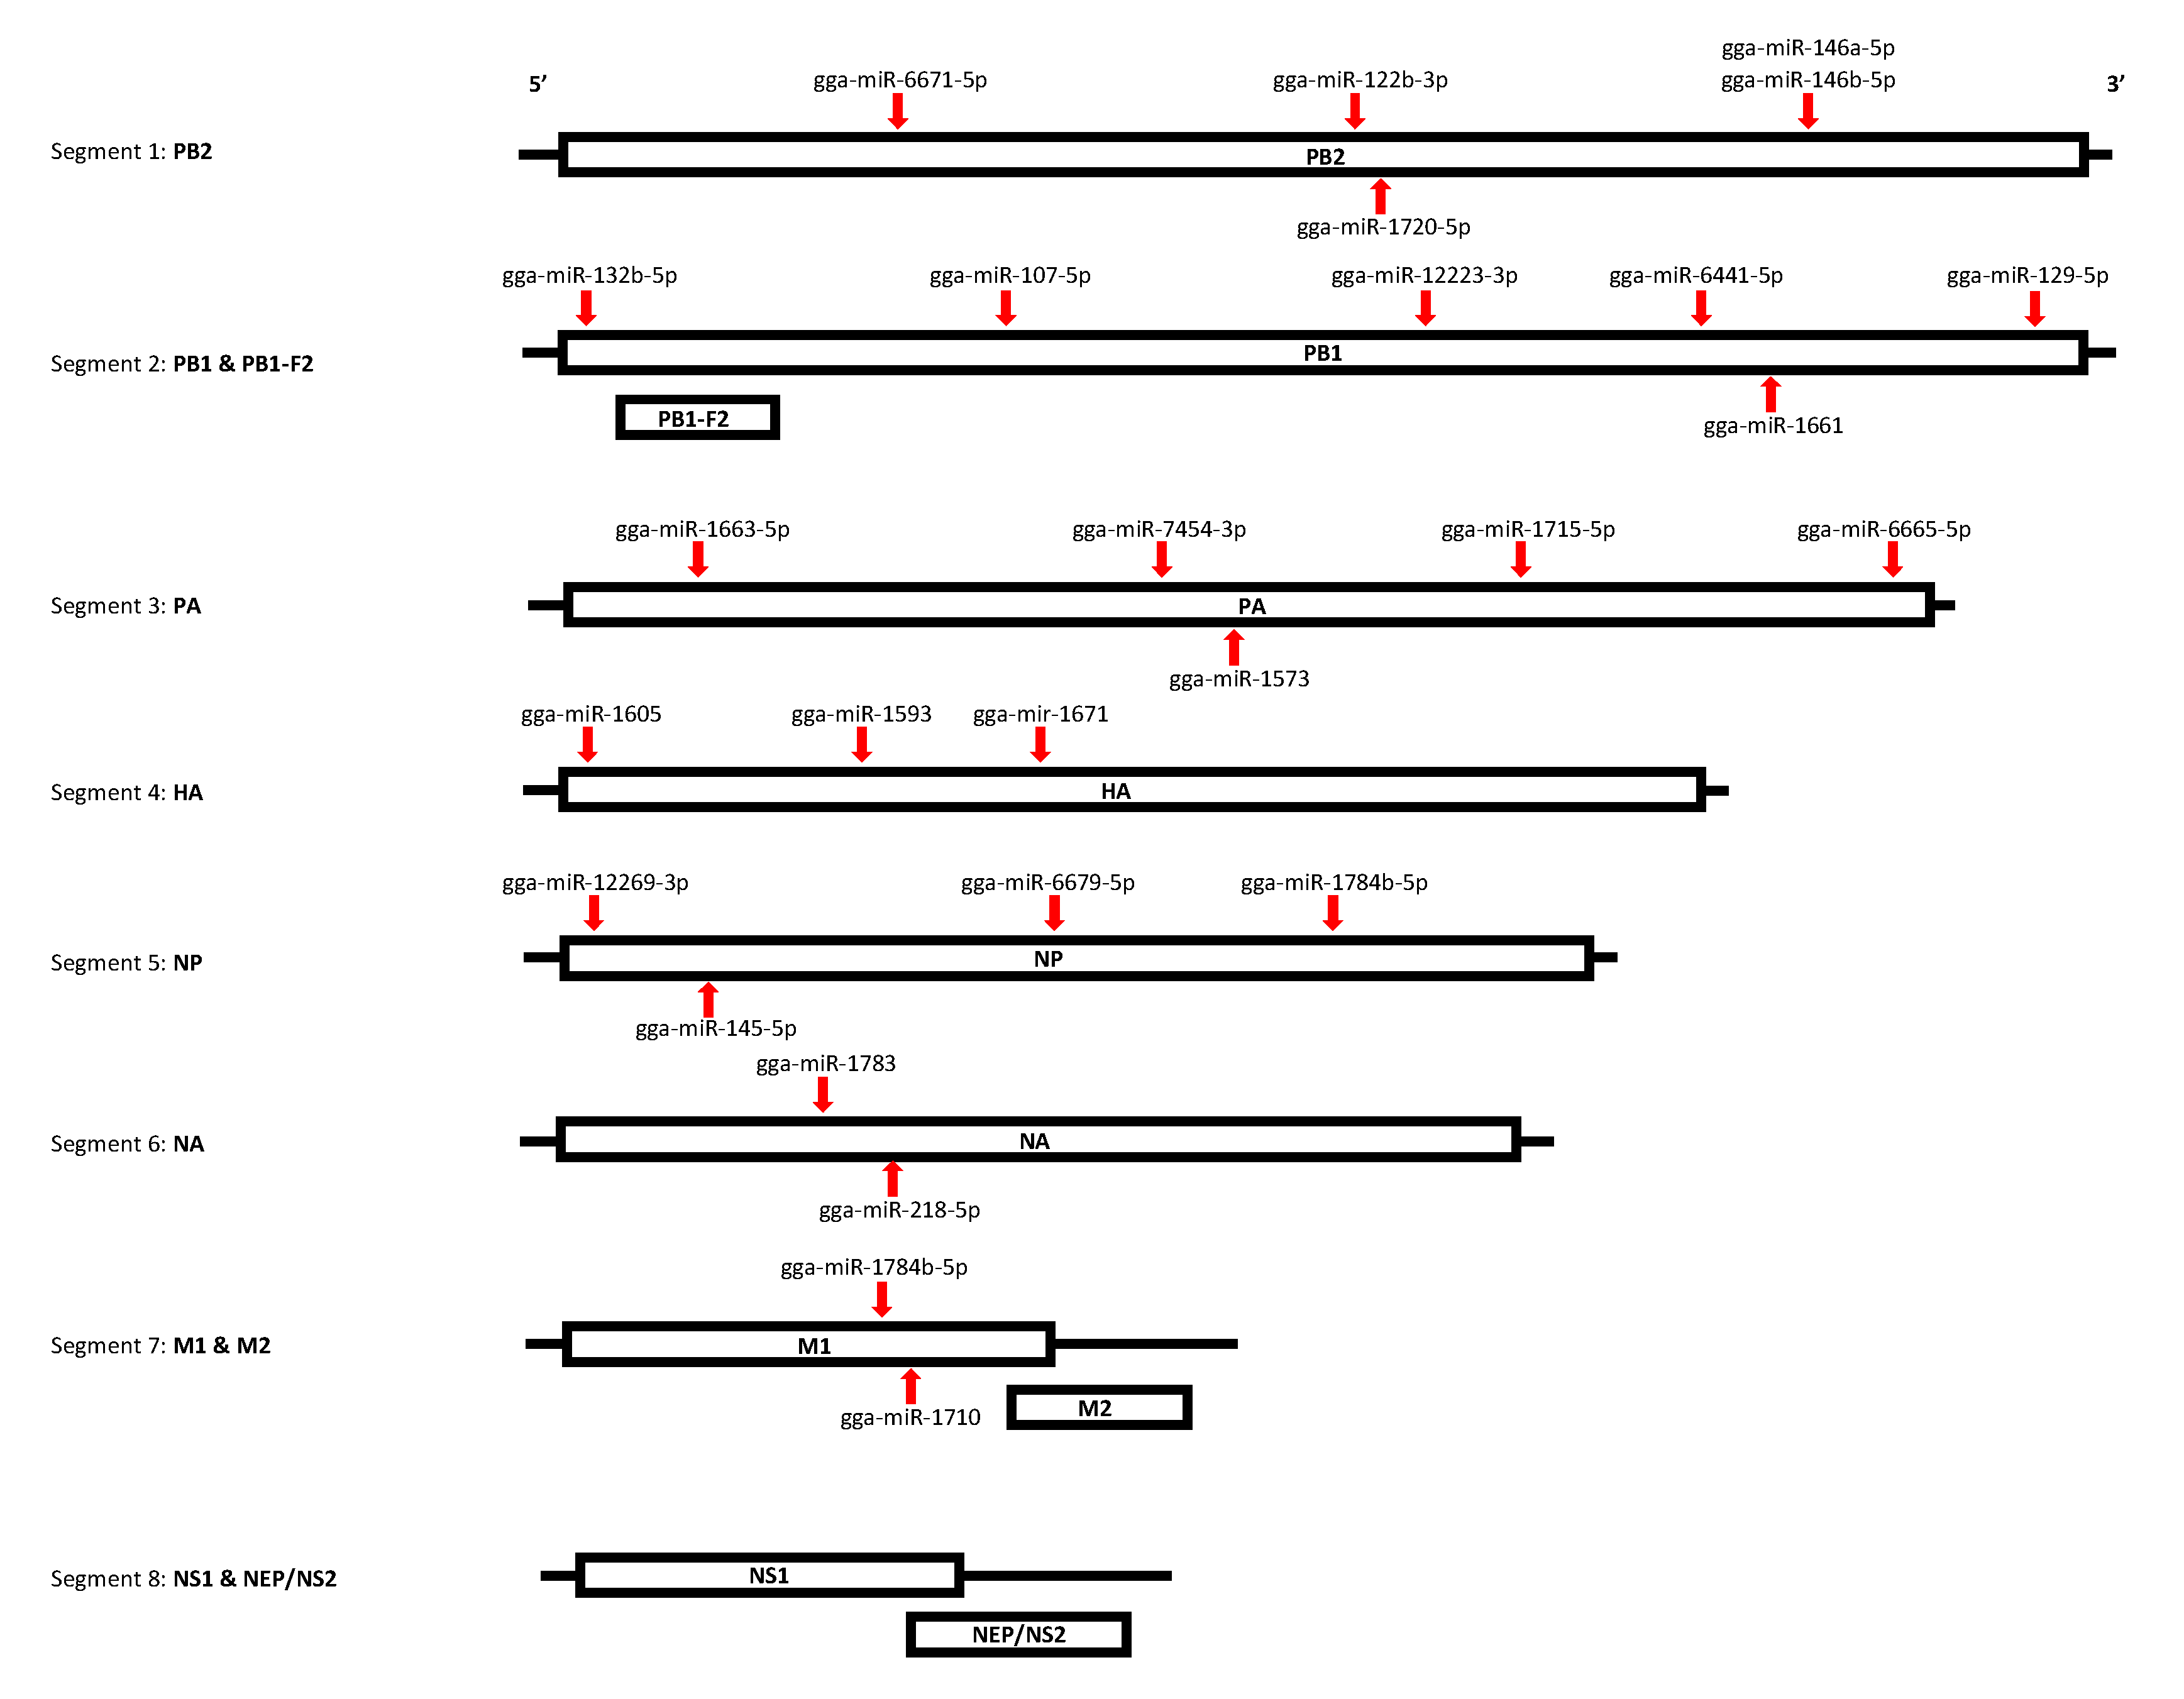
3.4. The Functional Annotation Reveals DE miRNAs Target Multiple Segments of the AIV Viral Genome

We also investigated the target of miRNAs within the AIV viral genome in order to determine the possible roles of DE miRNAs in AIV infection. A total of 26 miRNAs were determined to target at least one segment of the viral genome (Table 10). One miRNA, gga-miR-1784b-5p, was found to potentially target two viral segments, segment 5 (NP protein) and segment 7 (M1 protein). Figure 7 illustrates the target sites within the viral segments. Our results demonstrated that some down-regulated EV miRNAs such as gga-miR-107-5p, gga-miR-6665-5p and gga-miR-1784b-5p, possibly can target AIV segments (Table 10). Among the DE miRNAs targeting the AIV viral genome in both the TOC and EV treatment groups, 4 miRNAs were up-regulated, and 22 miRNAs were down-regulated. In addition, the secondary structures for the miRNA-RNA interactions were predicted using RNAhybrid, which was also used to predict and confirm the mfe values predicted by miRanda (Figure S6).

4. Discussion

Studies investigating cellular miRNAs following viral infections are essential for providing insight into the role of miRNAs in intracellular communication and the induction of antiviral responses. Identifying the mechanisms that can be regulated by miRNAs following infections or treatments will expand the current knowledge of host-pathogen interactions. This regulation is complex and, while host miRNAs can positively regulate antiviral responses, viruses have also been shown to impact miRNA expression to favor viral infection [66]. Here, we report for the first time that chicken tracheal cells secrete EVs. This work revealed that EV miRNAs have the potential to regulate antiviral responses in chickens. Furthermore, we observed that the miRNA profiles of chicken tracheal cells depend on the source (cellular versus EV) and the treatment (AIV, LPS, or polyI:C). These differences in the profile of miRNAs can be associated with active machinery of cargo loading during EV maturation and release. Previous studies have demonstrated that multiple mechanisms, including the endosomal sorting complex required for transport (ESCRT)-dependent and ESCRT-independent pathways, regulate the content of the EVs [67,68]. In addition, viral infections or stimulation via TLRs can change the EV cargo composition by targeting these pathways [8].
Additionally, we found a group of miRNAs that are in common among the different treatment groups in EV samples, while they are significantly affected by treatments. This suggests that, while the treatment groups have distinct miRNA expression profiles, certain miRNAs may have a fundamental role in which their loading into the EVs is independent of treatment or independent of the active cargo loading process.
EVs and their contents, including miRNAs, play critical roles in the regulation of the immune responses in the recipient cells by either activating or suppressing immune response genes [69,70]. In the context of influenza virus infections, previous studies demonstrated that miRNAs regulate antiviral responses by suppressing intracellular signaling pathways or activating pathways downstream of pattern recognition receptors (PRRs). For example, miR-92-5p, which was up-regulated in EVs following AIV infection, is able to enhance the activity of the NF-κB pathway [71]. Meanwhile, the expression of miR-449b-5p was suppressed following virus infection. The miR-449 family mainly interfere with influenza virus infection by enhancing type I IFNs [18]. Therefore, as highlighted in this study, the type of stimuli affected the EV cargo and, subsequently, can have potential impact on the recipient cells. It is likely to expect that the treatment of host cells with specific miRNAs in EVs that activate antiviral responses in the recipient cells may limit the replication of the virus in the neighboring cells. On the other hand, the virus may down-regulate the expression of some EV miRNAs and interfere with antiviral responses.
Network-guided gene set characterization analysis using KnowEnG’s analytical platform enabled the identification of important GO terms and pathways, while incorporating co-expression relationships among targets of DE miRNAs [53]. These pathway analyses demonstrated that DE EV miRNAs can target several pathways that are critical during influenza virus infection, such as RAC1 and TGF-beta signaling pathways. The RAC1 pathway has been shown to enhance the replication of the influenza virus [72]. Therefore, targeting this pathway, through specific miRNAs, such as miR-205a, can be a strategy to limit the replication of the influenza virus either in the target cells or neighboring cells through EVs.
Analysis of the miRNA profile in chicken tracheal cells at different time points showed that the type of stimuli impacts the profile of DE miRNAs. For instance, the majority of the differentially expressed miRNAs were down-regulated in the polyI:C treatment group, while the majority of the differentially expressed miRNAs were up-regulated in AIV infection group at an early time point. Previous studies in chickens highlighted the possible role of miRNAs in the regulation of immune responses and the modulation of Marek’s disease virus or avian influenza virus. As highlighted in the study by Wang et al., the profile of expressed miRNAs or miRNA-related mechanisms that are involved in the regulation host immune response could vary depending on the type of virus, cell stimuli, and the time point [33,73].
Moreover, as previously suggested, our analyses showed that multiple miRNAs can target the same gene and that, equally, a single miRNA can have multiple gene targets [74]. This suggests that it is potentially a combination of miRNA activities that modulate target gene expression. Among the cellular TOC samples, the distinct miRNA expression characteristics at different post-infection or -stimulation time points (3 h and 18 h) suggests that the expression of certain miRNAs is time-dependent. There were not any common DE miRNAs within each treatment group among different time points.
While the functions of most of the DE miRNAs identified in the various treatment groups remain unknown, some have been reported to be involved in the regulation of host immune responses and host-pathogen interactions. Previously, we showed that, in the same tissues, LPS is a potent TLR ligand for inducing pro-inflammatory cytokines, such as IL-6 and IL-1β cells, which limit the replication of AIV [1,2,36]. The current study showed that LPS up-regulated the expression of miR-146a in tracheal cells at a later time point. A previous study demonstrated that the activation of NF-κB signaling pathway leads to the up-regulation of miR-146a, which regulates and controls pro-inflammatory responses [75]. Moreover, miR-181 family, including miR-181a and -b, regulates pro-inflammatory responses by regulating NF-κB signaling pathway [76,77,78]. In this study, the expression of both miRNA-181a and -b was increased following LPS treatment. This result is in alignment with previous reports indicating increased expression of miR181b following LPS treatment in chicken macrophages [79]. Therefore, expressed miRNAs, such as miR-181 family or 146a following LPS treatment, can control pro-inflammatory responses through the NF-κB signaling pathway.
In addition, the results of the current study demonstrated that some miRNAs have the potential to target both innate and adaptive immune responses. For example, some DE miRNAs, such as gga-miR-205b and gga-miR-124a-5p, target p53 signaling pathway (Figure 6c,e, Tables 7,9). It has been demonstrated that p53 serves as a host antiviral factor by enhancing cytokine and antiviral gene responses in the lung, increasing the activity of dendritic cells (DC) and influenza-specific CD8+ T cells [80]. Therefore, these miRNAs could be employed to develop anti-influenza strategies and vaccine adjuvants for the control of AIV in chickens.
In addition, previous studies have also implied that miR-146 is involved in the regulation of immune responses to Salmonella infection in mice and it has direct targets within TLR signaling [81,82,83]. Our results indicated that gga-miR-12244-5p may target TLR signaling pathways. The miRNA gga-miR-146b-5p was previously suggested to be involved in the general process of inflammation during Avian pathogenic Escherichia coli (APEC) infection in chickens [28].
The DE miRNAs play a role in the regulation of antiviral responses, but they also might target the AIV genome. We were interested in miRNA target sites in the AIV genome, as recent studies have indicated that miRNAs may be capable of regulating virus translation and replication by directly binding to the virus genome [22,23,24,25,26,27]. While investigating the potential targets in the AIV viral genome, we determined that seven out of eight segments were targeted by at least one miRNA, suggesting that it is possibly a combination or cooperation of miRNA activity that can control viral activity. Our results demonstrated that both gga-miR-146a-5p and gga-miR-146b-5p, which are part of the same gene family, target segment 1 (PB2 protein) of the AIV genome. This suggests that, while gga-miR-146a-5p and gga-miR-146b-5p may play a role in modulating TLR signaling, they potentially have a dual function in regulating the PB1 protein. In addition, gga-miR-1784b-5p was the only miRNA identified that targeted more than one viral segment of AIV, both segment 5 (NP protein) and segment 7 (M1 protein). Our results suggest that this miRNA has multiple targets, both in the host and viral genomes. Several other miRNAs, gga-miR-129-5p, gga-miR-6641-5p, and gga-miR-1663-5p, target host mRNA processing and NF-kB signaling pathways, while also potentially targeting segments 2 (PB1 protein) and 3 (PA protein) of AIV.

5. Conclusions

In summary, we investigated the global miRNA expression profile in chicken tracheas in response to AIV infection and TLR ligand stimulation and the potential roles of specific DE miRNAs. Our results highlighted the possible role of EV contents in regulating antiviral responses. This accumulated evidence presented here elucidated the potential function of the candidate miRNAs on the host responses to AIV infection. We inferred that miRNAs play a major role in AIV infection and they can coordinate host defense against viral infections. In this study, the miRNA expression profiles were significantly regulated by the treatments with AIV, LPS, and polyI:C. These DE miRNAs were found to potentially target both host and viral genes. This study identified several miRNAs, such as miR-146a, miR-146b, miR-205a, miR205b, and miR-449, which could be employed in alternative strategies for the control of AIV in chickens, such as miRNA-based antiviral agents or vaccine adjuvants. Further functional studies are required to confirm the effect of treatment with candidate miRNA to inhibit AIV infection and induce stronger immune responses in in vitro and in vivo models.

Supplementary Materials

The following are available online at https://www.mdpi.com/2076-393X/8/3/438/s1, Figure S1: Sequence length distribution of miRNAs, Figure S2: Up- and down-regulated DE miRNAs in the (a) TOC 3 h AIV, (b) TOC 3 h LPS and (c) TOC 3 h polyI:C treatment groups, Figure S3: Up- and down-regulated DE miRNAs in the (a) TOC 18 h AIV, (b) TOC 18 h LPS and (c) TOC 18 h polyI:C treatment group, Figure S4: Up- and down-regulated DE miRNAs in the (a) EV AIV, (b) EV LPS and (c) EV polyI:C treatment groups, Figure S5: Visualization of intersecting sets of DE miRNAs in (a) TOC 3h groups treated with AIV, LPS and polyI:C, (b) TOC 18h groups treated with AIV, LPS and polyI:C and (c) EXO groups treated with AIV, LPS and polyI:C, Figure S6: Predicted secondary structures for miRNA targeting viral genome, Table S1: Normalized reads from small RNA sequencing, Table S2: Intersecting sets of DE miRNAs among TOC 3 h, Table S3: Intersecting sets of DE miRNAs among TOC 18 h, Table S4: Intersecting sets of DE miRNAs among EV groups, Table S5: Pathway analysis summary using the miRDB Gallus gallus database, Table S6: Prediction of pathways targeted by up-regulated cellular DE miRNAs using the miRDB Gallus gallus database, Table S7: Prediction of pathways targeted by down-regulated cellular DE miRNAs using the miRDB Gallus gallus database, Table S8: Prediction of pathways targeted by up-regulated EV DE miRNAs using the miRDB Gallus gallus database, Table S9: Prediction of pathways targeted by down-regulated EV DE miRNAs using the miRDB Gallus gallus database

Author Contributions

N.B and M.E. conceived and designed the experiments; K.O. and M.E. performed the experiments; K.O., M.E., M.R.E.K., A.E., E.M.I.-A. and N.B. analyzed the data; C.A.G. and N.B. contributed reagents/materials/analysis tools; K.O., M.E. and N.B. wrote the paper. N.B. spearheaded the project as the principal investigator. All authors have read and agreed to the published version of the manuscript.

Funding

Funding for this study was provided by the Quebec Respiratory Health Research Network (QRHN), J.L Lévesque Foundation and Université de Montréal. Kelsey O’Dowd was a recipient of a scholarship from the CRIPA, a research network financially supported by the Fonds de recherche du Québec – Nature et technologies (FRQNT).

Acknowledgments

This research was enabled in part by support provided by the Canadian Center for Computational Genomics (www.computationalgenomics.ca) and Compute Canada (www.computecanada.ca). The Canadian Center for Computational Genomics (C3G) is a Genomics Technology Platform (GTP) supported by the Canadian Government through Genome Canada. We would like to thank Hojatollah Vali, S Kelly Sears, and Jeannie Mui at the facility for electron microscopy research, McGill University, for their help and support. We would like to thank the Research Center of the CHU-Université Laval for their help and support for small-RNA sequencing.

Conflicts of Interest

The authors declare no conflict of interest.

References

  1. Barjesteh, N.; Shojadoost, B.; Brisbin, J.T.; Emam, M.; Hodgins, D.C.; Nagy, É.; Sharif, S. Reduction of avian influenza virus shedding by administration of Toll-like receptor ligands to chickens. Vaccine 2015, 33, 4843–4849. [Google Scholar] [CrossRef] [PubMed]
  2. Barjesteh, N.; Alkie, T.N.; Hodgins, D.C.; Nagy, É.; Sharif, S. Local innate responses to TLR ligands in the chicken trachea. Viruses 2016, 8, 207. [Google Scholar] [CrossRef] [PubMed] [Green Version]
  3. Paul, M.S.; Mallick, A.I.; Read, L.R.; Villanueva, A.I.; Parvizi, P.; Abdul-Careem, M.F.; Nagy, É.; Sharif, S. Prophylactic treatment with Toll-like receptor ligands enhances host immunity to avian influenza virus in chickens. Vaccine 2012, 30, 4524–4531. [Google Scholar] [CrossRef] [PubMed]
  4. Rivera, A.; Siracusa, M.C.; Yap, G.S.; Gause, W.C. Innate cell communication kick-starts pathogen-specific immunity. Nat. Immunol. 2016, 17, 356–363. [Google Scholar] [CrossRef]
  5. McCoy-Simandle, K.; Hanna, S.J.; Cox, D. Exosomes and nanotubes: Control of immune cell communication. Int. J. Biochem. Cell Biol. 2016, 71, 44–54. [Google Scholar] [CrossRef] [Green Version]
  6. Willms, E.; Johansson, H.J.; Mäger, I.; Lee, Y.; Blomberg, K.E.M.; Sadik, M.; Alaarg, A.; Smith, C.I.E.; Lehtiö, J.; El Andaloussi, S.; et al. Cells release subpopulations of exosomes with distinct molecular and biological properties. Sci. Rep. 2016, 6, 1–12. [Google Scholar] [CrossRef]
  7. Zhang, Y.; Liu, Y.; Liu, H.; Tang, W.H. Exosomes: Biogenesis, biologic function and clinical potential. Cell Biosci. 2019, 9, 1–18. [Google Scholar] [CrossRef]
  8. Chahar, H.S.; Corsello, T.; Kudlicki, A.S.; Komaravelli, N.; Casola, A. Respiratory syncytial virus infection changes cargo composition of exosome released from airway epithelial cells. Sci. Rep. 2018, 8, 1–18. [Google Scholar] [CrossRef] [Green Version]
  9. Chettimada, S.; Lorenz, D.R.; Misra, V.; Dillon, S.T.; Reeves, R.K.; Manickam, C.; Morgello, S.; Kirk, G.D.; Mehta, S.H.; Gabuzda, D. Exosome markers associated with immune activation and oxidative stress in HIV patients on antiretroviral therapy. Sci. Rep. 2018, 8, 1–16. [Google Scholar] [CrossRef]
  10. Petrik, J. Immunomodulatory effects of exosomes produced by virus-infected cells. Transfus. Apher. Sci. 2016, 55, 84–91. [Google Scholar] [CrossRef]
  11. Yao, Z.; Qiao, Y.; Li, X.; Chen, J.; Ding, J.; Bai, L.; Shen, F.; Shi, B.; Liu, J.; Peng, L.; et al. Exosomes exploit the virus entry machinery and pathway to transmit alpha interferon-induced antiviral activity. J. Virol. 2018, 92. [Google Scholar] [CrossRef] [PubMed] [Green Version]
  12. Brennecke, J.; Stark, A.; Russell, R.B.; Cohen, S.M. Principles of microRNA-target recognition. PLoS Biol. 2005, 3. [Google Scholar] [CrossRef] [PubMed]
  13. Catalanotto, C.; Cogoni, C.; Zardo, G. MicroRNA in control of gene expression: An overview of nuclear functions. Int. J. Mol. Sci. 2016, 17, 1712. [Google Scholar] [CrossRef] [PubMed] [Green Version]
  14. Lewis, B.P.; Burge, C.B.; Bartel, D.P. Conserved seed pairing, often flanked by adenosines, indicates that thousands of human genes are microRNA targets. Cell 2005, 120, 15–20. [Google Scholar] [CrossRef] [Green Version]
  15. Felekkis, K.; Touvana, E.; Stefanou, C.; Deltas, C. MicroRNAs: A newly described class of encoded molecules that play a role in health and disease. Hippokratia 2010, 14, 236–240. [Google Scholar]
  16. Sohel, M.H. Extracellular/circulating microRNAs: Release mechanisms, functions and challenges. Achiev. Life Sci. 2016, 10, 175–186. [Google Scholar] [CrossRef] [Green Version]
  17. Buggele, W.A.; Johnson, K.E.; Horvath, C.M. Influenza A virus infection of human respiratory cells induces primary microRNA expression. J. Biol. Chem. 2012, 287, 31027–31040. [Google Scholar] [CrossRef] [Green Version]
  18. Buggele, W.A.; Krause, K.E.; Horvath, C.M. Small RNA profiling of influenza A virus-infected cells identifies miR-449b as a regulator of histone deacetylase 1 and interferon beta. PLoS ONE 2013, 8, e76560. [Google Scholar] [CrossRef] [Green Version]
  19. Yarbrough, M.L.; Zhang, K.; Sakthivel, R.; Forst, C.V.; Posner, B.A.; Barber, G.N.; White, M.A.; Fontoura, B.M.A. Primate-specific miR-576-3p sets host defense signalling threshold. Nat. Commun. 2014, 5, 4963. [Google Scholar] [CrossRef]
  20. McCaskill, J.L.; Ressel, S.; Alber, A.; Redford, J.; Power, U.F.; Schwarze, J.; Dutia, B.M.; Buck, A.H. Broad-spectrum inhibition of respiratory virus infection by microRNA mimics targeting p38 MAPK signaling. Mol. Ther. Nucleic Acids 2017, 7, 256–266. [Google Scholar] [CrossRef] [Green Version]
  21. Chen, L.; Song, Y.; He, L.; Wan, X.; Lai, L.; Dai, F.; Liu, Y.; Wang, Q. MicroRNA-223 promotes type i interferon production in antiviral innate immunity by targeting forkhead box protein O3 (FOXO3). J. Biol. Chem. 2016, 291, 14706–14716. [Google Scholar] [CrossRef] [PubMed] [Green Version]
  22. Song, L.; Liu, H.; Gao, S.; Jiang, W.; Huang, W. Cellular microRNAs inhibit replication of the H1N1 influenza A virus in infected cells. J. Virol. 2010, 84, 8849–8860. [Google Scholar] [CrossRef] [PubMed] [Green Version]
  23. Zheng, Z.; Ke, X.; Wang, M.; He, S.; Li, Q.; Zheng, C.; Zhang, Z.; Liu, Y.; Wang, H. Human microRNA hsa-miR-296-5p suppresses enterovirus 71 replication by targeting the viral genome. J. Virol. 2013, 87, 5645–5656. [Google Scholar] [CrossRef] [PubMed] [Green Version]
  24. Trobaugh, D.W.; Klimstra, W.B. MicroRNA regulation of RNA virus replication and pathogenesis. Trends Mol. Med. 2017, 23, 80–93. [Google Scholar] [CrossRef] [PubMed]
  25. Ingle, H.; Kumar, S.; Raut, A.A.; Mishra, A.; Kulkarni, D.D.; Kameyama, T.; Takaoka, A.; Akira, S.; Kumar, H. The microRNA miR-485 targets host and influenza virus transcripts to regulate antiviral immunity and restrict viral replication. Sci. Signal. 2015, 8, ra126. [Google Scholar] [CrossRef] [PubMed]
  26. Ma, Y.J.; Yang, J.; Fan, X.L.; Zhao, H.B.; Hu, W.; Li, Z.P.; Yu, G.C.; Ding, X.R.; Wang, J.Z.; Bo, X.C.; et al. Cellular microRNA let-7c inhibits M1 protein expression of the H1N1 influenza A virus in infected human lung epithelial cells. J. Cell. Mol. Med. 2012, 16, 2539–2546. [Google Scholar] [CrossRef]
  27. Khongnomnan, K.; Makkoch, J.; Poomipak, W.; Poovorawan, Y.; Payungporn, S. Human miR-3145 inhibits influenza A viruses replication by targeting and silencing viral PB1 gene. Exp. Biol. Med. 2015, 240, 1630–1639. [Google Scholar] [CrossRef] [Green Version]
  28. Jia, X.; Nie, Q.; Zhang, X.; Nolan, L.K.; Lamont, S.J. Novel microRNA involved in host response to avian pathogenic Escherichia coli identified by deep sequencing and integration analysis. Infect. Immun. 2017, 85. [Google Scholar] [CrossRef] [Green Version]
  29. Chen, Y.; Liu, W.; Xu, H.; Liu, J.; Deng, Y.; Cheng, H.; Zhu, S.; Pei, Y.; Hu, J.; Hu, Z.; et al. MicroRNA expression profiling in Newcastle disease virus-infected DF-1 cells by deep sequencing. Front. Microbiol. 2019, 10, 1659. [Google Scholar] [CrossRef] [Green Version]
  30. Mu, J.; Liu, X.; Yu, X.; Li, J.; Fei, Y.; Ding, Z.; Yin, R. Cellular microRNA expression profile of chicken macrophages infected with newcastle disease virus vaccine strain LaSota. Pathogens 2019, 8, 123. [Google Scholar] [CrossRef] [Green Version]
  31. Lian, L.; Qu, L.; Chen, Y.; Lamont, S.J.; Yang, N. A systematic analysis of miRNA transcriptome in Marek’s disease virus-induced lymphoma reveals novel and differentially expressed miRNAs. PLoS ONE 2012, 7, e51003. [Google Scholar] [CrossRef] [PubMed] [Green Version]
  32. Wang, Y.; Brahmakshatriya, V.; Lupiani, B.; Reddy, S.M.; Soibam, B.; Benham, A.L.; Gunaratne, P.; Liu, H.C.; Trakooljul, N.; Ing, N.; et al. Integrated analysis of microRNA expression and mRNA transcriptome in lungs of avian influenza virus infected broilers. BMC Genom. 2012, 13, 278. [Google Scholar] [CrossRef] [PubMed] [Green Version]
  33. Wang, Y.; Brahmakshatriya, V.; Zhu, H.; Lupiani, B.; Reddy, S.M.; Yoon, B.J.; Gunaratne, P.H.; Kim, J.H.; Chen, R.; Wang, J.; et al. Identification of differentially expressed miRNAs in chicken lung and trachea with avian influenza virus infection by a deep sequencing approach. BMC Genom. 2009, 10, 512. [Google Scholar] [CrossRef] [PubMed] [Green Version]
  34. Szretter, K.J.; Balish, A.L.; Katz, J.M. Influenza: Propagation, quantification, and storage. Curr. Protoc. Microbiol. 2006, 3. [Google Scholar] [CrossRef] [PubMed]
  35. World Health Organization. Manual on Animal Influenza Diagnosis and Surveillance, 2nd ed.; WHO Press: Geneva, Switzerland, 2002; pp. 1–94. [Google Scholar]
  36. Barjesteh, N.; Taha-Abdelaziz, K.; Kulkarni, R.R.; Sharif, S. Innate antiviral responses are induced by TLR3 and TLR4 ligands in chicken tracheal epithelial cells: Communication between epithelial cells and macrophages. Virology 2019, 534, 132–142. [Google Scholar] [CrossRef]
  37. Hossain, M.J.; Mori, I.; Dong, L.; Liu, B.; Kimura, Y. Fetal calf serum inhibits virus genome expression in Madin-Darby canine kidney cells persistently infected with influenza A virus. Med. Microbiol. Immunol. 2008, 197, 21–27. [Google Scholar] [CrossRef]
  38. Barjesteh, N.; Behboudi, S.; Brisbin, J.T.; Villanueva, A.I.; Nagy, É.; Sharif, S. TLR ligands induce antiviral responses in chicken macrophages. PLoS ONE 2014, 9, e105713. [Google Scholar] [CrossRef]
  39. Bolger, A.M.; Lohse, M.; Usadel, B. Trimmomatic: A flexible trimmer for Illumina sequence data. Bioinformatics 2014, 30, 2114–2120. [Google Scholar] [CrossRef] [Green Version]
  40. Andrews, S. FastQC a quality control tool for high throughput sequence data. Babraham Bioinforma. 2010. [Google Scholar] [CrossRef]
  41. Ewels, P.; Magnusson, M.; Lundin, S.; Käller, M. MultiQC: Summarize analysis results for multiple tools and samples in a single report. Bioinformatics 2016, 32, 3047–3048. [Google Scholar] [CrossRef] [Green Version]
  42. Griffiths-Jones, S.; Saini, H.K.; Van Dongen, S.; Enright, A.J. MiRBase: Tools for microRNA genomics. Nucleic Acids Res. 2008, 36. [Google Scholar] [CrossRef] [PubMed] [Green Version]
  43. Friedländer, M.R.; MacKowiak, S.D.; Li, N.; Chen, W.; Rajewsky, N. MiRDeep2 accurately identifies known and hundreds of novel microRNA genes in seven animal clades. Nucleic Acids Res. 2012, 40, 37–52. [Google Scholar] [CrossRef] [PubMed]
  44. Di Tommaso, P.; Chatzou, M.; Floden, E.W.; Barja, P.P.; Palumbo, E.; Notredame, C. Nextflow enables reproducible computational workflows. Nat. Biotechnol. 2017, 35, 316–319. [Google Scholar] [CrossRef] [PubMed]
  45. R Core Team. R: A language and Environment for Statistical Computing; R Foundation for Statistical Computing: Vienna, Austria, 2013. [Google Scholar]
  46. Robinson, M.D.; McCarthy, D.J.; Smyth, G.K. EdgeR: A Bioconductor package for differential expression analysis of digital gene expression data. Bioinformatics 2009, 26, 139–140. [Google Scholar] [CrossRef] [PubMed] [Green Version]
  47. Wickham, H.; Averick, M.; Bryan, J.; Chang, W.; McGowan, L.; François, R.; Grolemund, G.; Hayes, A.; Henry, L.; Hester, J.; et al. Welcome to the tidyverse. J. Open Source Softw. 2019, 4, 1686. [Google Scholar] [CrossRef]
  48. Bache, S.M. Magrittr. 2014. Available online: https://cran.r-project.org/web/packages/magrittr/vignettes/magrittr.html (accessed on 9 April 2020).
  49. Gu, Z.; Eils, R.; Schlesner, M. Complex heatmaps reveal patterns and correlations in multidimensional genomic data. Bioinformatics 2016, 32, 2847–2849. [Google Scholar] [CrossRef] [Green Version]
  50. Lex, A.; Gehlenborg, N.; Strobelt, H.; Vuillemot, R.; Pfister, H. UpSet: Visualization of intersecting sets. IEEE Trans. Vis. Comput. Graph. 2014, 20, 1983–1992. [Google Scholar] [CrossRef]
  51. Agarwal, V.; Bell, G.W.; Nam, J.-W.; Bartel, D.P. Predicting effective microRNA target sites in mammalian mRNAs. eLife 2015, 4, e05005. [Google Scholar] [CrossRef]
  52. Wong, N.; Wang, X. MiRDB: An online resource for microRNA target prediction and functional annotations. Nucleic Acids Res. 2015, 43, D146–D152. [Google Scholar] [CrossRef]
  53. Blatti, C.; Emad, A.; Berry, M.J.; Gatzke, L.; Epstein, M.; Lanier, D.; Rizal, P.; Ge, J.; Liao, X.; Sobh, O.; et al. Knowledge-guided analysis of “omics” data using the KnowEnG cloud platform. PLoS Biol. 2020. [Google Scholar] [CrossRef] [Green Version]
  54. Mi, H.; Muruganujan, A.; Ebert, D.; Huang, X.; Thomas, P.D. PANTHER version 14: More genomes, a new PANTHER GO-slim and improvements in enrichment analysis tools. Nucleic Acids Res. 2019, 47, D419–D426. [Google Scholar] [CrossRef] [PubMed]
  55. Szklarczyk, D.; Gable, A.L.; Lyon, D.; Junge, A.; Wyder, S.; Huerta-Cepas, J.; Simonovic, M.; Doncheva, N.T.; Morris, J.H.; Bork, P.; et al. STRING v11: Protein-protein association networks with increased coverage, supporting functional discovery in genome-wide experimental datasets. Nucleic Acids Res. 2019, 47, D607–D613. [Google Scholar] [CrossRef] [PubMed] [Green Version]
  56. Blatti, C.; Sinha, S. Characterizing gene sets using discriminative random walks with restart on heterogeneous biological networks. Bioinformatics 2016, 32, 2167–2175. [Google Scholar] [CrossRef] [PubMed] [Green Version]
  57. Motulsky, H. Analyzing Data with GraphPad Prism; GraphPad Software, Inc: San Diego, CA, USA, 1999; ISBN 8584573909. [Google Scholar]
  58. Bao, Y.; Bolotov, P.; Dernovoy, D.; Kiryutin, B.; Zaslavsky, L.; Tatusova, T.; Ostell, J.; Lipman, D. The influenza virus resource at the National Center for Biotechnology Information. J. Virol. 2008, 82, 596–601. [Google Scholar] [CrossRef] [Green Version]
  59. Simonsen, L.; Bernabe, G.; Lacourciere, K.; Taylor, R.J.; Giovanni, M.Y. The NIAID influenza genome sequencing project. In National Institute of Allergy and Infectious Diseases, NIH; Humana Press: Totowa, NJ, USA, 2008; pp. 109–113. [Google Scholar]
  60. Hsu, P.W.C. MiRNAMap: Genomic maps of microRNA genes and their target genes in mammalian genomes. Nucleic Acids Res. 2006, 34, D135–D139. [Google Scholar] [CrossRef] [Green Version]
  61. Huang, H.Y.; Chien, C.H.; Jen, K.H.; Huang, H.D. RegRNA: An integrated web server for identifying regulatory RNA motifs and elements. Nucleic Acids Res. 2006, 34. [Google Scholar] [CrossRef] [Green Version]
  62. Krüger, J.; Rehmsmeier, M. RNAhybrid: MicroRNA target prediction easy, fast and flexible. Nucleic Acids Res. 2006, 34. [Google Scholar] [CrossRef]
  63. Lötvall, J.; Hill, A.F.; Hochberg, F.; Buzás, E.I.; Di Vizio, D.; Gardiner, C.; Gho, Y.S.; Kurochkin, I.V.; Mathivanan, S.; Quesenberry, P.; et al. Minimal experimental requirements for definition of extracellular vesicles and their functions: A position statement from the International Society for Extracellular Vesicles. J. Extracell. Vesicles 2014, 3, 328. [Google Scholar] [CrossRef]
  64. Abcam Datasheet Product Anti-LAMP1 antibody—Lysosome marker ab24170. Available online: https://www.abcam.com/lamp1-antibody-lysosome-marker-ab24170.html (accessed on 3 May 2020).
  65. O’Brien, J.; Hayder, H.; Zayed, Y.; Peng, C. Overview of microRNA biogenesis, mechanisms of actions, and circulation. Front. Endocrinol. 2018, 9, 402. [Google Scholar] [CrossRef] [Green Version]
  66. Girardi, E.; López, P.; Pfeffer, S. On the importance of host microRNAs during viral infection. Front. Genet. 2018, 9, 439. [Google Scholar] [CrossRef] [Green Version]
  67. Li, S.P.; Lin, Z.X.; Jiang, X.Y.; Yu, X.Y. Exosomal cargo-loading and synthetic exosome-mimics as potential therapeutic tools. Acta Pharmacol. Sin. 2018, 39, 542–551. [Google Scholar] [CrossRef] [PubMed] [Green Version]
  68. Hessvik, N.P.; Llorente, A. Current knowledge on exosome biogenesis and release. Cell. Mol. Life Sci. 2018, 75, 193–208. [Google Scholar] [CrossRef] [PubMed] [Green Version]
  69. Zheng, B.; Zhou, J.; Wang, H. Host microRNAs and exosomes that modulate influenza virus infection. Virus Res. 2020, 279, 197885. [Google Scholar] [CrossRef] [PubMed]
  70. Urbanelli, L.; Buratta, S.; Tancini, B.; Sagini, K.; Delo, F.; Porcellati, S.; Emiliani, C. The role of extracellular vesicles in viral infection and transmission. Vaccines 2019, 7, 102. [Google Scholar] [CrossRef] [Green Version]
  71. Zhong, L.; Simard, M.J.; Huot, J. Endothelial microRNAs regulating the NF-κB pathway and cell adhesion molecules during inflammation. FASEB J. 2018, 32, 4070–4084. [Google Scholar] [CrossRef] [Green Version]
  72. Dierkes, R.; Warnking, K.; Liedmann, S.; Seyer, R.; Ludwig, S.; Ehrhardt, C. The Rac1 inhibitor NSC23766 exerts anti-influenza virus properties by affecting the viral polymerase complex activity. PLoS ONE 2014, 9, e88520. [Google Scholar] [CrossRef] [Green Version]
  73. Burnside, J.; Ouyang, M.; Anderson, A.; Bernberg, E.; Lu, C.; Meyers, B.C.; Green, P.J.; Markis, M.; Isaacs, G.; Huang, E.; et al. Deep sequencing of chicken microRNAs. BMC Genom. 2008, 9, 185. [Google Scholar] [CrossRef] [Green Version]
  74. Wu, S.; Huang, S.; Ding, J.; Zhao, Y.; Liang, L.; Liu, T.; Zhan, R.; He, X. Multiple microRNAs modulate p21Cip1/Waf1 expression by directly targeting its 3′ untranslated region. Oncogene 2010, 29, 2302–2308. [Google Scholar] [CrossRef] [Green Version]
  75. Tsitsiou, E.; Lindsay, M.A. MicroRNAs and the immune response. Curr. Opin. Pharmacol. 2009, 9, 514–520. [Google Scholar] [CrossRef]
  76. Sun, X.; Icli, B.; Wara, A.K.; Belkin, N.; He, S.; Kobzik, L.; Hunninghake, G.M.; Vera, M.P.; Registry, M.; Blackwell, T.S.; et al. MicroRNA-181b regulates NF-κB-mediated vascular inflammation. J. Clin. Investig. 2012, 122, 1973–1990. [Google Scholar] [CrossRef]
  77. Xie, W.; Li, M.; Xu, N.; Lv, Q.; Huang, N.; He, J.; Zhang, Y. MiR-181a regulates inflammation responses in monocytes and macrophages. PLoS ONE 2013, 8, e58639. [Google Scholar] [CrossRef] [PubMed] [Green Version]
  78. Galicia, J.C.; Naqvi, A.R.; Ko, C.-C.; Nares, S.; Khan, A.A. MiRNA-181a regulates Toll-like receptor agonist-induced inflammatory response in human fibroblasts. Genes Immun. 2014, 15, 333–337. [Google Scholar] [CrossRef] [PubMed] [Green Version]
  79. Ahanda, M.-L.E.; Ruby, T.; Wittzell, H.; Bed’Hom, B.; Chaussé, A.-M.; Morin, V.; Oudin, A.; Chevalier, C.; Young, J.R.; Zoorob, R. Non-coding RNAs revealed during identification of genes involved in chicken immune responses. Immunogenetics 2009, 61, 55–70. [Google Scholar] [CrossRef] [PubMed]
  80. Muñoz-Fontela, C.; Pazos, M.; Delgado, I.; Murk, W.; Mungamuri, S.K.; Lee, S.W.; García-Sastre, A.; Moran, T.M.; Aaronson, S.A. P53 serves as a host antiviral factor that enhances innate and adaptive immune responses to influenza A virus. J. Immunol. 2011, 187, 6428–6436. [Google Scholar] [CrossRef] [PubMed] [Green Version]
  81. O’Neill, L.A.; Sheedy, F.J.; McCoy, C.E. MicroRNAs: The fine-tuners of Toll-like receptor signalling. Nat. Rev. Immunol. 2011, 11, 163–175. [Google Scholar] [CrossRef]
  82. Li, P.; Fan, W.; Li, Q.; Wang, J.; Liu, R.; Everaert, N.; Liu, J.; Zhang, Y.; Zheng, M.; Cui, H.; et al. Splenic microRNA expression profiles and integration analyses involved in host responses to Salmonella enteritidis infection in chickens. Front. Cell. Infect. Microbiol. 2017, 7. [Google Scholar] [CrossRef] [Green Version]
  83. Taganov, K.D.; Boldin, M.P.; Chang, K.J.; Baltimore, D. NF-κB-dependent induction of microRNA miR-146, an inhibitor targeted to signaling proteins of innate immune responses. Proc. Natl. Acad. Sci. USA 2006. [Google Scholar] [CrossRef] [Green Version]
Figure 1. Purification and characterization of extracellular vehicles (EVs) released from tracheal organ culture (TOC). (a) Western Blot analysis for common exosomal marker proteins including lysosome-associated membrane protein 1 (LAMP1), tumor susceptibility gene 101 (TSG1) in EV, and cell lysate samples. Equal amounts of an isolated EV protein sample, along with cell lysate controls, were fractionated on electrophoresis gels and electro-transferred to onto activated polyvinylidene difluoride (PVDF) membranes. Detection by chemiluminescence revealed the presence of lysosomal LAMP1, endosomal TSG101, and cytoskeletal β-actin proteins and the absence of endoplasmic GRP94 in EV samples. The LAMP1 protein bands identified in both samples were of slightly different sizes. This was expected, as the antibody detects a band of approximately 90–130 kDa. The variability in molecular weight is observed as a result of different levels of glycosylation of the target in different cell and tissue types [64]. (b) Transmission electron microscopic images of EVs isolated and purified from the culture supernatant of TOCs. EV morphology is observed by negative staining. EVs showed their donut-shaped morphology. Scale bar = 100 nm.
Vaccines 08 00438 g001
Figure 2. Venn diagram showing DE miRNAs in (a) TOC 3 h groups treated with AIV, LPS and polyI:C, (b) TOC 18 h groups treated with AIV, LPS and polyI:C and (c) EV groups treated with AIV, LPS and polyI:C. Lists of DE miRNAs for TOC 3 h, TOC 18 h, and EV treatment groups are shown in Tables S3–S5, respectively.
Vaccines 08 00438 g002
Figure 3. Heatmap with hierarchical clustering of miRNA distribution of the top cellular differentially expressed (DE) miRNAs (3 h) ranked by adjusted p-value (FDR). (a) The top 18 DE miRNAs (of 18 that pass the FDR threshold), AIV group. (b) The top three DE miRNAs (of three that pass the FDR threshold), LPS group. (c) The top two DE miRNAs (of two that pass the FDR threshold), polyI:C group. FDR < 0.05. The density of the colors represents the abundance of each miRNA in the scale of log2 counts per million (CPM).
Vaccines 08 00438 g003
Figure 4. Heatmap with hierarchical clustering of miRNA distribution of the top cellular DE miRNAs (18 h) ranked by adjusted p-value (FDR). (a) The top eight DE miRNAs (of eight that pass the FDR threshold) AIV group. (b) The top 20 DE miRNAs (of 65 that pass the FDR threshold), LPS group. (c) The top 20 DE miRNAs (of 47 that pass the FDR threshold) polyI:C group, FDR < 0.05. The density of the colors represents the abundance of each miRNA in the scale of log2 counts per million (CPM).
Vaccines 08 00438 g004
Figure 5. Heatmap with hierarchical clustering of miRNA distribution of the top EV DE miRNAs ranked by adjusted p-value (FDR). (a) The top 20 DE miRNAs (of 99 that pass the FDR threshold) AIV group. (b)The top 20 DE miRNAs (of 31 that pass the FDR threshold), LPS group. (c) The top 20 DE miRNAs (of 147 that pass the FDR threshold) polyI:C group. FDR < 0.05. The density of the colors represents abundance of each miRNA in the scale of log2 counts per million (CPM).
Vaccines 08 00438 g005
Figure 6. Pathway and gene ontology (GO) enrichment analysis on target genes of (a) up-regulated cellular (3 h), (b) up-regulated cellular (18 h), (c) down-regulated cellular (18 h), (d) up-regulated EV, and (e) down-regulated EV DE miRNA following treatment with AIV, LPS and PolyI:C. KnowEnG analytical platform (https://knoweng.org/analyze) was used to perform pathway and gene ontology (GO) enrichment analysis on these gene sets based on human database. The GO category analysis based on biological process for targets of DE miRNAs and the color intensities indicate the difference scores obtained from pathway analysis. Down-regulated (3 h) is not shown as there were no down-regulated DE miRNAs for both the TOC 3 h LPS and TOC 3 h polyI:C groups. The density of the colors represents the difference score. FDR < 0.05 and difference score >0.5.
Vaccines 08 00438 g006
Figure 7. MiRNA target sites within AIV viral genome. The target sites for miRNAs within the AIV viral genome were predicted using the miRanda and RNAhybrid algorithms. All of the segments were found to be targeted by at least one miRNA, except segment 8 (NS1, NEP). One miRNA, gga-miR-1784b-5p, was found to target both segments 5 (NP protein) and 7 (M1 protein). Specific target positions for each miRNA can be found in Table 10.
Vaccines 08 00438 g007
Table 1. Up-regulated miRNAs in TOC 3 h and TOC 18 h following treatment with avian influenza viruses (AIV), lipopolysaccharide (LPS), and polyI:C. Following differential expression filtering (FC ≥ 1.5 and FDR < 0.05), 11, three, and two miRNAs were found to be up-regulated in TOC 3 h AIV, LPS, and polyI:C groups, respectively. For TOC 18 h AIV, LPS, and polyI:C groups, three, 32, and two miRNAs were found to be up-regulated in each group, respectively.
Treatment GroupMiRNALog2 Fold ChangeFold Change
TOC 3 hTOC AIV 3 h
(11 miRNAs)
gga-miR-221-5p2.234.690
gga-miR-425-5p0.9911.987
gga-miR-210a-5p0.9561.940
gga-miR-455-5p0.9041.871
gga-miR-6705-5p0.8451.796
gga-miR-16080.8061.749
gga-let-7c-5p0.7861.724
gga-miR-132a-3p0.7671.701
gga-miR-14340.7511.683
gga-miR-129-5p0.7011.625
gga-let-7l-5p0.6291.547
TOC LPS 3 h
(3 miRNAs)
gga-miR-6705-5p1.0872.124
gga-miR-16081.0532.075
gga-miR-6704-5p1.0232.032
TOC polyI:C 3 h
(2 miRNAs)
gga-miR-12253-5p2.7166.568
gga-miR-12235-5p1.0552.078
TOC 18 hTOC AIV 18 h
(3 miRNAs)
gga-miR-15630.7421.673
gga-miR-1451-5p0.7221.649
gga-miR-12244-5p0.7021.627
TOC LPS 18 h
(32 miRNAs)
gga-miR-1451-5p0.971.959
gga-miR-425-5p0.9481.929
gga-miR-221-5p0.8871.849
gga-miR-191-5p0.8821.843
gga-miR-145-5p0.8581.813
gga-miR-30c-5p0.8511.804
gga-miR-146b-5p0.8511.803
gga-miR-15b-5p0.811.753
gga-miR-30b-5p0.8081.750
gga-miR-15c-5p0.8011.742
gga-miR-210a-5p0.7951.735
gga-miR-2131-5p0.7941.734
gga-miR-146a-5p0.7871.725
gga-miR-2184a-5p0.7811.719
gga-miR-15630.7771.713
gga-miR-455-5p0.7691.704
gga-miR-205a0.7671.702
gga-let-7b0.761.694
gga-miR-181b-5p0.7561.689
gga-miR-30a-5p0.7531.685
gga-miR-30d0.7531.685
gga-miR-1729-5p0.7521.685
gga-miR-16c-5p0.7251.653
gga-miR-17-5p0.7251.653
gga-let-7c-5p0.7081.634
gga-miR-10c-5p0.7081.633
gga-miR-181a-5p0.6911.614
gga-miR-18a-5p0.6851.608
gga-miR-10a-5p0.6711.592
gga-miR-16-5p0.6511.570
gga-let-7l-5p0.631.547
gga-miR-1559-5p0.6131.529
TOC polyI:C 18 h
(2 miRNAs)
gga-miR-12253-5p3.56511.831
gga-miR-12235-5p1.5032.834
Table 2. Down-regulated miRNAs in TOC 3 h and TOC 18 h following treatment with AIV, LPS and polyI:C. Following differential expression filtering (FC ≥ 1.5 and FDR < 0.05), four, zero, and zero miRNAs were found to be down-regulated in TOC 3 h AIV, LPS, and polyI:C groups, respectively. For TOC 18 h AIV, LPS, and polyI:C groups, 2, 15, and 40 miRNAs were found to be down-regulated in each group, respectively.
Treatment GroupMiRNALog2 Fold ChangeFold Change
TOC 3 hTOC AIV 3 h
(4 miRNAs)
gga-miR-383-5p−0.591−1.507
gga-miR-1738−0.783−1.721
gga-miR-1692−0.861−1.816
gga-miR-6611-5p−1.016−2.022
TOC LPS 3 h
(0 miRNAs)
NONEN/AN/A
TOC polyI:C 3 h
(0 miRNAs)
NONEN/AN/A
TOC 18 hTOC AIV 18 h
(2 miRNAs)
gga-miR-12234-5p−0.61−1.526
gga-miR-1793−0.629−1.546
TOC LPS 18 h
(15 miRNAs)
gga-miR-6602-5p−0.583−1.498
gga-miR-1809−0.617−1.533
gga-miR-6632-5p−0.618−1.535
gga-miR-6569-5p−0.654−1.574
gga-miR-12266-5p−0.666−1.587
gga-miR-1783−0.682−1.604
gga-miR-7457-5p−0.699−1.624
gga-miR-124a-5p−0.713−1.640
gga-miR-2184a-3p−0.716−1.643
gga-miR-12228-3p−0.782−1.719
gga-miR-1761−0.789−1.728
gga-miR-1795−0.853−1.807
gga-miR-12234-5p−0.915−1.886
gga-miR-1701−0.92−1.893
gga-miR-12239-3p−1.002−2.003
TOC polyI:C 18 h
(40 miRNAs)
gga-miR-1735−0.582−1.497
gga-miR-1551-5p−0.606−1.522
gga-miR-12228-5p−0.618−1.535
gga-miR-6706-5p−0.626−1.543
gga-miR-7470-5p−0.628−1.545
gga-miR-1692−0.633−1.551
gga-miR-12248-3p−0.663−1.584
gga-miR-449a−0.68−1.602
gga-miR-1561−0.712−1.638
gga-miR-1656−0.713−1.639
gga-miR-6569-5p−0.729−1.658
gga-miR-1465−0.741−1.672
gga-let-7g-5p−0.783−1.721
gga-miR-7480-5p−0.803−1.745
gga-miR-6563-5p−0.835−1.784
gga-let-7f-5p−0.875−1.834
gga-miR-196-5p−0.877−1.836
gga-miR-12246-5p−0.888−1.851
gga-miR-1751-5p−0.913−1.883
gga-miR-1671−0.964−1.951
gga-miR-1593−0.98−1.973
gga-miR-365-2-5p−1.012−2.017
gga-miR-12208-5p−1.021−2.029
gga-miR-499-5p−1.082−2.118
gga-miR-1750−1.085−2.122
gga-miR-130c-5p−1.093−2.133
gga-miR-7458-5p−1.093−2.133
gga-miR-1720-5p−1.1−2.144
gga-miR-12228-3p−1.138−2.201
gga-miR-1c−1.146−2.213
gga-miR-7−1.24−2.362
gga-miR-2184a-3p−1.248−2.375
gga-miR-6564-5p−1.286−2.439
gga-miR-6611-5p−1.294−2.452
gga-miR-190a-5p−1.367−2.580
gga-miR-1676-5p−1.569−2.967
gga-miR-12248-5p−1.944−3.847
gga-miR-6641-5p−3.127−8.733
gga-miR-1784b-3p−3.128−8.742
gga-miR-216c−3.426−10.751
Table 3. Up-regulated miRNAs in EVs following treatment with AIV, LPS, and polyI:C. Following differential expression filtering (FC ≥ 1.5 and FDR < 0.05), 21, five, and 14 miRNAs were found to be up-regulated in EV AIV, LPS, and polyI:C groups, respectively.
Treatment GroupMiRNALog2 Fold ChangeFold Change
EV AIV
(21 miRNAs)
gga-miR-301a-5p1.5252.877
gga-miR-15631.2212.332
gga-miR-122-5p0.9481.930
gga-miR-15b-5p0.931.905
gga-miR-14520.9031.870
gga-miR-1940.8941.858
gga-miR-15750.8121.756
gga-miR-6606-5p0.8071.749
gga-miR-193a-5p0.8021.744
gga-miR-12221-5p0.7661.701
gga-miR-6543-5p0.7271.655
gga-miR-12252-3p0.7231.650
gga-miR-12253-5p0.6781.600
gga-miR-92-5p0.6721.594
gga-miR-16700.6721.593
gga-miR-12229-5p0.671.591
gga-miR-365-1-5p0.6691.590
gga-miR-6708-5p0.641.558
gga-miR-6616-5p0.621.537
gga-miR-16370.6181.534
gga-miR-383-5p0.6051.521
EV LPS
(5 miRNAs)
gga-miR-6697-5p0.8291.777
gga-miR-35350.6971.621
gga-miR-383-5p0.6491.568
gga-miR-1618-5p0.6021.518
gga-miR-12272-3p0.6011.517
EV polyI:C
(14 miRNAs)
gga-miR-12253-5p2.8227.070
gga-miR-12235-5p1.7133.279
gga-miR-6593-5p1.2232.335
gga-miR-12290-5p0.9531.936
gga-miR-12252-3p0.8651.821
gga-miR-1397-5p0.8561.810
gga-miR-17770.741.671
gga-miR-1456-5p0.7341.663
gga-miR-6606-5p0.7141.640
gga-miR-7471-5p0.6771.599
gga-miR-16080.6511.570
gga-miR-16700.6071.524
gga-miR-12295-5p0.6071.523
gga-miR-1649-5p0.5981.514
Table 4. Down-regulated miRNAs in EVs following treatment with AIV, LPS, and polyI:C. Following differential expression filtering (FC ≥ 1.5 and FDR < 0.05), 57, 17, and 90 miRNAs were found to be down-regulated in EV AIV, LPS, and polyI:C groups, respectively.
Treatment GroupMiRNALog2 Fold ChangeFold Change
EV AIV
(57 miRNAs)
gga-miR-3532-5p−0.612−1.528
gga-miR-1722-5p−0.619−1.536
gga-miR-1677-5p−0.631−1.549
gga-miR-1661−0.634−1.552
gga-miR-1306-5p−0.636−1.554
gga-miR-2184b-5p−0.65−1.569
gga-miR-107-5p−0.661−1.581
gga-miR-6516-5p−0.667−1.588
gga-miR-1724−0.679−1.601
gga-miR-449b-5p−0.687−1.610
gga-miR-1651-5p−0.691−1.614
gga-miR-301b-5p−0.696−1.620
gga-miR-128-1-5p−0.7−1.624
gga-miR-6671-5p−0.716−1.643
gga-miR-1715-5p−0.719−1.646
gga-miR-365b-5p−0.72−1.648
gga-miR-6675-5p−0.729−1.658
gga-miR-6590-5p−0.73−1.659
gga-miR-1648-5p−0.737−1.666
gga-miR-726-3p−0.746−1.677
gga-miR-1553-5p−0.754−1.687
gga-miR-1626-5p−0.768−1.703
gga-miR-1727−0.773−1.709
gga-miR-6550-5p−0.774−1.710
gga-miR-1664-5p−0.784−1.722
gga-miR-12254-5p−0.813−1.757
gga-miR-12269-3p−0.823−1.769
gga-miR-1784-5p−0.852−1.805
gga-miR-6639-5p−0.865−1.821
gga-miR-218-5p−0.877−1.836
gga-miR-12247-3p−0.912−1.882
gga-miR-6665-5p−0.913−1.883
gga-miR-6604-5p−0.914−1.885
gga-miR-1632-5p−1.015−2.022
gga-miR-1710−1.016−2.022
gga-miR-1730-5p−1.018−2.025
gga-miR-3536−1.047−2.066
gga-miR-12244-5p−1.078−2.112
gga-miR-1784b-5p−1.089−2.128
gga-miR-1815−1.096−2.137
gga-miR-1464−1.096−2.137
gga-miR-1801−1.1−2.143
gga-miR-216a−1.101−2.145
gga-miR-6684-5p−1.112−2.161
gga-miR-1605−1.114−2.165
gga-miR-6596-5p−1.122−2.177
gga-miR-12284-3p−1.138−2.201
gga-miR-142-5p−1.141−2.205
gga-miR-7482-5p−1.142−2.206
gga-miR-7454-3p−1.153−2.224
gga-miR-7464-3p−1.256−2.388
gga-miR-7456-5p−1.262−2.398
gga-miR-3528−1.295−2.454
gga-miR-122b-3p−1.437−2.708
gga-miR-210a-5p−1.716−3.285
gga-miR-12260-5p−1.791−3.460
gga-miR-205b−1.865−3.643
EV LPS
(17 miRNAs)
gga-miR-1464−0.597−1.512
gga-miR-132b-5p−0.638−1.556
gga-miR-1584−0.674−1.595
gga-miR-211−0.689−1.612
gga-miR-6665-5p−0.716−1.643
gga-miR-1727−0.743−1.674
gga-miR-12223-3p−0.762−1.696
gga-miR-1597-5p−0.783−1.721
gga-miR-7482-5p−0.79−1.729
gga-miR-107-5p−0.797−1.737
gga-miR-449b-5p−0.835−1.783
gga-miR-6557-5p−0.869−1.826
gga-miR-12273-5p−0.895−1.859
gga-miR-210a-5p−1.276−2.421
gga-miR-12284-3p−1.28−2.428
gga-miR-205b−1.383−2.608
gga-miR-1784b-5p−2.111−4.318
EV polyI:C
(90 miRNAs)
gga-miR-1465−0.584−1.499
gga-miR-6582-5p−0.589−1.504
gga-miR-1553-5p−0.597−1.512
gga-miR-1795−0.6−1.516
gga-miR-490-5p−0.603−1.519
gga-miR-6707-5p−0.604−1.520
gga-miR-1755−0.627−1.545
gga-miR-210b-5p−0.629−1.546
gga-miR-302b-5p−0.63−1.547
gga-miR-211−0.632−1.550
gga-miR-12274-5p−0.644−1.562
gga-miR-1730-5p−0.644−1.562
gga-miR-1626-5p−0.65−1.569
gga-miR-23b-5p−0.653−1.572
gga-miR-1667-5p−0.657−1.577
gga-miR-1727−0.671−1.592
gga-miR-132b-5p−0.677−1.598
gga-miR-1802−0.677−1.598
gga-miR-12274-3p−0.678−1.600
gga-miR-1805-5p−0.719−1.646
gga-miR-449a−0.726−1.654
gga-miR-1597-5p−0.729−1.658
gga-miR-204−0.734−1.663
gga-miR-726-5p−0.74−1.671
gga-miR-7444-5p−0.741−1.672
gga-miR-6679-5p−0.762−1.696
gga-miR-449b-5p−0.763−1.697
gga-miR-6596-5p−0.78−1.717
gga-miR-6567-5p−0.78−1.718
gga-miR-7451-5p−0.783−1.720
gga-miR-12266-5p−0.783−1.721
gga-miR-212-5p−0.789−1.727
gga-miR-1462-5p−0.789−1.728
gga-miR-1814−0.805−1.747
gga-miR-6550-5p−0.81−1.753
gga-miR-6516-5p−0.821−1.767
gga-miR-1690-5p−0.83−1.777
gga-miR-1663-5p−0.837−1.787
gga-miR-365b-5p−0.84−1.789
gga-miR-1598−0.842−1.792
gga-miR-301b-5p−0.851−1.804
gga-miR-6598-5p−0.882−1.843
gga-miR-12247-3p−0.883−1.844
gga-miR-1306-5p−0.888−1.851
gga-miR-6665-5p−0.892−1.855
gga-miR-6604-5p−0.899−1.865
gga-miR-6559-5p−0.91−1.879
gga-miR-218-5p−0.911−1.880
gga-miR-1715-5p−0.919−1.890
gga-miR-6669-5p−0.919−1.891
gga-miR-6671-5p−0.923−1.896
gga-miR-12223-3p−0.931−1.907
gga-miR-6566-5p−0.932−1.907
gga-miR-3536−0.964−1.951
gga-miR-216b−0.966−1.954
gga-miR-1632-5p−1−2.000
gga-miR-3532-5p−1.006−2.008
gga-miR-2184b-5p−1.009−2.012
gga-miR-1658-5p−1.027−2.037
gga-miR-216a−1.056−2.080
gga-miR-7482-5p−1.066−2.093
gga-miR-1638−1.072−2.102
gga-miR-449d-5p−1.076−2.108
gga-miR-6639-5p−1.079−2.112
gga-miR-12269-3p−1.081−2.116
gga-miR-1722-5p−1.095−2.136
gga-miR-7456-5p−1.132−2.191
gga-miR-6675-5p−1.14−2.204
gga-miR-1605−1.155−2.227
gga-miR-12209-3p−1.169−2.248
gga-miR-12279-3p−1.176−2.260
gga-miR-12260-5p−1.199−2.295
gga-miR-7479-5p−1.207−2.309
gga-miR-1464−1.214−2.320
gga-miR-12219-3p−1.23−2.346
gga-miR-12284-3p−1.234−2.352
gga-miR-1775-5p−1.259−2.393
gga-miR-1573−1.273−2.417
gga-miR-219a−1.281−2.429
gga-miR-7473-5p−1.308−2.477
gga-miR-12254-5p−1.406−2.651
gga-miR-142-5p−1.413−2.663
gga-miR-1677-5p−1.418−2.673
gga-miR-30b-5p−1.448−2.728
gga-miR-210a-5p−1.47−2.770
gga-miR-19a-5p−1.504−2.837
gga-miR-7454-3p−1.571−2.970
gga-miR-1784b-5p−1.654−3.148
gga-miR-107-5p−1.689−3.224
gga-miR-205b−2.287−4.879
Table 5. Pathway analysis summary. Host target genes for DE miRNAs were predicted using the miRDB human and mouse databases. Pathway analysis was then performed using the gene set characterization pipeline by KnowEnG. Only hits with scores greater than or equal to 95 (miRDB score ≥ 95) were considered.
Treatment Group Total DEUp-RegulatedDown-Regulated
miRNAsTarget GenesTarget PathwaysmiRNAsTarget GenesTarget PathwaysmiRNAsTarget GenesTarget Pathways
TOC 3 h AIV151053119414112
TOC 3 h LPS334433440N/AN/A
TOC 3 h polyI:C2151142151140N/AN/A
TOC 18 h AIV5251731722815
TOC 18 h LPS47578143244710151124
TOC 18 h polyI:C4238417214613402335
EV AIV7848716211199573469
EV LPS22147115163171318
EV polyI:C104817231416717906289
Table 6. Prediction of pathways targeted by up-regulated cellular DE miRNAs following treatment with AIV, LPS, and polyI:C. Pathways predicted for up-regulated cellular DE miRNAs collected 3 h and 18 h post-stimulation following treatment with AIV, LPS, and polyI:C using the miRDB human and mouse database.
Treatment GroupPathwaymiRNA(s)
TOC 3 hTOC 3 h AIVmRNA processinggga-let-7c-5p, gga-let-7l-5p, gga-miR-129-5p
TOC 3 h LPSBDNF signaling pathwaygga-miR-6704-5p
Focal Adhesion-PI3K-Akt-mTOR-signaling pathwaygga-miR-6704-5p
Splicing factor NOVA regulated synaptic proteinsgga-miR-1608
Synaptic vesicle pathwaygga-miR-6704-5p
TOC 3 h polyI:CImatinib resistance in
chronic myeloid leukemia
gga-miR-12235-5p
PluriNetWorkgga-miR-12235-5p
Calcium regulation in the cardiac cellgga-miR-12235-5p
SIDS susceptibility pathwaysgga-miR-12235-5p
Gastric cancer network 1gga-miR-12235-5p
Stabilization and expansion
of the E-cadherin adherens junction
gga-miR-12235-5p
Fanconi anemia pathwaygga-miR-12235-5p
Calcium regulation in the cardiac cellgga-miR-12235-5p
Focal adhesion-PI3K-Akt-mTOR-signaling pathwaygga-miR-12235-5p
Glial cell differentiationgga-miR-12235-5p
Validated nuclear estrogen
receptor alpha network
gga-miR-12235-5p
Visual signal transduction: conesgga-miR-12235-5p
Integrin-mediated cell adhesiongga-miR-12235-5p
Synaptic vesicle pathwaygga-miR-12235-5p
TOC 18 hTOC 18 h AIVRegulation of Toll-like
receptor signaling pathway
gga-miR-12244-5p
Notch signaling pathwaygga-miR-12244-5p
TOC 18 h LPSAdipogenesisgga-miR-15b-5p, gga-miR-15c-5p,
gga-miR-16-5p,
gga-miR-16c-5p, gga-miR-2184a-5p
EGF/EGFR signaling pathwaygga-miR-145-5p
Gastric cancer network 1gga-miR-181a-5p, gga-miR-181b-5p
Insulin signalinggga-miR-15b-5p, gga-miR-15c-5p, gga-miR-1563, gga-miR-16-5p, gga-miR-16c-5p
Regulation of nuclear beta catenin signaling and target gene transcriptiongga-miR-145-5p
Regulation of RAC1 activitygga-miR-205a
Senescence and autophagy in cancergga-miR-17-5p
TarBasePathwaygga-miR-30a-5p, gga-miR-30b-5p,
gga-miR-30c-5p, gga-miR-30d, gga-miR-455-5p
TGF-beta signaling pathwaygga-miR-15b-5p, gga-miR-15c-5p,
gga-miR-16-5p, gga-miR-16c-5p
XPodNet - protein-protein interactions in the podocyte expanded by STRINGgga-miR-145-5p, gga-miR-1563, gga-miR-17-5p,
gga-miR-205a, gga-miR-30a-5p,
gga-miR-30b-5p, gga-miR-30c-5p, gga-miR-30d
TOC 18 h polyI:CImatinib resistance in chronic myeloid leukemiagga-miR-12235-5p
PluriNetWorkgga-miR-12235-5p
Calcium regulation in the cardiac cellgga-miR-12235-5p
SIDS susceptibility pathwaysgga-miR-12235-5p
Gastric cancer network 1gga-miR-12235-5p
Stabilization and expansion of the
E-cadherin adherens junction
gga-miR-12235-5p
Fanconi anemia pathwaygga-miR-12235-5p
Calcium regulation in the cardiac cellgga-miR-12235-5p
Focal adhesion-PI3K-Akt-mTOR-signaling pathwaygga-miR-12235-5p
Glial cell differentiationgga-miR-12235-5p
Validated nuclear estrogen
receptor alpha network
gga-miR-12235-5p
Visual signal transduction: conesgga-miR-12235-5p
Synaptic vesicle pathwaygga-miR-12235-5p
Table 7. Prediction of pathways targeted by down-regulated cellular DE miRNAs following treatment with AIV, LPS and polyI:C. Pathways predicted for down-regulated cellular DE miRNAs collected 3 h and 18 h post-stimulation following treatment with AIV, LPS, and polyI:C using the miRDB human and mouse database.
Treatment GroupPathwaymiRNA(s)
TOC 3 hTOC 3 h AIVEctoderm differentiationgga-miR-6611-5p
Validated targets of C-MYC transcriptional activationgga-miR-383-5p
TOC 3 h LPSN/AN/A
TOC 3 h polyI:CN/AN/A
TOC 18 hTOC 18 h AIVInsulin Signalinggga-miR-1793
EGF/EGFR signaling pathwaygga-miR-1793
ErbB1 downstream signalinggga-miR-1793
EGFR1 signaling pathwaygga-miR-1793
TNF-alpha NF-kB signaling pathwaygga-miR-1793
p38 MAPK signaling pathwaygga-miR-1793
MAPK signaling pathwaygga-miR-1793
Trk receptor signaling mediated
by the MAPK pathway
gga-miR-1793
Signaling mediated by p38-alpha and p38-betagga-miR-1793
Serotonin receptor 4/6/7 and NR3C signalinggga-miR-1793
Structural pathway of interleukin 1 (IL-1)gga-miR-1793
LPA4-mediated signaling eventsgga-miR-1793
Interferon type I signaling pathwaysgga-miR-1793
Bladder cancergga-miR-1793
BDNF signaling pathwaygga-miR-1793
TOC 18 h LPSCircadian rhythm related genesgga-miR-12239-3p,
gga-miR-124a-5p
p53 signalinggga-miR-124a-5p, gga-miR-1783
PluriNetWorkgga-miR-124a-5p
TNF-alpha NF-kB signaling pathwaygga-miR-7457-5p
TOC 18 h polyI:CEctoderm differentiationgga-miR-1c, gga-miR-6611-5p,
gga-miR-6706-5p
Integrated breast cancer pathwaygga-miR-1c, gga-miR-130c-5p
mRNA processinggga-miR-12248-5p,
gga-miR-1465,
gga-miR-7, gga-let-7f-5p,
gga-let-7g-5p
PluriNetWorkgga-miR-1551-5p,
gga-miR-449a
TNF-alpha NF-kB signaling pathwaygga-miR-6641-5p,
gga-miR-7480-5p
Table 8. Prediction of pathways targeted by up-regulated EV DE miRNAs following treatment with AIV, LPS and polyI:C. Pathways predicted for up-regulated EV DE miRNAs collected 3 h and 18 h post-stimulation following treatment with AIV, LPS, and polyI:C using the miRDB human and mouse database.
Treatment GroupPathwaymiRNA(s)
EV AIVFOXA1 transcription factor networkgga-miR-15b-5p
GPCRs, Class A Rhodopsin-likegga-miR-6616-5p
Insulin signalinggga-miR-1563, gga-miR-15b-5p
mir-124 predicted interactions with cell cycle and differentiationgga-miR-92-5p
mRNA processinggga-miR-15b-5p, gga-miR-1452,
gga-miR-6543-5p
p73 transcription factor networkgga-miR-194
TGF-beta signaling pathwaygga-miR-15b-5p
Validated targets of C-MYC transcriptional activationgga-miR-383-5p
Validated targets of C-MYC transcriptional repressiongga-miR-6708-5p
EV LPSMatrix Metalloproteinasesgga-miR-12272-3p
mRNA Processinggga-miR-12272-3p
Validated targets of C-MYC transcriptional activationgga-miR-383-5p
EV polyI:CCalcium regulation in the cardiac cellgga-miR-12235-5p
Fanconi anemia pathwaygga-miR-12235-5p
Focal adhesion-PI3K-Akt-mTOR-signaling pathwaygga-miR-12235-5p
Gastric cancer network 1gga-miR-12235-5p
Glial cell differentiationgga-miR-12235-5p
Imatinib resistance in chronic myeloid leukemiagga-miR-12235-5p
PluriNetWorkgga-miR-12235-5p
SIDS Susceptibility pathwaysgga-miR-12235-5p
Splicing factor NOVA regulated synaptic proteinsgga-miR-1608
Stabilization and expansion of the E-cadherin adherens junctiongga-miR-12235-5p
Synaptic vesicle pathwaygga-miR-12235-5p
Validated nuclear estrogen receptor alpha networkgga-miR-12235-5p
Visual signal transduction: conesgga-miR-12235-5p
XPodNet - protein-protein interactions
in the podocyte expanded by STRING
gga-miR-1456-5p
Table 9. Prediction of pathways targeted by down-regulated EV DE miRNAs following treatment with AIV, LPS, and polyI:C. Pathways predicted for down-regulated EV DE miRNAs collected 3 h and 18 h post-stimulation following treatment with AIV, LPS, and polyI:C while using the miRDB human and mouse database.
Treatment GroupPathwaymiRNA(s)
EV AIVCaspase cascade in apoptosisgga-miR-1784b-5p, gga-miR-3536
Direct p53 effectorsgga-miR-12247-3p, gga-miR-12284-3p,
gga-miR-205b, gga-miR-142-5p
Imatinib resistance in chronic myeloid leukemia gga-miR-1724, gga-miR-6639-5p
Regulation of RAC1 activitygga-miR-205b, gga-miR-449b-5p
Splicing factor NOVA regulated synaptic proteinsgga-miR-7456-5p
Synaptic vesicle pathwaygga-miR-1632-5p, gga-miR-3532-5p,
gga-miR-6639-5p
TGF-beta signaling pathwaygga-miR-1632-5p, gga-miR-142-5p,
gga-miR-1727
Validated targets of C-MYC transcriptional repressiongga-miR-12247-3p, gga-miR-1626-5p
XPodNet - protein-protein interactions
in the podocyte expanded by STRING
gga-miR-301b-5p, gga-miR-1632-5p,
gga-miR-6639-5p, gga-miR-205b,
gga-miR-218-5p, gga-miR-107-5p
EV LPSCaspase Cascade in apoptosisgga-miR-1784b-5p
Direct p53 effectorsgga-miR-12284-3p, gga-miR-205b
Globo sphingolipid metabolismgga-miR-1597-5p, gga-miR-211
PluriNetWorkgga-miR-449b-5p
PodNet: protein-protein interactions in the podocytegga-miR-107-5p, gga-miR-205b
Regulation of RAC1 activitygga-miR-205b, gga-miR-449b-5p
Stabilization and expansion of the E-cadherin adherens junctiongga-miR-211
XPodNet - protein-protein interactions in the podocyte expanded by STRINGgga-miR-107-5p, gga-miR-205b,
gga-miR-211
EV polyI:CBMP receptor signalinggga-miR-1677-5p, gga-miR-490-5p,
gga-miR-7454-3p
Circadian rhythm related genesgga-miR-1632-5p, gga-miR-1755,
gga-miR-218-5p,
gga-miR-365b-5p, gga-miR-7482-5p
Direct p53 effectorsgga-miR-12247-3p, gga-miR-12284-3p,
gga-miR-142-5p, gga-miR-205b,
gga-miR-219a
mRNA processinggga-miR-1465, gga-miR-1638,
gga-miR-1663-5p,
gga-miR-205b, gga-miR-6598-5p,
gga-miR-726-5p
PodNet: protein-protein interactions in the podocytegga-miR-107-5p, gga-miR-1632-5p,
gga-miR-1658-5p, gga-miR-205b,
gga-miR-219a, gga-miR-301b-5p
Regulation of RAC1 activitygga-miR-205b, gga-miR-449a,
gga-miR-449b-5p,
gga-miR-449d-5p, gga-miR-7451-5p
Splicing factor NOVA regulated synaptic proteinsgga-miR-30b-5p, gga-miR-302b-5p,
gga-miR-7456-5p
Synaptic vesicle pathwaygga-miR-132b-5p, gga-miR-1632-5p, gga-miR-3532-5p, gga-miR-6639-5p,
gga-miR-6669-5p
XPodNet – protein-protein interactions
in the podocyte expanded by STRING
Gga-miR-107-5p, gga-miR-1632-5p,
gga-miR-1658-5p, gga-miR-204,
gga-miR-205b, gga-miR-211,
gga-miR-218-5p, gga-miR-219a,
gga-miR-30b-5p, gga-miR-301b-5p,
gga-miR-6598-5p, gga-miR-6639-5p, gga-miR-6669-5p
Table 10. MiRNAs targeting the viral genome. Viral target sites for DE miRNAs were predicted using the miRanda and RNAhybrid algorithms. MiRNAs targeting specific segments are indicated, along with targets positions, miRanda scores, free energy and expression (up- or down-regulation) within the treatment groups.
Segment Protein(s)miRNAPositionmiRanda scoremiRanda
Free Energy (kcal/mol)
Expression
Segment 1PB2gga-miR-122b-3p1207–1227170−17.54Downregulated in EV AIV
gga-miR-146a-5p1896–1917161−17.51Upregulated in TOC LPS 18 h
gga-miR-146b-5p1896–1917161−17.87Upregulated in TOC LPS 18 h
gga-miR-1720-5p1249–1268177−32.16Downregulated in TOC polyI:C 18 h
gga-miR-6671-5p578–601161−22.53Downregulated in EV AIV & EV polyI:C
Segment 2PB1, PB1-F2gga-miR-107-5p774–796163−20.95Downregulated in EV AIV, EV LPS & EV polyI:C
gga-miR-12223-3p1328–1349160−27.23Downregulated in EV LPS & EV polyI:C
gga-miR-129-5p2264–2284179−24.92Upregulated in TOC AIV 3h
gga-miR-132b-5p91–111160−20.56Downregulated in EV LPS & EV polyI:C
gga-miR-16611822–1844163−26.29Downregulated in EV AIV
gga-miR-6641-5p1729–1750176−16.88Downregulated in TOC polyI:C 18 h
Segment 3PAgga-miR-15731027–1047166−19.85Downregulated in EV polyI:C
gga-miR-1663-5p266–285162−26.14Downregulated in EV polyI:C
gga-miR-1715-5p1439–1463161−24.17Downregulated in EV AIV & EV polyI:C
gga-miR-6665-5p2005–2025162−20.58Downregulated in EV AIV, EV LPS & EV polyI:C
gga-miR-7454-3p944–968160−19.88Downregulated in EV AIV & EV polyI:C
Segment 4HAgga-miR-1593500–520161−21.16Downregulated in TOC polyI:C 18 h
gga-miR-160555–76168−20.89Downregulated in EV AIV & EV polyI:C
gga-miR-1671761–783161−24.1Downregulated in TOC polyI:C 18 h
Segment 5NPgga-miR-12269-3p67–88160−22.67Downregulated in EV AIV & EV polyI:C
gga-miR-145-5p291–313167−22.82Upregulated in TOC LPS 18 h
gga-miR-1784b-5p1163–1186163−21.01Downregulated in EV AIV, EV LPS & EV polyI:C
gga-miR-6679-5p786–809178−20.29Downregulated in EV polyI:C
Segment 6NAgga-miR-1783455–477163−20.22Downregulated in TOC LPS 18 h
gga-miR-218-5p535–553160−23.78Downregulated in EV AIV & EV polyI:C
Segment 7M1, M2gga-miR-1710569–590164−19.87Downregulated in EV AIV
gga-miR-1784b-5p565–588161−18.81Downregulated in EV AIV, EV LPS & EV polyI:C
Segment 8NS1, NEPNONEN/AN/AN/AN/A

