Article

Identifying Cattle Breed-Specific Partner Choice of Transcription Factors during the African Trypanosomiasis Disease Progression Using Bioinformatics Analysis

1
Breeding Informatics Group, Department of Animal Sciences, Georg-August University, Margarethe von Wrangell-Weg 7, 37075 Göttingen, Germany
2
Center for Integrated Breeding Research (CiBreed), Albrecht-Thaer-Weg 3, Georg-August University, 37075 Göttingen, Germany
*
Author to whom correspondence should be addressed.
Vaccines 2020, 8(2), 246; https://doi.org/10.3390/vaccines8020246
Submission received: 14 April 2020 / Revised: 13 May 2020 / Accepted: 21 May 2020 / Published: 23 May 2020

Abstract

:
African Animal Trypanosomiasis (AAT) is a disease caused by pathogenic trypanosomes which affects millions of livestock every year causing huge economic losses in agricultural production especially in sub-Saharan Africa. The disease is spread by the tsetse fly which carries the parasite in its saliva. During the disease progression, the cattle are prominently subjected to anaemia, weight loss, intermittent fever, chills, neuronal degeneration, congestive heart failure, and finally death. According to their different genetic programs governing the level of tolerance to AAT, cattle breeds are classified as either resistant or susceptible. In this study, we focus on the cattle breeds N’Dama and Boran which are known to be resistant and susceptible to trypanosomiasis, respectively. Despite the rich literature on both breeds, the gene regulatory mechanisms of the underlying biological processes for their resistance and susceptibility have not been extensively studied. To address the limited knowledge about the tissue-specific transcription factor (TF) cooperations associated with trypanosomiasis, we investigated gene expression data from these cattle breeds computationally. Consequently, we identified significant cooperative TF pairs (especially D B P P P A R A and D B P T H A P 1 in N’Dama and D B P P A X 8 in Boran liver tissue) which could help understand the underlying AAT tolerance/susceptibility mechanism in both cattle breeds.

Graphical Abstract

1. Introduction

Climate change is likely to increase the risk of several vector-borne diseases including human and animal Trypanosomiasis [1]. African Animal Trypanosomiasis (AAT), also known as nagana disease, is a chronic parasitic infection which affects livestock in large numbers, prevalently found in the cattle of sub-Saharan Africa [2,3]. Trypanosomes are unicellular protozoans, which are transmitted through the saliva of the vector tsetse fly. They survive in the bloodstream of the animal by escaping and manipulating the host’s immune response, thereby causing serious health problems in cattle [4]. Due to this debilitating infection, the animal becomes diseased which results in lower economic productivity such as reduced meat and milk production and reduced draught power for agricultural production, thus imposing huge financial losses to farmers in sub-Saharan Africa [5]. Especially the main causative species Trypanosoma congolense and Trypanosoma vivax severely impair the health of the cattle population [6,7].
The animals display numerous clinical signs in the early and later stages of the disease with anaemia being the most prominent pathological feature of AAT [8]. Other clinical signs include fever, intermittent chills, weight loss, lethargy, emaciation, neurological disorders, infertility, abortion, difficulty in breathing, loss of appetite, and congestive heart failure leading to death if left untreated [2,3,5,9].
Some cattle breeds are capable of resisting the disease [after trypanosome infection] despite the parasite’s infection in the body. Those cattle breeds are known to be resistant to trypanosomiasis and this trait is termed as trypanotolerance. Trypanotolerance is a distinctive trait of few West African taurine breeds, which has been gained through natural selection by continuous interaction of host and parasite [10,11]. One such trypanotolerant Bos taurus cattle breed is N’Dama [12]. Even though N’Dama cattle are trypanotolerant, they are not particularly advantageous for agricultural purposes because of their low productivity and their small size. Whereas the other cattle breed Boran is beneficial for their productivity, heat tolerance and performance, it is highly susceptible to trypanosomiasis [13]. Therefore, understanding the gene regulatory mechanisms underlying the biological processes for their susceptibility/resistance is useful for the selective breeding of this trait.
Trypanosomes are able to escape the host’s natural and adaptive immunity due to their antigenic variation [14,15,16,17]. This speculative adaptation of the parasite is of great interest in recent times because of the existing and increasing risk of drug resistance to the currently available trypanocides [18,19]. Henceforth, there is an urgent need for the understanding of the molecular mechanism underlying this infectious tropical disease.
For this purpose, Noyes et al. [20] performed gene expression analysis of a transcription profiling time series microarray dataset for liver, spleen and lymph node tissues in the cattle breeds Boran and N’Dama. These tissues are vital lymphoid organs which mount host immune responses to pathogenic invasion by generating high numbers of macrophages involved in phagocytosis and further production of pro-inflammatory cytokines [21,22,23]. By analysing this dataset, Noyes et al. identified the differentially expressed genes (DEGs) based on which the candidate genes within previously reported QTLs in the regulation of immune responses were obtained. However, according to its clinical signs, AAT could be considered as a multistage progression process. While mainly focusing on the DEGs, Noyes et al. studied the differences in expression levels at certain timepoints, but their analysis strategy could not capture the importance of the genes with regular monotonic expression patterns as the disease advances. Recently, Wang et al. [24] and Suyan Tian [25] have pointed out that the genes with monotonic expression patterns are quintessential for gaining complete insight into the multistage progression of the disease.
Despite the rich literature on trypanotolerance and molecular studies addressing the identification of candidate markers in AAT, its underlying molecular mechanism in cattle has not been well studied. As of now, there has been no study performed in AAT especially in cattle, with the aspect of examining the role of the regulatory elements involved in gene regulation, for example, TFs and their cooperations. Today it is well known that TFs and their complex interplay have critical roles in the progression of disease [26,27]. In order to address the importance of cooperative TFs in the AAT disease, we analysed in this study the dataset published by Noyes et al. [20]. Unlike this study, we focus on the identification as well as the analysis of monotonically expressed genes (MEGs) to completely capture the multistage progression process of the AAT disease. Further, we applied our previously published computational PC-TraFF approach [26] to the promoter regions of the MEGs in order to identify specific cooperative TFs in different tissues of Boran and N’Dama cattle breeds. Our results suggest that the preferential partner choice of TFs could be related to the gene regulatory mechanisms determining the level of AAT-tolerance of the cattle breeds. Particularly with regard to AAT-disease, the partner choice of the transcription factor DBP is likely to orchestrate the genetic programs governing the molecular mechanism of the level of trypanotolerance of both cattle breeds. Especially, focusing on DBP’s function in association with the circadian rhythm, we attempted to highlight the significant role of the circadian transcriptional program in regulation of immune responses to the pathogen infection at the tissue level (see the review [28] for details regarding the circadian regulation of immunity).

1.1. Conserved Functions of Transcription Factors across Mammals

Transcription factors (TFs) are proteins which bind to short DNA sequences known as Transcription Factor Binding Sites (TFBSs), involved in regulating the transcription of genes [26,29,30]. These two interacting regulatory elements (TFs and TFBSs) are two of the significant functional elements which are involved in the regulation of various cellular processes [29,30]. According to the widely accepted phylogenetics footprinting approach, the basic assumption is that the functional elements are likely to be more conserved than the non-functional elements in response to selective pressure [31,32]. Therefore, the functions of transcription factors and the binding sites are expected to be well conserved across multi-species, particularly across evolutionarily closely related mammalian species. Several studies also confirm the evolutionary conservation of binding specificities of TFs in a wide range of species [33,34,35,36]. In our study, the predictions are performed for the tissues of two different cattle breeds. Regarding the conserved functions of TFs across mammals, we interpreted the results for cattle breeds based on experimental studies which have been designed and performed for other mammalian species (such as model organisms including human and mouse).

1.2. Transcription Factors, Potential Targets for Vaccine Development

Transcription factors play an important role in mounting immune responses especially during pathogenic invasion [37,38]. Both innate and adaptive immunity of the immune system are controlled at the transcriptional level, which thereby provides valuable drug targets for regulating the gene expression of several immune cells [39]. Almost 10% of anti-cancer drugs approved by Food and Drug Administration (FDA) targets the transcription process [40]. Recently, transcription therapy has been proposed as a state-of-the-art approach targeting transcription factors for therapeutic interventions [41]. Therefore, transcription factors, being converging point for many signalling pathways, can serve as promising drug candidates for vaccine development [42]. In our study, we focused on transcription factors and their complex interplay which orchestrate the genetic programs underlying the level of trypanotolerance of both cattle breeds. Our findings could provide novel drug targets for the development of effective vaccine-mediated control of the AAT disease.

2. Materials and Methods

In this section we describe the microarray gene expression dataset that we analyzed and the methods applied in this study. Our analysis follows the structure as represented in Figure 1.

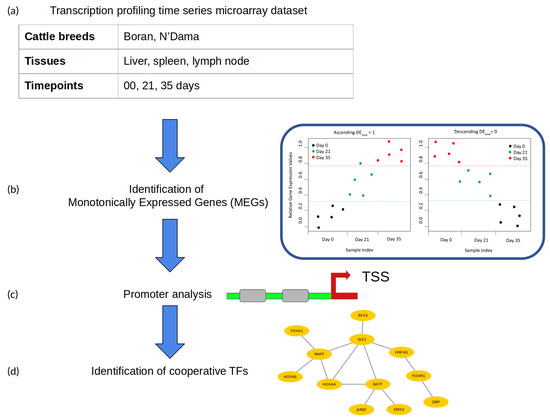
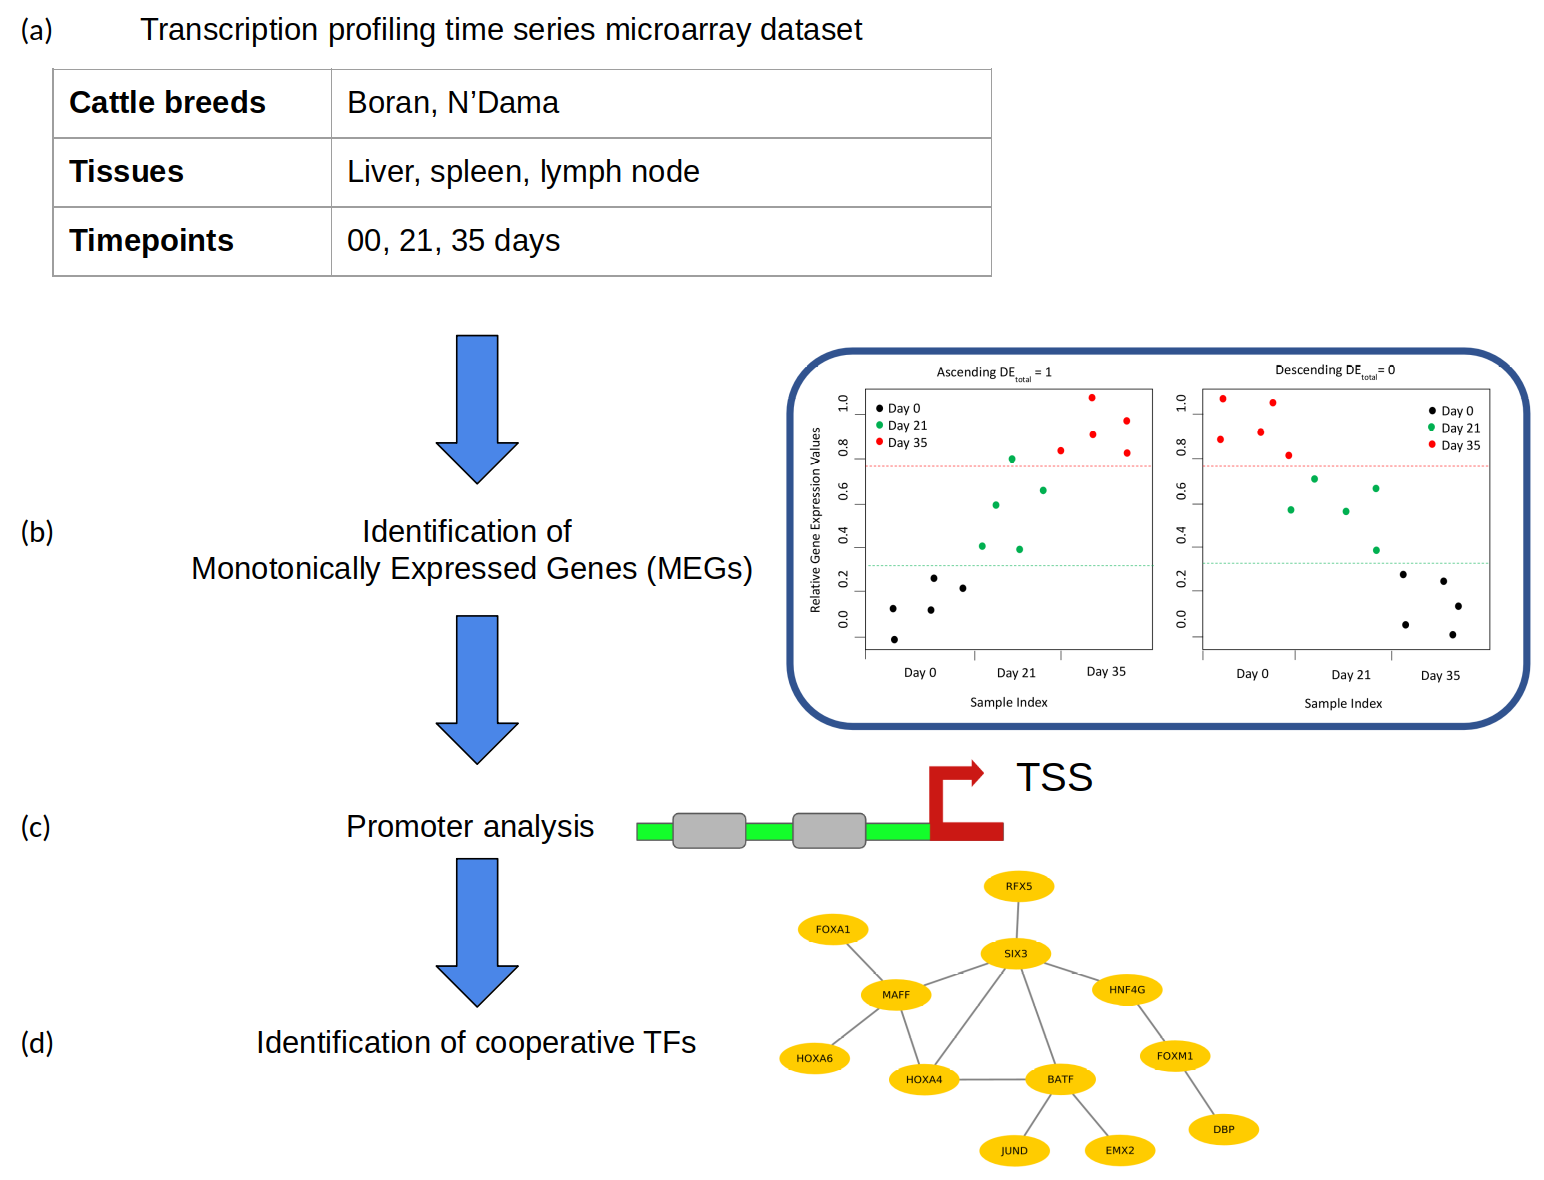
2.1. Microarray Dataset

A microarray experiment was undertaken by Noyes et al. (http://www.ebi.ac.uk/arrayexpress/, accession no. E-MEXP-1778) [20] to survey the genome of two cattle breeds for differentially expressed genes and their related pathways in different tissues. The dataset contains the gene expression obtained from a trypanosomiasis-susceptible (Boran) breed and a trypanosomiasis-resistant (N’Dama) breed at different time points (days: 0, 12, 15, 18, 21, 26, 29, 32 and 35) for three tissues, namely liver, spleen and lymph nodes. In their study, Noyes et al. [20] included 25 trypanosomiasis-free (healthy) animals of each breed which were chosen from herds at a tsetse fly free- and trypanosomiais-free zone of the ILRI Kapiti Plains ranch. Furthermore, before being transferred to the ILRI research facility at Kabete, they were tested for tick-borne parasites and confirmed negative. Afterwards, all animals were infected with T. congolense, which is one of the infectious species causing trypanosomiasis. N’Dama was selected for its trypanotolerance and Boran for its trypanosusceptibility. At different time points after infection, the tissues were collected from the animals. For control experiments, the tissue collection was undertaken similarly for the two breeds before infection and noted as day 0. Tissues from liver, spleen and lymph nodes were harvested on days 0, 21 and 35 after infection. Furthermore, liver tissues at additional time points on days: 12, 15, 18, 21, 26, 29 and 32, were collected by biopsy. RNA from each tissue was extracted and hybridised on arrays. Consequently, the dataset altogether consisted of 160 samples from three cattle tissues, containing expression values for 13,934 cattle genes. The expression strength is given in transcript per million (TPM) values.

2.2. Identification of Monotonically Expressed Genes

We applied the monotonic feature selector (MFSelector) approach [24] in order to identify the genes with a strong monotonic pattern (either in ascending or descending order) in their expression profiles over time points during disease progression.
The MFSelector approach requires gene expression datasets measured over several time points as input and assesses the confidence of the monotonicity of each gene by calculating its total discriminating error (DE total ).
Let g i j s be an expression value of gene g i measured at time point j = 1 , , T from sample s = 1 , , S . The discriminating error (DE) of g i is calculated by comparing its expression values g i j s observed for all samples S at time point j against the remaining time points as:
DE ( g i j s ) = 1 if g i j s > τ j 0 otherwise
In Equation (1), τ j refers to the threshold for discriminating line which distinguishes in ascending order the g i j s values of all samples at time point j from other time points and simultaneously ensures the minimum total discriminating error for j. Consequently, the DE total score for g i is calculated as:
DE total ( g i ) = j = 1 T s = 1 S DE ( g i j s )
Similar as in Equation (1), the discriminating error of genes is calculated to assess their monotonicity in descending order as:
DE ( g i j s ) = 1 if g i j s < η j 0 otherwise ,
where η j is the threshold for the discriminating line at j and lastly the DE total score is calculated again using Equation (2).
In the next step, MFSelector performs a permutation test for the assessment of the statistical significance of the DE total scores by calculating their unadjusted p-values and q-values which were adjusted p-values for multiple testing. Finally, based on the Sample Variance for Discriminating Error (svde), the level of confidence of a monotonic gene is determined. A small svde value indicates clear monotonicity of the corresponding gene.
For the application of the MFSelector package, we have to define parameters such as permut, svdetimes and svdenoise in order to set the level of stringency for the monotonicity. permut controls the statistical significance of the DE total index, svdetimes represents the number of times the SVDE procedure along with the random noise will be repeated and svdenoise indicates the strength of the noise in the experiment. The greater the values of the aforementioned parameters, the higher the stringency of the selection. For our analysis, to obtain the MEGs which are expressed with strong monotonic pattern, we applied the MFSelector approach by setting its parameters: permut 100, svdetimes 100 and svdenoise 0.1.

2.3. Identification of Transcription Factor Cooperation

In order to identify cooperative transcription factors, we applied our previously developed PC-TraFF method [26] which is a well established information theory based approach. The PC-TraFF algorithm uses the concept of pointwise mutual information (PMI) for the identification of TF cooperation by mainly considering the co-occurrence of their transcription factor binding sites (TFBSs) in the promoters of genes [26].
As input parameters the algorithm needs a set of regulatory sequences, a library of position weight matrices (PWMs) and pre-defined TFBS distance constraints.
  • Promoter sequences: The promoter sequence (covering the −500 to 100 bp regions relative to a transcription start site) of each significant monotonically expressed gene (MEG) is extracted from the UCSC genome browser [43].
  • Creation of the PWM library and TFBS detection: For the detection of TFBSs in the promoters of MEGs, we obtained PWMs from the TRANSFAC database (release 2018.1) [44].
    Until now, based on the functional analysis and comprehensive performance evaluation strategies, different studies have shown that the computational TFBS detection methods using PWMs are well established and highly applied. However, their prediction performance is prone to high rates of false positive predictions [30,45,46]. In order to eliminate the false predictions to some extent in our analysis, we manually created a specific PWM library following our previous study [47]. For this purpose, we first obtained all available cattle TFs from AnimalTFDB 2.0 [48] and identified the expression values (TPM values) of their corresponding TF genes in the gene expression dataset, under study. Second, the TFs were excluded from further analysis if the TPM values of their TF genes were zero. After that, the corresponding PWMs of the remaining TFs were obtained from the TRANSFAC database [44]. Finally, based on the Pearson correlation between these PWMs, we applied hierarchical clustering and used only the PWMs with the highest information content from each cluster as representative to create our final non-redundant vertebrate PWM library (see Supplementary Table S1).
    In addition, we applied the Match TM program [49] using these PWMs and their TRANSFAC specific profile parameter minSum to minimize the sum of false positive and false negative rate for the detection of putative TFBSs in promoter sequences.
  • Pre-defined distances: For the identification of cooperative TFs based on the co-occurrence of their TFBSs, the PC-TraFF algorithm requires pre-defined minimum and maximum distance thresholds. In this study, the recommended distance values of 5 and 20 were used for the minimum and maximum distance, respectively.
The PC-TraFF algorithm provides a PMI ( T a ; T b ) -score for each cooperative TF-pair ( T a and T b ), which is transformed in the next step into the z-score. A cooperation between any T a and T b is considered to be statistically significant if they have a z-score 3 .

3. Results and Discussion

3.1. Data Processing

We analysed a time series dataset which consisted of gene expression values for three tissues (liver, spleen and lymph node) from two cattle breeds, trypanosusceptible and trypanotolerant, during the disease progression after T. congolense infection. Although the dataset for liver tissue consisted of gene expression values from several time points (days 0, 12, 15, 18, 21, 26, 29, 32 and 35), we considered for this tissue the data only for 3 time points (days: 0, 21 and 35) similar to spleen and lymph node tissues, to ensure the purpose of maintaining uniformity throughout the analyses.

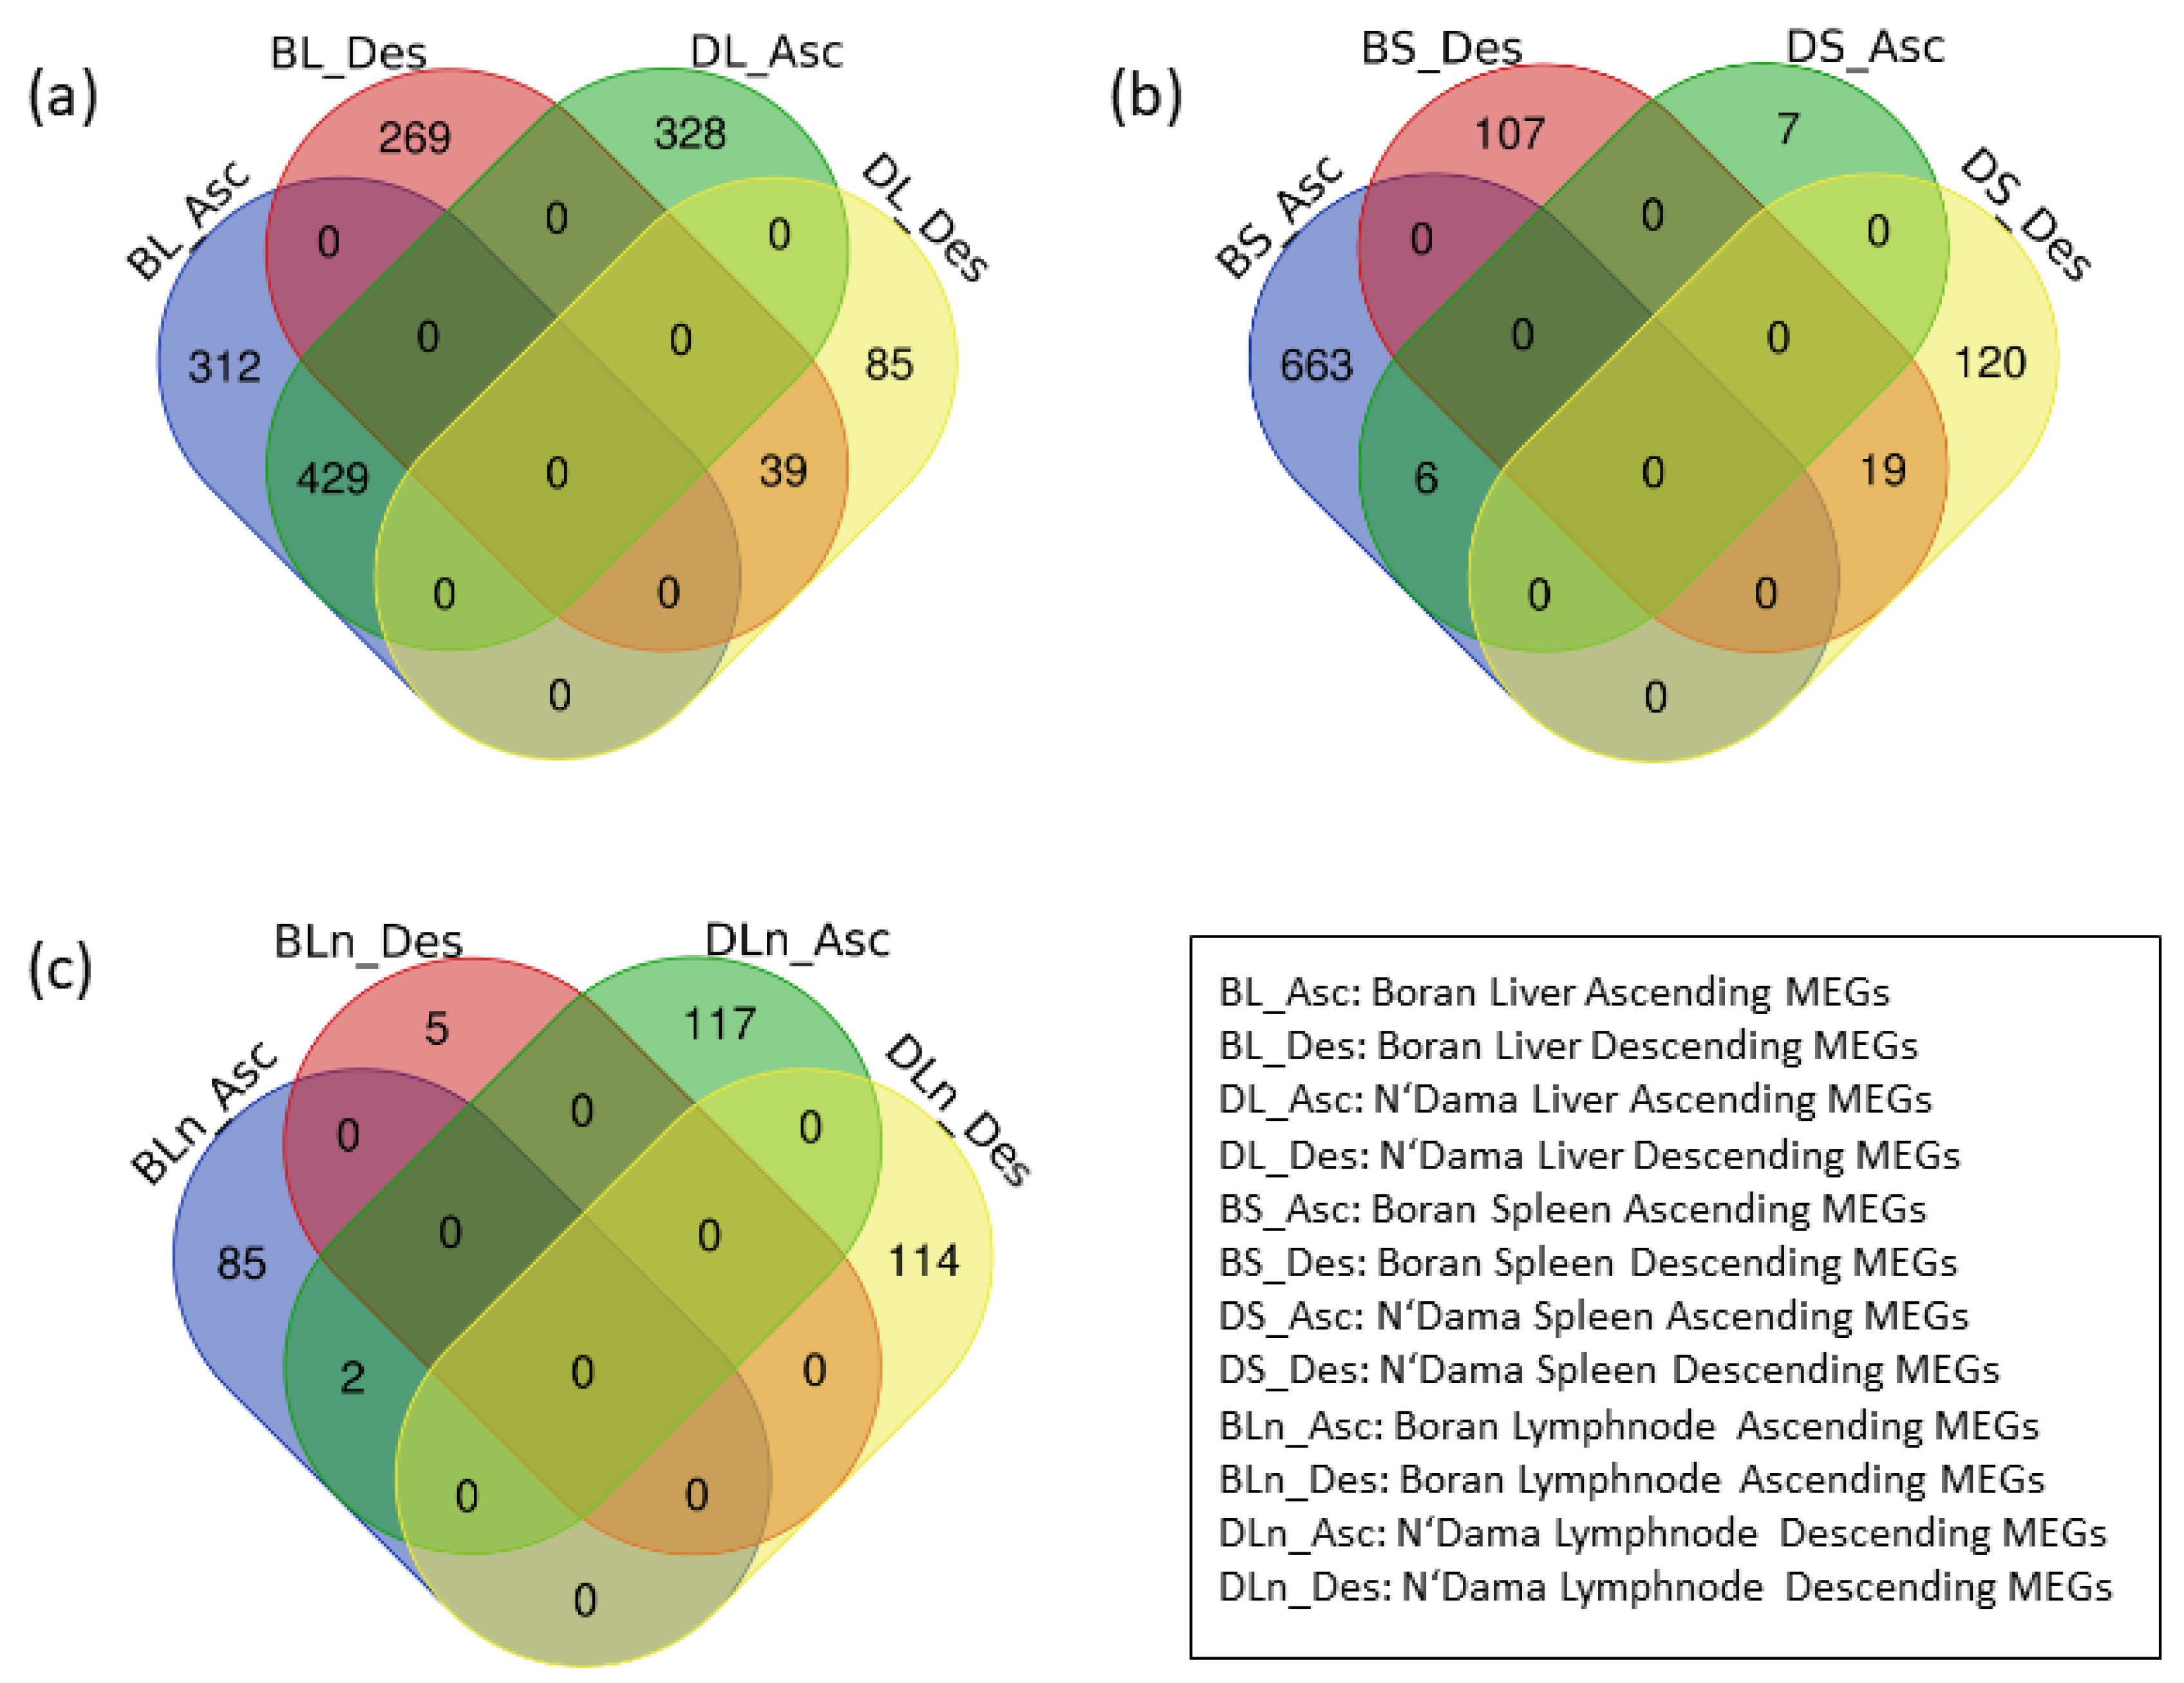
3.2. Identification of MEGs

To begin with the analysis, we organized the dataset for each breed separately and arranged the dataset unique for the tissue type of each breed in ascending order of time points. Afterwards, we applied the MFSelector package to the gene sets of each tissue, using its parameters as mentioned in the Materials and Methods section. Subsequently, we obtained for each tissue in both cattle breeds two lists of MEGs in ascending and descending order based on their monotonicity of expression during the disease progression. Finally, we defined for our further analysis a gene to be a statistically significant MEG if its corresponding q-value ≤ 0.05 and its svde value ≤ 1. The numbers of statistically significant MEGs are given in Table 1 and all lists of MEGs are provided in Supplementary Table S2.
The analysis of significant ascending and descending MEGs for spleen and lymph node tissues revealed that the vast majority of them are unique in both breeds and only a small minority of these MEGs is common to both breeds. On the other hand, there are 429 overlapping genes in the significant ascending MEGs and 39 overlapping genes in the descending MEGs in the liver tissue of Boran and N’Dama, respectively (see Figure 2). In our further analysis, we omitted the MEGs which are found to be significant and overlapping for a certain tissue in both breeds.

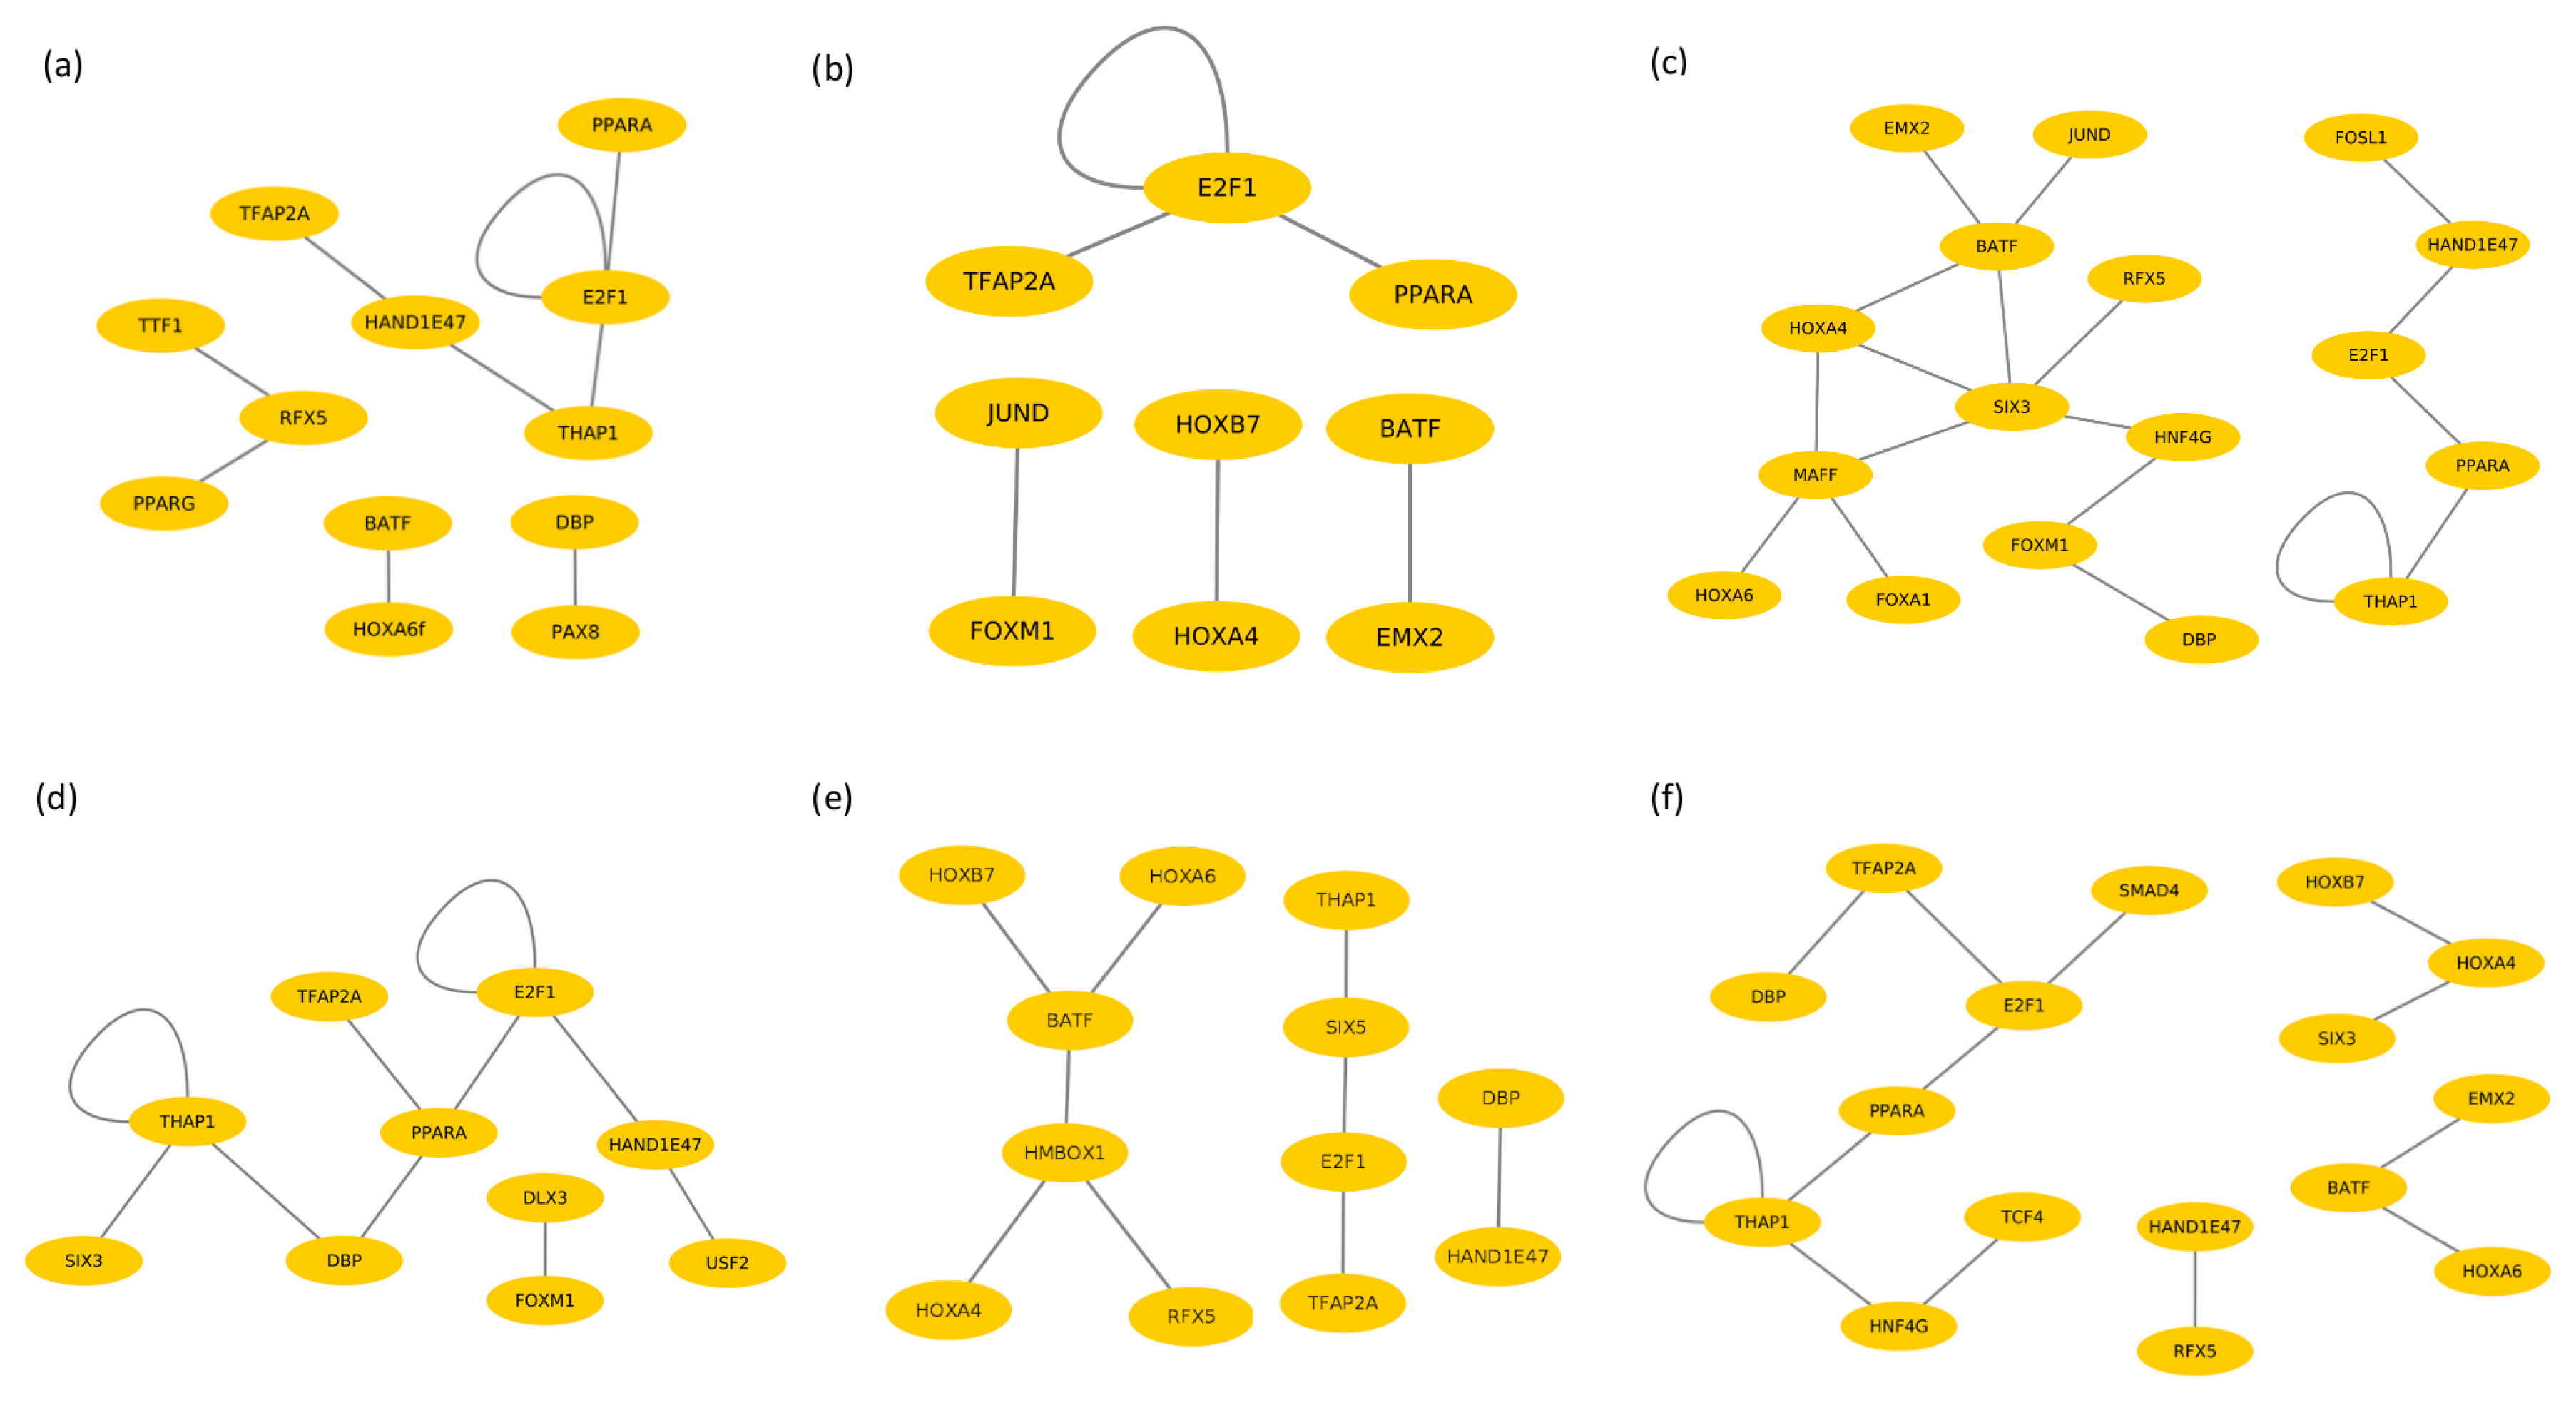
3.3. Identification of Cooperative TFs

Applying the PC-TraFF approach [26] to the promoters of MEGs for each tissue in both cattle breeds individually, we have identified significant cooperative TF pairs for liver, spleen and lymph node tissues which are listed in Table 2. The TFs E2F1, PPARA, THAP1, HAND1E47 and TFAP2A are frequently observed in all three tissues of both cattle breeds. The factor E2F1 belongs to the E2F family of transcription factors [50] and is involved in promoting the process of adipogenesis and in regulating lipolysis [51,52]. Denechaud et al. pointed out the association of E2F1 with several processes in pancreas, liver, heart, muscle, and adipocytes including lipogenesis, cholesterol transport, bile acid synthesis, glucose oxidation, and oxidative metabolism [52]. Furthermore, it was also reported that E2F1 mRNA levels in the adipose tissue correlated with circulating free fatty acid levels in obese human subjects [52,53]. Interestingly, E2F has been reported as one of the promising candidates in the circadian transcriptional regulators [54].
Kersten et al. explained in their review [55] PPARA is activated by ligands and is abundantly found in liver. In mouse, it is reported as the master regulator of lipid metabolism in liver during fasting. In human liver, it is reported that PPARA induces several genes involved in numerous metabolic pathways including bile acid synthesis, lipoprotein metabolism, synthesis and breakdown of triglycerides and lipid droplets. Moreover, they play suppressive roles in inflammation and acute phase response.
The factor THAP domain containing apoptosis associated protein 1 abbreviated to THAP1 belongs to the THAP protein family [50,56,57]. They are found in the interaction and co-localization with the promyelocytic leukemia nuclear bodies [56]. Another important factor is TFAP2A which is a member of the TFAP2 (AP-2) family of basic helix-span-helix transcription factors. A crucial role of these transcription factors has been shown in [58] as the master regulator of lipid droplet biogenesis, in which lipid droplets are known for various other functions including inflammatory responses, host-pathogen interaction, and other metabolic processes [58,59,60]. Importantly, it was found to be significantly over-represented in the promoter regions of clock controlled genes [54].
On the other hand, the factor HAND1E47 from the basic helix-loop-helix (bHLH) transcription factor family is reported in the development of heart [61,62,63,64] and to be associated with cardiac defects [65]. Its association with the host pathogen interplay is currently biologically unconfirmed.
In order to gain a better understanding of the underlying molecular mechanism of AAT in different tissues and compare the results of both breeds, we created cooperation networks for each tissue based on its specific TF pairs as suggested in our previous studies [26,47,66,67]. The nodes represent the TFs and the edges represent their co-operation in these networks which are presented in Figure 3. The cooperation networks of liver-, spleen- and lymph node tissues consist of 9, 6 and 18 cooperative TF pairs in Boran and 10, 9 and 13 pairs in N’Dama, respectively.

3.4. Cooperative TFs in Liver Tissue

The analysis of the cooperation networks for liver tissue (Figure 3a,d) reveals that, although several (single) TFs are overlapping in both networks, they change their partners in both breeds. Among others, cooperation of the factor DBP in these two cattle breeds highlights the difference in its remarkable preferential partner choice, namely DBP–PAX8 in Boran, whereas DBP–THAP1 and DBP–PPARA in N’Dama.
The albumin Site D-binding Protein (DBP) is regarded as a clock target gene which regulates primarily the sleep-wake cycle in mammalian species [54,68,69,70,71]. Further, DBP is associated with the circadian rhythm [68], which is normally disrupted in humans during the disease progression [72]. In Human African Trypanosomiasis (HAT), an improper disorganised sleeping pattern is common wherein the infected persons sleep more during day time and stay awake during night time [72]. The relationship between clock genes and the circadian rhythm are well established in several studies [73,74,75]. Further, DBP is a liver specific transcriptional activator, expressed in a circadian manner [76]. Circadian rhythm in peripheral tissues like liver is crucial for the normal hepatic metabolism [77,78], especially of lipids [79]. Several binding sites for DBP are reported in the promoter regions of the gene CYP7 which is involved in the rate limiting step of the pathway converting cholesterol to bile acids in mammalian species [80].
In the liver tissue of the cattle breed Boran, DBP forms dimers with the factor PAX8 which is one of the thyroid-specific transcription factors essential for the development of the thyroid gland [81,82]. Mutations in PAX8 have been reported to cause hypothyroidism [83]. PAX8 is a highly sensitive marker for thyroid and renal tumors [84]. The levels of the Thyroid Stimulating Hormone (TSH) are influenced by the circadian rhythm [85]. In relation to AAT, one of the endocrine organs affected by trypanosome infection is thyroid. Interestingly, decrease in the levels of T4 has been observed in goats after T. congolense infection, consequently indicating the impairment of the thyroid function [86]. Studies on Boran cattle infected with Trypanosoma congolense have confirmed the impairment of the pituitary gland [87].
Using neonatal Pax8 / mice, about a 10-fold increase of accumulation of hepatic triglycerides has been observed [88]. After the administration of thyroid hormone (TH), hepatic triglycerides were mobilised and processed [88]. Thyroid hormones and the functioning of the liver, particularly in the lipid metabolism, are interconnected with each other. Additionally, it is proven that thyroid hormone regulates a variety of metabolic processes by interacting with several important signalling pathways, thereby influencing energy metabolism and energy homeostasis [89]. They critically regulate the cholesterol metabolism in rat [90]. Specifically in liver, T3 and T4 hormones regulate the lipoprotein metabolism [88,91,92]. These findings support the hypothesis that the cooperation between the TFs DBP and PAX8 could be strongly associated with the circadian rhythm, thyroid hormones and the lipid metabolism of the AAT susceptible breed Boran.
On the other hand, the TF cooperations DBP–PPARA and DBP–THAP1 in the liver tissue of N’Dama might be noticeably changing the host and parasite interaction in a direction that is opposite to that of Boran. The factor PPARA from the Peroxisome proliferator-activated receptor family is reported to be an important regulator of lipid metabolism, predominantly expressed in liver. It belongs to the nuclear receptor hormone superfamily which are ligand-induced [93]. PPARs are increasingly studied in inflammation as they are involved directly in the negative regulation of inflammation. Remarkably, PPARA plays a significant anti-inflammatory role in the regulation of the immune system [93]. The second partner of DBP is the zinc fnger transcription factor THAP1 [56,94,95]. Mutations in THAP1 result in neuronal dysfunction leading to dystonia, a brain disorder which is characterized by involuntary muscle contractions and abnormal postures [96].
After T. congolense infection, cerebral lesions and enlargement of several organs in particular liver, spleen, lungs, heart, and lymph nodes, are observed during the pathogenesis of the disease [97,98]. This could be an indication that the infected cattle are attempting to remove the parasites from the body via chronic inflammation. Preferential partner choice of the factor DBP in the liver of both breeds could play an influential role in their AAT-tolerance mechanisms. In a study performed by Kierstein et al. [99] in mouse models infected with T. congolense, DBP has been identified as one of the Differentially Expressed Genes (DEGs) between susceptible and tolerant mice [99]. In a similar study, genes related to lipid transport and metabolism are frequently reported during the progressive stages of the disease [99]. Contrarily in N’Dama, the cooperation between DBP–PPARA could be leading to the regulation of lipid metabolism and inflammation. The parasitic trypanosomes might have altered the aforementioned regulatory mechanism of the host by changing the TF cooperation, especially that of DBP. This might be the hidden link between metabolic and immune system related pathways. In Boran liver, the DBP-PAX8 cooperation might be favouring the survival of the parasite in manipulating the pathways for lipid metabolism, which are essential for the parasite. On the other hand in N’Dama, strong transcriptional regulation of metabolism and inflammation might be serving as a critical switch in AAT-tolerance. Regarding the function of DBP in controlling the circadian rhythm of liver tissue in mammals and its relation to the AAT disease, our findings suggest that the specific partners of DBP in both breeds could be associated with different genetic programs governing their susceptibility or tolerance.
Another interesting TF found in the liver tissue of Boran is RFX5. The factor RFX5 belongs to the family of RFX (Regulatory Factor X) gene transcription factors [50] and its over-expression has been observed in hepatocellular carcinoma [100]. Previous studies have shown its critical importance in the regulation of the MHC (Major Histocompatibility Complex) class II gene for which RFX5 activates the expression of those genes essential for the initiation and propagation of the antigen-specific immune T cells [101,102,103]. In this regard, MHC II genes are shown to play an important role in the adaptive immunity [101,102,103]. In the thymus, they are important for the positive and negative selection of T-cells [101,102,103].
In the liver tissue of Boran, the RFX5 cooperates with the factors TTF1 and PPARG (see Figure 3a). The factor TTF1 (Thyroid Transcription Factor 1) is a nuclear protein expressed in the thyroid and the pulmonary epithelium [104,105]. It serves as a specific marker for lung and rectal adenocarcinoma [106,107,108]. Together with the factor PAX8, the factor TTF1 is a particularly important player in the organogenesis of the thyroid gland; both are reported in several studies of thyroid carcinomas [109,110,111]. The second cooperation partner of RFX5 is PPARG, which is a nuclear receptor with anti-inflammatory role and it contributes to cardiovascular diseases [112]. Furthermore, it regulates the expression of CD36 upon induction, which is involved in processes such as angiogenesis and inflammation. PPARG acts as modulator in adipogenesis, insulin sensitivity and the whole-body lipid metabolism [113,114,115,116].
On the other hand, the cooperation network of liver of N’Dama contains the transcription factors USF2 and FOXM1 which are strongly associated with immune responses (Figure 3d). Upstream Stimulatory Factor (USF2) is a member of the basic helix-loop-helix family that has been identified as one of the controllers of insulin synthesis [117]. Further, USF2 participates in the regulation of important cellular processes like metabolism, embryonic development, brain function, fertility, iron homeostasis and immune responses [118,119]. In a breast cancer study, levels of USF2 were reported abnormal and were suggested to play a role in cancer progression [120].
The factor FOXM1 belongs to the Forkhead box (FOX) transcription factor family [50] and is involved in a variety of biological processes including DNA damage response, drug resistance, cell death, and cell proliferation [121]. Furthermore, FOXM1 is regarded as the master regulator for DNA damage response and genotoxic agent resistance [122,123]. Based on its regulatory role, it is studied as a potential target for prognosis and treatment of cancers [124].
Taken together, the cooperative TF pairs in the liver tissue of both breeds could provide promising information to elucidate their regulatory genetic programs governing their susceptibility and tolerance traits.

3.5. Cooperative TFs in Spleen Tissue

Examining the cooperation networks for the spleen tissue of Boran and for N’Dama (Figure 3b,e) illustrates that all single TFs have different partners in the two breeds except for the TF pair E2F1–TFAP2A. Interestingly, the factor DBP forms only one dimer in the spleen tissue of N’Dama and it is absent in the cooperation network of Boran spleen tissue. The absence of DBP might be indirectly a significant implication of the disruption of the circadian rhythm and the related rhythmic processes in the spleen tissue as a result of trypanosome infection in Boran.
In contrast to Boran, the factor DBP forms a cooperative pair with the factor HAND1E47 in the TF network of the spleen tissue of N’Dama. Taking into account the significance of the interaction between DBP and HAND1E47, the factor HAND1E47 belongs to the bHLH transcription factor family, which is mainly involved in the cardiogenesis and hematopoiesis processes, as per the studies in Drosophila model [125]. Furthermore, loss-of-function mutation in HAND1 has been reported in dilated cardiomyopathy, which is the continuous enlargement and loss of contraction of the ventricular chamber in the heart [126]. The DBP-HAND1E47 cooperation in the spleen tissue seems to have great importance in the AAT disease resistance of N’Dama, because the AAT-infected cattle die in the final stage of the AAT disease, from cardiovascular defects wherein the TF cooperation DBP-HAND1E47 could play a defensive role in N’Dama.
A closer look at the cooperation networks of the spleen tissue further reveals that there are several homeobox transcription factors in both networks. Particularly, the factors HOXA4 and HOXB7 are found in the networks of both breeds, however with different TF partners. The TFs HOXA, HOXB, and HMBOX1 are involved in the regulation of differentiation of haematopoietic cells [127,128,129,130] and development of the embryo [131]. HOX genes have been shown to be master regulators of haematopoiesis and are related to haematopoietic disorders [132]. Consequently, their TF cooperations might also play important roles during the AAT disease as the cattle suffers from anaemia which is the destruction of blood cells. Moreover, HOXA4 has been reported in relation to Chronic Myeloid Leukaemia (CML) [133] and increased expression of HOXA6 in Acute Myeloid Leukaemia [134]. Furthermore, the factor HMBOX1 in the network of N’Dama, functions as a transcriptional repressor of the cell cytolytic activity of NK cells [135]. The factor HMBOX1 cooperates with BATF, HOXA4, and RFX5 only in the network of N’Dama which could lead to a significant difference in the regulatory events of the spleen tissue between Boran and N’Dama. HMBOX1 regulates the process of cell cytolysis, which could thereby be controlling the destruction of blood cells and maintaining the normal blood count of blood cells. According to its known molecular functions, the factor HMBOX1 might have a protective role in the spleen tissue against splenomegaly and anaemia which are prominent features of AAT.
Although the factor BATF has been identified as significant in both networks, it switches its partner (see Figure 3b,e). BATF belongs to the bZIP family of transcription factors and is predominantly expressed in lymphocytes. Its preferential partner choice could be strongly associated with the production of immune responses since this TF is specialized in controlling the differentiation of Th17 cells [136].
Another interesting factor is SIX5 which is found only in the network of N’Dama. SIX5 belongs to the Sine Oculis homeobox homolog family and is mainly involved in the process of differentiation, migration, and organogenesis [137]. In mouse, SIX5-deficient animals displayed characteristics of myotonic dystrophy [137,138,139], which is characterized by muscle weakness, cataracts, heart conduction complications and impaired cognitive functions [139]. The absence of SIX5 in Boran could also lead to the different AAT-disease signs.
Collectively, our findings in the spleen tissue of both breeds suggest that the specific partner choice of TFs could potentially contribute to splenomegaly, anaemia and immune responses in the susceptible breed Boran.

3.6. Cooperative TFs in Lymph Node Tissue

Analysis of the cooperation networks of the lymph node tissue (Figure 3c,f) demonstrates that few single TFs are common in the networks of both breeds, however, with different partners. In particular, the transcription factor DBP forms different dimers in these cooperation networks. Interestingly, in Boran lymph node DBP cooperates with FOXM1, which is a crucial mediator of inflammatory responses. Further, knocking out FOXM1 has resulted in the reduction of inflammatory response in osteoarthritis [140], suggesting that FOXM1 could play a crucial role in chronic inflammation in Boran during the disease. On the other hand, in N’Dama, the cooperation partner of DBP is TFAP2A which belongs to the AP2 transcription factors. Surprisingly similar to TFs found in liver tissue, also the TF TFAP2A is strongly related to lipid droplet biogenesis, which plays an important role in host-pathogen interaction [58,141]. According to the regulatory functions of TFAP2A, the cooperation of DBP-TFAP2A could be remarkably in strong favour of the rhythmic regulation of lipid droplet biogenesis process in the trypanotolerant breed N’Dama.
The cooperation DBP-FOXM1 in Boran could be in relation with the regulation of inflammation processes. In contrast to Boran, the DBP-TFAP2A cooperation might be involved in the regulation of the circadian rhythm in lymph node tissues of N’Dama.
Another transcription factor found in the cooperation network of Boran is MAFF, a leucine zipper (bZIP)-type transcription factor that cooperates with the following factors: FOXA1, SIX3, HOXA4 and HOXA6. Remarkably, SNPs in MAFF are experimentally reported to be in association with Chronic Myeloid Leukaemia [142]. The symptoms of Chronic Myeloid Leukaemia closely resemble the condition of AAT-affected cattle which suffer from similar weight loss, lymphadenopathy, splenomegaly, hepatomegaly, and cardiac failure during the disease [3,143].
The factor SMAD4 which is found in the network of N’Dama, is crucial for the regulation of differentiation of Th17 cells. As previously mentioned, Th17 cells are important in the investigation of inflammatory and autoimmune diseases. Furthermore, mutations on SMAD4 had resulted in the loss of suppression of Th17 cell differentiation and therefore they also serve as therapeutic target for autoimmune disorders [144]. As shown in the network of Boran, BATF, and JUN complexes have been studied in cartilage destruction through gene regulation in chondrocytes and therefore were identified as targets for osteoarthritis, a degenerative arthritis which affects joint tissues [145].
The factor TCF4 present in the network of N’Dama, belongs to a basic helix-loop-helix family which plays an integral role in Wnt signalling and neuronal differentiation especially in the brain development [146,147,148,149,150]. Furthermore, TCF4 is also involved in the immune responses through the production of plasmacytoid Dendritic Cells (pDCs), which respond to viral nucleic acids and autoimmune diseases, by the secretion of cytokines such as type I interferons [151,152,153,154]. Genetic alterations in TCF4 are easy targets and therefore mutations in TCF4 have been reported in the most common form of lymphoma which is the diffuse large B-cell lymphoma and Angelman syndrome [155,156]. The factor TCF4 has also been identified as the master regulator of schizophrenia, a severe complicated mental disorder [157]. It is reported that disruption in TCF4 regulatory networks is associated with neuropsychiatric diseases namely schizoprenia, autism, the Pitt-Hopkins syndrome, and depression [158,159]. In connection with AAT, the cattle suffers from fever, listlessness, oedema, depression, and paralysis during the progressive stages of the disease [3,160].
Similar to the networks of liver and spleen tissues, the cooperation network of lymph node tissue reveals the significance of the preferential partner choice of the factor DBP and, additionally, it provides a hint that the circadian rhythm in lymph node tissue could be associated with the generation of immune responses, which also includes inflammatory cytokines and the regulation of lipid droplets during the AAT disease.

4. Conclusions

Knowledge about TFs and their complex interplay is pivotal to understand the regulation of genetic programs which maintain adaptation of the animal to different pathophysiological stresses like parasitic infections. Our findings indicate that given the AAT disease progression, the preferential partner choice of TFs is strongly related to the tissue type and the susceptibility/resistance of the cattle breeds. Especially the results emphasized the higher relevance of the factor DBP along with its partners in circadian rhythm and lipid metabolism, which could be associated with the pathogenesis of AAT in trypanotolerant N’Dama and trypanosusceptible Boran. Importantly, the recent study of Solis et al. [28] on the crucial role of circadian regulation for the coordination of the immune functions lend support to our findings that the circadian control of the immune system influenced by host-pathogen interaction might have resulted in the transcriptional reprogramming of regulation determining the level of AAT-tolerance of the cattle. To the best of our knowledge, this is the first study in this field which mainly focuses on the importance of TFs and their cooperation to reveal the genetic programs underlying the AAT disease. Our results could be used in future works for deciphering the master regulators which could support experimental studies in generating novel hypotheses for potential drug targets.

Supplementary Materials

The following are available online at https://www.mdpi.com/2076-393X/8/2/246/s1, Table S1: The library of non-redundant position weight matrices (PWMs) used in our study, Table S2: Lists of Monotonically Expressed Genes obtained from the MFSelector approach.

Author Contributions

M.G. designed and supervised the research. A.R. participated in the design of the study and conducted computational analyses together with M.G. and performed the literature survey. F.H. and A.O.S. interpreted the results with A.R. and M.G. A.R. and M.G. wrote the final version of the manuscript. M.G. conceived of and managed the project. All authors read and approved the final manuscript.

Funding

This research received no external funding.

Acknowledgments

We acknowledge support by the German Research Foundation and the Open Access Publication Funds of the Göttingen University. We would like to thank Selina Klees, Faisal Ramzan, Martin Wutke and Yonatan Mekonnen for proofreading the manuscript and providing helpful advice and discussions.

Conflicts of Interest

The authors declare no conflict of interest.

References

  1. Biello, D. Deadly by the Dozen: 12 Diseases climate change may Worsen. Sci. Am. 2008, 8, 12–18. [Google Scholar]
  2. Radostits, O.M.; Gay, C.C.; Hinchcliff, K.W.; Constable, P.D. Veterinary Medicine E-Book: A Textbook of the Diseases of Cattle, Horses, Sheep, Pigs and Goats; Elsevier Health Sciences: Amsterdam, The Netherlands, 2006. [Google Scholar]
  3. Firesbhat, A.; Desalegn, C. Epidemiology and Impacts of Trypanosomiasis in Cattle. Eur. J. Appl. Sci. 2015, 7, 220–225. [Google Scholar]
  4. Donelson, J.E.; Hill, K.L.; El-Sayed, N.M. Multiple mechanisms of immune evasion by African trypanosomes. Mol. Biochem. Parasitol. 1998, 91, 51–66. [Google Scholar] [CrossRef]
  5. Losos, G.J.; Ikede, B. Review of pathology of diseases in domestic and laboratory animals caused by Trypanosoma congolense, T. vivax, T. brucei, T. rhodesiense and T. gambiense. Vet. Pathol. 1972, 9, 1–79. [Google Scholar] [CrossRef] [Green Version]
  6. Morrison, L.J.; Vezza, L.; Rowan, T.; Hope, J.C. Animal African trypanosomiasis: Time to increase focus on clinically relevant parasite and host species. Trends Parasitol. 2016, 32, 599–607. [Google Scholar] [CrossRef] [PubMed] [Green Version]
  7. Kristjanson, P.M.; Swallow, B.M.; Rowlands, G.; Kruska, R.; De Leeuw, P. Measuring the costs of African animal trypanosomosis, the potential benefits of control and returns to research. Agric. Syst. 1999, 59, 79–98. [Google Scholar] [CrossRef]
  8. Stijlemans, B.; De Baetselier, P.; Magez, S.; Van Ginderachter, J.A.; De Trez, C. African trypanosomiasis-associated anemia: The contribution of the interplay between parasites and the mononuclear phagocyte system. Front. Immunol. 2018, 9, 218. [Google Scholar] [CrossRef]
  9. Yaro, M.; Munyard, K.; Stear, M.; Groth, D. Combatting African animal trypanosomiasis (AAT) in livestock: The potential role of trypanotolerance. Vet. Parasitol. 2016, 225, 43–52. [Google Scholar] [CrossRef] [Green Version]
  10. Naessens, J. Bovine trypanotolerance: A natural ability to prevent severe anaemia and haemophagocytic syndrome? Int. J. Parasitol. 2006, 36, 521–528. [Google Scholar] [CrossRef]
  11. Murray, M.; D‘Ieteren, G.; Authie, E.; Wissocq, N. Trypanotolerance, an option for sustainable livestock production in areas at risk from trypanosomosis. OIE Rev. Sci. Tech. 1998, 17, 154–175. [Google Scholar]
  12. Starkey, P. N’Dama cattle-a productive trypanotolerant breed. FAO World Anim. Rev. 1984, 50, 2–15. [Google Scholar]
  13. Grootenhuis, J.; Dwinger, R.; Dolan, R.; Moloo, S.; Murray, M. Susceptibility of African buffalo and Boran cattle to Trypanosoma congolense transmitted by Glossina morsitans centralis. Vet. Parasitol. 1990, 35, 219–231. [Google Scholar] [CrossRef]
  14. Borst, P. Antigenic variation and allelic exclusion. Cell 2002, 109, 5–8. [Google Scholar] [CrossRef] [Green Version]
  15. Cross, G.A.; Wirtz, L.E.; Navarro, M. Regulation of vsg expression site transcription and switching in Trypanosoma brucei. Mol. Biochem. Parasitol. 1998, 91, 77–91. [Google Scholar] [CrossRef]
  16. Barry, J.D.; McCulloch, R. Antigenic variation in trypanosomes: Enhanced phenotypic variation in a eukaryotic parasite. Adv. Parasitol. 2001, 49, 1–70. [Google Scholar]
  17. Cnops, J.; Magez, S.; De Trez, C. Escape mechanisms of African trypanosomes: Why trypanosomosis is keeping us awake. Parasitology 2015, 142, 417–427. [Google Scholar] [CrossRef]
  18. Anene, B.; Onah, D.; Nawa, Y. Drug resistance in pathogenic African trypanosomes: What hopes for the future? Vet. Parasitol. 2001, 96, 83–100. [Google Scholar] [CrossRef]
  19. Michel-Todó, L.; Bigey, P.; Reche, P.A.; Pinazo, M.J.; Gascón, J.; Alonso-Padilla, J. Design of an Epitope-Based Vaccine Ensemble for Animal Trypanosomiasis by Computational Methods. Vaccines 2020, 8, 130. [Google Scholar] [CrossRef] [Green Version]
  20. Noyes, H.; Brass, A.; Obara, I.; Anderson, S.; Archibald, A.L.; Bradley, D.G.; Fisher, P.; Freeman, A.; Gibson, J.; Gicheru, M.; et al. Genetic and expression analysis of cattle identifies candidate genes in pathways responding to Trypanosoma congolense infection. Proc. Natl. Acad. Sci. USA 2011, 108, 9304–9309. [Google Scholar] [CrossRef] [Green Version]
  21. Ruddle, N.H.; Akirav, E.M. Secondary lymphoid organs: Responding to genetic and environmental cues in ontogeny and the immune response. J. Immunol. 2009, 183, 2205–2212. [Google Scholar] [CrossRef]
  22. Clayton, C.E.; Selkirk, M.E.; Corsini, C.A.; Ogilvie, B.M.; Askonas, B.A. Murine trypanosomiasis: Cellular proliferation and functional depletion in the blood, peritoneum, and spleen related to changes in bone marrow stem cells. Infect. Immun. 1980, 28, 824–831. [Google Scholar] [PubMed]
  23. Kuriakose, S.M.; Singh, R.; Uzonna, J.E. Host intracellular signaling events and pro-inflammatory cytokine production in African trypanosomiasis. Front. Immunol. 2016, 7, 181. [Google Scholar] [CrossRef] [PubMed]
  24. Wang, H.W.; Sun, H.J.; Chang, T.Y.; Lo, H.H.; Cheng, W.C.; Tseng, G.C.; Lin, C.T.; Chang, S.J.; Pal, N.R.; Chung, I.F. Discovering monotonic stemness marker genes from time-series stem cell microarray data. BMC Genom. 2015, 16, S2. [Google Scholar] [CrossRef] [PubMed] [Green Version]
  25. Tian, S. Identification of monotonically differentially expressed genes for non-small cell lung cancer. BMC Bioinform. 2019, 20, 177. [Google Scholar] [CrossRef] [Green Version]
  26. Meckbach, C.; Tacke, R.; Hua, X.; Waack, S.; Wingender, E.; Gültas, M. PC-TraFF: Identification of potentially collaborating transcription factors using pointwise mutual information. BMC Bioinform. 2015, 16, 400. [Google Scholar] [CrossRef] [Green Version]
  27. Wlochowitz, D.; Haubrock, M.; Arackal, J.; Bleckmann, A.; Wolff, A.; Beißbarth, T.; Wingender, E.; Gültas, M. Computational identification of key regulators in two different colorectal cancer cell lines. Front. Genet. 2016, 7, 42. [Google Scholar] [CrossRef] [Green Version]
  28. Orozco-Solis, R.; Aguilar-Arnal, L. Circadian Regulation of Immunity Through Epigenetic Mechanisms. Front. Cell. Infect. Microbiol. 2020, 10, 96. [Google Scholar] [CrossRef] [Green Version]
  29. Latchman, D.S. Transcription factors: An overview. Int. J. Biochem. Cell Biol. 1997, 29, 1305–1312. [Google Scholar] [CrossRef] [Green Version]
  30. Whitfield, T.W.; Wang, J.; Collins, P.J.; Partridge, E.C.; Aldred, S.F.; Trinklein, N.D.; Myers, R.M.; Weng, Z. Functional analysis of transcription factor binding sites in human promoters. Genome Biol. 2012, 13, R50. [Google Scholar] [CrossRef] [Green Version]
  31. Blanchette, M.; Tompa, M. Discovery of regulatory elements by a computational method for phylogenetic footprinting. Genome Res. 2002, 12, 739–748. [Google Scholar] [CrossRef] [Green Version]
  32. Blanchette, M.; Schwikowski, B.; Tompa, M. Algorithms for phylogenetic footprinting. J. Comput. Biol. 2002, 9, 211–223. [Google Scholar] [CrossRef] [PubMed]
  33. Jolma, A.; Yan, J.; Whitington, T.; Toivonen, J.; Nitta, K.R.; Rastas, P.; Morgunova, E.; Enge, M.; Taipale, M.; Wei, G.; et al. DNA-binding specificities of human transcription factors. Cell 2013, 152, 327–339. [Google Scholar] [CrossRef] [PubMed] [Green Version]
  34. Nitta, K.R.; Jolma, A.; Yin, Y.; Morgunova, E.; Kivioja, T.; Akhtar, J.; Hens, K.; Toivonen, J.; Deplancke, B.; Furlong, E.E.; et al. Conservation of transcription factor binding specificities across 600 million years of bilateria evolution. Elife 2015, 4, e04837. [Google Scholar] [CrossRef] [PubMed] [Green Version]
  35. Weirauch, M.T.; Yang, A.; Albu, M.; Cote, A.G.; Montenegro-Montero, A.; Drewe, P.; Najafabadi, H.S.; Lambert, S.A.; Mann, I.; Cook, K.; et al. Determination and inference of eukaryotic transcription factor sequence specificity. Cell 2014, 158, 1431–1443. [Google Scholar] [CrossRef] [Green Version]
  36. Franco-Zorrilla, J.M.; López-Vidriero, I.; Carrasco, J.L.; Godoy, M.; Vera, P.; Solano, R. DNA-binding specificities of plant transcription factors and their potential to define target genes. Proc. Natl. Acad. Sci. USA 2014, 111, 2367–2372. [Google Scholar] [CrossRef] [Green Version]
  37. Xie, Y.; Moussaif, M.; Choi, S.; Xu, L.; Sze, J.Y. RFX transcription factor DAF-19 regulates 5-HT and innate immune responses to pathogenic bacteria in Caenorhabditis elegans. PLoS Genet. 2013, 9, e1003324. [Google Scholar] [CrossRef] [Green Version]
  38. Powell, N.; Canavan, J.; MacDonald, T.; Lord, G. Transcriptional regulation of the mucosal immune system mediated by T-bet. Mucosal Immunol. 2010, 3, 567–577. [Google Scholar] [CrossRef]
  39. Rothenberg, E.V. Transcriptional control of early T and B cell developmental choices. Annu. Rev. Immunol. 2014, 32, 283–321. [Google Scholar] [CrossRef] [Green Version]
  40. Ghosh, D.; Papavassiliou, A.G. Transcription factor therapeutics: Long-shot or lodestone. Curr. Med. Chem. 2005, 12, 691–701. [Google Scholar] [CrossRef]
  41. Moustaqil, M.; Gambin, Y.; Sierecki, E. Biophysical Techniques for Target Validation and Drug Discovery in Transcription-Targeted Therapy. Int. J. Mol. Sci. 2020, 21, 2301. [Google Scholar] [CrossRef] [Green Version]
  42. Papavassiliou, K.A.; Papavassiliou, A.G. Transcription factor drug targets. J. Cell. Biochem. 2016, 117, 2693–2696. [Google Scholar] [CrossRef] [PubMed]
  43. Karolchik, D.; Hinrichs, A.S.; Furey, T.S.; Roskin, K.M.; Sugnet, C.W.; Haussler, D.; Kent, W.J. The UCSC Table Browser data retrieval tool. Nucleic Acids Res. 2004, 32, D493–D496. [Google Scholar] [CrossRef] [PubMed]
  44. Wingender, E. The TRANSFAC project as an example of framework technology that supports the analysis of genomic regulation. Briefings Bioinform. 2008, 9, 326–332. [Google Scholar] [CrossRef] [PubMed] [Green Version]
  45. Stormo, G.D. DNA binding sites: Representation and discovery. Bioinformatics 2000, 16, 16–23. [Google Scholar] [CrossRef] [PubMed]
  46. Tompa, M.; Li, N.; Bailey, T.L.; Church, G.M.; De Moor, B.; Eskin, E.; Favorov, A.V.; Frith, M.C.; Fu, Y.; Kent, W.J.; et al. Assessing computational tools for the discovery of transcription factor binding sites. Nat. Biotechnol. 2005, 23, 137. [Google Scholar] [CrossRef]
  47. Steuernagel, L.; Meckbach, C.; Heinrich, F.; Zeidler, S.; Schmitt, A.O.; Gültas, M. Computational identification of tissue-specific transcription factor cooperation in ten cattle tissues. PLoS ONE 2019, 14, e0216475. [Google Scholar] [CrossRef] [Green Version]
  48. Zhang, H.M.; Liu, T.; Liu, C.J.; Song, S.; Zhang, X.; Liu, W.; Jia, H.; Xue, Y.; Guo, A.Y. AnimalTFDB 2.0: A resource for expression, prediction and functional study of animal transcription factors. Nucleic Acids Res. 2014, 43, D76–D81. [Google Scholar] [CrossRef]
  49. Wingender, E.; Chen, X.; Fricke, E.; Geffers, R.; Hehl, R.; Liebich, I.; Krull, M.; Matys, V.; Michael, H.; Ohnhaeuser, R.; et al. Match-a tool for searching transcription factor binding sites in DNA sequences. Nucl. Acids Res. 2001, 29, 281–283. [Google Scholar] [CrossRef] [Green Version]
  50. Wingender, E.; Schoeps, T.; Dönitz, J. TFClass: An expandable hierarchical classification of human transcription factors. Nucleic Acids Res. 2012, 41, D165–D170. [Google Scholar] [CrossRef]
  51. Fajas, L.; Landsberg, R.L.; Huss-Garcia, Y.; Sardet, C.; Lees, J.A.; Auwerx, J. E2Fs regulate adipocyte differentiation. Dev. Cell 2002, 3, 39–49. [Google Scholar] [CrossRef] [Green Version]
  52. Denechaud, P.D.; Fajas, L.; Giralt, A. E2F1, a novel regulator of metabolism. Front. Endocrinol. 2017, 8, 311. [Google Scholar] [CrossRef] [PubMed]
  53. Haim, Y.; Blüher, M.; Slutsky, N.; Goldstein, N.; Klöting, N.; Harman-Boehm, I.; Kirshtein, B.; Ginsberg, D.; Gericke, M.; Guiu Jurado, E.; et al. Elevated autophagy gene expression in adipose tissue of obese humans: A potential non-cell-cycle-dependent function of E2F1. Autophagy 2015, 11, 2074–2088. [Google Scholar] [CrossRef] [PubMed]
  54. Bozek, K.; Relógio, A.; Kielbasa, S.M.; Heine, M.; Dame, C.; Kramer, A.; Herzel, H. Regulation of clock-controlled genes in mammals. PLoS ONE 2009, 4, e4882. [Google Scholar] [CrossRef] [PubMed]
  55. Kersten, S.; Stienstra, R. The role and regulation of the peroxisome proliferator activated receptor alpha in human liver. Biochimie 2017, 136, 75–84. [Google Scholar] [CrossRef]
  56. Roussigne, M.; Cayrol, C.; Clouaire, T.; Amalric, F.; Girard, J.P. THAP1 is a nuclear proapoptotic factor that links prostate-apoptosis-response-4 (Par-4) to PML nuclear bodies. Oncogene 2003, 22, 2432. [Google Scholar] [CrossRef] [Green Version]
  57. Gervais, V.; Campagne, S.; Durand, J.; Muller, I.; Milon, A. NMR studies of a new family of DNA binding proteins: The THAP proteins. J. Biomol. NMR 2013, 56, 3–15. [Google Scholar] [CrossRef]
  58. Scott, C.C.; Vossio, S.; Rougemont, J.; Gruenberg, J. TFAP2 transcription factors are regulators of lipid droplet biogenesis. Elife 2018, 7, e36330. [Google Scholar] [CrossRef]
  59. Melo, R.C.; Weller, P.F. Lipid droplets in leukocytes: Organelles linked to inflammatory responses. Exp. Cell Res. 2016, 340, 193–197. [Google Scholar] [CrossRef] [Green Version]
  60. Konige, M.; Wang, H.; Sztalryd, C. Role of adipose specific lipid droplet proteins in maintaining whole body energy homeostasis. Biochim. Biophys. Acta (BBA)-Mol. Basis Dis. 2014, 1842, 393–401. [Google Scholar] [CrossRef] [Green Version]
  61. Cross, J.C.; Flannery, M.L.; Blanar, M.A.; Steingrimsson, E.; Jenkins, N.A.; Copeland, N.; Rutter, W.; Werb, Z. Hxt encodes a basic helix-loop-helix transcription factor that regulates trophoblast cell development. Development 1995, 121, 2513–2523. [Google Scholar]
  62. Hollenberg, S.M.; Sternglanz, R.; Cheng, P.F.; Weintraub, H. Identification of a new family of tissue-specific basic helix-loop-helix proteins with a two-hybrid system. Mol. Cell. Biol. 1995, 15, 3813–3822. [Google Scholar] [CrossRef] [PubMed] [Green Version]
  63. Cserjesi, P.; Brown, D.; Lyons, G.E.; Olson, E.N. Expression of the novel basic helix-loop-helix gene eHAND in neural crest derivatives and extraembryonic membranes during mouse development. Dev. Biol. 1995, 170, 664–678. [Google Scholar] [CrossRef] [PubMed] [Green Version]
  64. Srivastava, D.; Cserjesi, P.; Olson, E.N. A subclass of bHLH proteins required for cardiac morphogenesis. Science 1995, 270, 1995–1999. [Google Scholar] [CrossRef] [PubMed]
  65. McFadden, D.G.; Barbosa, A.C.; Richardson, J.A.; Schneider, M.D.; Srivastava, D.; Olson, E.N. The Hand1 and Hand2 transcription factors regulate expansion of the embryonic cardiac ventricles in a gene dosage-dependent manner. Development 2005, 132, 189–201. [Google Scholar] [CrossRef] [PubMed] [Green Version]
  66. Meckbach, C.; Wingender, E.; Gültas, M. Removing background co-occurrences of transcription factor binding sites greatly improves the prediction of specific transcription factor cooperations. Front. Genet. 2018, 9, 189. [Google Scholar] [CrossRef]
  67. Zeidler, S.; Meckbach, C.; Tacke, R.; Raad, F.S.; Roa, A.; Uchida, S.; Zimmermann, W.H.; Wingender, E.; Gültas, M. Computational detection of stage-specific transcription factor clusters during heart development. Front. Genet. 2016, 7, 33. [Google Scholar] [CrossRef] [Green Version]
  68. Lopez-Molina, L.; Conquet, F.; Dubois-Dauphin, M.; Schibler, U. The DBP gene is expressed according to a circadian rhythm in the suprachiasmatic nucleus and influences circadian behavior. EMBO J. 1997, 16, 6762–6771. [Google Scholar] [CrossRef] [Green Version]
  69. Olds, W. Sleep, Circadian Rhythms, and Metabolism: The Rhythm of Life; Apple Academic Press: Palm Bay, FL, USA, 2014. [Google Scholar]
  70. Huang, W.; Ramsey, K.M.; Marcheva, B.; Bass, J. Circadian rhythms, sleep, and metabolism. J. Clin. Investig. 2011, 121, 2133–2141. [Google Scholar] [CrossRef]
  71. Laposky, A.D.; Bass, J.; Kohsaka, A.; Turek, F.W. Sleep and circadian rhythms: Key components in the regulation of energy metabolism. FEBS Lett. 2008, 582, 142–151. [Google Scholar] [CrossRef] [Green Version]
  72. Lundkvist, G.B.; Kristensson, K.; Bentivoglio, M. Why trypanosomes cause sleeping sickness. Physiology 2004, 19, 198–206. [Google Scholar] [CrossRef] [Green Version]
  73. Reppert, S.M.; Weaver, D.R. Molecular analysis of mammalian circadian rhythms. Annu. Rev. Physiol. 2001, 63, 647–676. [Google Scholar] [CrossRef] [PubMed]
  74. Borgs, L.; Beukelaers, P.; Vandenbosch, R.; Belachew, S.; Nguyen, L.; Malgrange, B. Cell “circadian” cycle: New role for mammalian core clock genes. Cell Cycle 2009, 8, 832–837. [Google Scholar] [CrossRef] [PubMed] [Green Version]
  75. Balsalobre, A. Clock genes in mammalian peripheral tissues. Cell Tissue Res. 2002, 309, 193–199. [Google Scholar] [CrossRef] [PubMed]
  76. Wuarin, J.; Schibler, U. Expression of the liver-enriched transcriptional activator protein DBP follows a stringent circadian rhythm. Cell 1990, 63, 1257–1266. [Google Scholar] [CrossRef]
  77. Reinke, H.; Asher, G. Circadian clock control of liver metabolic functions. Gastroenterology 2016, 150, 574–580. [Google Scholar] [CrossRef] [Green Version]
  78. Asher, G.; Schibler, U. Crosstalk between components of circadian and metabolic cycles in mammals. Cell Metab. 2011, 13, 125–137. [Google Scholar] [CrossRef] [Green Version]
  79. Cretenet, G.; Le Clech, M.; Gachon, F. Circadian clock-coordinated 12 hr period rhythmic activation of the IRE1α pathway controls lipid metabolism in mouse liver. Cell Metab. 2010, 11, 47–57. [Google Scholar] [CrossRef] [Green Version]
  80. Lee, Y.H.; Alberta, J.A.; Gonzalez, F.J.; Waxman, D.J. Multiple, functional DBP sites on the promoter of the cholesterol 7 alpha-hydroxylase P450 gene, CYP7. Proposed role in diurnal regulation of liver gene expression. J. Biol. Chem. 1994, 269, 14681–14689. [Google Scholar]
  81. Zannini, M.; Francis-Lang, H.; Plachov, D.; Di Lauro, R. Pax-8, a paired domain-containing protein, binds to a sequence overlapping the recognition site of a homeodomain and activates transcription from two thyroid-specific promoters. Mol. Cell. Biol. 1992, 12, 4230–4241. [Google Scholar] [CrossRef]
  82. Plachov, D.; Chowdhury, K.; Walther, C.; Simon, D.; Guenet, J.L.; Gruss, P. Pax8, a murine paired box gene expressed in the developing excretory system and thyroid gland. Development 1990, 110, 643–651. [Google Scholar]
  83. Macchia, P.E.; Lapi, P.; Krude, H.; Pirro, M.T.; Missero, C.; Chiovato, L.; Souabni, A.; Baserga, M.; Tassi, V.; Pinchera, A.; et al. PAX8 mutations associated with congenital hypothyroidism caused by thyroid dysgenesis. Nat. Genet. 1998, 19, 83. [Google Scholar] [CrossRef] [PubMed]
  84. Laury, A.R.; Perets, R.; Piao, H.; Krane, J.F.; Barletta, J.A.; French, C.; Chirieac, L.R.; Lis, R.; Loda, M.; Hornick, J.L.; et al. A comprehensive analysis of PAX8 expression in human epithelial tumors. Am. J. Surg. Pathol. 2011, 35, 816–826. [Google Scholar] [CrossRef] [PubMed] [Green Version]
  85. Patel, Y.; Alford, F.; Burger, H. The 24-hour plasma thyrotrophin profile. Clin. Sci. 1972, 43, 71–77. [Google Scholar] [CrossRef] [PubMed] [Green Version]
  86. Mutayoba, B.; Gombe, S. Effect of African trypanosomiasis on plasma cortisol and thyroxine concentration in goats. Res. Vet. Sci. 1989, 47, 315–318. [Google Scholar] [CrossRef]
  87. Abebe, G. The Integrity of Hypothalamic-Pituitary-Adrenal Axis in Boran (Bos Indicus) Cattle Infected with Trypanosoma Congolense. Ph.D. Thesis, Brunel University, Uxbridge, UK, 1991. [Google Scholar]
  88. Mukhopadhyay, D.; Plateroti, M.; Anant, S.; Nassir, F.; Samarut, J.; Davidson, N.O. Thyroid hormone regulates hepatic triglyceride mobilization and apolipoprotein B messenger ribonucleic acid editing in a murine model of congenital hypothyroidism. Endocrinology 2003, 144, 711–719. [Google Scholar] [CrossRef] [Green Version]
  89. McAninch, E.A.; Bianco, A.C. Thyroid hormone signaling in energy homeostasis and energy metabolism. Ann. N. Y. Acad. Sci. 2014, 1311, 77. [Google Scholar] [CrossRef] [Green Version]
  90. Mathe, D.; Chevallier, F. Effects of the thyroid state on cholesterol metabolism in the rat. Biochim. Biophys. Acta (BBA)-Lipids Lipid Metab. 1976, 441, 155–164. [Google Scholar] [CrossRef]
  91. Ness, G.C.; Dugan, R.E.; Lakshmanan, M.; Nepokroeff, C.M.; Porter, J.W. Stimulation of hepatic β-hydroxy-β-methylglutaryl coenzyme A reductase activity in hypophysectomized rats by L-triiodothyronine. Proc. Natl. Acad. Sci. USA 1973, 70, 3839–3842. [Google Scholar] [CrossRef] [Green Version]
  92. Ness, G.C.; Pendleton, L.C.; Li, Y.C.; Chiang, J.Y. Effect of thyroid hormone on hepatic cholesterol 7α hydroxylase, LDL receptor, HMG-CoA reductase, farnesyl pyrophosphate synthetase and apolipoprotein AI mRNA levels in hypophysectomized rats. Biochem. Biophys. Res. Commun. 1990, 172, 1150–1156. [Google Scholar] [CrossRef]
  93. Varga, T.; Czimmerer, Z.; Nagy, L. PPARs are a unique set of fatty acid regulated transcription factors controlling both lipid metabolism and inflammation. Biochim. Biophys. Acta (BBA)-Mol. Basis Dis. 2011, 1812, 1007–1022. [Google Scholar] [CrossRef]
  94. Clouaire, T.; Roussigne, M.; Ecochard, V.; Mathe, C.; Amalric, F.; Girard, J.P. The THAP domain of THAP1 is a large C2CH module with zinc-dependent sequence-specific DNA-binding activity. Proc. Natl. Acad. Sci. USA 2005, 102, 6907–6912. [Google Scholar] [CrossRef] [PubMed] [Green Version]
  95. Roussigne, M.; Kossida, S.; Lavigne, A.C.; Clouaire, T.; Ecochard, V.; Glories, A.; Amalric, F.; Girard, J.P. The THAP domain: A novel protein motif with similarity to the DNA-binding domain of P element transposase. Trends Biochem. Sci. 2003, 28, 66–69. [Google Scholar] [CrossRef]
  96. Zakirova, Z.; Fanutza, T.; Bonet, J.; Readhead, B.; Zhang, W.; Yi, Z.; Beauvais, G.; Zwaka, T.P.; Ozelius, L.J.; Blitzer, R.D.; et al. Mutations in THAP1/DYT6 reveal that diverse dystonia genes disrupt similar neuronal pathways and functions. PLoS Genet. 2018, 14, e1007169. [Google Scholar] [CrossRef] [PubMed]
  97. Valli, V.; Forsberg, C.; Robinson, G. The pathogenesis of Trypanosoma congolense infection in calves. I. Clinical observations and gross pathological changes. Vet. Pathol. 1978, 15, 608–620. [Google Scholar] [CrossRef] [PubMed] [Green Version]
  98. Silva Pereira, S.; Trindade, S.; De Niz, M.; Figueiredo, L.M. Tissue tropism in parasitic diseases. Open Biol. 2019, 9, 190036. [Google Scholar] [CrossRef] [Green Version]
  99. Kierstein, S.; Noyes, H.; Naessens, J.; Nakamura, Y.; Pritchard, C.; Gibson, J.; Kemp, S.; Brass, A. Gene expression profiling in a mouse model for African trypanosomiasis. Genes Immun. 2006, 7, 667–679. [Google Scholar] [CrossRef] [Green Version]
  100. Zhao, Y.; Xie, X.; Liao, W.; Zhang, H.; Cao, H.; Fei, R.; Wang, X.; Wei, L.; Shao, Q.; Chen, H. The transcription factor RFX5 is a transcriptional activator of the TPP1 gene in hepatocellular carcinoma. Oncol. Rep. 2017, 37, 289–296. [Google Scholar] [CrossRef]
  101. Aftab, S.; Semenec, L.; Chu, J.S.C.; Chen, N. Identification and characterization of novel human tissue-specific RFX transcription factors. BMC Evol. Biol. 2008, 8, 226. [Google Scholar] [CrossRef] [Green Version]
  102. Villard, J.; Peretti, M.; Masternak, K.; Barras, E.; Caretti, G.; Mantovani, R.; Reith, W. A functionally essential domain of RFX5 mediates activation of major histocompatibility complex class II promoters by promoting cooperative binding between RFX and NF-Y. Mol. Cell. Biol. 2000, 20, 3364–3376. [Google Scholar] [CrossRef]
  103. Janeway, C.A., Jr. Thymic selection: Two pathways to life and two to death. Immunity 1994, 1, 3–6. [Google Scholar] [CrossRef]
  104. Lazzaro, D.; Price, M.; de Felice, M.; Di Lauro, R. The transcription factor TTF-1 is expressed at the onset of thyroid and lung morphogenesis and in restricted regions of the foetal brain. Development 1991, 113, 1093–1104. [Google Scholar] [PubMed]
  105. Ikeda, K.; Clark, J.C.; Shaw-White, J.R.; Stahlman, M.T.; Boutell, C.J.; Whitsett, J.A. Gene structure and expression of human thyroid transcription factor-1 in respiratory epithelial cells. J. Biol. Chem. 1995, 270, 8108–8114. [Google Scholar] [CrossRef] [PubMed] [Green Version]
  106. Su, Y.C.; Hsu, Y.C.; Chai, C.Y. Role of TTF-1, CK20, and CK7 immunohistochemistry for diagnosis of primary and secondary lung adenocarcinoma. Kaohsiung J. Med Sci. 2006, 22, 14–19. [Google Scholar] [CrossRef] [Green Version]
  107. Belalcazar, A.; Krishnamurti, U.; Shaib, W. TTF-1 expression in rectal adenocarcinoma: A case report and review of the literature. Case Rep. Oncol. 2016, 9, 747–751. [Google Scholar] [CrossRef] [PubMed]
  108. Aversa, S.; Bellan, C. TTF1 Expression in Pulmonary Metastatic Rectal Adenocarcinoma. Case Rep. Gastrointest. Med. 2018, 2018, 6405125. [Google Scholar] [CrossRef] [PubMed] [Green Version]
  109. Fabbro, D.; Di Loreto, C.; Beltrami, C.A.; Belfiore, A.; Di Lauro, R.; Damante, G. Expression of thyroid-specific transcription factors TTF-1 and PAX-8 in human thyroid neoplasms. Cancer Res. 1994, 54, 4744–4749. [Google Scholar]
  110. Ros, P.; Rossi, D.L.; Acebrón, A.; Santisteban, P. Thyroid-specific gene expression in the multi-step process of thyroid carcinogenesis. Biochimie 1999, 81, 389–396. [Google Scholar] [CrossRef]
  111. Zhang, P.; Zuo, H.; Nakamura, Y.; Nakamura, M.; Wakasa, T.; Kakudo, K. Immunohistochemical analysis of thyroid-specific transcription factors in thyroid tumors. Pathol. Int. 2006, 56, 240–245. [Google Scholar] [CrossRef]
  112. Wahli, W.; Michalik, L. PPARs at the crossroads of lipid signaling and inflammation. Trends Endocrinol. Metab. 2012, 23, 351–363. [Google Scholar] [CrossRef]
  113. Daynes, R.A.; Jones, D.C. Emerging roles of PPARs in inflammation and immunity. Nat. Rev. Immunol. 2002, 2, 748. [Google Scholar] [CrossRef]
  114. Febbraio, M.; Hajjar, D.P.; Silverstein, R.L. CD36: A class B scavenger receptor involved in angiogenesis, atherosclerosis, inflammation, and lipid metabolism. J. Clin. Investig. 2001, 108, 785–791. [Google Scholar] [CrossRef] [PubMed]
  115. Rosen, E.D.; Sarraf, P.; Troy, A.E.; Bradwin, G.; Moore, K.; Milstone, D.S.; Spiegelman, B.M.; Mortensen, R.M. PPARγ is required for the differentiation of adipose tissue in vivo and in vitro. Mol. Cell 1999, 4, 611–617. [Google Scholar] [CrossRef]
  116. Yamauchi, T.; Kamon, J.; Waki, H.; Murakami, K.; Motojima, K.; Komeda, K.; Ide, T.; Kubota, N.; Terauchi, Y.; Tobe, K.; et al. The mechanisms by which both heterozygous peroxisome proliferator-activated receptor γ (PPARγ) deficiency and PPARγ agonist improve insulin resistance. J. Biol. Chem. 2001, 276, 41245–41254. [Google Scholar] [CrossRef] [PubMed] [Green Version]
  117. Spohrer, S.; Groß, R.; Nalbach, L.; Schwind, L.; Stumpf, H.; Menger, M.D.; Ampofo, E.; Montenarh, M.; Götz, C. Functional interplay between the transcription factors USF1 and PDX-1 and protein kinase CK2 in pancreatic β-cells. Sci. Rep. 2017, 7, 16367. [Google Scholar] [CrossRef] [Green Version]
  118. Sirito, M.; Lin, Q.; Deng, J.M.; Behringer, R.R.; Sawadogo, M. Overlapping roles and asymmetrical cross-regulation of the USF proteins in mice. Proc. Natl. Acad. Sci. USA 1998, 95, 3758–3763. [Google Scholar] [CrossRef] [Green Version]
  119. Corre, S.; Galibert, M.D. Upstream stimulating factors: Highly versatile stress-responsive transcription factors. Pigment Cell Res. 2005, 18, 337–348. [Google Scholar] [CrossRef]
  120. Tan, Y.; Chen, Y.; Du, M.; Peng, Z.; Xie, P. USF2 inhibits the transcriptional activity of Smurf1 and Smurf2 to promote breast cancer tumorigenesis. Cell. Signal. 2019, 53, 49–58. [Google Scholar] [CrossRef]
  121. Lam, E.W.F.; Gomes, A.R. Forkhead box transcription factors in cancer initiation, progression and chemotherapeutic drug response. Front. Oncol. 2014, 4, 305. [Google Scholar] [CrossRef] [Green Version]
  122. Liao, G.B.; Li, X.Z.; Zeng, S.; Liu, C.; Yang, S.M.; Yang, L.; Hu, C.J.; Bai, J.Y. Regulation of the master regulator FOXM1 in cancer. Cell Commun. Signal. 2018, 16, 1–15. [Google Scholar] [CrossRef] [Green Version]
  123. Zona, S.; Bella, L.; Burton, M.J.; de Moraes, G.N.; Lam, E.W.F. FOXM1: An emerging master regulator of DNA damage response and genotoxic agent resistance. Biochim. Biophys. Acta (BBA)-Gene Regul. Mech. 2014, 1839, 1316–1322. [Google Scholar] [CrossRef] [Green Version]
  124. Nandi, D.; Cheema, P.S.; Jaiswal, N.; Nag, A. FoxM1: Repurposing an oncogene as a biomarker. In Seminars in Cancer Biology; Elsevier: Amsterdam, The Netherlands, 2018; Volume 52, pp. 74–84. [Google Scholar]
  125. Han, Z.; Yi, P.; Li, X.; Olson, E.N. Hand, an evolutionarily conserved bHLH transcription factor required for Drosophila cardiogenesis and hematopoiesis. Development 2006, 133, 1175–1182. [Google Scholar] [CrossRef] [PubMed] [Green Version]
  126. Zhou, Y.M.; Dai, X.Y.; Qiu, X.B.; Yuan, F.; Li, R.G.; Xu, Y.J.; Qu, X.K.; Huang, R.T.; Xue, S.; Yang, Y.Q. HAND1 loss-of-function mutation associated with familial dilated cardiomyopathy. Clin. Chem. Lab. Med. (CCLM) 2016, 54, 1161–1167. [Google Scholar] [CrossRef] [PubMed]
  127. Abramovich, C.; Humphries, R.K. Hox regulation of normal and leukemic hematopoietic stem cells. Curr. Opin. Hematol. 2005, 12, 210–216. [Google Scholar] [CrossRef] [PubMed]
  128. Chiba, S. Homeobox genes in normal hematopoiesis and leukemogenesis. Int. J. Hematol. 1998, 68, 343–353. [Google Scholar] [CrossRef]
  129. Cillo, C.; Cantile, M.; Faiella, A.; Boncinelli, E. Homeobox genes in normal and malignant cells. J. Cell. Physiol. 2001, 188, 161–169. [Google Scholar] [CrossRef]
  130. Grier, D.; Thompson, A.; Kwasniewska, A.; McGonigle, G.; Halliday, H.; Lappin, T. The pathophysiology of HOX genes and their role in cancer. J. Pathol. J. Pathol. Soc. G. B. Irel. 2005, 205, 154–171. [Google Scholar]
  131. Deschamps, J.; Duboule, D. Embryonic timing, axial stem cells, chromatin dynamics, and the Hox clock. Genes Dev. 2017, 31, 1406–1416. [Google Scholar] [CrossRef] [Green Version]
  132. Collins, E.M.; Thompson, A. HOX genes in normal, engineered and malignant hematopoiesis. Int. J. Dev. Biol. 2020, 62, 847–856. [Google Scholar] [CrossRef]
  133. Elias, M.H.; Baba, A.A.; Husin, A.; Sulong, S.; Hassan, R.; Sim, G.A.; Wahid, A.; Fadilah, S.; Ankathil, R. HOXA4 gene promoter hypermethylation as an epigenetic mechanism mediating resistance to imatinib mesylate in chronic myeloid leukemia patients. BioMed Res. Int. 2013, 2013. [Google Scholar] [CrossRef] [Green Version]
  134. Dickson, G.J.; Kwasniewska, A.; Mills, K.I.; Lappin, T.R.; Thompson, A. Hoxa6 potentiates short-term hemopoietic cell proliferation and extended self-renewal. Exp. Hematol. 2009, 37, 322–333. [Google Scholar] [CrossRef]
  135. Wu, L.; Zhang, C.; Zhang, J. HMBOX1 negatively regulates NK cell functions by suppressing the NKG2D/DAP10 signaling pathway. Cell. Mol. Immunol. 2011, 8, 433. [Google Scholar] [CrossRef] [PubMed] [Green Version]
  136. Schraml, B.U.; Hildner, K.; Ise, W.; Lee, W.L.; Smith, W.A.E.; Solomon, B.; Sahota, G.; Sim, J.; Mukasa, R.; Cemerski, S.; et al. The AP-1 transcription factor Batf controls T H 17 differentiation. Nature 2009, 460, 405. [Google Scholar] [CrossRef] [PubMed] [Green Version]
  137. Kumar, J. The sine oculis homeobox (SIX) family of transcription factors as regulators of development and disease. Cell. Mol. Life Sci. 2009, 66, 565. [Google Scholar] [CrossRef] [PubMed] [Green Version]
  138. Klesert, T.R.; Cho, D.H.; Clark, J.I.; Maylie, J.; Adelman, J.; Snider, L.; Yuen, E.C.; Soriano, P.; Tapscott, S.J. Mice deficient in Six5 develop cataracts: Implications for myotonic dystrophy. Nat. Genet. 2000, 25, 105. [Google Scholar] [CrossRef] [PubMed]
  139. Meola, G.; Cardani, R. Myotonic dystrophies: An update on clinical aspects, genetic, pathology, and molecular pathomechanisms. Biochim. Et Biophys. Acta (BBA)-Mol. Basis Dis. 2015, 1852, 594–606. [Google Scholar] [CrossRef] [Green Version]
  140. Zeng, R.M.; Lu, X.H.; Lin, J.; Hu, J.; Rong, Z.J.; Xu, W.C.; Liu, Z.W.; Zeng, W.T. Knockdown of FOXM1 attenuates inflammatory response in human osteoarthritis chondrocytes. Int. Immunopharmacol. 2019, 68, 74–80. [Google Scholar] [CrossRef]
  141. Vallochi, A.L.; Teixeira, L.; Oliveira, K.d.S.; Maya-Monteiro, C.M.; Bozza, P.T. Lipid droplet, a key player in host-parasite interactions. Front. Immunol. 2018, 9, 1022. [Google Scholar] [CrossRef]
  142. Martínez-Hernández, A.; Gutierrez-Malacatt, H.; Carrillo-Sánchez, K.; Saldaña-Alvarez, Y.; Rojas-Ochoa, A.; Crespo-Solis, E.; Aguayo-González, A.; Rosas-López, A.; Ayala-Sanchez, J.M.; Aquino-Ortega, X.; et al. Small MAF genes variants and chronic myeloid leukemia. Eur. J. Haematol. 2014, 92, 35–41. [Google Scholar] [CrossRef]
  143. Mukiihi, J.; Nyirenda, C.; Paul, B.; Aduwuyi, J.; Mzula, E.; Malata, H. Chronic myeloid leukaemia in central Africans. East Afr. Med. J. 2003, 80, 470–475. [Google Scholar] [CrossRef] [Green Version]
  144. Zhang, S.; Zhang, G.; Wan, Y.Y. SKI and SMAD4 are essential for IL-21-induced Th17 differentiation. Mol. Immunol. 2019, 114, 260–268. [Google Scholar] [CrossRef]
  145. Rhee, J.; Park, S.H.; Kim, S.K.; Kim, J.H.; Ha, C.W.; Chun, C.H.; Chun, J.S. Inhibition of BATF/JUN transcriptional activity protects against osteoarthritic cartilage destruction. Ann. Rheum. Dis. 2017, 76, 427–434. [Google Scholar] [CrossRef] [PubMed] [Green Version]
  146. Grant, S.F.; Thorleifsson, G.; Reynisdottir, I.; Benediktsson, R.; Manolescu, A.; Sainz, J.; Helgason, A.; Stefansson, H.; Emilsson, V.; Helgadottir, A.; et al. Variant of transcription factor 7-like 2 (TCF7L2) gene confers risk of type 2 diabetes. Nat. Genet. 2006, 38, 320. [Google Scholar] [CrossRef] [PubMed]
  147. Ledent, V.; Paquet, O.; Vervoort, M. Phylogenetic analysis of the human basic helix-loop-helix proteins. Genome Biol. 2002, 3, research0030-1. [Google Scholar] [CrossRef] [PubMed] [Green Version]
  148. de Pontual, L.; Mathieu, Y.; Golzio, C.; Rio, M.; Malan, V.; Boddaert, N.; Soufflet, C.; Picard, C.; Durandy, A.; Dobbie, A.; et al. Mutational, functional, and expression studies of the TCF4 gene in Pitt-Hopkins syndrome. Hum. Mutat. 2009, 30, 669–676. [Google Scholar] [CrossRef] [PubMed]
  149. Hrckulak, D.; Janeckova, L.; Lanikova, L.; Kriz, V.; Horazna, M.; Babosova, O.; Vojtechova, M.; Galuskova, K.; Sloncova, E.; Korinek, V. Wnt effector tcf4 is dispensable for wnt signaling in human cancer cells. Genes 2018, 9, 439. [Google Scholar] [CrossRef] [Green Version]
  150. Schoof, M.; Hellwig, M.; Harrison, L.; Holdhof, D.; Lauffer, M.C.; Niesen, J.; Virdi, S.; Indenbirken, D.; Schüller, U. The basic helix-loop-helix transcription factor TCF4 impacts brain architecture as well as neuronal morphology and differentiation. Eur. J. Neurosci. 2020. [Google Scholar] [CrossRef]
  151. Gilliet, M.; Cao, W.; Liu, Y.J. Plasmacytoid dendritic cells: Sensing nucleic acids in viral infection and autoimmune diseases. Nat. Rev. Immunol. 2008, 8, 594. [Google Scholar] [CrossRef]
  152. Reizis, B.; Bunin, A.; Ghosh, H.S.; Lewis, K.L.; Sisirak, V. Plasmacytoid dendritic cells: Recent progress and open questions. Annu. Rev. Immunol. 2011, 29, 163–183. [Google Scholar] [CrossRef] [Green Version]
  153. Sisirak, V.; Ganguly, D.; Lewis, K.L.; Couillault, C.; Tanaka, L.; Bolland, S.; D’Agati, V.; Elkon, K.B.; Reizis, B. Genetic evidence for the role of plasmacytoid dendritic cells in systemic lupus erythematosus. J. Exp. Med. 2014, 211, 1969–1976. [Google Scholar] [CrossRef] [Green Version]
  154. Han, S.M.; Na, H.Y.; Ham, O.; Choi, W.; Sohn, M.; Ryu, S.H.; In, H.; Hwang, K.C.; Park, C.G. TCF4-targeting miR-124 is differentially expressed amongst dendritic cell subsets. Immune Netw. 2016, 16, 61–74. [Google Scholar] [CrossRef] [Green Version]
  155. Jain, N.; Hartert, K.; Tadros, S.; Fiskus, W.; Havranek, O.; Ma, M.C.J.; Bouska, A.; Heavican, T.; Kumar, D.; Deng, Q.; et al. Targetable genetic alterations of TCF4 (E2-2) drive immunoglobulin expression in diffuse large B cell lymphoma. Sci. Transl. Med. 2019, 11, eaav5599. [Google Scholar] [CrossRef] [PubMed]
  156. Takano, K.; Lyons, M.; Moyes, C.; Jones, J.; Schwartz, C. Two percent of patients suspected of having Angelman syndrome have TCF4 mutations. Clin. Genet. 2010, 78, 282–288. [Google Scholar] [CrossRef] [PubMed]
  157. Torshizi, A.D.; Armoskus, C.; Zhang, H.; Forrest, M.P.; Zhang, S.; Souaiaia, T.; Evgrafov, O.V.; Knowles, J.A.; Duan, J.; Wang, K. Deconvolution of Transcriptional Networks Identifies TCF4 as a Master Regulator in Schizophrenia. Sci. Adv. 2019, 5, eaau4139. [Google Scholar] [CrossRef] [Green Version]
  158. Li, H.; Zhu, Y.; Morozov, Y.M.; Chen, X.; Page, S.C.; Rannals, M.D.; Maher, B.J.; Rakic, P. Disruption of TCF4 regulatory networks leads to abnormal cortical development and mental disabilities. Mol. Psychiatry 2019, 24, 1235–1246. [Google Scholar] [CrossRef] [PubMed]
  159. Li, M.; Santpere, G.; Kawasawa, Y.I.; Evgrafov, O.V.; Gulden, F.O.; Pochareddy, S.; Sunkin, S.M.; Li, Z.; Shin, Y.; Zhu, Y.; et al. Integrative functional genomic analysis of human brain development and neuropsychiatric risks. Science 2018, 362, eaat7615. [Google Scholar] [CrossRef] [PubMed] [Green Version]
  160. Steverding, D. The history of African trypanosomiasis. Parasites Vectors 2008, 1, 3. [Google Scholar] [CrossRef] [PubMed] [Green Version]
Figure 1. Flowchart of analysis. (a) Processing of the microarray dataset; (b) identification of Monotonically Expressed Genes using the MFSelector approach; (c) promoter analysis (TSS: transcription start site); (d) identification of cooperative TFs using PC-TraFF approach.
Vaccines 08 00246 g001
Figure 2. Venn-diagram of the MEGs in the ascending and descending orders of (a) liver-, (b) spleen-
Vaccines 08 00246 g002
Figure 3. Cooperation networks for the TF pairs of (a) liver tissue of Boran, (b) spleen tissue of Boran, (c) lymph node tissue of Boran, (d) liver tissue of N’Dama, (e) spleen tissue of N’Dama and (f) lymph node tissue of N’Dama.
Vaccines 08 00246 g003
Table 1. Numbers of statistically significant Monotonically Expressed Genes in ascending and descending order for liver-, spleen- and lymph node-tissues for the cattle breeds Boran and N’Dama.
BoranN’Dama
AscendingDescendingAscendingDescending
Liver741308757124
Spleen66912613139
Lymph node875119114
Table 2. Cooperative TF pairs specific for liver-, spleen-, and lymph node tissues of Boran and N’Dama obtained from PC-TraFF approach.
Cooperative Transcription Factor Pairs
BreedLiverSpleenLymph Node
BoranPPARG–RFX5
HAND1E47–THAP1
HAND1E47–TFAP2A
THAP1–E2F1
HOXA6–BATF
TTF1–RFX5
DBP–PAX8
E2F1–PPARA
E2F1–E2F1
EMX2–BATF
FOXM1–JUND
HOXA4–HOXB7
PPARA–E2F1
E2F1–E2F1
E2F1–TFAP2A
JUND–BATF
HOXA6–MAFF
SIX3–MAFF
HAND1E47–E2F1
HOXA4–BATF
FOXM1–HNF4G
DBP–FOXM1
SIX3–RFX5
HAND1E47–FOSL1
FOXA1–MAFF
HOXA4–MAFF
SIX3–BATF
SIX3–HNF4G
HOXA4–SIX3
THAP1–PPARA
E2F1–PPARA
EMX2–BATF
THAP1–THAP1
N’DamaPPARG–SIX5
FOXM1–DLX3
HAND1E47–E2F1
HAND1E47–USF2
SIX5–PPARA
SIX3–THAP1
THAP1–THAP1
PPARA–DBP
PPARA–TFAP2A
E2F1–E2F1
HMBOX–BATF
HOXB7–BATF
SIX5–THAP1
HOXA4–HMBOX1
HAND1E47–DBP
HOXA6–BATF
SIX5–E2F1
HMBOX1–RFX5
E2F1–TFAP2A
SMAD4–E2F1
HOXA6–BATF
HOXA4–HOXB7
TCF4–HNF4G
E2F1–TFAP2A
THAP1–HNF4G
DBP–TFAP2A
HAND1E47–RFX5
THAP1–PPARA
E2F1–PPARA
EMX2–BATF
HOXA4–SIX3
THAP1–THAP1

