3.1. MD Simulations Revealed Domain Motions and Formation of Interdomain Interactions in 3CD
Conformational dynamics of 3CD was investigated using MD simulations as described in the Experimental section §2.1. MD simulations permit the study of time-dependent structural changes of proteins, providing detailed information on protein conformations that are relevant to function. The structure of the wild-type (WT, monomer 1) 3CD was immersed in a box containing water solvent and counterions were added to neutralize charges on the protein. The whole system was subjected to a 100 ns all-atom MD simulation with structural snapshots stored every 1 ps. Analysis of the trajectory of the MD simulation yielded detailed information on the dynamics of 3CD.
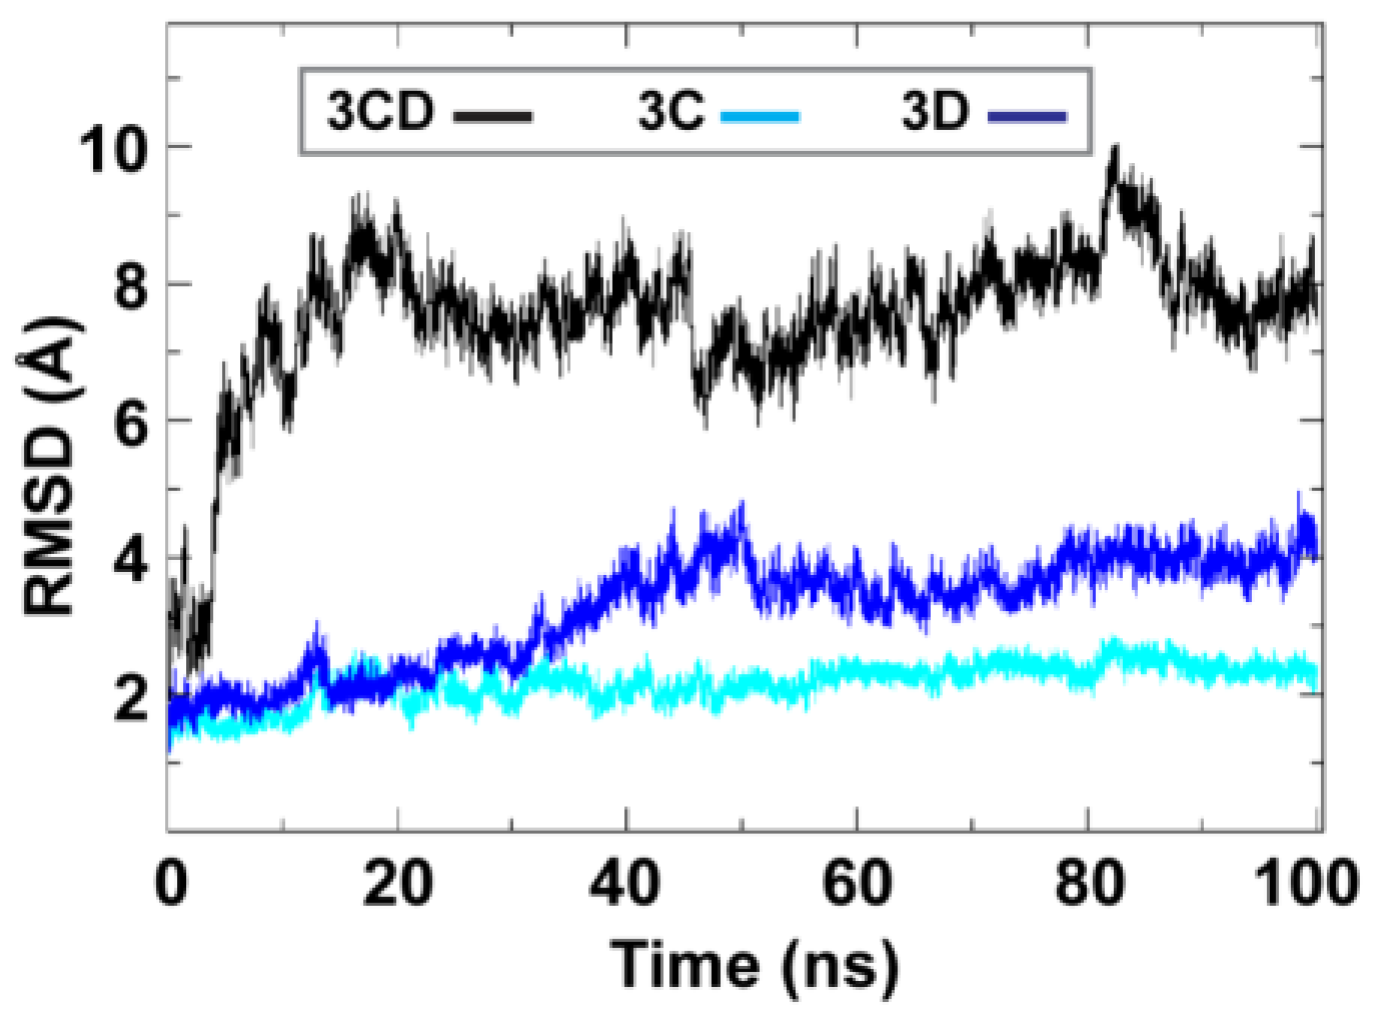
To obtain information on the extent of structural changes of 3CD during simulations, we calculated the root-mean-square deviations (RMSD) of all snapshots in the MD trajectory relative to the starting coordinates. The calculations were carried out utilizing backbone atoms of all residues in the protein and backbone atoms of the individual 3C and 3D domains (
Figure 2). Clear differences were observed between the RMSD calculated using the 3CD precursor protein and that calculated for the individual domains. In the case of the precursor protein, the RMSD showed a dramatic increase during the first 10 ns of the simulation, reached an average of
8 Å after 20 ns and continued fluctuating around this average for the rest of the MD trajectory. For 3C-domain, the calculated RMSD fluctuated around an average of
2 Å throughout the entire trajectory. For 3D-domain, a gradual increase in RMSD values was observed during the first half of the MD trajectory, reaching a value of
4 Å and fluctuating around this average value for the remainder of the simulation. This large discrepancy in RMSD values of the individual domains compared to that of the precursor protein suggested large domain movements during the simulation. Also, the larger RMSD values of the 3D-domain compared to that of 3C-domain (
4 Å
vs. 2 Å) indicated that 3D-domain is more dynamic than 3C-domain.
The large domain movements in 3CD indicated by RMSD analysis (
Figure 2) was readily observable by visual inspection of the MD trajectory using the molecular graphics software CHIMERA [
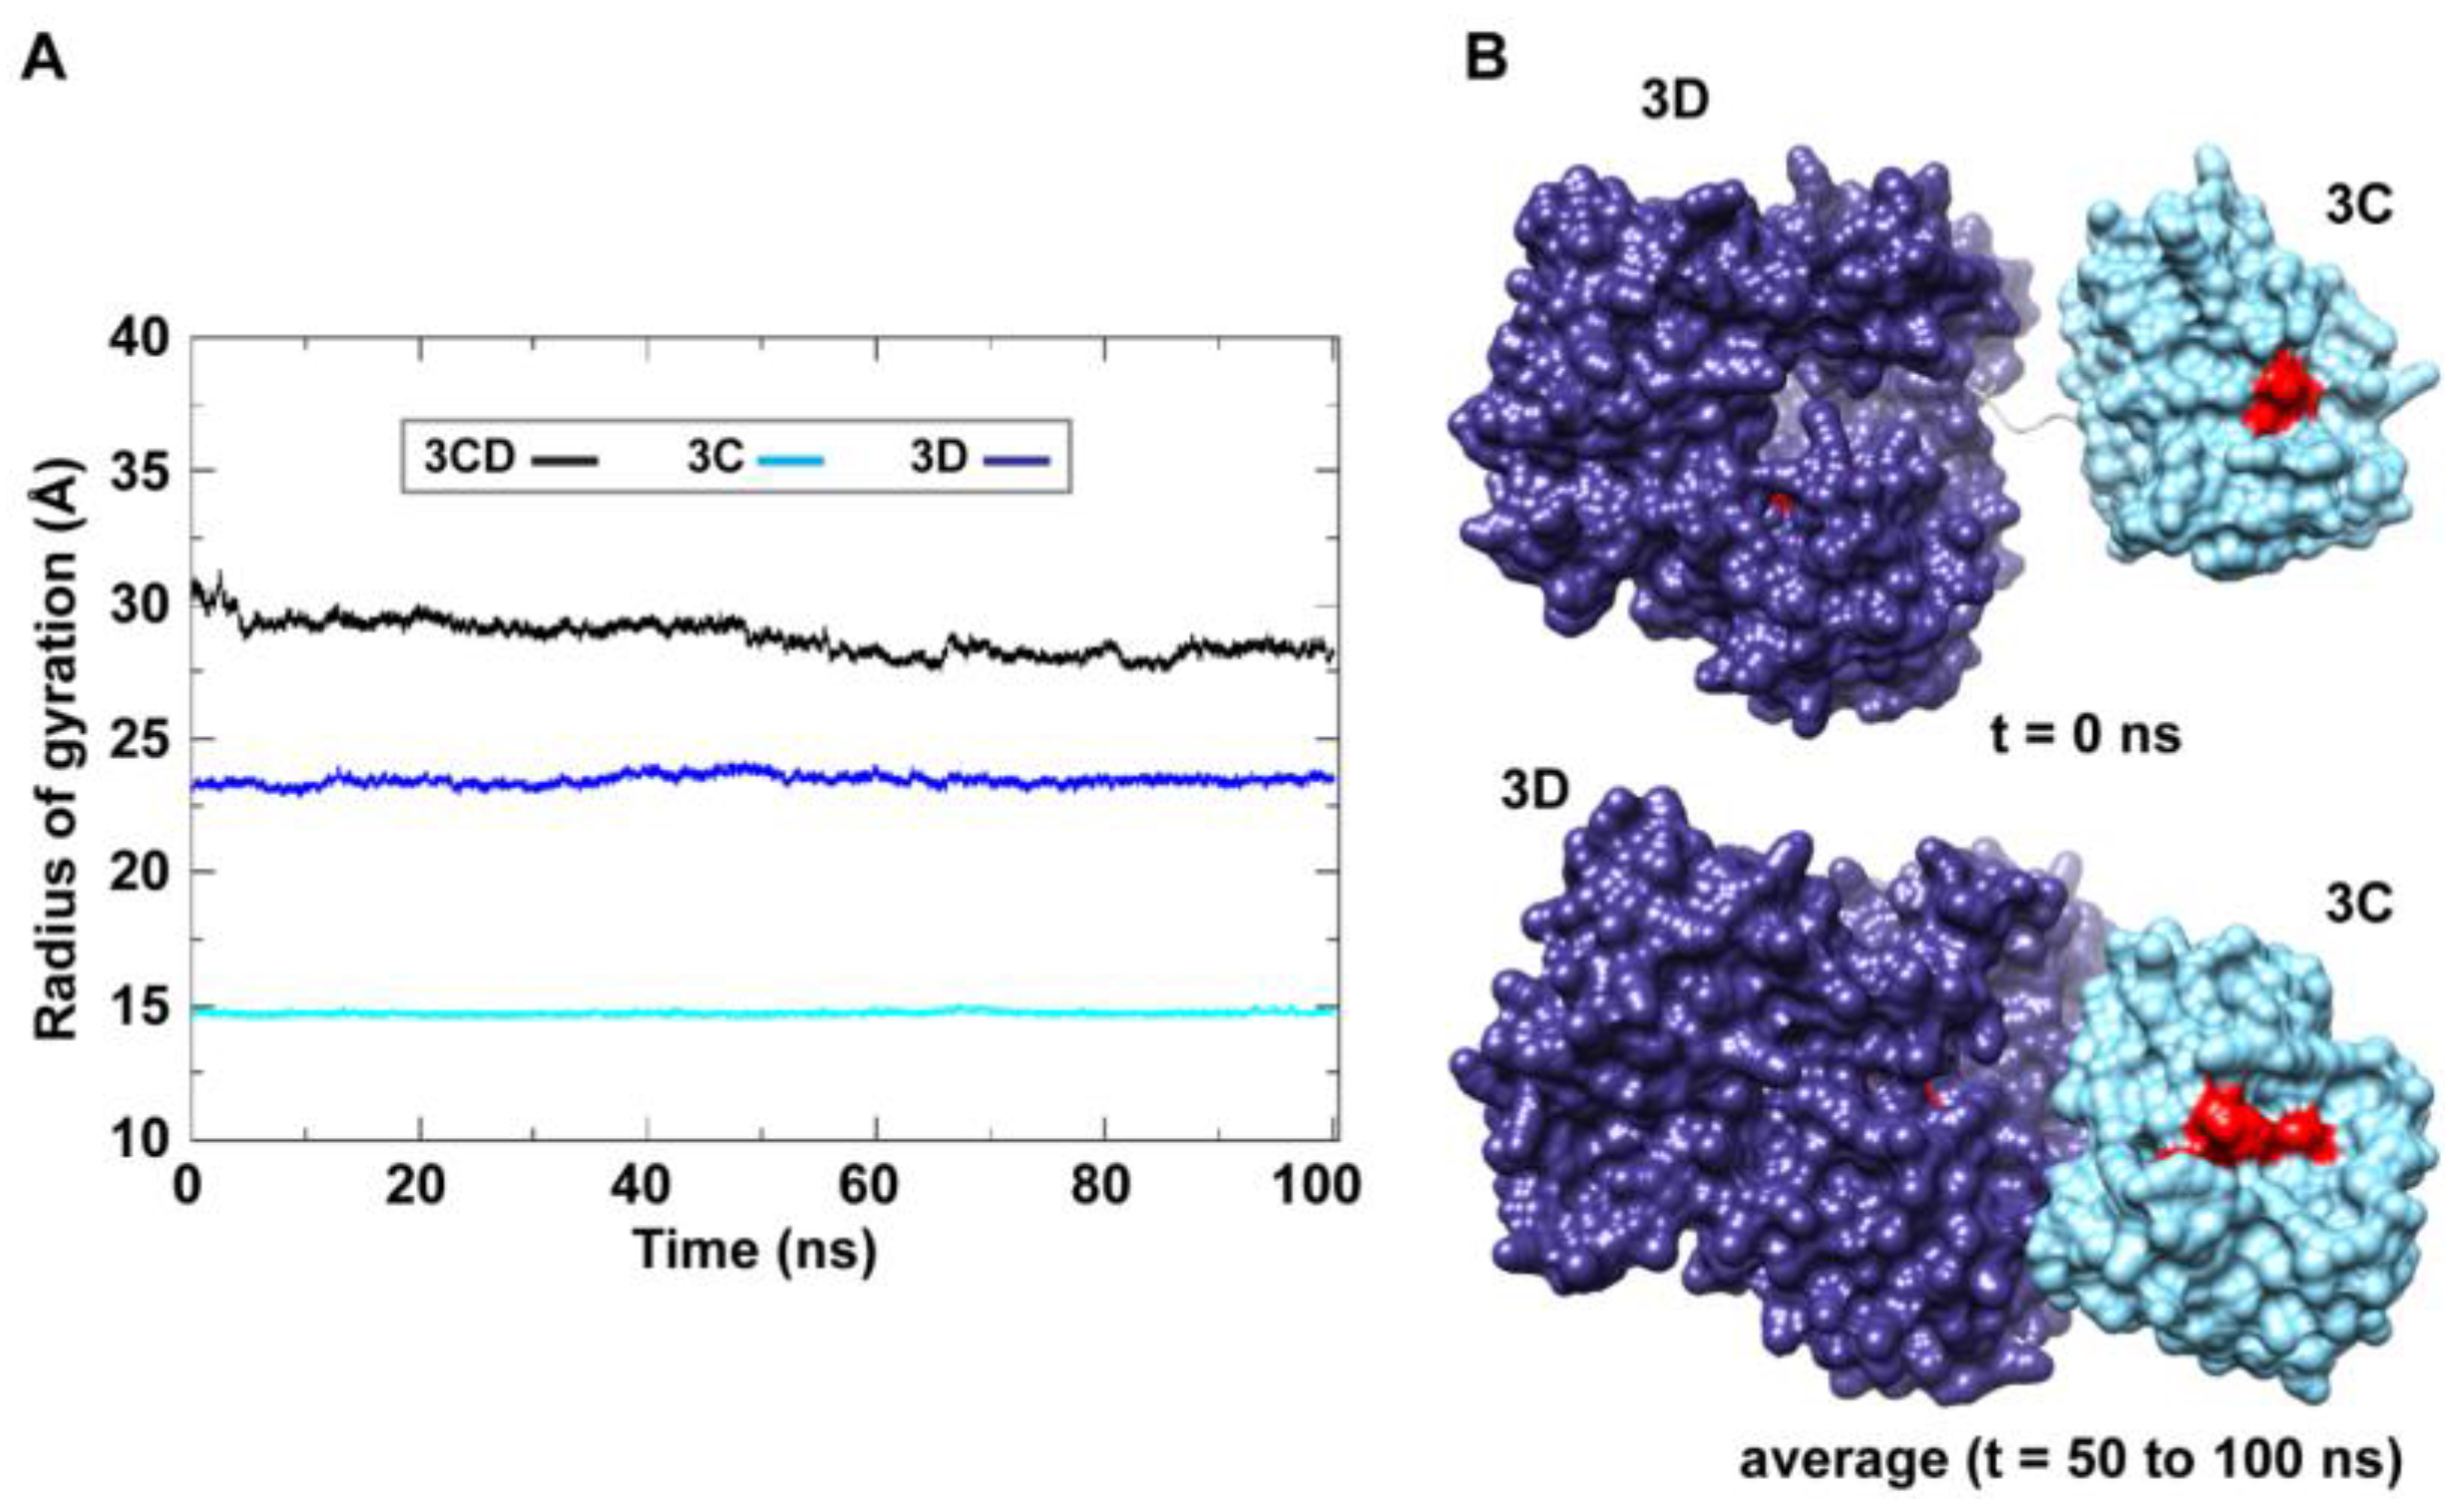
50]. The 3C and 3D domains evidently approached each other early during simulations to form a compact conformation. To assess this observed conformational change in a more quantitative manner, the radius of gyration (
Rg), which describes the root-mean-square distance of the protein atoms from their common center of mass, was calculated as a function of time. The
Rg calculations were carried out for the full-length 3CD protein as well as for the individual 3C and 3D domains (
Figure 3A); only backbone atoms were used in the calculations. For 3C-domain, the calculated
Rg remained almost constant throughout the simulation with an average value of 14.7
0.06 Å. The calculated
Rg of the 3D-domain showed more variation than that of the 3C-domain, fluctuating around an average value of 23.4
0.2 Å. For 3CD, the calculated
Rg exhibited substantial variation; it decreased by approximately 8% from 30.1 Å at the starting time of simulation to an average of 27.8
0.6 Å over the last 50 ns of the simulation. The decreasing
Rg of the full-length 3CD without significant changes in the
Rg values of the individual 3C and 3D domains is consistent with the large domain movements hinted by RMSD analysis and that the two domains are getting closer during the simulation. Calculating the average structure of 3CD using structural snapshots from the last 50 ns of the MD trajectory clearly revealed a compact conformation with interactions between 3C and 3D domains relative to their extended conformation in the crystal structure (
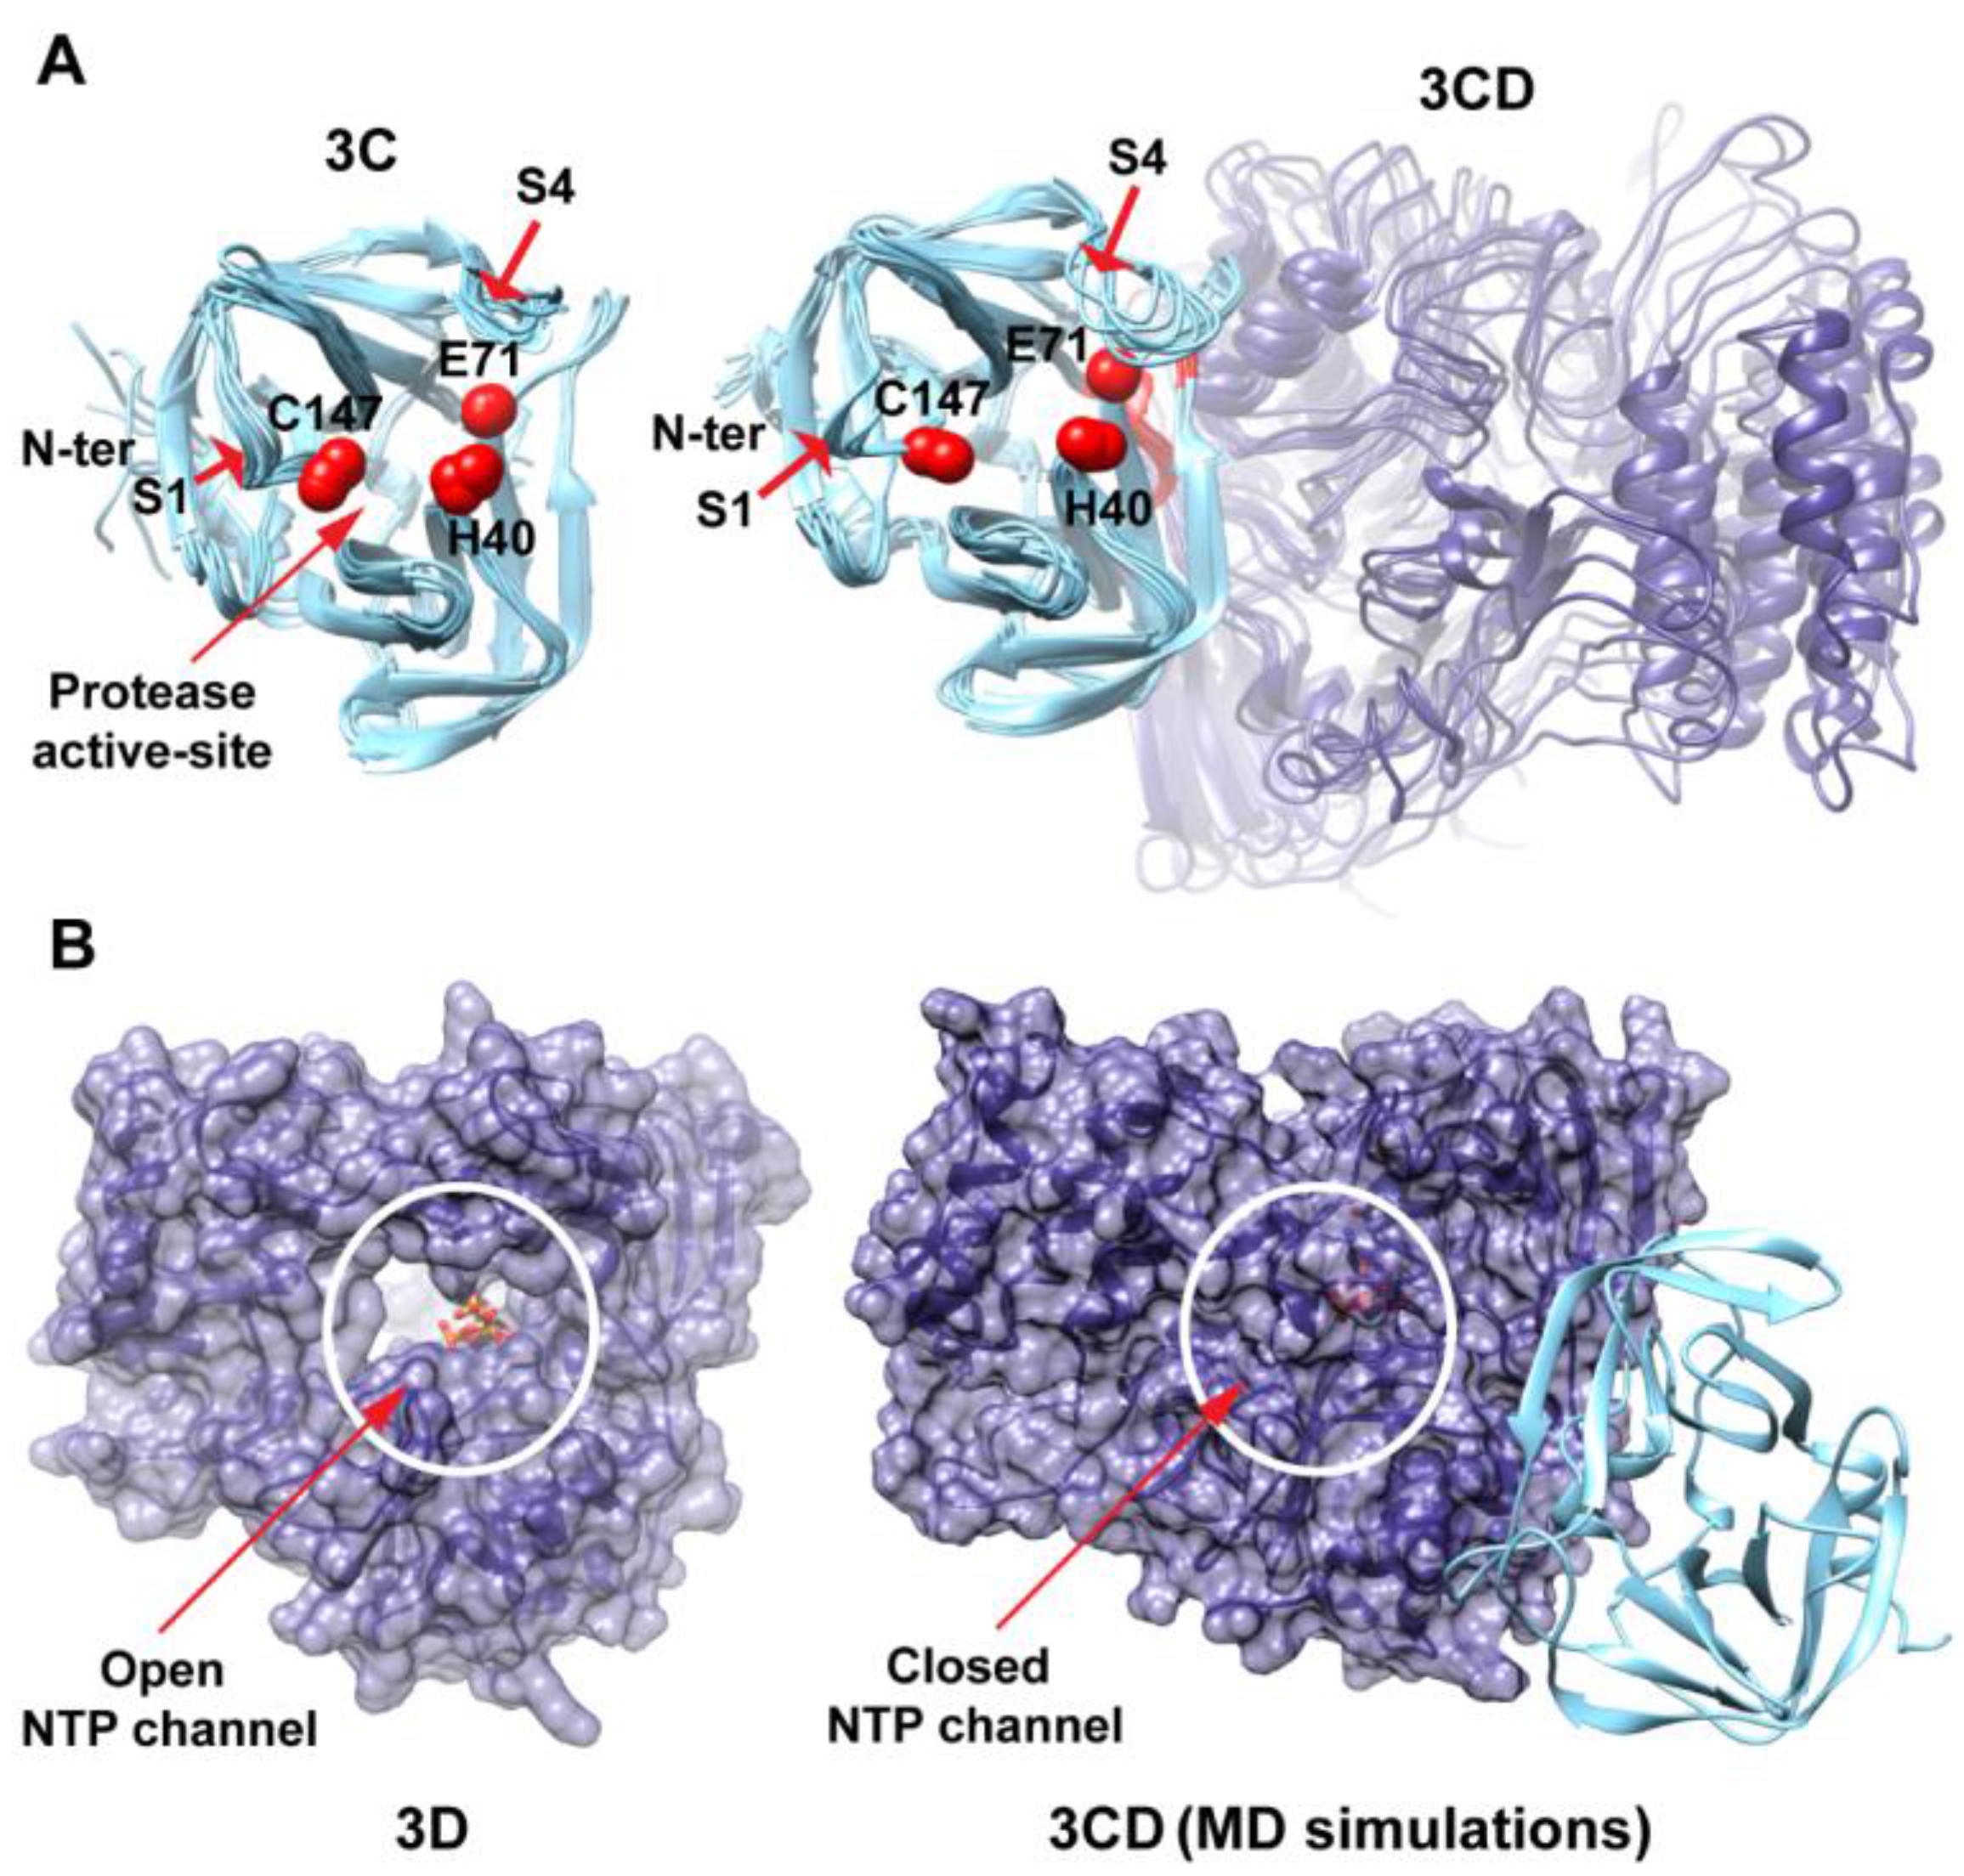
Figure 3B). The 3C-domain moved approaching the back of the 3D-domain, towards the NTP channel of the polymerase.
Figure 2.
Root-mean-square deviations (RMSD) analysis of the molecular dynamics simulation (MD) trajectory reveals large domain movements relative to crystal structure. The RMSD for the backbone atoms of the full-length 3CD (black), of the domains 3C (cyan) and 3D (blue) are plotted as a function of time. The RMSD calculated for 3C and 3D domains showed much lower values than that calculated for 3CD. The dramatic increase in RMSD values for the full-length 3CD during the first 10 ns of the simulations suggested a large domain motion of the precursor protein. Moreover, the lower RMSD values of 3C-domain compared to that of 3D-domain indicated less dynamics of 3C-domain compared to 3D-domain.
Figure 3.
MD simulations reveal interdomain interactions in 3CD. (A) The radius of gyration (Rg) of the full-length 3CD protein (black) and the individual domains 3C (cyan) and 3D (blue) are plotted as a function of time. The Rg of 3CD substantially decreased during the simulation, whereas the Rg of 3C-domain remained almost constant and the Rg of 3D-domain showed very small variation. The decrease in Rg values of 3CD reflects the development of the interactions between 3C and 3D domains during simulations. (B) Shown are the 3CD structure at the starting time of the simulation (t = 0) and the average structure calculated over the last 50 ns of the trajectory of monomer 1. The structures are rendered as surface, the 3C and 3D domains are colored cyan and blue, respectively. The active-site residues of the protease (His-40, Glu-71, Cys-147) and polymerase (Asp-416, Asp-511, Asp-512) are indicated by red color to show the relative orientation of the two domains. The starting 3CD structure adopts an extended conformation with no interdomain interactions in contrast to that observed in the simulated average structure.
![Viruses 07 02919 g003]()
To determine whether the arrangement of the 3C and 3D domains in the average MD structure corresponds to a single unique conformation or to multiple conformations sampled during simulations, we performed cluster analysis. The structural snapshots of the last 50 ns of the MD trajectory can be grouped into six clusters (1 to 6). Representative conformations of the clusters are shown in
Figure 4A. Superpositioning of conformations of the different clusters using backbone atoms of the 3D-domain revealed relatively large conformational changes for residues of the 3C-domain. Also, small conformational changes for residues of the thumb (aa 563–644) in the polymerase domain were noticed. Inspection of these different conformations showed that they are similar to the compact conformation of the average structure (
Figure 3B). Apparently, in all conformations, the same faces of the 3C and 3D domains are involved in interdomain interactions. Nevertheless, the details of these interactions vary from one conformation to another, suggesting a dynamic interface. Thus, a characteristic feature of the conformational changes observed in the simulations of 3CD is a large movement of the 3C-domain towards the 3D-domain with variations in the relative positions of the two domains. It is worthy to note that the collapsing of the two domains in 3CD structure to form a compact conformation occurred early during the first 10 ns of the simulation.
Figure 4.
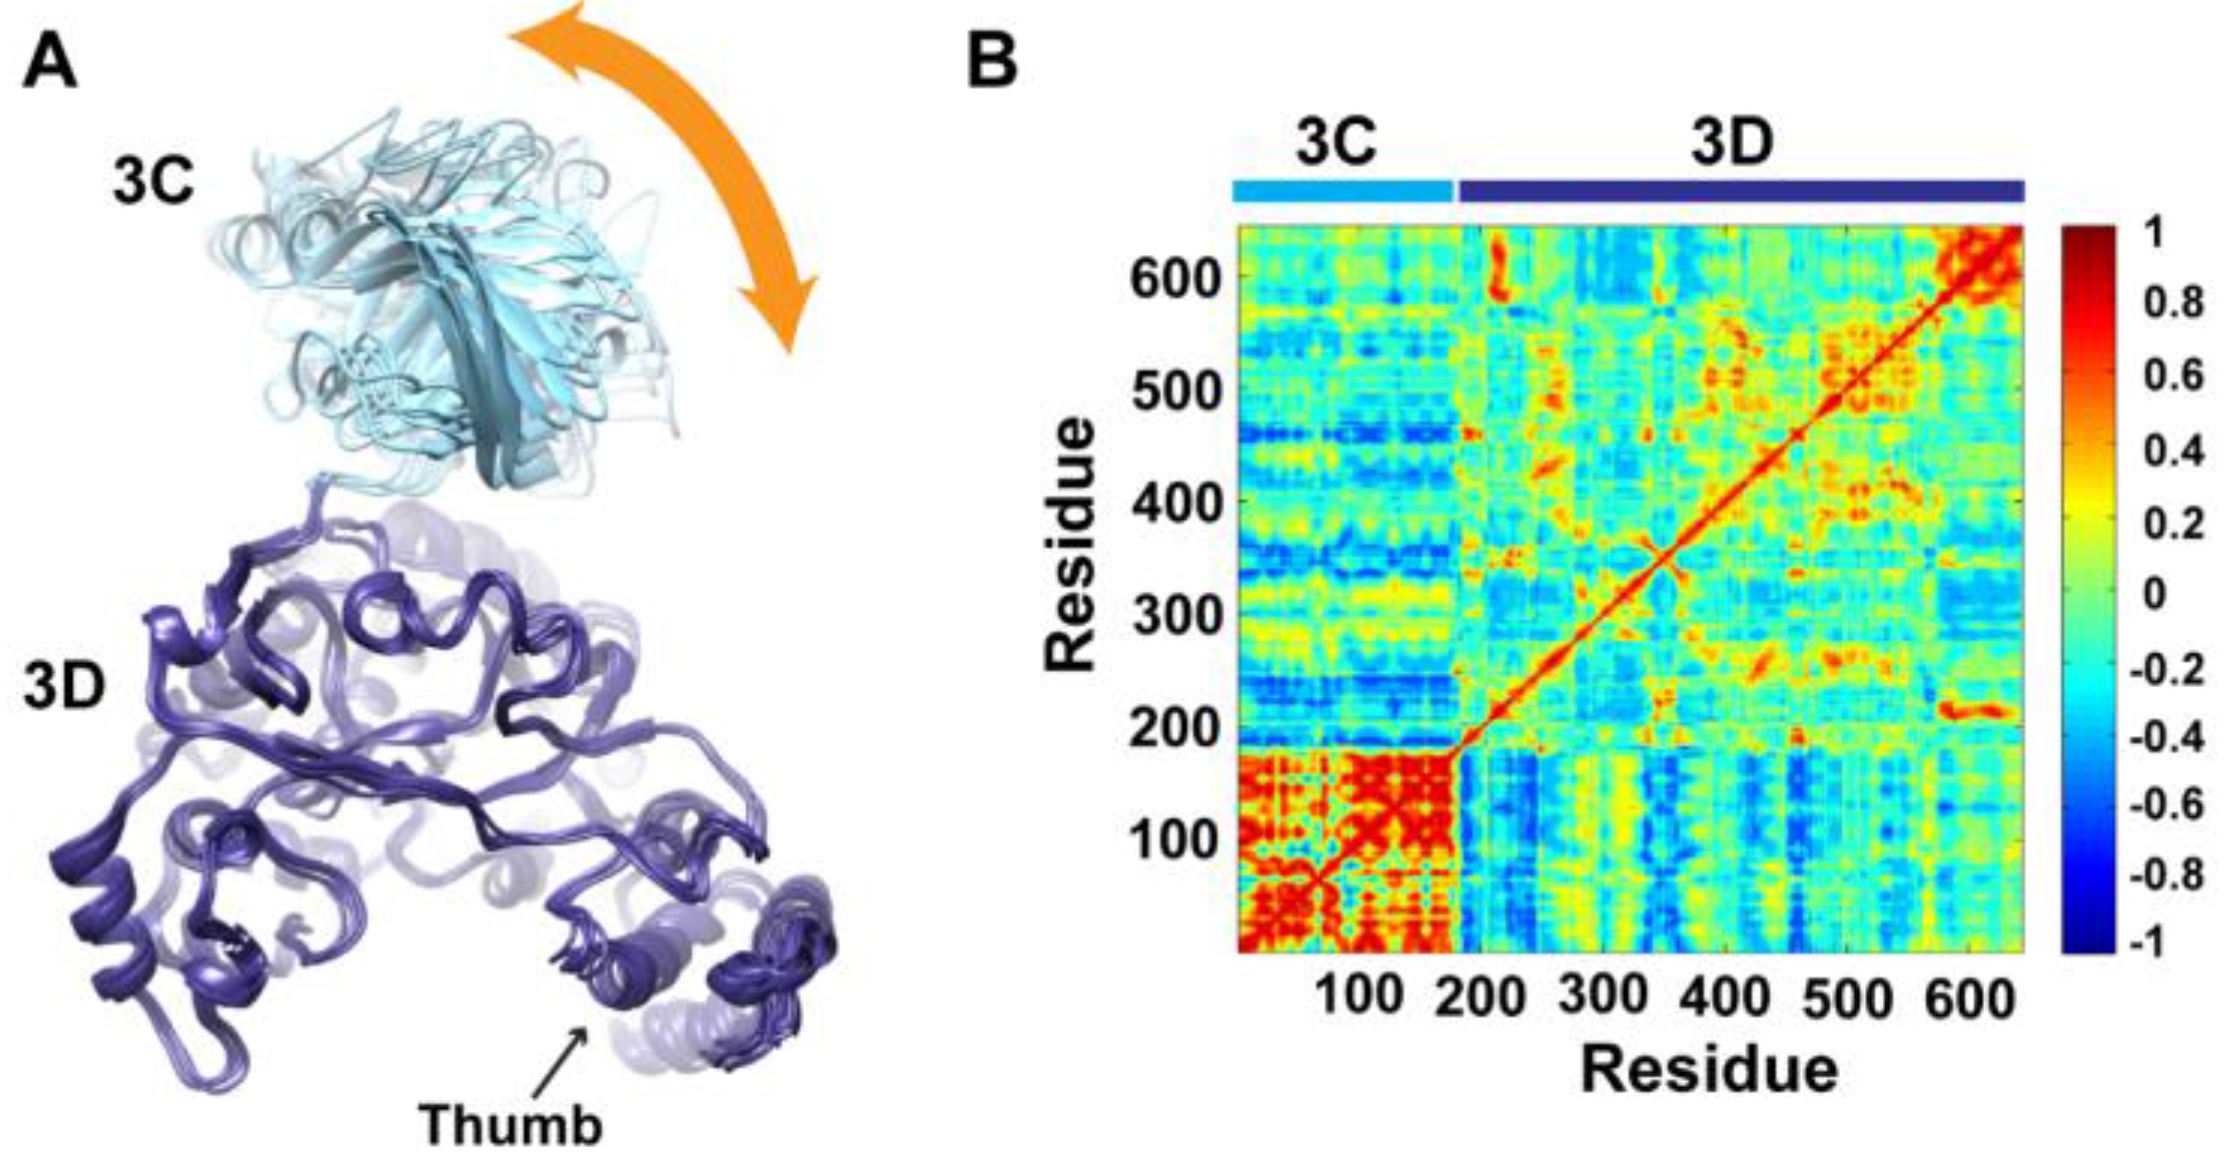
Conformational changes of 3CD during simulations. (A) Representative conformations of the clusters (1–6) sampled during the last 50 ns of wild-type (WT) 3CD simulation of monomer 1, superimposed using Cα atoms of 3D-domain. The positioning of 3C-domain (cyan) relative to 3D-domain (blue) varies among the different conformations, resulting in small variations at the interface between the two domains as indicated by the orange arrow. (B) Dynamic Cross-Correlation Map (DCCM) analysis of the last 50 ns, calculated for Cα atoms of all residues in 3CD. Residues of 3C-domain exhibited strong correlations, indicating rigid-body motion of the domain. Also, residues of the thumb (aa 563–644) in the 3D-domain showed strong correlations; which is consistent with the slightly larger deviations observed for the thumb residues shown in (A).
Figure 4.
Conformational changes of 3CD during simulations. (A) Representative conformations of the clusters (1–6) sampled during the last 50 ns of wild-type (WT) 3CD simulation of monomer 1, superimposed using Cα atoms of 3D-domain. The positioning of 3C-domain (cyan) relative to 3D-domain (blue) varies among the different conformations, resulting in small variations at the interface between the two domains as indicated by the orange arrow. (B) Dynamic Cross-Correlation Map (DCCM) analysis of the last 50 ns, calculated for Cα atoms of all residues in 3CD. Residues of 3C-domain exhibited strong correlations, indicating rigid-body motion of the domain. Also, residues of the thumb (aa 563–644) in the 3D-domain showed strong correlations; which is consistent with the slightly larger deviations observed for the thumb residues shown in (A).
To obtain information on the nature of motions of the two domains in 3CD and their correlations, we analyzed the correlations among positional fluctuations of C
atoms in the simulated structure, or what is known as dynamic cross-correlation map (DCCM). In this analysis, residues that move in the same direction appear positively correlated whereas residues moving in opposite directions appear negatively correlated.
Figure 4B shows the calculated DCCM for residues of 3CD using the last 50 ns of the MD trajectory. The residues of the 3C-domain exhibited strong intradomain positive correlations (red color in the calculated map), which can be interpreted as an indication of a collective movement of the whole domain. Also, the thumb residues (aa 563–644) of the polymerase domain showed strong positive correlations with each other, suggesting their collective movement as well. These collective movements of the thumb residues and 3C-domain are in agreement with the conformational changes observed by cluster analysis (
Figure 4A).
Of note, the intradomain correlations of 3D-domain differ significantly from the correlations reported previously in the MD simulation study of the cleaved polymerase [
29] and protease [
51]. The characteristic negative correlations of residues surrounding the template-nascent RNA duplex channel, the template channel and the NTP channel in the 3D
pol, which indicated the expansion and contraction of these channels of the polymerase, are lacking in the 3D-domain of the precursor protein; additionally, the positive correlations among the functional motifs in the palm and fingers subdomains are less pronounced in the precursor protein compared to the mature polymerase. Inspecting the interdomain correlations revealed that residues of the 3C-domain were negatively correlated (blue color in the map) with regions of the fingers and palm of the 3D-domain encompassing residues 186–190, 238–246, 360–370, and 423–434. These regions of the 3D-domain appeared to be on the same side or near the interface with the 3C-domain. The negative correlations suggest that they move in a direction opposite to that of the 3C-domain movement. Thus, from DCCM analysis it can be concluded that the 3C-domain moves as a whole unit, or what is called “rigid-body” motion, towards a unique face of the 3D-domain. Further analysis of the MD trajectory using principal component analysis (PCA), which filters the noise from major motions in MD simulations as described in our previous study [
29], revealed that the rigid-body movement of 3C-domain towards the polymerase domain is the major motion observed during simulations (
Figure S2).
Figure 5.
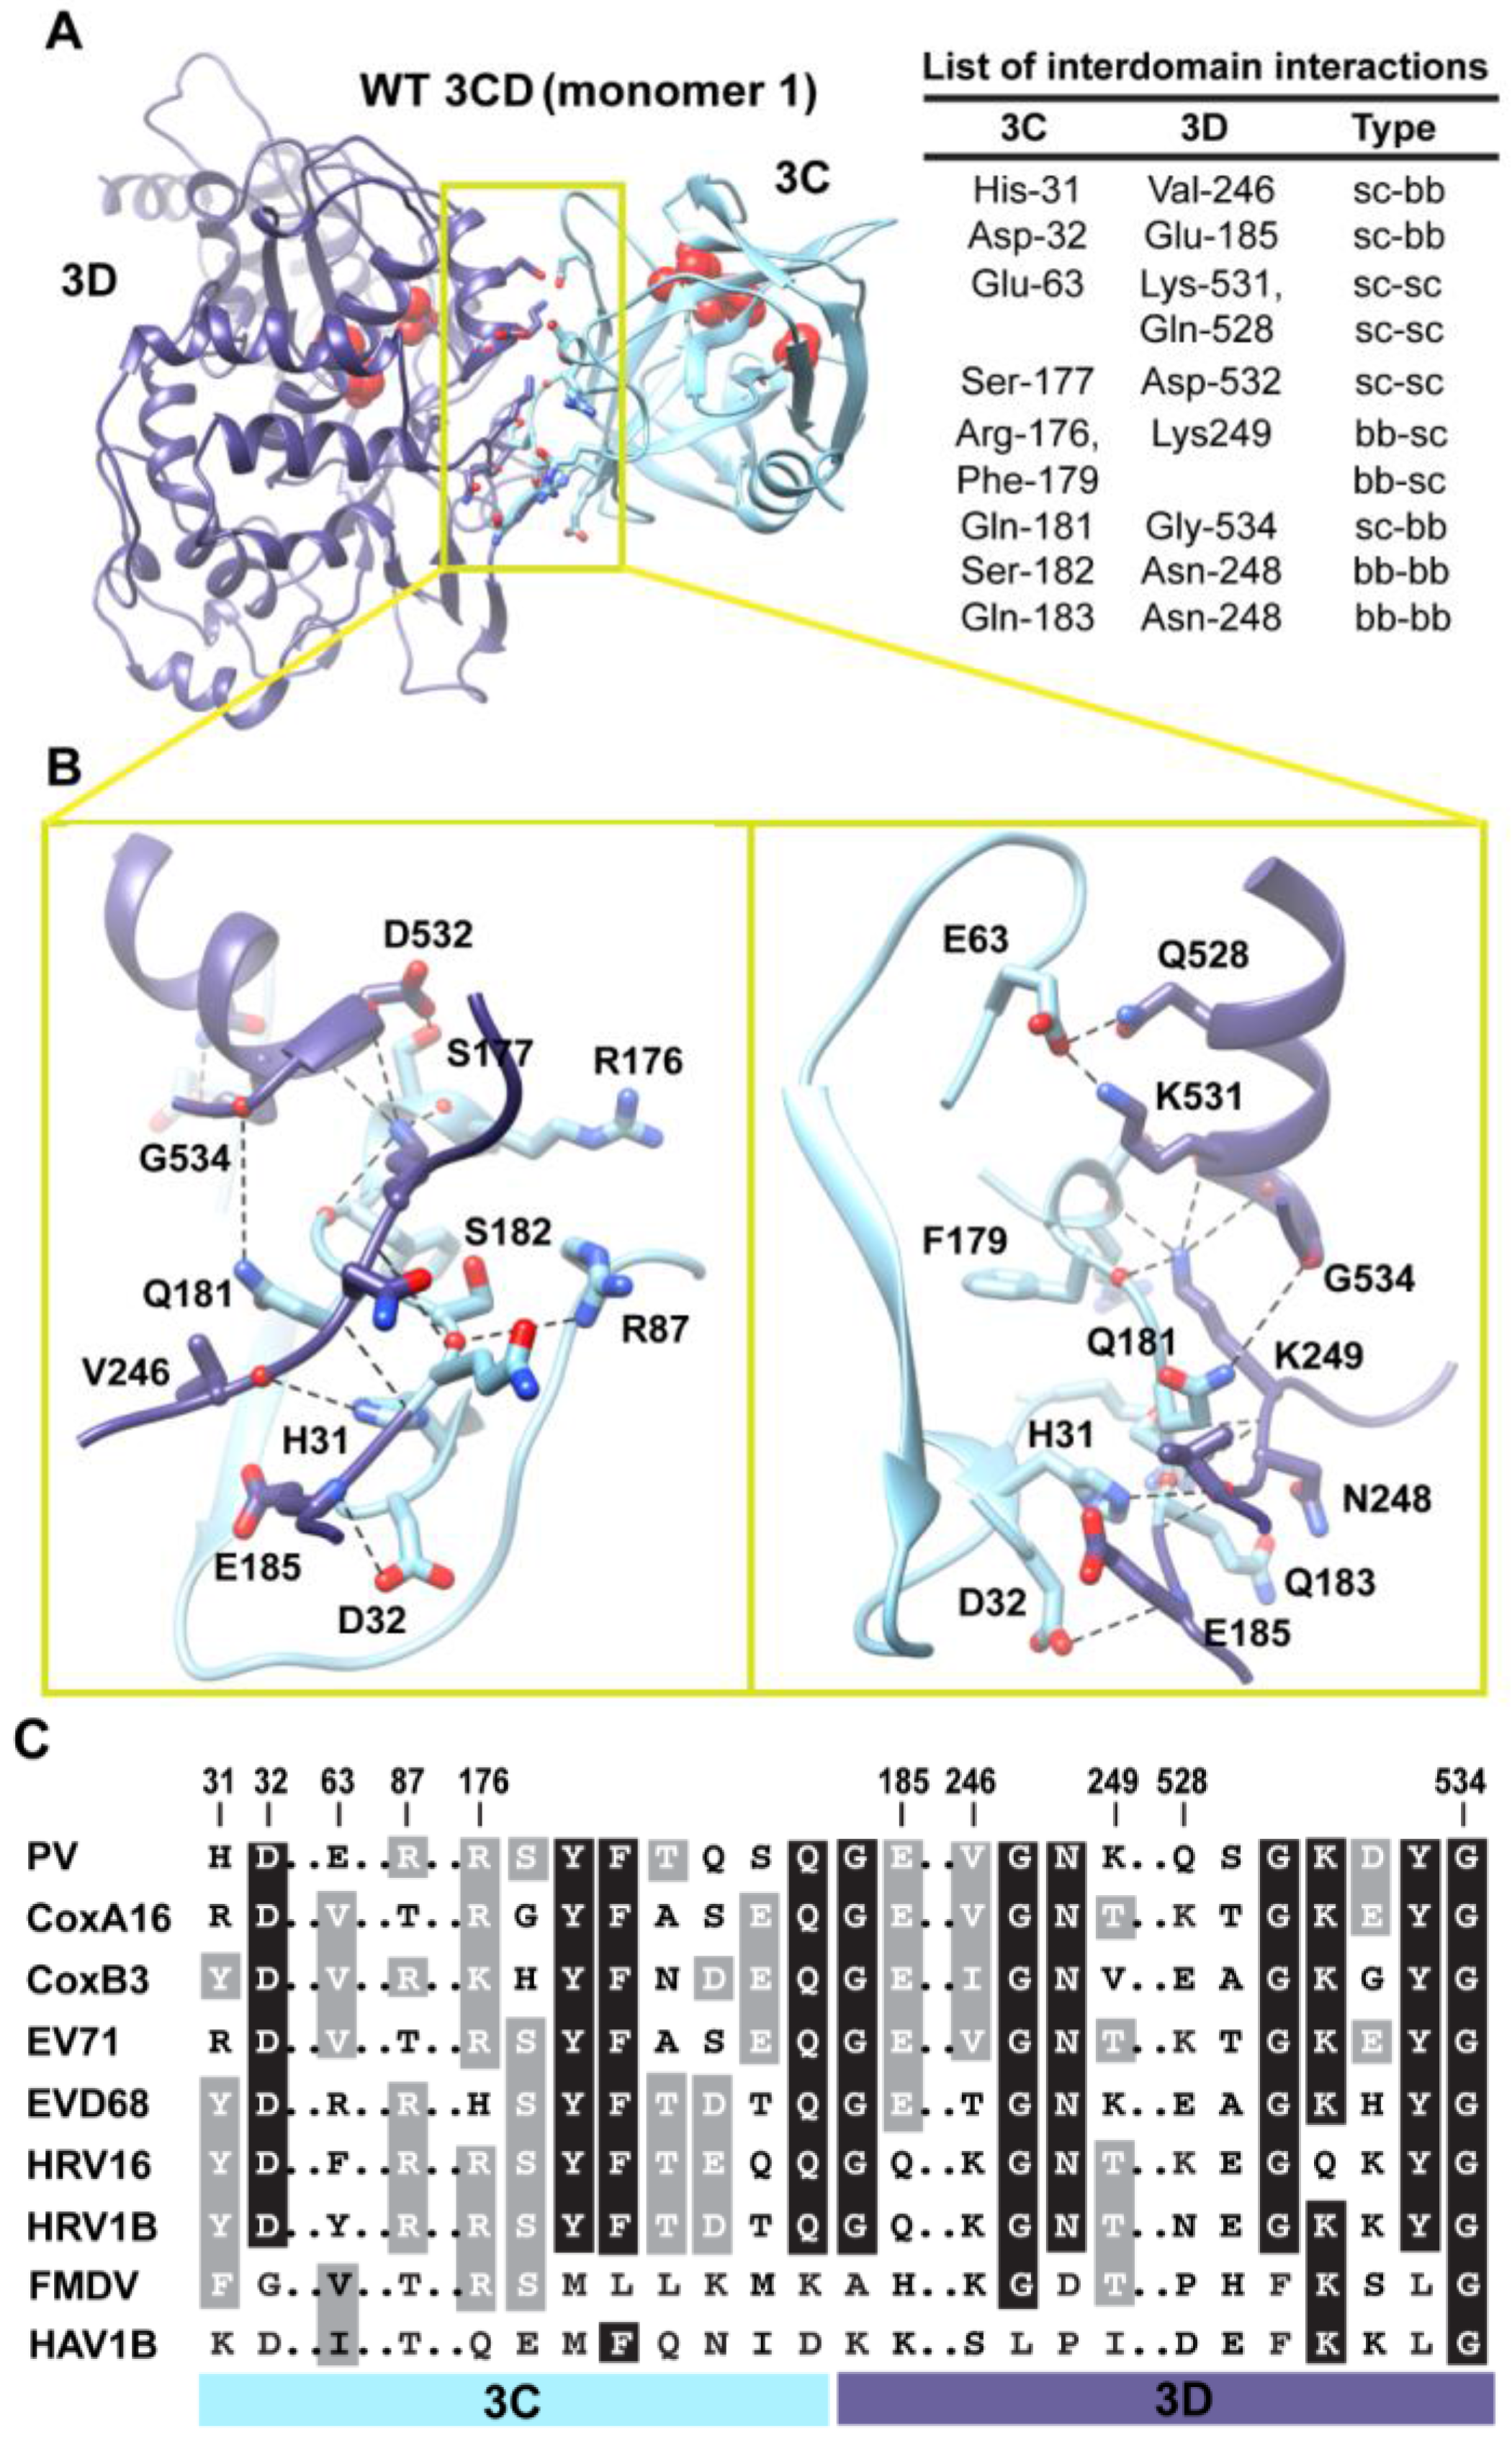
Interactions between 3C and 3D domains in the compact conformation of 3CD (monomer 1). (A) Shown is the simulated WT 3CD with interface residues displayed as sticks; the 3C and 3D domains are colored cyan and blue, respectively. The active-site residues of the protease (His-40, Glu-71, Cys-147) and polymerase (Asp-416, Asp-511, Asp-512) are shown as red spheres to help identifying the relative orientation of the two domains. The list of interdomain interactions is shown at the right of the panel; three types of interactions are indicated (sidechain-sidechain, sc-sc; sidechain-backbone, sc-bb/bb-sc; backbone-backbone, bb-bb). (B) Two close-up views of the interface marked by the yellow box in (A). Interacting residues are shown as sticks and their C-atoms are colored according to the corresponding domains. Interface residues are engaged in many H-bonding interactions and salt bridges, depicted as black dashed-lines. (C) Shown is part of the sequence alignment of 3CD proteins from picornaviruses, including poliovirus (PV), coxsackievirus A16 (CoxA16), coxsackievirus B3 (CoxB3), enterovirus 71 (EV71), enterovirus D68 (EVD68), human rhinovirus 16 (HRV16), human rhinovirus 1B (HRV1B), foot-and-mouth disease virus (FMDV), and hepatitis A virus 1B (HAV1B). The residues shown in the alignment are those involved in the interdomain interactions: 31–32, 63, 87, 176–185, 246–249, and 528–534. Many of the interface residues are highly conserved.
Figure 5.
Interactions between 3C and 3D domains in the compact conformation of 3CD (monomer 1). (A) Shown is the simulated WT 3CD with interface residues displayed as sticks; the 3C and 3D domains are colored cyan and blue, respectively. The active-site residues of the protease (His-40, Glu-71, Cys-147) and polymerase (Asp-416, Asp-511, Asp-512) are shown as red spheres to help identifying the relative orientation of the two domains. The list of interdomain interactions is shown at the right of the panel; three types of interactions are indicated (sidechain-sidechain, sc-sc; sidechain-backbone, sc-bb/bb-sc; backbone-backbone, bb-bb). (B) Two close-up views of the interface marked by the yellow box in (A). Interacting residues are shown as sticks and their C-atoms are colored according to the corresponding domains. Interface residues are engaged in many H-bonding interactions and salt bridges, depicted as black dashed-lines. (C) Shown is part of the sequence alignment of 3CD proteins from picornaviruses, including poliovirus (PV), coxsackievirus A16 (CoxA16), coxsackievirus B3 (CoxB3), enterovirus 71 (EV71), enterovirus D68 (EVD68), human rhinovirus 16 (HRV16), human rhinovirus 1B (HRV1B), foot-and-mouth disease virus (FMDV), and hepatitis A virus 1B (HAV1B). The residues shown in the alignment are those involved in the interdomain interactions: 31–32, 63, 87, 176–185, 246–249, and 528–534. Many of the interface residues are highly conserved.
![Viruses 07 02919 g005]()
3.2. Interface Residues and Stability of the Interdomain Interactions
Next, we analyzed the conformations visited during simulations of the WT 3CD to obtain information on residues involved in the interdomain interactions. The 3C and 3D domains bury
500 Å
2 of surface area between them. Residues mediating the interactions between the two domains are shown and listed in
Figure 5A,B. The interface is formed by amino acids from the 3C-domain (residues 31, 32 and 63), the linker (residues 176–185), and from the 3D-domain (residues 246–248 of the fingers subdomain and residues 528–534 of motif D in the palm subdomain of the polymerase). The contact surface between the two domains involves electrostatic and weak hydrogen bonding interactions made by backbone and sidechain atoms. The linker region is sandwiched between the two domains to form an intricate network of interactions. The sidechain of Ser-177 forms a hydrogen bond with that of Asp-532. The carbonyl oxygen atoms of four residues, two from each domain, including Arg-176, Phe-179, Asp-532 and Tyr-533, form an oxyanion hole that accommodates the positively charged sidechain of Lys-249. The sidechain of Gln-181 is engaged in hydrogen bonding interaction with the backbone of Gly-534. The backbone atoms of Ser-182 mediate hydrogen bonding interactions with both backbone and sidechain atoms of Asn-248 and Arg-87, respectively. The backbone atoms of Asn-248 in turn are hydrogen bonded to the backbone atoms of Gln-183. The backbone nitrogen atom of Glu-185 forms a hydrogen bond with the sidechain of Asp-32. The residue preceding Asp-32, His-31, mediates a hydrogen bonding interaction between its sidechain and the carbonyl oxygen atom of Val-246. Finally, Glu-63 forms a salt bridge with Lys-531 and a hydrogen bond with the sidechain of Gln-528.
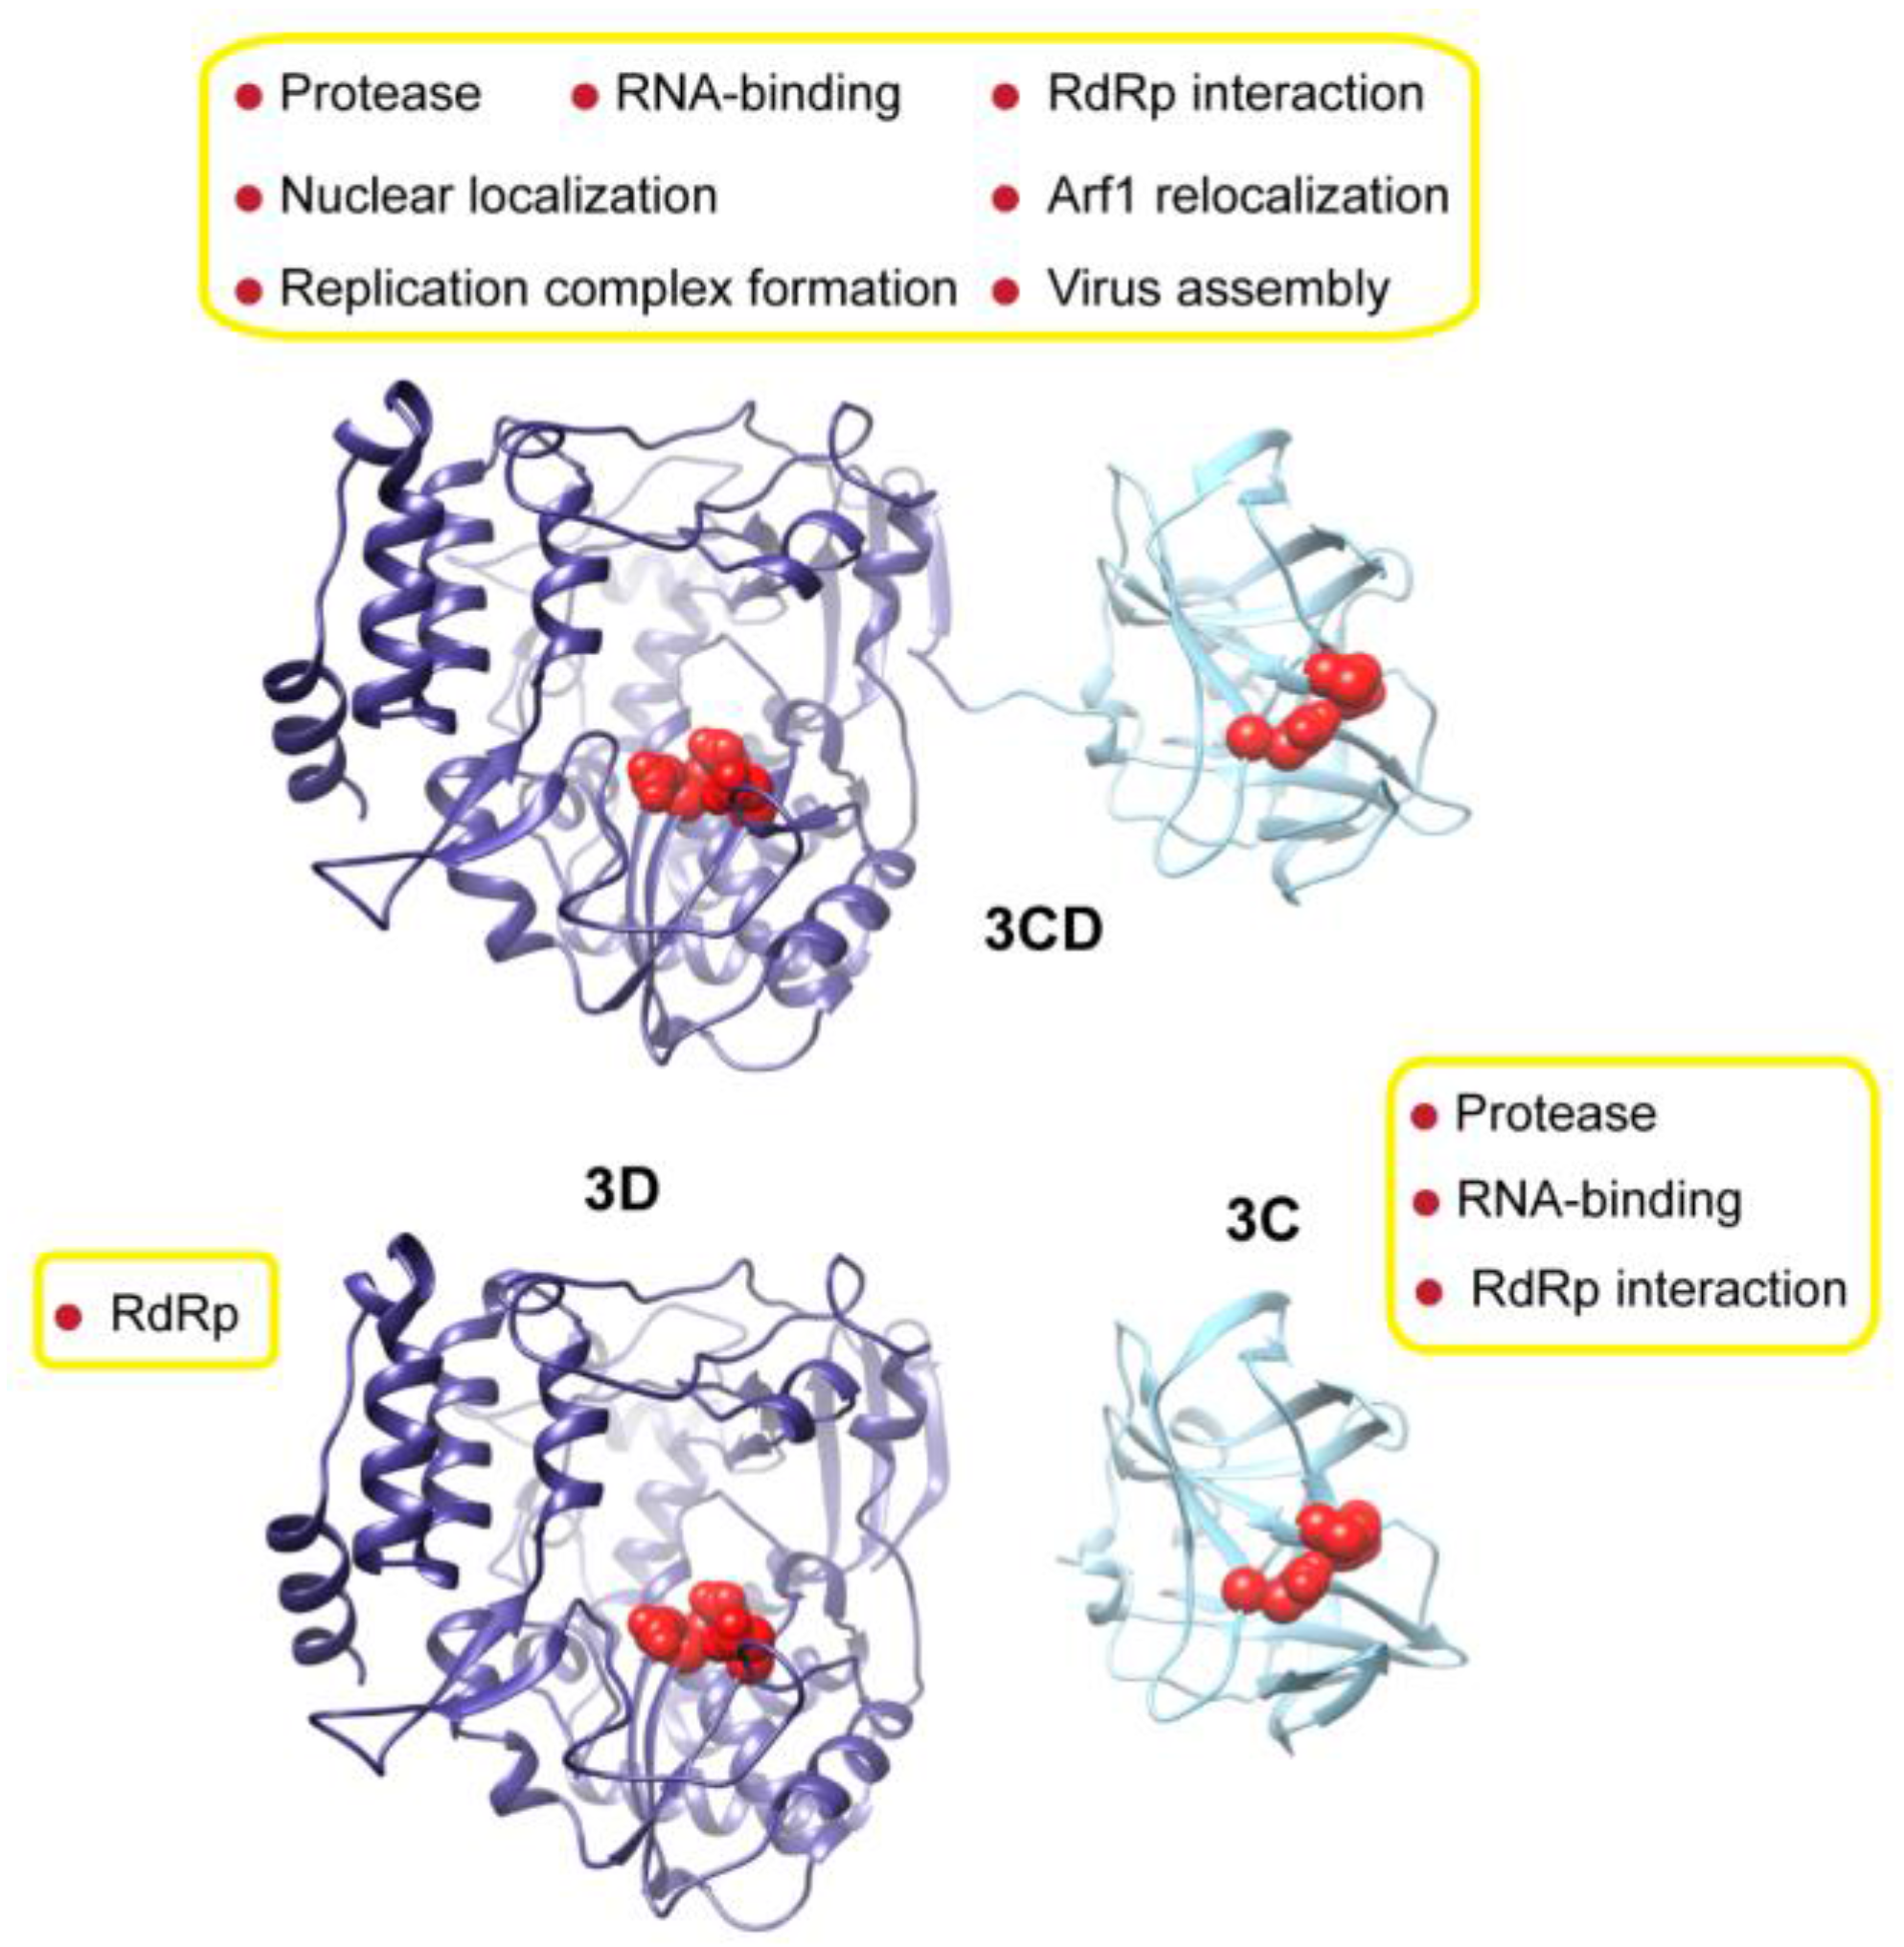
Interestingly, many of the residues at the interface are linked to functions. In the 3C-domain, His-31, Asp-32, Glu-63 and Arg-87 have been shown by NMR to be involved in RNA-binding by 3C [
16,
51]. Mutations of His-31 and Asp-32 in 3C impair the RNA recognition activity [
17]. The residue Arg-176 is also known to be implicated in RNA recognition [
24]. In addition, Arg-176 and Phe-179 are involved in peptide binding [
51]. In the 3D-domain, Lys-249 (Lys-66 in PV RdRp numbering) is nearby Lys-61 of 3D that was previously shown to be critical for polymerase function [
52]. Residues 528–534 correspond to motif D of the polymerase that is also known to be critical for polymerase function [
53,
54]. Therefore, the interactions between the two domains could be linked to the functional differences between the precursor protein 3CD and its cleaved products.
When we evaluated whether the interdomain interactions in PV 3CD exist in the related 3CD proteins from other picornaviruses (
Figure 5C), we found that many of these interactions are conserved but some are not. Interactions in PV 3CD that involve backbone atoms and sidechains of residues at positions 31, 32, 87,177, 181, 249 and 532 are likely to exist in the related proteins; residues at these positions are either conserved or substituted by residues capable of making similar interactions. However, interactions mediated by Glu-63 are predicted to be unique for the poliovirus protein. Our interpretation of this observation is that picornaviral 3CD proteins likely adopt compact conformations in which the two domains interact with each other.
After examining the interface between 3C and 3D domains in the simulated WT 3CD and showing that the contact surface between the two domains involves many interactions, we evaluated the stability of the interdomain interactions in the compact conformation relative to the extended conformation seen in crystal structure. To do so, we carried out the free energy calculations using SIETRAJ as described in the Experimental section 2.1. The relative free energy (
G) of 3C-3D interactions were calculated for the different conformations visited during simulations; see
Table 1. The compact conformations with 3C-3D interdomain interactions were found to be more stable than the extended conformation with non-interacting domains by an average of −7.4
0.89 kcal/mol. Considering the number of interactions between the two domains described above, the estimated stabilization energy seemed reasonable.
Table 1.
Relative free energy of interdomain interactions in WT 3CD.
Table 1.
Relative free energy of interdomain interactions in WT 3CD.
| Conformation | ΔΔG a (kcal/mol) |
|---|
| Crystal structure b | 0 |
| Cluster 1 | −7.73 ± 0.89 |
| Cluster 2 | −8.55 ± 0.98 |
| Cluster 3 | −6.81 ± 0.85 |
| Cluster 4 | −6.25 ± 0.74 |
| Cluster 5 | −8.26 ± 0.90 |
| Cluster 6 | −6.84 ± 0.98 |
| average | −7.41 ± 0.89 |
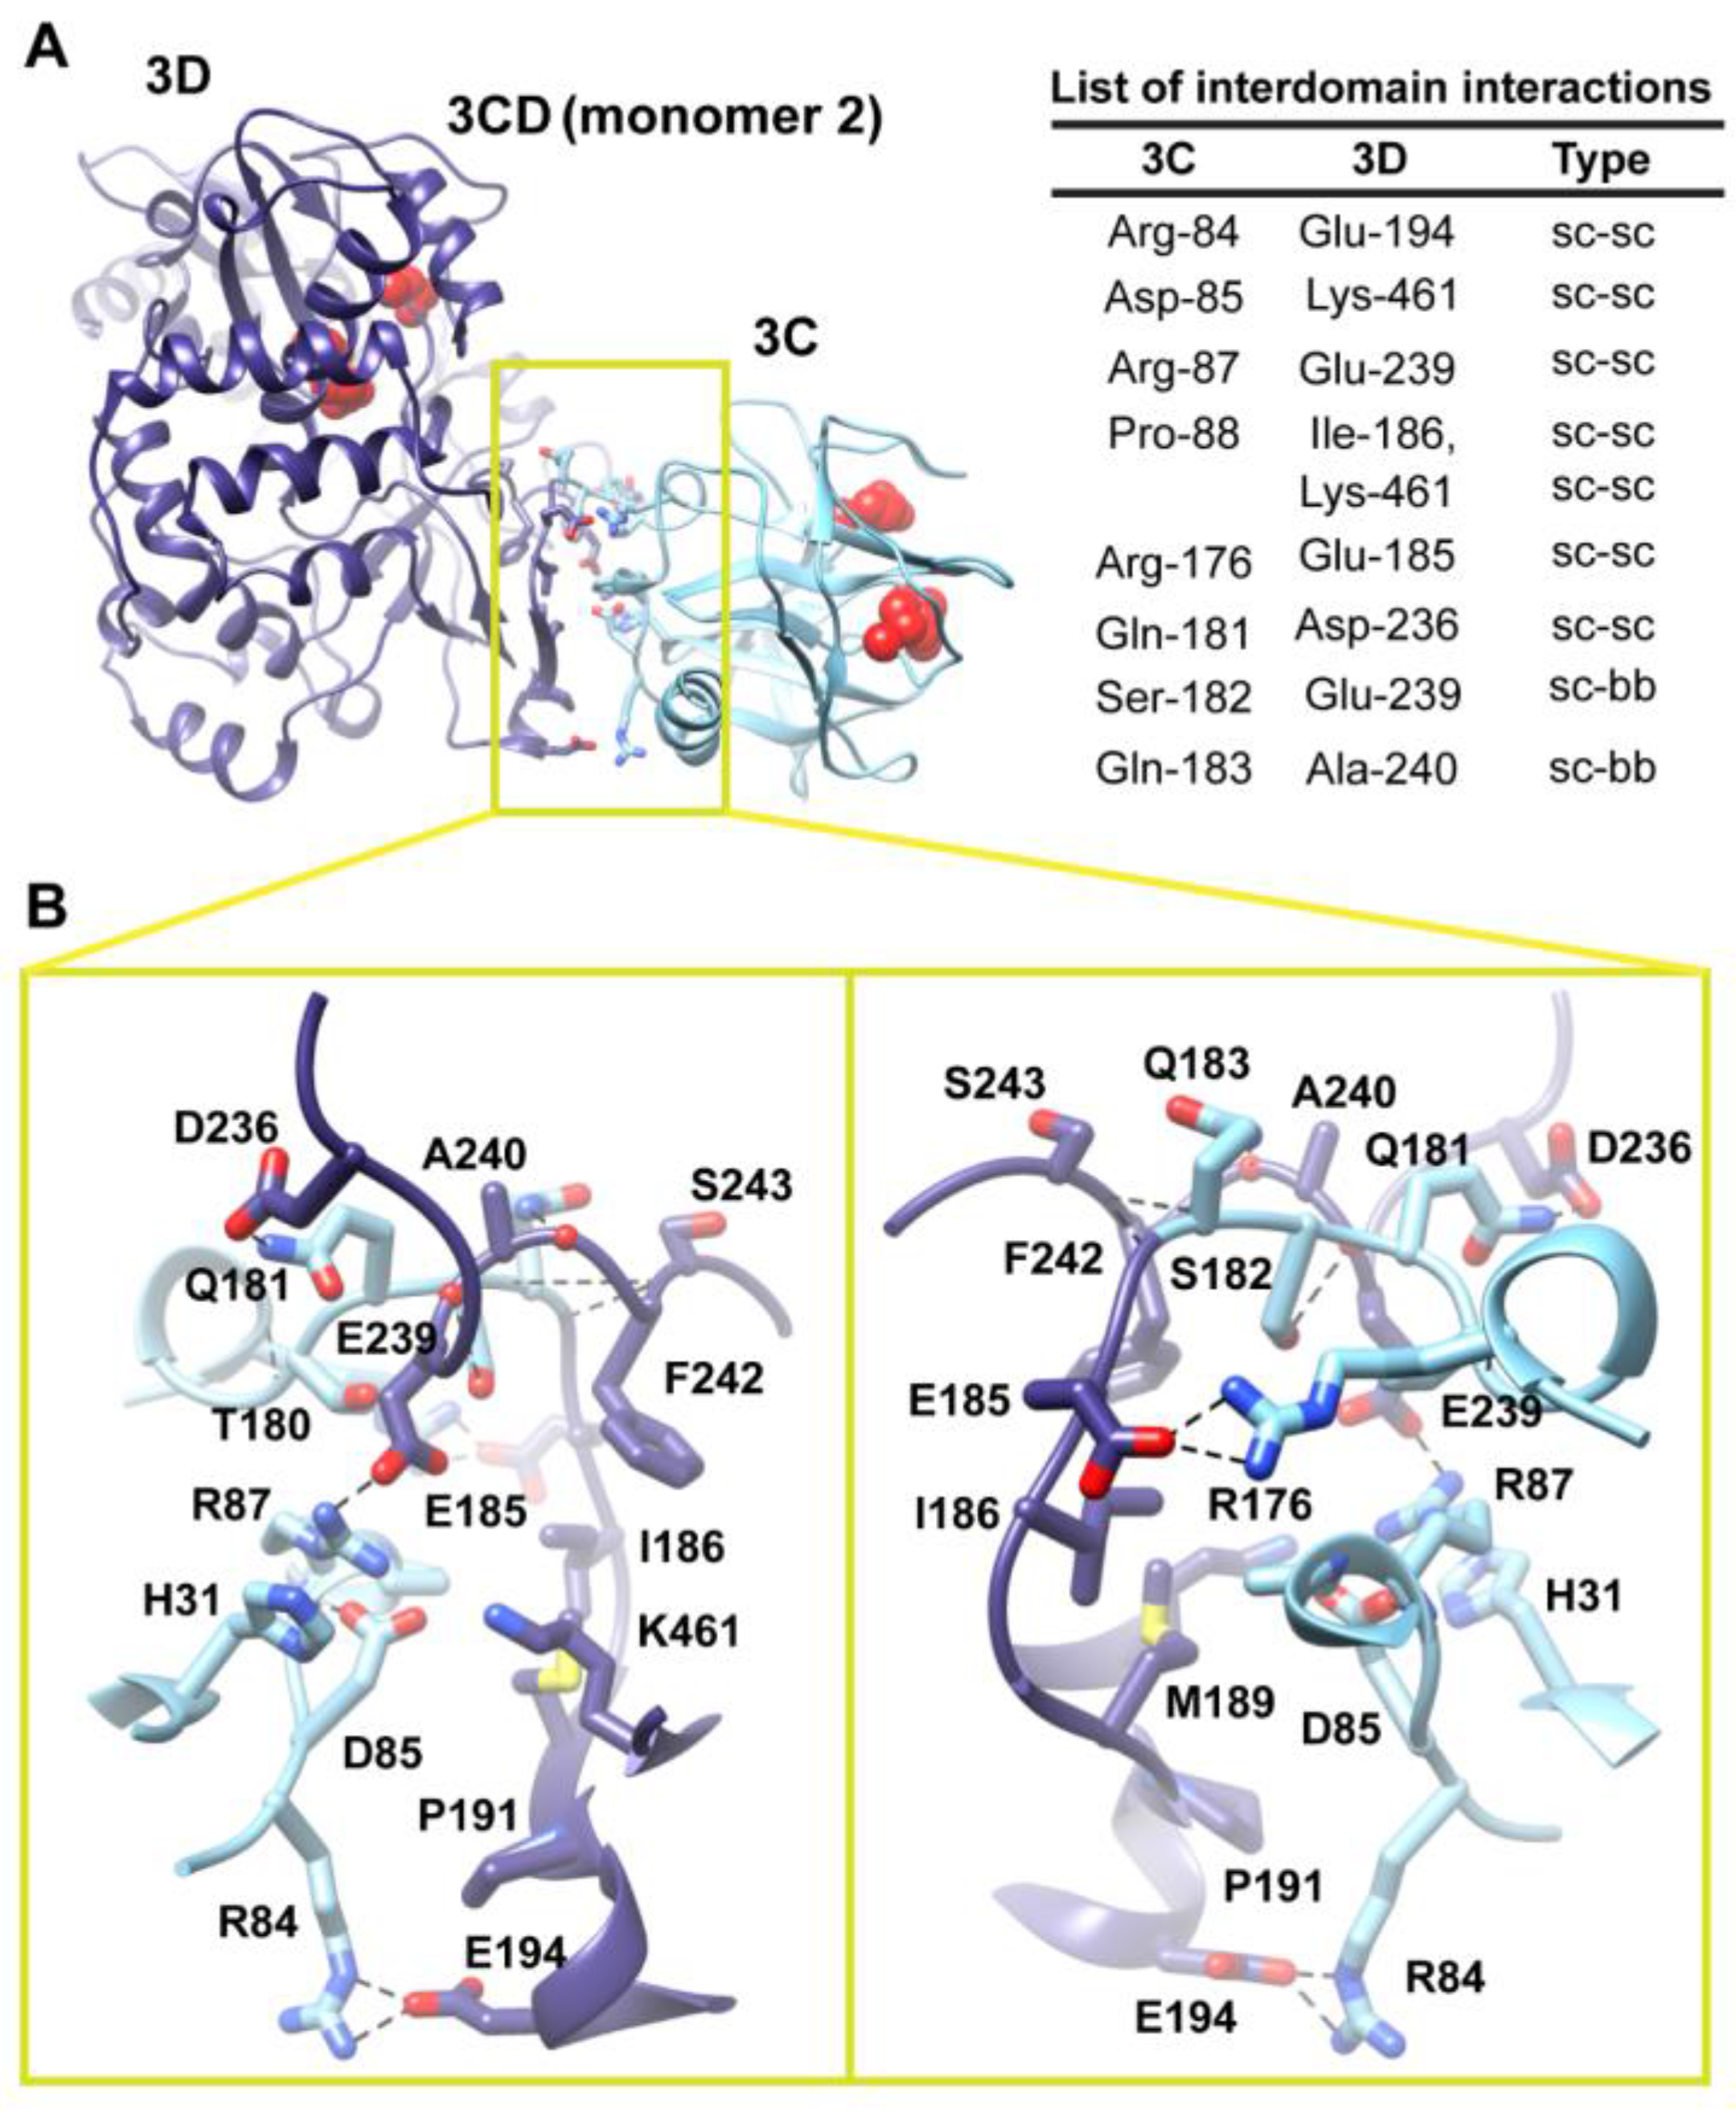
Figure 6.
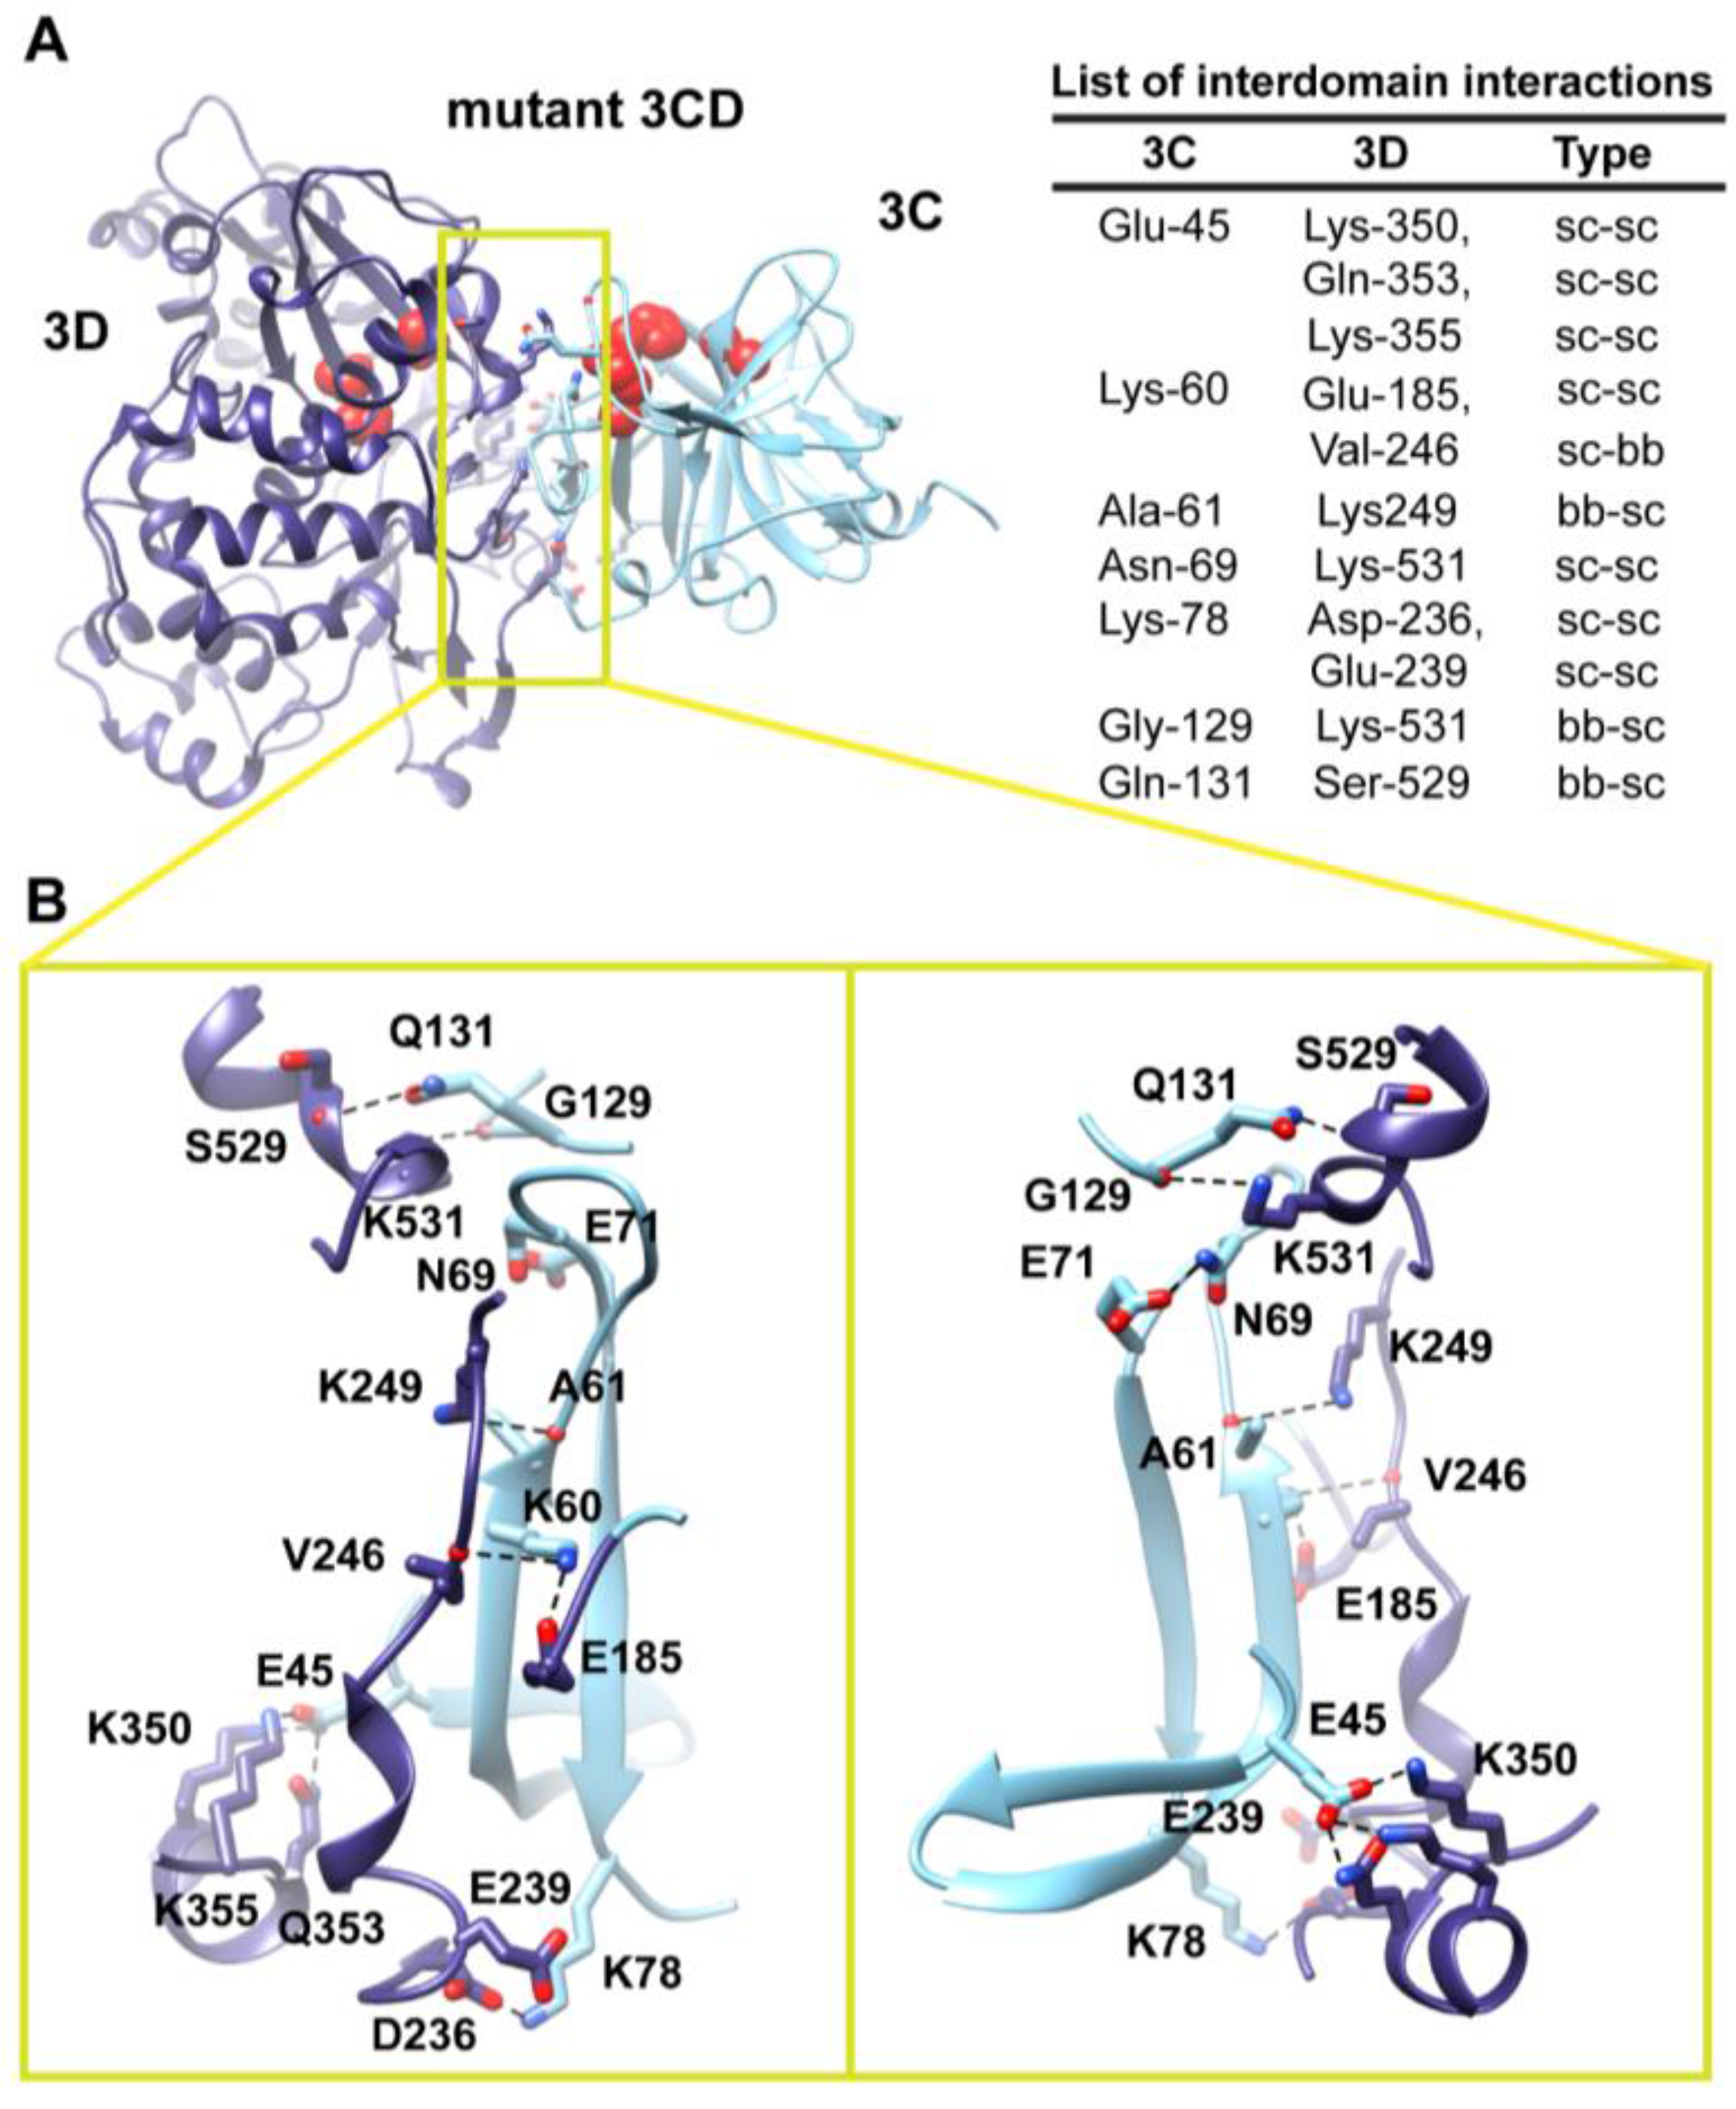
Interface in the compact conformation of 3CD (monomer 2). (
A) The simulated 3CD is shown with interface residues displayed as sticks; the 3C and 3D domains are colored cyan and blue; respectively. The active-site residues of the protease (His-40, Glu-71, Cys-147) and polymerase (Asp-416, Asp-511, Asp-512) are shown as red spheres to help identifying the relative orientation of the two domains. Interdomain interactions are listed at the right of the panel; two types of interactions are indicated (sidechain-sidechain, sc-sc; sidechain-backbone, sc-bb). (
B) Two close-up views of the interface marked by the yellow box in (
A). Interacting residues are shown as sticks and their C-atoms are colored according to the corresponding domains. Interface residues are engaged in many H-bonding (black dashed-lines), hydrophobic and electrostatic interactions. The contact surface between the two domains in the mutant 3CD is distinct from that of monomer 1 shown in
Figure 5.
Figure 6.
Interface in the compact conformation of 3CD (monomer 2). (
A) The simulated 3CD is shown with interface residues displayed as sticks; the 3C and 3D domains are colored cyan and blue; respectively. The active-site residues of the protease (His-40, Glu-71, Cys-147) and polymerase (Asp-416, Asp-511, Asp-512) are shown as red spheres to help identifying the relative orientation of the two domains. Interdomain interactions are listed at the right of the panel; two types of interactions are indicated (sidechain-sidechain, sc-sc; sidechain-backbone, sc-bb). (
B) Two close-up views of the interface marked by the yellow box in (
A). Interacting residues are shown as sticks and their C-atoms are colored according to the corresponding domains. Interface residues are engaged in many H-bonding (black dashed-lines), hydrophobic and electrostatic interactions. The contact surface between the two domains in the mutant 3CD is distinct from that of monomer 1 shown in
Figure 5.
Two monomers were present in the 3CD crystal structure with slightly different conformations of the linker. In order to assess the impact of starting conformation on the outcome of the simulation, we performed a second simulation using monomer 2. Similar to monomer 1 simulation, analysis of the MD trajectory revealed a 3CD molecule forming a compact conformation with a surface area of
460 Å
2 buried between 3C and 3D domains. Interestingly, a new interface in monomer 2 was revealed and appeared to be different from that observed in monomer 1. The 3C-domain moved ~20 Å and rotated ~60° relative to the conformation observed for monomer 1, now reaching the upper part of the fingers in the 3D-domain (
Figure S3A,B). The new interface is formed by the loop residues Arg-84, Asp-85, Arg-87 and Pro-88 projected from 3C-domain that interact with residues Ile-186, Glu-194, Glu-239 and Lys-461 from the fingers of 3D-domain (
Figure 6). The interface residues from 3D-domain, in turn, interact with residues Arg-176, Gln-181, Ser-182 and Gln-183 at the C-terminus of the 3C-domain. Examination of the interface residues showed that residues at positions 84, 85, 87 and 186 are completely conserved in the related picornaviral proteins; the remaining residues showed a high level of conservation. The site of the 3D-domain contributing to the interface in monomer 2 is adjacent and non-overlapping to that presented in monomer 1. Also, the loop residues 84–88, which are known to play a role in RNA binding [
16] in 3C-domain, are adjacent to the 31–32 site that is part of the interface in monomer 1 (
Figure 5). The linker residues 176–183 contribute to the contact surfaces in the two monomers. The interfaces in the two monomers are predominately formed by electrostatic and hydrogen bonding interactions. Nevertheless, in monomer 2 there is a hydrophobic contribution to the interface from the interaction between Pro-88 from 3C-domain and Ile-186 from 3D-domain (
Figure 6). Thus, it can be argued that 3CD is capable of assuming different compact conformations that could serve distinct functions at different stages of the viral lifecycle.
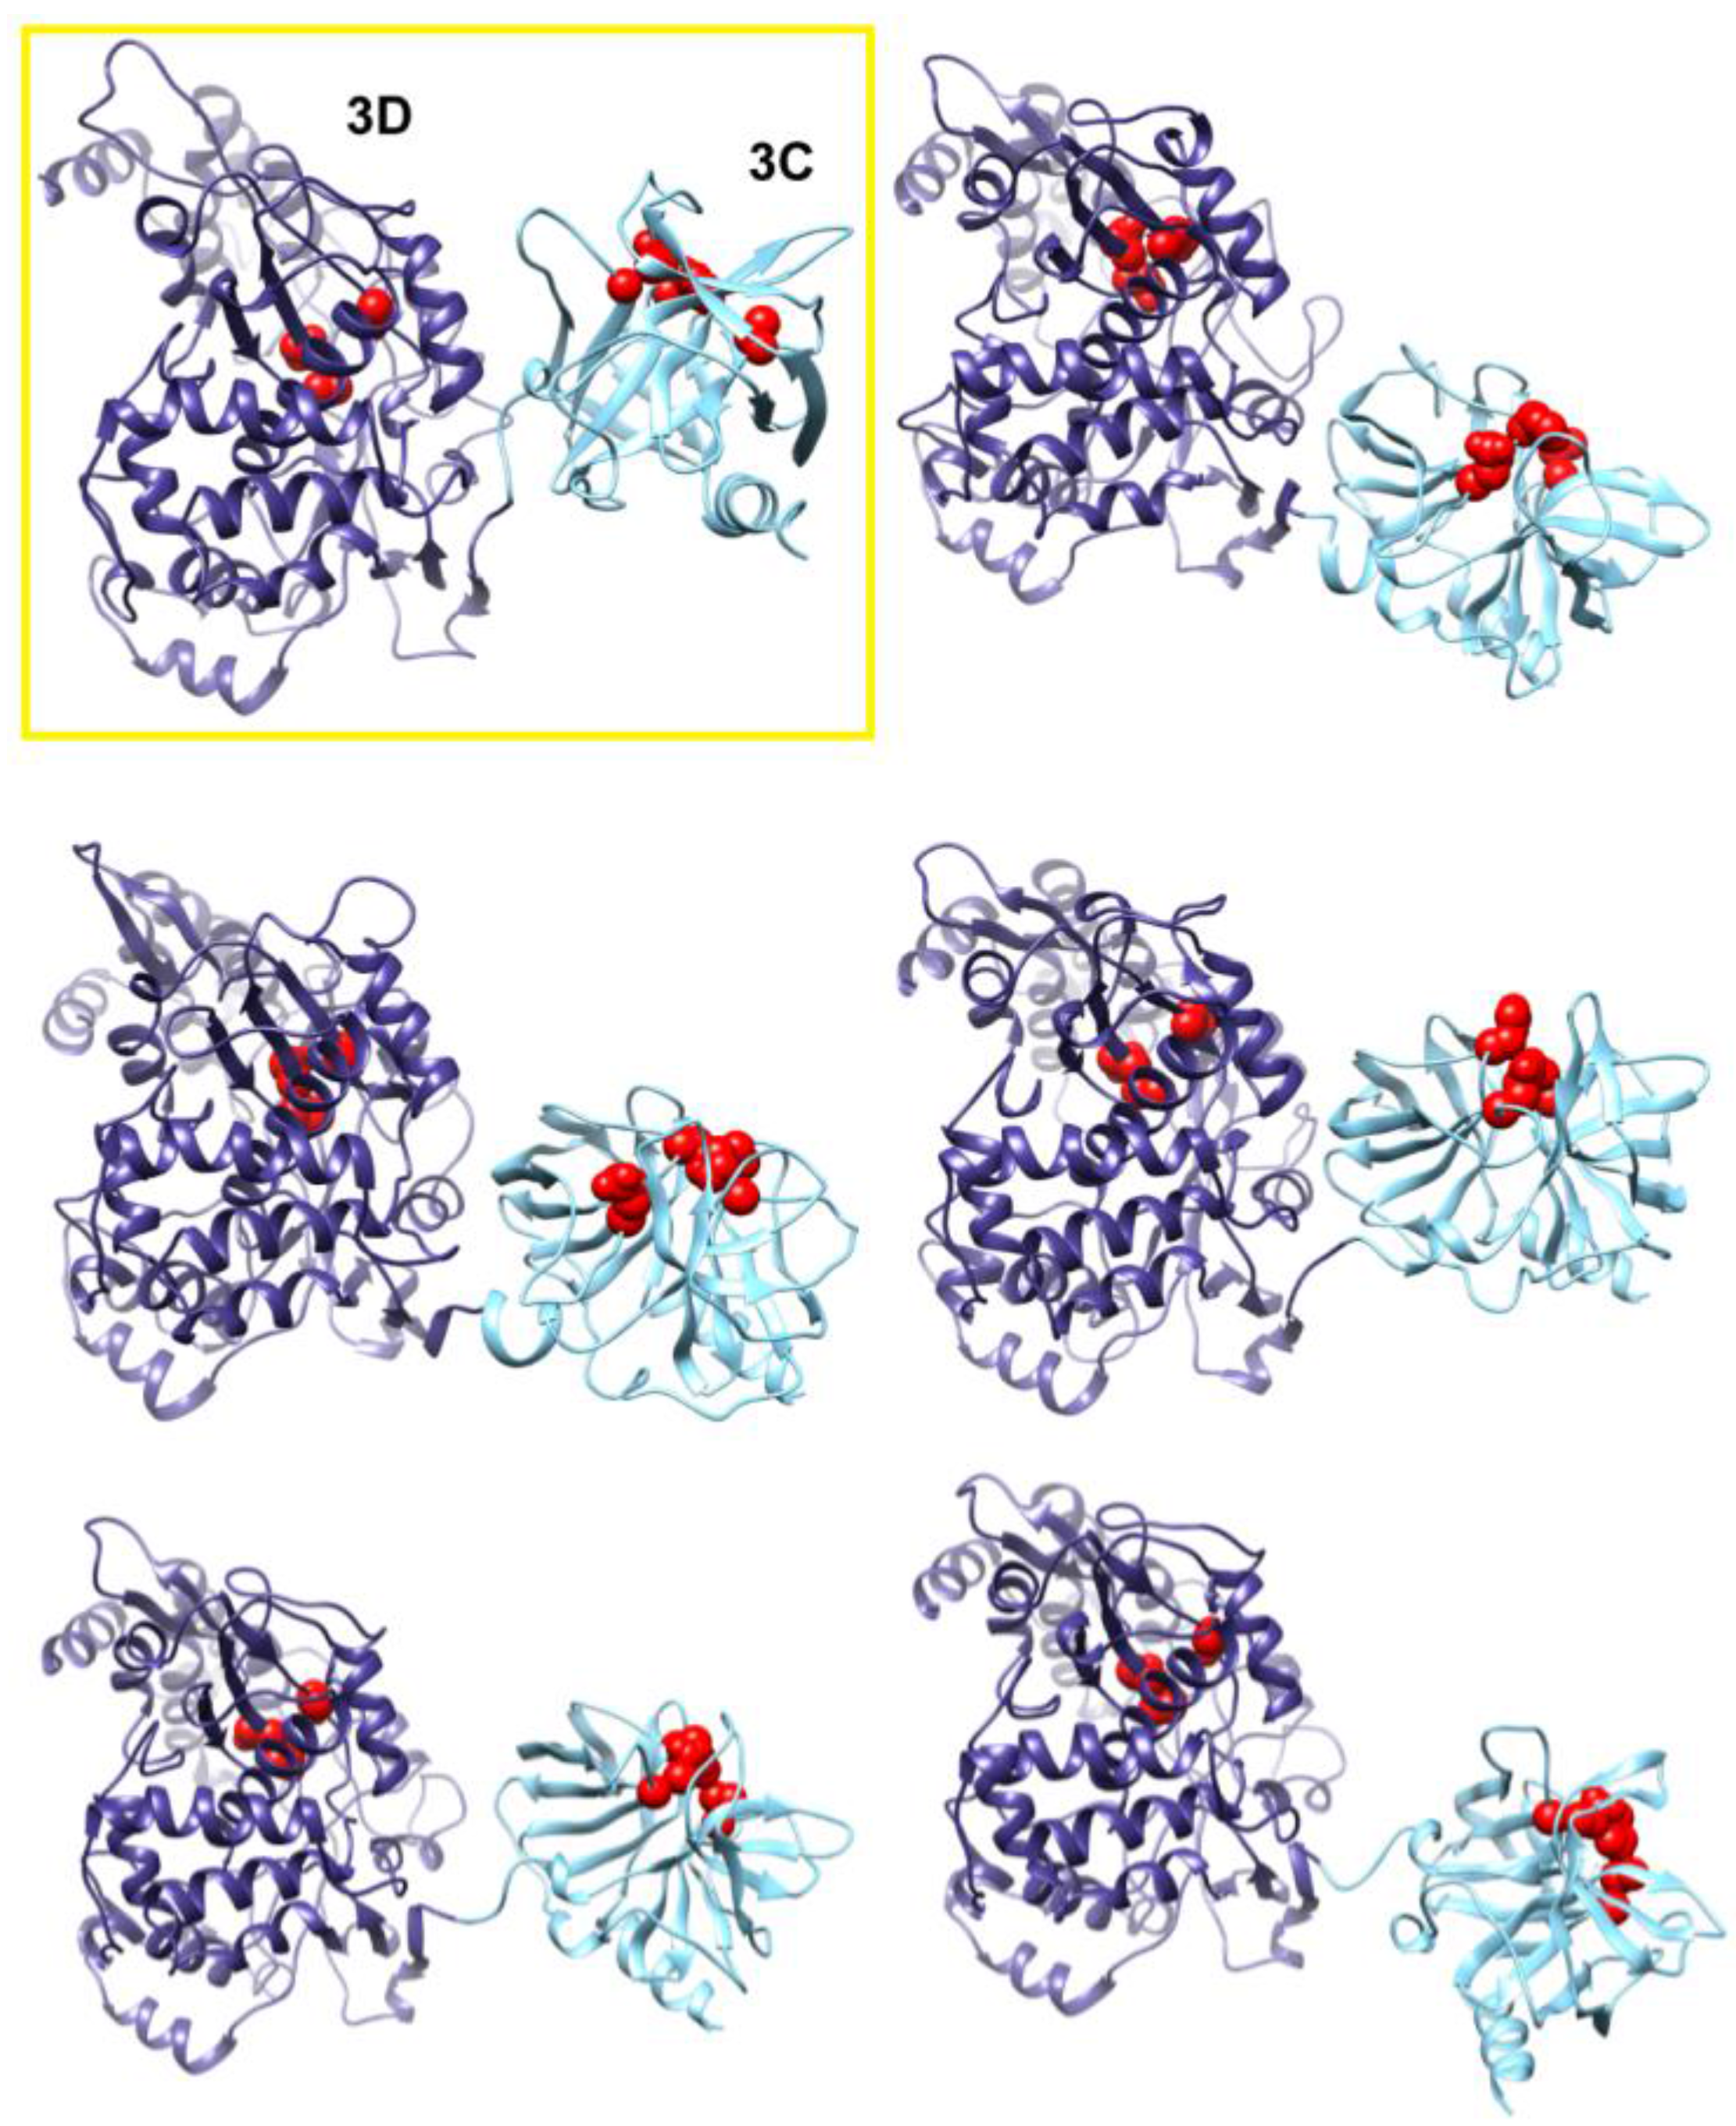
Figure 7.
Accelerated MD simulations reveal dynamic interface between 3C and 3D domains. Shown are five representative conformations of 3CD sampled during the accelerated MD simulations (including both compact and extended conformations), revealing the dynamic nature of the interface between the two domains of the protein. The interface in the compact conformation from the conventional MD is shown in a yellow box for comparison. The 3C and 3D domains are colored cyan and blue, respectively; active-site residues of the protease (His-40, Glu-71, Cys-147) and polymerase (Asp-416, Asp-511, Asp-512) are shown as red spheres to help identifying the relative orientations of the two domains.
The observation of two unique orientations of the 3C-domain relative to the 3D-domain in the two simulated 3CD monomers begged the question: do additional conformations exist? To address this question we performed a 170 ns accelerated MD simulation (aMD) as described in the Experimental section §2.1 that enhanced sampling of the conformational space of 3CD. Similar to the above two simulations, the 3CD assumed compact conformations with interfaces that overlap with the interfaces observed in the conventional MD simulations (
Figure 7). The switching among different conformations is shown in movie S1. The buried surface area between the two domains was in the range of
500 to
650 Å
2 in the different compact conformations sampled during the aMD simulation. Interestingly, in the accelerated simulation the 3CD has been seen transiently visiting relatively extended conformations similar to that observed in the crystal structure. The boosting energy in the aMD helped to overcome the interdomain interactions that exist in the compact conformations. From the results of MD simulations it can be concluded that 3CD may exist in solution as a mixture of many compact and extended conformations.
3.4. Experimental SAXS Data Support more than one Conformation for 3CD
The MD simulations revealed a compact conformation with interdomain interactions for 3CD and transiently sampled the extended beads-on-a-string conformation reported in the crystal structure. To see if the two conformations exist and to gain more insight into the solution state, we performed small-angle X-ray scattering (SAXS) experiments; see the Experimental section §2.2. SAXS technique is ideal to explore the large domain movement suggested for 3CD by MD simulations [
55].
Experimental data summary is given in
Table 2. SAXS data collected at four different concentrations in the range of 0.54 to 4.3 mg/mL are shown in
Figure 9A. Parameters that characterize the size of the protein, radius of gyration (
Rg) and maximum particle dimension (D
max), were determined from data collected at low concentrations (0.54 and 1.1 mg/mL), for which no concentration dependence was observed. Data at very small angles showed linear correlations (
Figure 9B) that satisfied Guinier approximation (
qRg <1.3), from which an
Rg value of 32.5 Å was obtained. The
Rg parameter was also determined from the interatomic pair-distance distribution function P(
r), computed by GNOM, which takes into account the entire scattering curve, not only the very small-angle portion (
Figure 9C). The real-space
Rg obtained from P(
r) was determined to be 33.48
1.53 Å, which is in good agreement with that obtained from Guinier approximation. It should be noted that the
Rg from SAXS accounts for both protein atoms and solvent molecules in the hydration shell [
56]. It is therefore larger than the
Rg calculated from structure coordinates utilizing backbone atoms of the protein during MD simulations
. The
Rg from SAXS agrees well with the estimated hydrodynamic radius (
Rh) from DLS with an
Rg/
Rh ratio of 0.86, which suggests a globular shape of 3CD. For comparison, an
Rg/
Rh value of ~0.8 is characteristic for globular proteins, the ratio increases as the molecules deviate from globular to elongated shapes, reaching ~1.4 for denatured proteins [
57]. The D
max parameter was derived from P(
r) with a value of 125 Å. The estimated size parameters are reasonable for a molecule with the size of 3CD, indicating a monomeric state of the protein in solution. In addition, the molecular masses derived from three different methods (76.9
3.8, 71.5
2.0 and 72.8
2.9 kDa) were consistent with the calculated molecular mass of a monomer (71.92 kDa); see
Table 2.
Table 2.
Small-angle X-ray scattering (SAXS) data analysis for 3CD protein.
Table 2.
Small-angle X-ray scattering (SAXS) data analysis for 3CD protein.
| Data Collection | |
|---|
| Instrument | G1-line station at CHESS, dual Pilatus 100K-S detector |
| Beam diameter (μm) | 250 × 250 |
| Wavelength (Å) | 1.244 |
| q-range (Å−1) | 0.006–0.800 |
| Exposure time (s) | 15 × 4 |
| Concentration range (mg mL−1) | 0.54–4.3 |
| Temperature (K) | 293 |
| Structural parameters | |
| Rg [real-space Rg from P(r)] (Å) | 33.48 ± 1.53 |
| Rg (from Guinier) (Å) | 32.5 |
| Dmax (Å) | 125 |
| Molecular-mass determination | |
| Molecular mass Mr (Da) | |
| From Porod volume (Vp/1.6) | 76,875 ± 3750 |
| From Lysozyme standard | 71,492 ± 1953 |
| From SAXS MoW | 72,750 ± 2900 |
| Calculated from sequence | 71,920 |
| Software employed | |
| Primary data reduction | RAW |
| Data processing | GNOM |
| Ab initio analysis | DAMMIN, GASBOR |
| Validation and averaging | DAMAVER |
| Conformational flexibility | EOM |
| Computation of model scattering | CRYSOL, FoXS |
| Fitting structure to SAXS model | SUPCOMB |
We used the combined scattering curve to construct low-resolution SAXS models using DAMMIN and GASBOR programs; see the Experimental section §2.2. Ten independent models were generated from each program and averaged. Some variations among the models were observed as indicated by NSD values that represent their similarity (1.211
0.041 for DAMMIN models and 1.438
0.049 for GASBOR models), which may reflect the flexibility of the protein. The average DAMMIN model is shown in
Figure 10A. The model can reasonably fit the two conformations of 3CD: the one observed in the crystal structure and that revealed by MD simulations (
Figure 10B). Of note, the structure from simulations showed slightly better fitting (NSD = 0.67) than the crystal structure (NSD = 0.96). Nevertheless, the precise orientation of the protein inside the SAXS envelope could not be determined without ambiguity. Moreover, fitting the calculated scattering profiles of the crystal structure and that of the average MD structure to the experimental curve appeared to be less than optimal with
values of 1.9 and 2.9 for the crystal structure and the average MD structure, respectively (
Figure 10C). This was interpreted to mean that no single conformation can satisfactorily fit the scattering data.
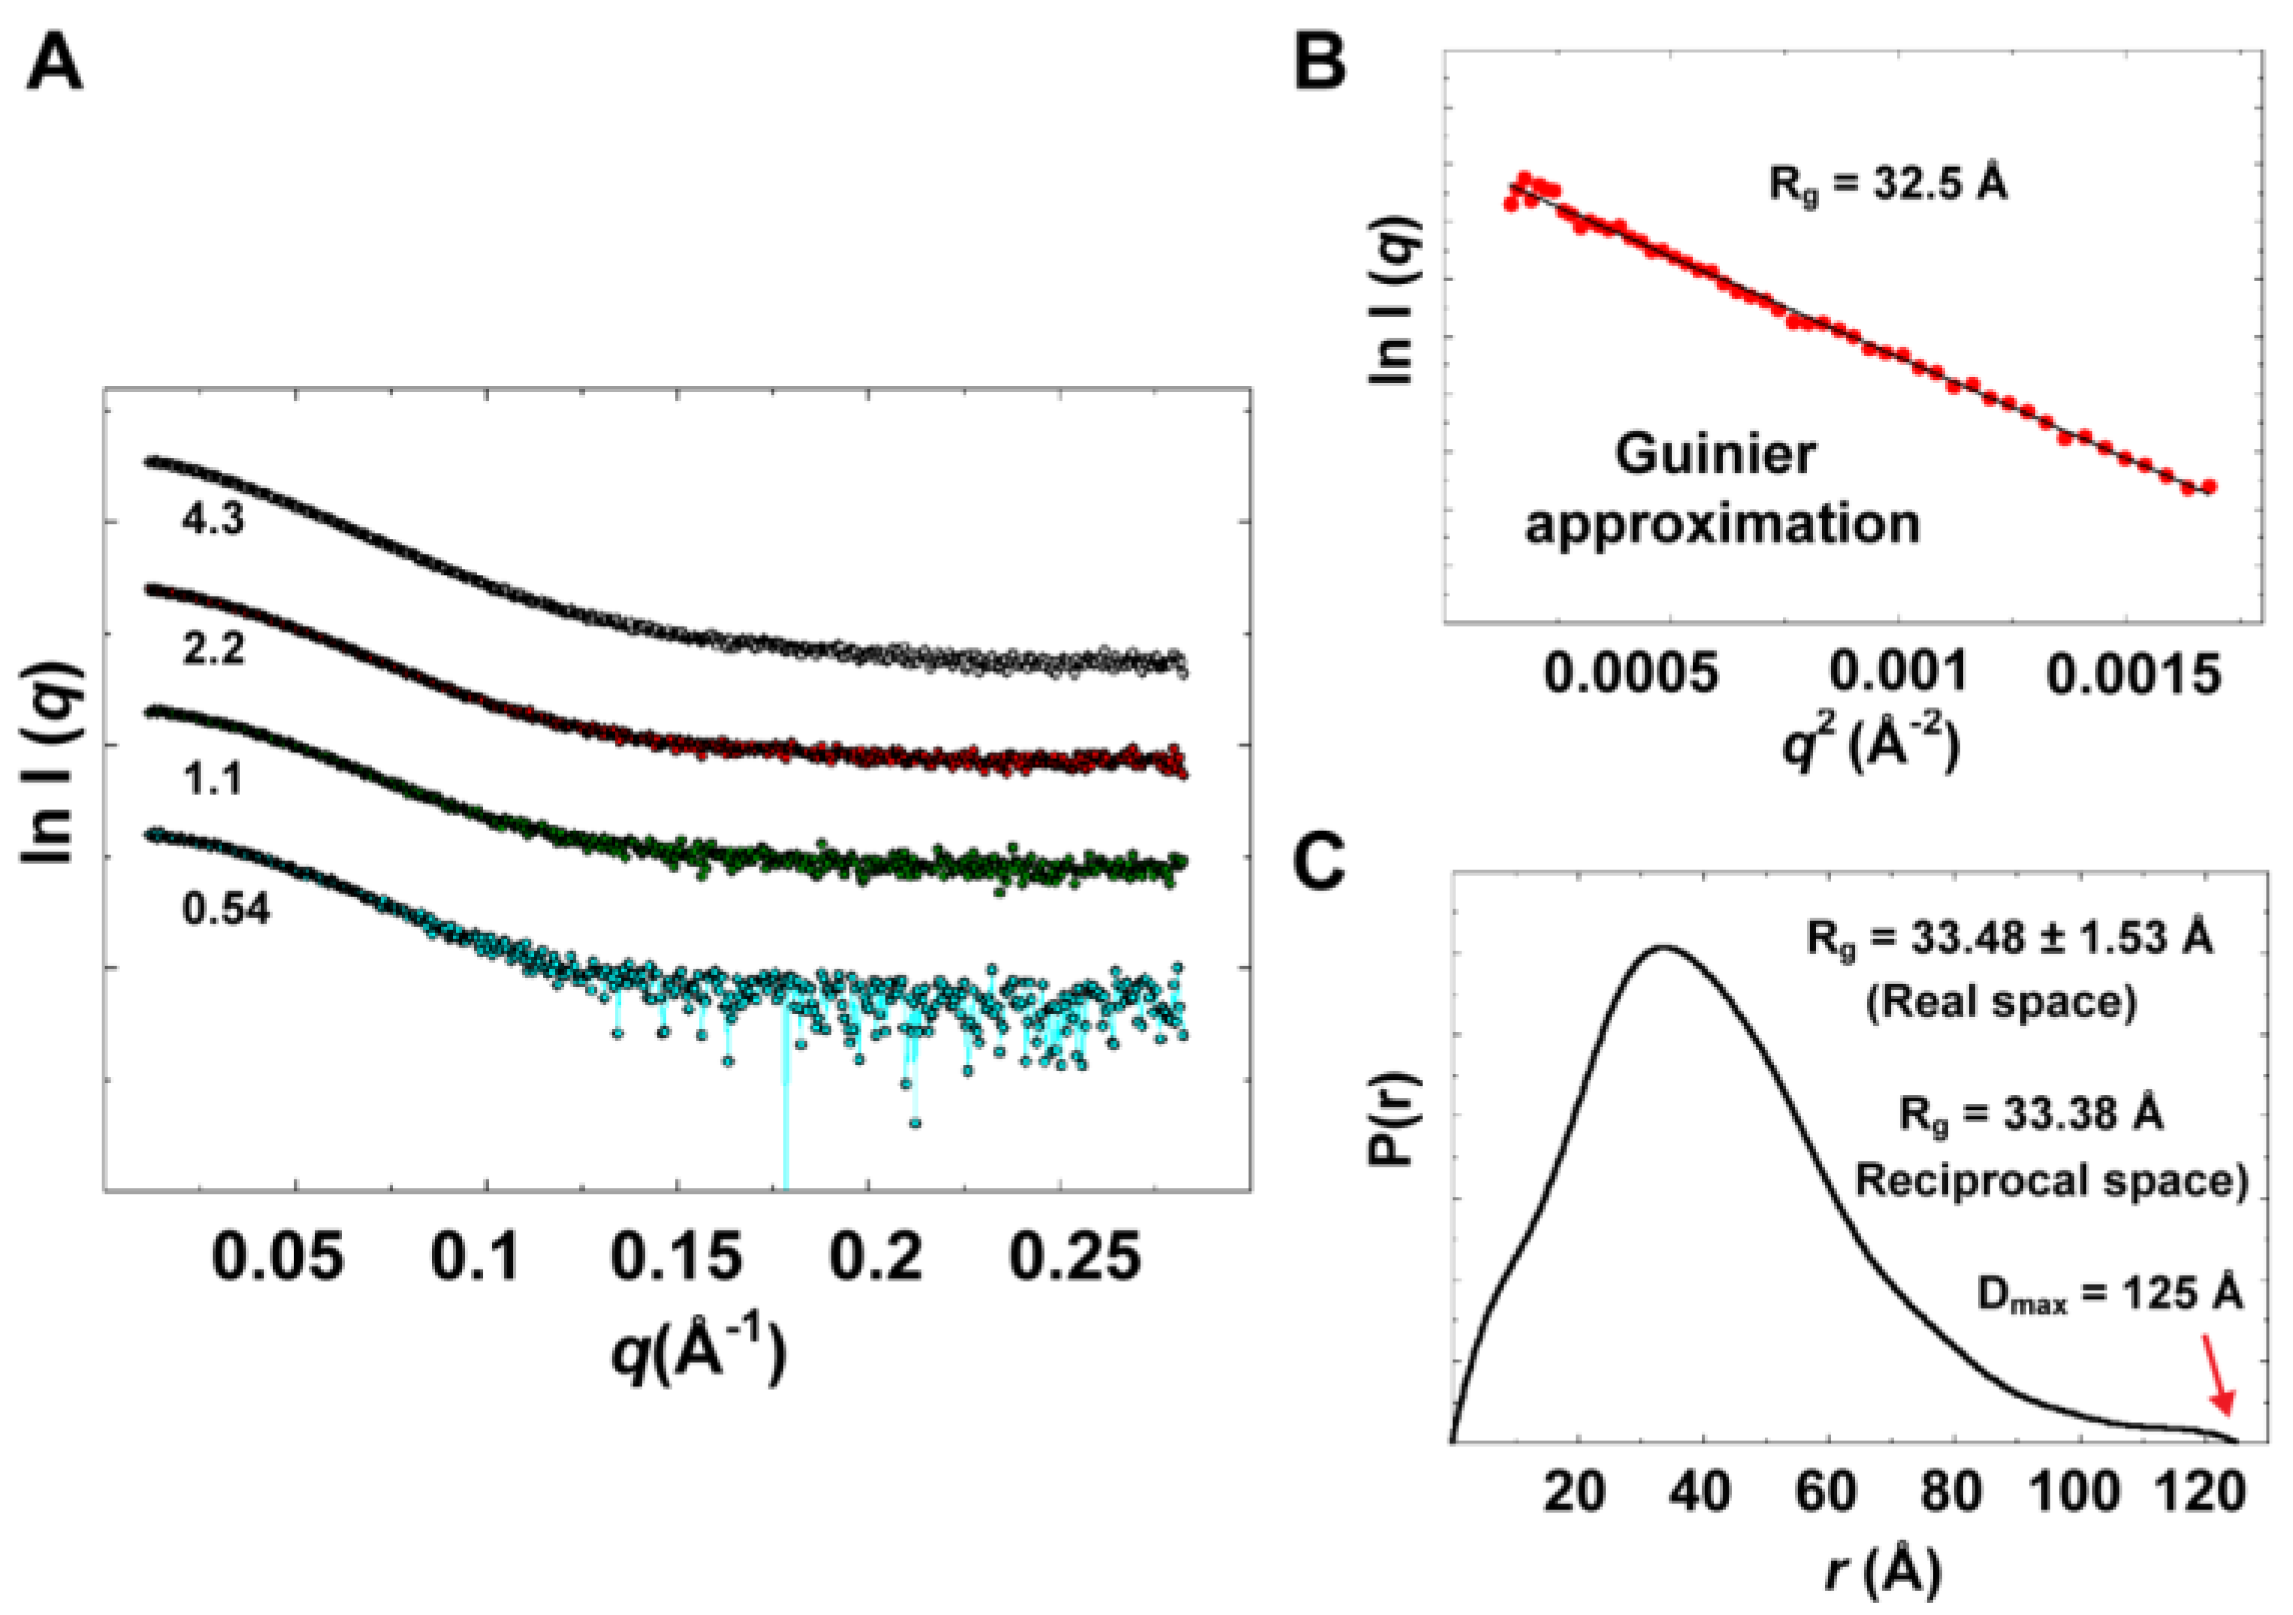
Figure 9.
Experimental solution scattering data. (A) Shown are plots of the scattering intensity from SAXS data collected at different concentrations of 3CD protein: 0.54 (cyan), 1.1 (green), 2.2 (red) and 4.3 (grey) mg/mL. (B) Guinier plot of data at very small angles is shown with a linear regression satisfying the approximation q < 1.3/Rg. (C) The pair-distance distribution function P(r) calculated by GNOM is shown. The estimated maximum particle dimension (Dmax) and Rg from P(r) are indicated on the plot. The Rg determined from Gunier approximation is in good agreement with that calculated by GNOM.
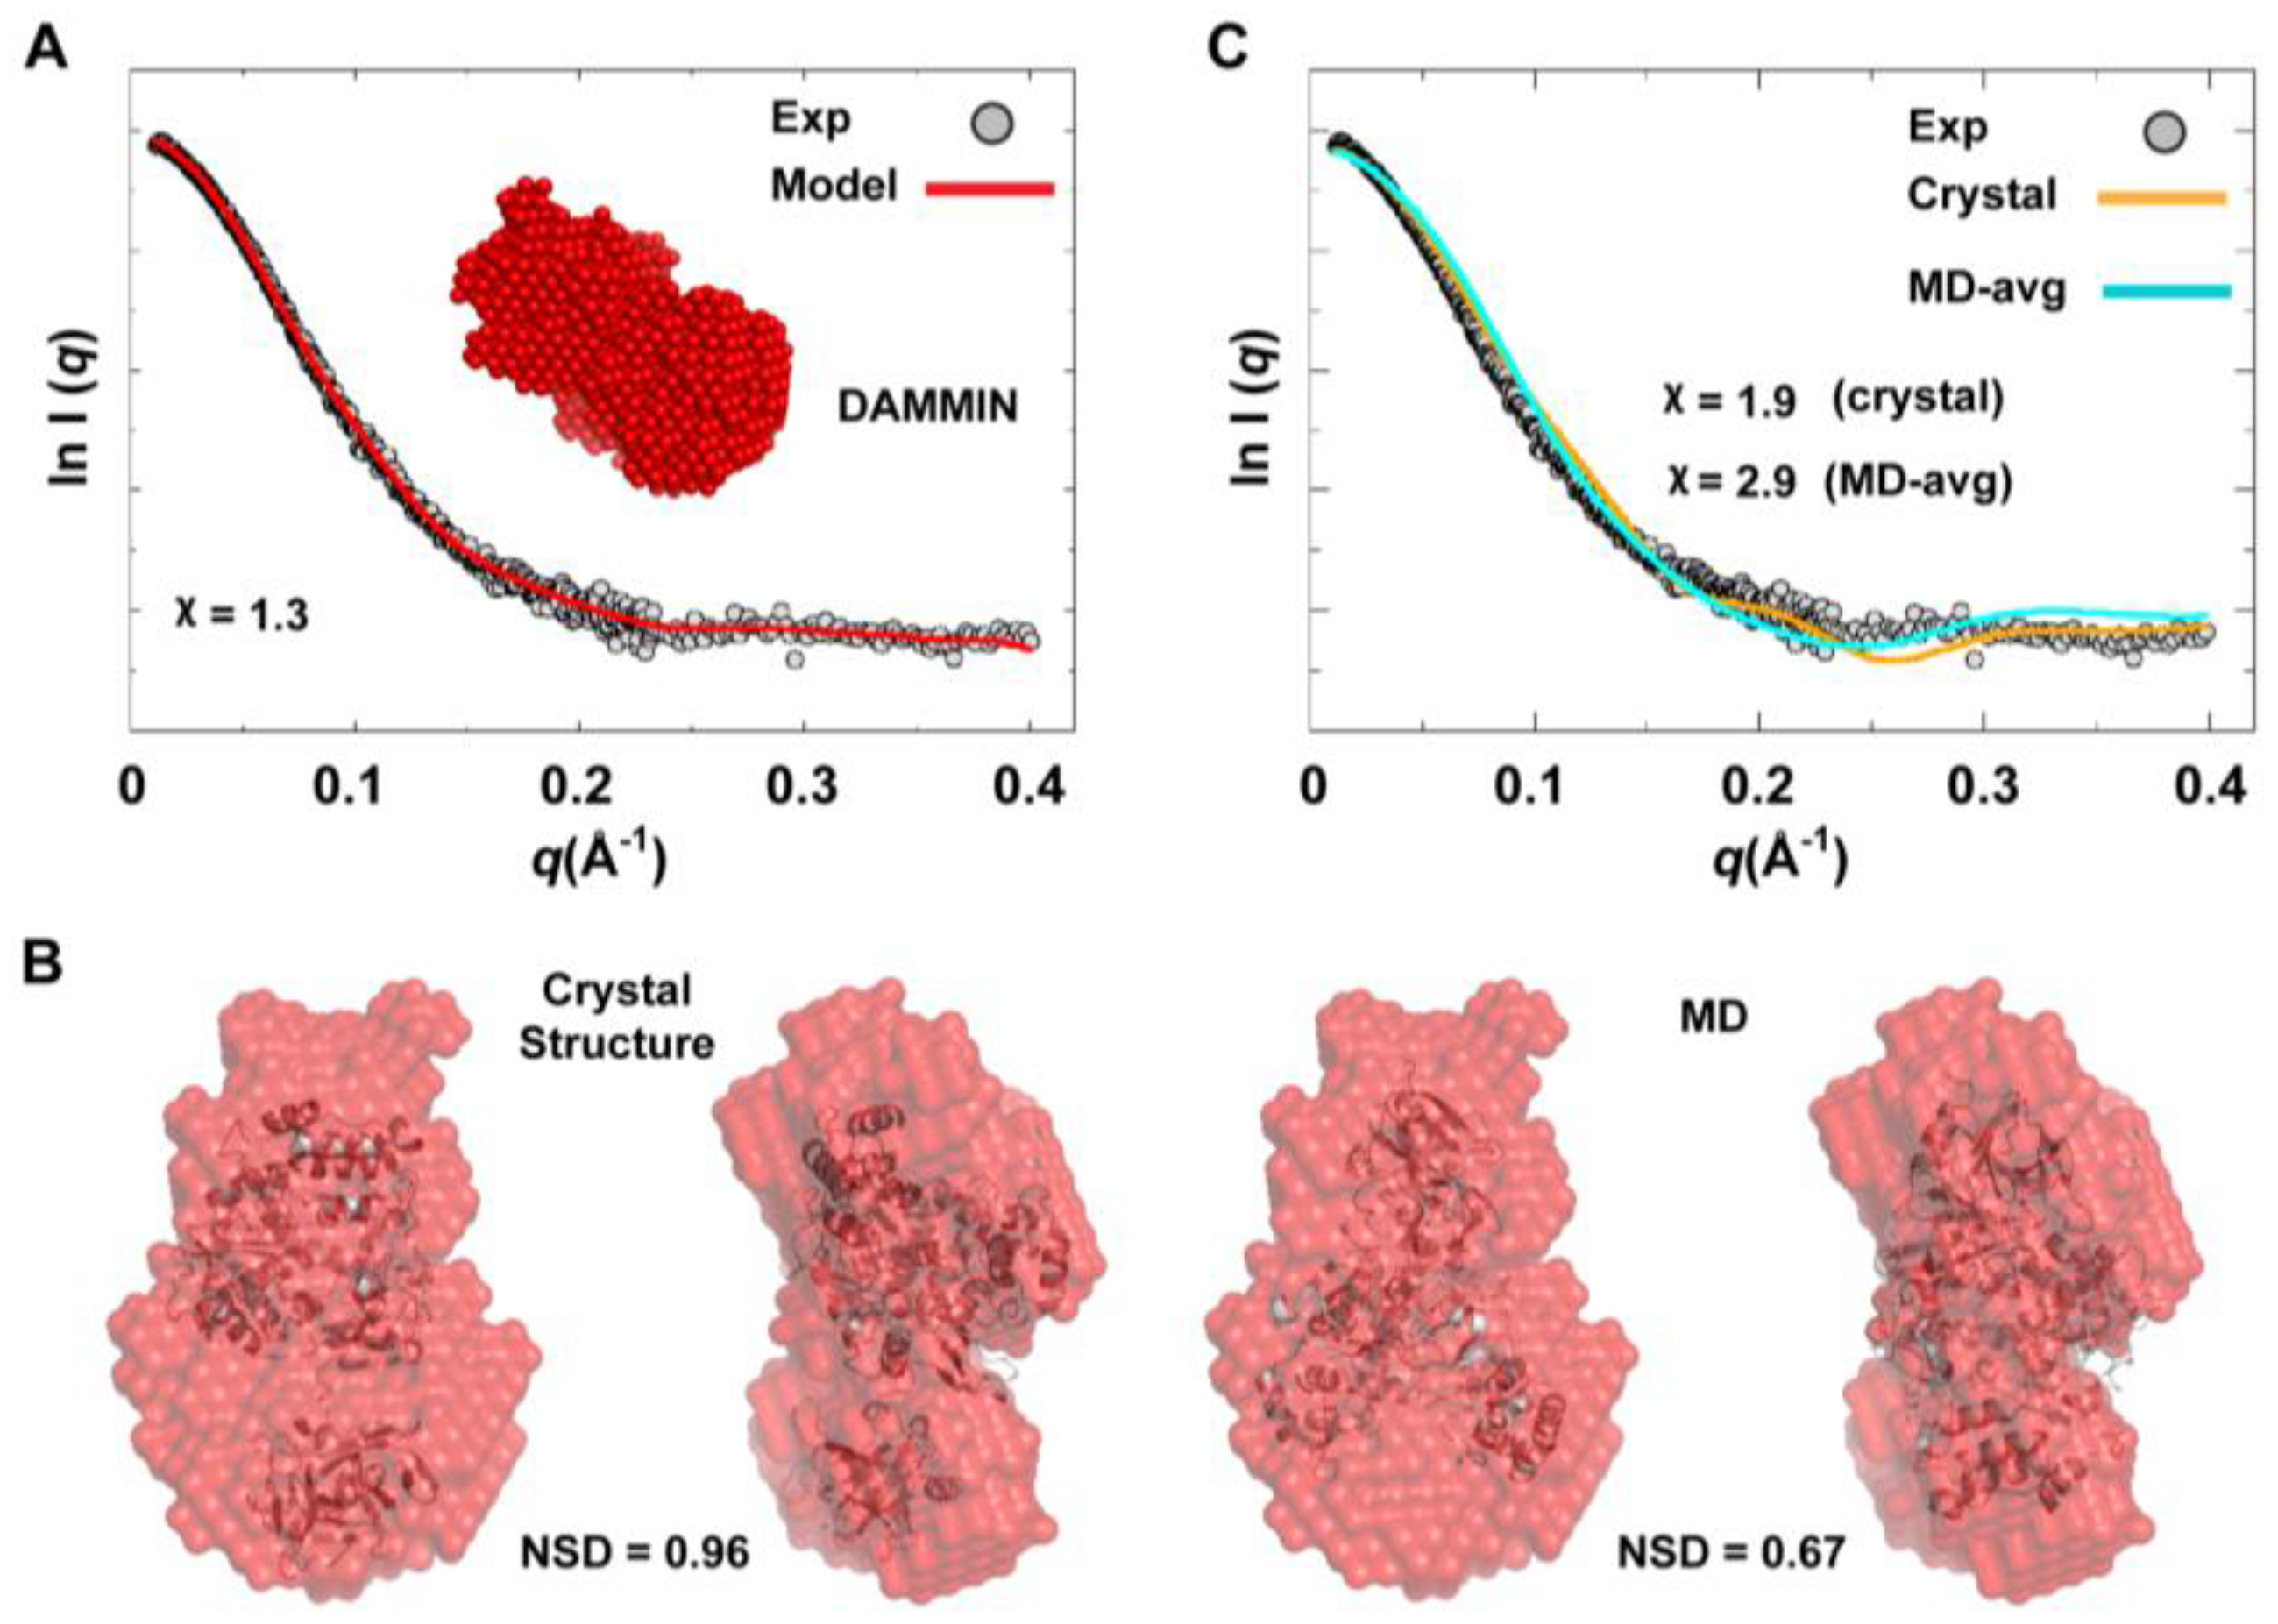
Figure 10.
Ab initio SAXS model and fitting of single-conformation to experimental scattering data. (A) Shown are the average SAXS model constructed using DAMMIN (red spheres) and the fitting of the reference model (red line) to experimental SAXS data (grey). (B) The crystal and average MD structures of 3CD, represented as cartoons, are fitted to the DAMMIN model that is shown in A (red transparent surface); two different views are displayed for each fitting. The average MD structure fits the SAXS model slightly better (NSD = 0.67) than the crystal structure (NSD = 0.96). In both cases, however, the exact orientation of the structures cannot be determined without ambiguity. (C) The calculated scattering profiles of the crystal and average MD structures are compared to experimental data. The agreement between theoretical profiles and experimental data is relatively poor as indicated by the χ-values, suggesting that no single conformation can satisfactorily fit the experimental data.
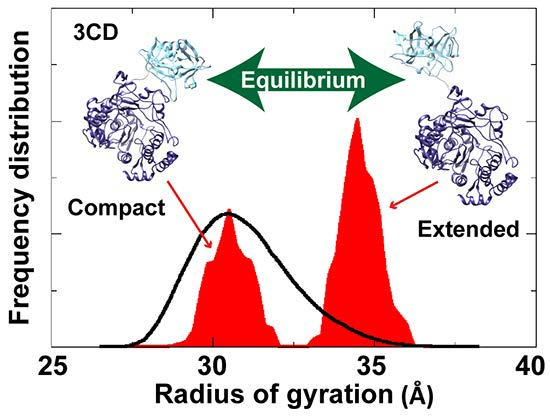
To assess the possibility of the presence of multiple conformations for 3CD in solution, we employed the Ensemble Optimization Method (EOM). This method assumes that a mixture of different conformers co-exist in solution and finds the best sub-ensemble out of a randomly generated ensemble consisting of a large number of conformers that best fits the experimental data. From an ensemble of 3CD conformers in which the 3C-domain and the linker residues were allowed to adopt different conformations, EOM selected a sub-ensemble that fits the scattering data better than any single conformation with a
-value of 1.38 (
Figure 11A). Comparison of the
Rg histogram of the initial pool covering the range of 26–38 Å (corresponding to compact-to-extended conformations) with that of the selected sub-ensemble indicated the presence of both extended and compact conformations in solution (
Figure 11B). The selected sub-ensemble has a bimodal distribution that could result from switching between the two conformations. The first peak centered at an
Rg of
31 Å corresponds to the compact conformation, and the second peak centered at an
Rg of
33 Å corresponds to the extended conformation. The conformer corresponding to the first peak accounts for 43% of the total scattering and that corresponding to the second peak accounts for 57%. Thus, both compact and extended conformations are well represented in solution. Of note, the entire initial pool is not represented in the selected sub-ensemble, suggesting a limited conformational space of the protein with the molecule fluctuating around its compact and extended conformations.
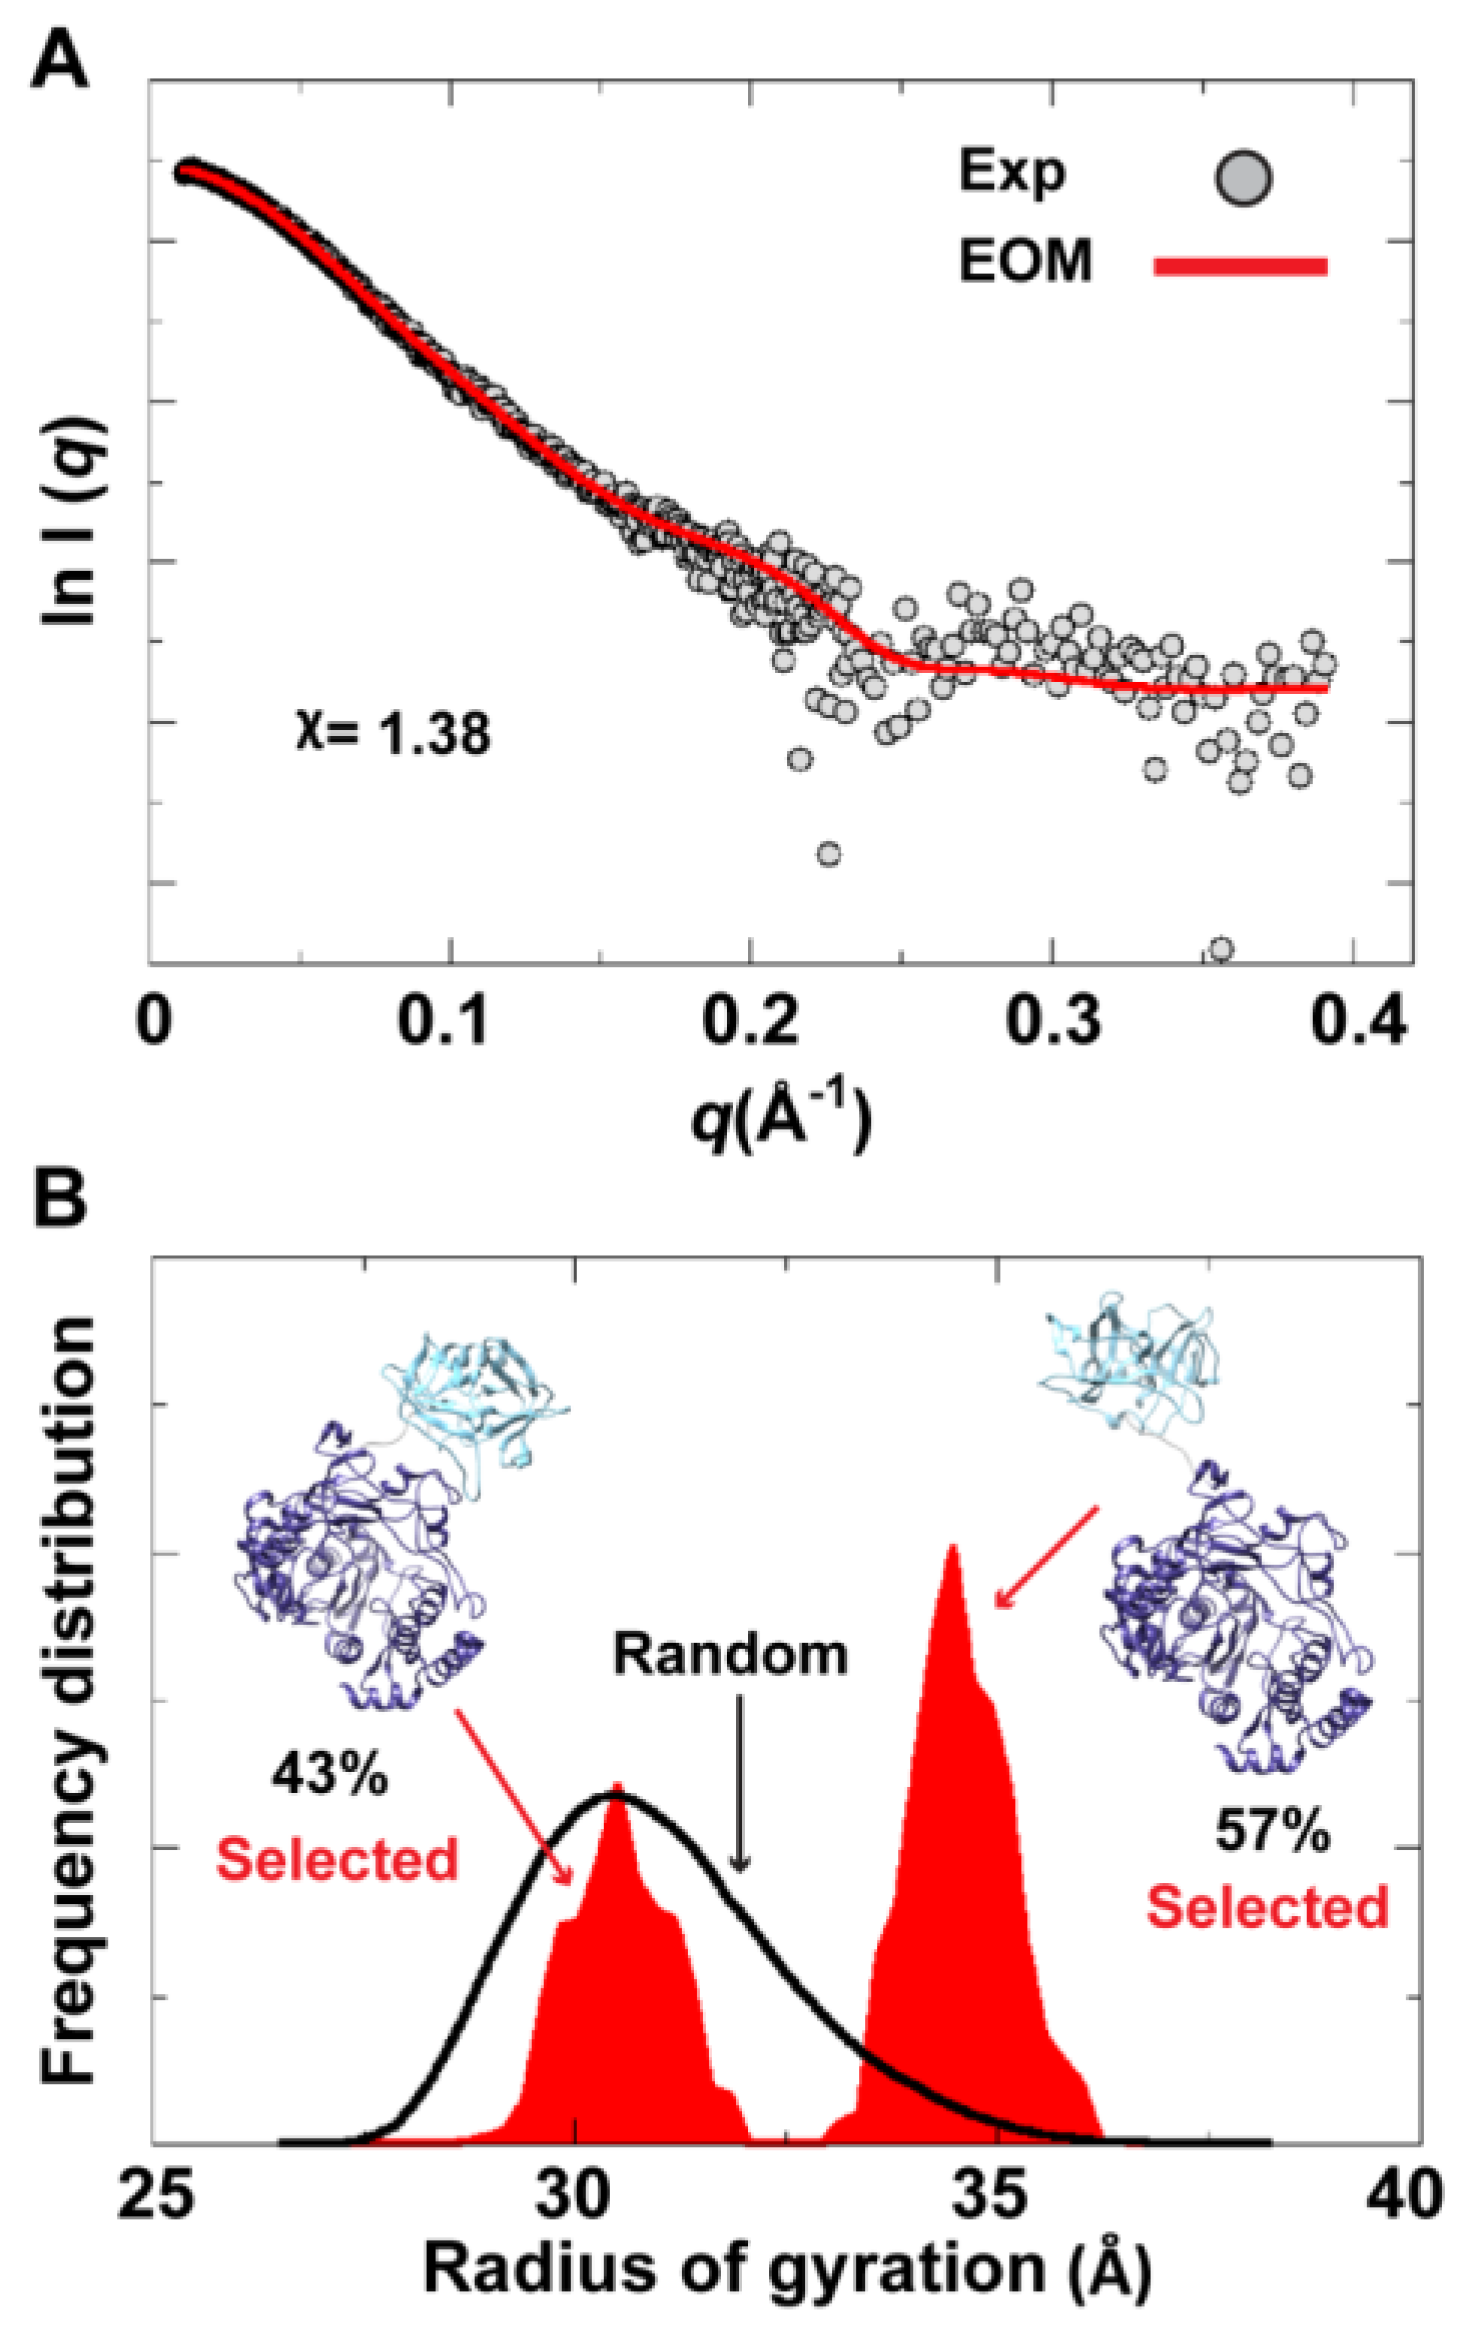
Figure 11.
Ensemble Optimization Method (EOM) analysis suggested the presence of two conformations for 3CD in solution. (A) The scattering profile calculated from the selected EOM sub-ensemble (red) is in good agreement with the experimental data (grey) as indicated by the low χ-value. (B) Shown is the EOM radius of gyration distribution (Rg) of the initial random pool (black line) and the selected sub-ensemble (red shades) for 3CD; the 3C-domain adopts different conformations relative to the 3D-domain in the sub-ensemble. The selected sub-ensemble corresponds to two conformers: an extended conformer that has no interdomain interactions and a compact conformer with interdomain interactions; the extended one is slightly preferred, contributing 57% to the total scattering. The two conformers are displayed in the inset.
In conclusion, the SAXS experiments are consistent with that the conformation of 3CD protein observed in the crystal structure and that revealed by MD simulations co-exist in solution in almost equal proportions. Furthermore, fluctuations around each conformation, similar to what was found in simulations (
Figure 4A), could be inferred from the SAXS data.


 ,
, 


