
SARS-CoV-2 Infection Is Associated with Uncontrolled HIV Viral Load in Non-Hospitalized HIV-Infected Patients from Gugulethu, South Africa


 , ,
, ,
Abstract
:1. Introduction
2. Materials and Methods
2.1. Study Cohort
2.2. Clinical Data
2.3. SARS-CoV-2 Serology
2.4. Statistical Analysis
3. Results
3.1. Clinical Characteristics of the Study Participants
3.2. Association of Clinical Parameters with SARS-CoV-2 Seroconversion
4. Discussion
Supplementary Materials
Author Contributions
Funding
Institutional Review Board Statement
Informed Consent Statement
Data Availability Statement
Acknowledgments
Conflicts of Interest
References
- UNAIDS. Country Factsheet South Africa 2020. Available online: https://www.unaids.org/en/regionscountries/countries/southafrica (accessed on 2 March 2022).
- Adams, J.; MacKenzie, M.J.; Amegah, A.K.; Ezeh, A.; Gadanya, M.A.; Omigbodun, A.; Sarki, A.M.; Thistle, P.; Ziraba, A.K.; Stranges, S.; et al. The Conundrum of Low COVID-19 Mortality Burden in sub-Saharan Africa: Myth or Reality? Glob. Health Sci. Pract. 2021, 9, 433–443. [Google Scholar] [CrossRef] [PubMed]
- MRC. Report on Weekly Deaths in South Africa. Available online: https://www.samrc.ac.za/reports/report-weekly-deaths-south-africa?bc=254 (accessed on 11 April 2022).
- Williamson, E.J.; Walker, A.J.; Bhaskaran, K.; Bacon, S.; Bates, C.; Morton, C.E.; Curtis, H.J.; Mehrkar, A.; Evans, D.; Inglesby, P.; et al. Factors associated with COVID-19-related death using OpenSAFELY. Nature 2020, 584, 430–436. [Google Scholar] [CrossRef] [PubMed]
- Jassat, W.; Cohen, C.; Tempia, S.; Masha, M.; Goldstein, S.; Kufa, T.; Murangandi, P.; Savulescu, D.; Walaza, S.; Bam, J.L.; et al. Risk factors for COVID-19-related in-hospital mortality in a high HIV and tuberculosis prevalence setting in South Africa: A cohort study. Lancet HIV 2021, 8, e554–e567. [Google Scholar] [CrossRef]
- Vizcarra, P.; Perez-Elias, M.J.; Quereda, C.; Moreno, A.; Vivancos, M.J.; Dronda, F.; Casado, J.L.; Team, C.-I. Description of COVID-19 in HIV-infected individuals: A single-centre, prospective cohort. Lancet HIV 2020, 7, e554–e564. [Google Scholar] [CrossRef]
- Shalev, N.; Scherer, M.; LaSota, E.D.; Antoniou, P.; Yin, M.T.; Zucker, J.; Sobieszczyk, M.E. Clinical Characteristics and Outcomes in People Living with Human Immunodeficiency Virus Hospitalized for Coronavirus Disease 2019. Clin. Infect. Dis. Off. Publ. Infect. Dis. Soc. Am. 2020, 71, 2294–2297. [Google Scholar] [CrossRef]
- Jones, R.; Nelson, M.; Bracchi, M.; Asboe, D.; Boffito, M. COVID-19 in patients with HIV. Lancet HIV 2020, 7, e383. [Google Scholar] [CrossRef]
- Harter, G.; Spinner, C.D.; Roider, J.; Bickel, M.; Krznaric, I.; Grunwald, S.; Schabaz, F.; Gillor, D.; Postel, N.; Mueller, M.C.; et al. COVID-19 in people living with human immunodeficiency virus: A case series of 33 patients. Infection 2020, 48, 681–686. [Google Scholar] [CrossRef]
- Gervasoni, C.; Meraviglia, P.; Riva, A.; Giacomelli, A.; Oreni, L.; Minisci, D.; Atzori, C.; Ridolfo, A.; Cattaneo, D. Clinical Features and Outcomes of Patients with Human Immunodeficiency Virus With COVID-19. Clin. Infect. Dis. Off. Publ. Infect. Dis. Soc. Am. 2020, 71, 2276–2278. [Google Scholar] [CrossRef]
- Sigel, K.; Swartz, T.; Golden, E.; Paranjpe, I.; Somani, S.; Richter, F.; De Freitas, J.K.; Miotto, R.; Zhao, S.; Polak, P.; et al. Coronavirus 2019 and People Living with Human Immunodeficiency Virus: Outcomes for Hospitalized Patients in New York City. Clin. Infect. Dis. Off. Publ. Infect. Dis. Soc. Am. 2020, 71, 2933–2938. [Google Scholar] [CrossRef]
- Geretti, A.M.; Stockdale, A.J.; Kelly, S.H.; Cevik, M.; Collins, S.; Waters, L.; Villa, G.; Docherty, A.; Harrison, E.M.; Turtle, L.; et al. Outcomes of Coronavirus Disease 2019 (COVID-19) Related Hospitalization Among People with Human Immunodeficiency Virus (HIV) in the ISARIC World Health Organization (WHO) Clinical Characterization Protocol (UK): A Prospective Observational Study. Clin. Infect. Dis. Off. Publ. Infect. Dis. Soc. Am. 2021, 73, e2095–e2106. [Google Scholar] [CrossRef]
- Western Cape Department of Health in collaboration with the National Institute for Communicable Diseases, South Africa. Risk Factors for Coronavirus Disease 2019 (COVID-19) Death in a Population Cohort Study from the Western Cape Province, South Africa. Clin. Infect. Dis. Off. Publ. Infect. Dis. Soc. Am. 2021, 73, e2005–e2015. [Google Scholar] [CrossRef]
- WHO. Global Clinical Platform for COVID-19, Clinical Features and prognostic Factors of COVID-19 in People Living with HIV Hospitalized with Suspected or Confirmed SARS-CoV-2 Infection. 2021. Available online: https://www.who.int/publications/i/item/WHO-2019-nCoV-Clinical-HIV-2021.1 (accessed on 3 March 2022).
- Del Amo, J.; Polo, R.; Moreno, S.; Diaz, A.; Martinez, E.; Arribas, J.R.; Jarrin, I.; Hernan, M.A.; The Spanish, H.I.V.C.-C. Incidence and Severity of COVID-19 in HIV-Positive Persons Receiving Antiretroviral Therapy: A Cohort Study. Ann. Intern. Med. 2020, 173, 536–541. [Google Scholar] [CrossRef]
- Berenguer, J.; Diez, C.; Martin-Vicente, M.; Mican, R.; Perez-Elias, M.J.; Garcia-Fraile, L.J.; Vidal, F.; Suarez-Garcia, I.; Podzamczer, D.; Del Romero, J.; et al. Prevalence and factors associated with SARS-CoV-2 seropositivity in the Spanish HIV Research Network Cohort. Clin. Microbiol. Infect. 2021, 27, 1678–1684. [Google Scholar] [CrossRef]
- Del Amo, J.; Polo, R.; Moreno, S.; Diaz, A.; Martinez, E.; Arribas, J.R.; Jarrin, I.; Hernan, M.A. Antiretrovirals and Risk of COVID-19 Diagnosis and Hospitalization in HIV-Positive Persons. Epidemiology 2020, 31, e49–e51. [Google Scholar] [CrossRef]
- Hussey, H.; Zinyakatira, N.; Morden, E.; Ismail, M.; Paleker, M.; Bam, J.L.; London, L.; Boulle, A.; Davies, M.A. Higher COVID-19 mortality in low-income communities in the City of Cape Town—A descriptive ecological study. Gates Open Res. 2021, 5, 90. [Google Scholar] [CrossRef]
- Shaw, J.A.; Meiring, M.; Cummins, T.; Chegou, N.N.; Claassen, C.; Du Plessis, N.; Flinn, M.; Hiemstra, A.; Kleynhans, L.; Leukes, V.; et al. Higher SARS-CoV-2 seroprevalence in workers with lower socioeconomic status in Cape Town, South Africa. PLoS ONE 2021, 16, e0247852. [Google Scholar] [CrossRef]
- Del Amo, J.; Polo, R.; Moreno, S.; Jarrin, I.; Hernan, M.A. SARS-CoV-2 infection and coronavirus disease 2019 severity in persons with HIV on antiretroviral treatment. AIDS 2022, 36, 161–168. [Google Scholar] [CrossRef]
- Harris, P.A.; Taylor, R.; Thielke, R.; Payne, J.; Gonzalez, N.; Conde, J.G. Research electronic data capture (REDCap)—A metadata-driven methodology and workflow process for providing translational research informatics support. J. Biomed. Inform. 2009, 42, 377–381. [Google Scholar] [CrossRef] [Green Version]
- Makatsa, M.S.; Tincho, M.B.; Wendoh, J.M.; Ismail, S.D.; Nesamari, R.; Pera, F.; de Beer, S.; David, A.; Jugwanth, S.; Gededzha, M.P.; et al. SARS-CoV-2 Antigens Expressed in Plants Detect Antibody Responses in COVID-19 Patients. Front. Plant Sci. 2021, 12, 589940. [Google Scholar] [CrossRef]
- Waldrop, G.; Doherty, M.; Vitoria, M.; Ford, N. Stable patients and patients with advanced disease: Consensus definitions to support sustained scale up of antiretroviral therapy. Trop. Med. Int. Health TM IH 2016, 21, 1124–1130. [Google Scholar] [CrossRef]
- Wajnberg, A.; Amanat, F.; Firpo, A.; Altman, D.R.; Bailey, M.J.; Mansour, M.; McMahon, M.; Meade, P.; Mendu, D.R.; Muellers, K.; et al. Robust neutralizing antibodies to SARS-CoV-2 infection persist for months. Science 2020, 370, 1227–1230. [Google Scholar] [CrossRef]
- Seow, J.; Graham, C.; Merrick, B.; Acors, S.; Pickering, S.; Steel, K.J.A.; Hemmings, O.; O’Byrne, A.; Kouphou, N.; Galao, R.P.; et al. Longitudinal observation and decline of neutralizing antibody responses in the three months following SARS-CoV-2 infection in humans. Nat. Microbiol. 2020, 5, 1598–1607. [Google Scholar] [CrossRef]
- Braconnier, P.; Delforge, M.; Garjau, M.; Wissing, K.M.; De Wit, S. Hyponatremia is a marker of disease severity in HIV-infected patients: A retrospective cohort study. BMC Infect. Dis. 2017, 17, 98. [Google Scholar] [CrossRef] [Green Version]
- Cao, G.; Wang, Y.; Wu, Y.; Jing, W.; Liu, J.; Liu, M. Prevalence of anemia among people living with HIV: A systematic review and meta-analysis. EClinicalMedicine 2022, 44, 101283. [Google Scholar] [CrossRef]
- Akbar, M.R.; Pranata, R.; Wibowo, A.; Irvan; Sihite, T.A.; Martha, J.W. The Prognostic Value of Hyponatremia for Predicting Poor Outcome in Patients with COVID-19: A Systematic Review and Meta-Analysis. Front. Med. 2021, 8, 805. [Google Scholar] [CrossRef]
- Tao, Z.; Xu, J.; Chen, W.; Yang, Z.; Xu, X.; Liu, L.; Chen, R.; Xie, J.; Liu, M.; Wu, J.; et al. Anemia is associated with severe illness in COVID-19: A retrospective cohort study. J. Med. Virol. 2021, 93, 1478–1488. [Google Scholar] [CrossRef]
- Peluso, M.J.; Bakkour, S.; Busch, M.P.; Deeks, S.G.; Henrich, T.J. A High Percentage of People with Human Immunodeficiency Virus (HIV) on Antiretroviral Therapy Experience Detectable Low-Level Plasma HIV-1 RNA Following Coronavirus Disease 2019 (COVID-19). Clin. Infect. Dis. Off. Publ. Infect. Dis. Soc. Am. 2021, 73, e2845–e2846. [Google Scholar] [CrossRef]
- Snyman, J.; Hwa, S.-H.; Krause, R.; Muema, D.; Reddy, T.; Ganga, Y.; Karim, F.; Leslie, A.; Sigal, A.; Ndung’u, T.; et al. Similar Antibody Responses Against Severe Acute Respiratory Syndrome Coronavirus 2 in Individuals Living without and with Human Immunodeficiency Virus on Antiretroviral Therapy During the First South African Infection Wave. Clin. Infect. Dis. 2021, ciab758. [Google Scholar] [CrossRef]
- Stiegler, N.; Bouchard, J.P. South Africa: Challenges and successes of the COVID-19 lockdown. Ann. Med.-Psychol. 2020, 178, 695–698. [Google Scholar] [CrossRef]
- Jewell, B.L.; Mudimu, E.; Stover, J.; Ten Brink, D.; Phillips, A.N.; Smith, J.A.; Martin-Hughes, R.; Teng, Y.; Glaubius, R.; Mahiane, S.G.; et al. Potential effects of disruption to HIV programmes in sub-Saharan Africa caused by COVID-19: Results from multiple mathematical models. Lancet HIV 2020, 7, e629–e640. [Google Scholar] [CrossRef]
- Cohen, C.; Kleynhans, J.; von Gottberg, A.; McMorrow, M.L.; Wolter, N.; Bhiman, J.N.; Moyes, J.; du Plessis, M.; Carrim, M.; Buys, A.; et al. SARS-CoV-2 incidence, transmission and reinfection in a rural and an urban setting: Results of the PHIRST-C cohort study, South Africa, 2020–2021. medRxiv 2021. [Google Scholar] [CrossRef]
- Meiring, S.; Tempia, S.; Bhiman, J.N.; Buys, A.; Kleynhans, J.; Makhasi, M.; McMorrow, M.; Moyes, J.; Quan, V.; Walaza, S.; et al. Prolonged shedding of SARS-CoV-2 at high viral loads amongst hospitalised immunocompromised persons living with HIV, South Africa. Clin. Infect. Dis. Off. Publ. Infect. Dis. Soc. Am. 2022, ciac077. [Google Scholar] [CrossRef] [PubMed]
- Karim, F.; Gazy, I.; Cele, S.; Zungu, Y.; Krause, R.; Bernstein, M.; Khan, K.; Ganga, Y.; Rodel, H.; Mthabela, N.; et al. HIV status alters disease severity and immune cell responses in Beta variant SARS-CoV-2 infection wave. eLife 2021, 10, e67397. [Google Scholar] [CrossRef] [PubMed]
- Mukonda, E.; Hsiao, N.Y.; Vojnov, L.; Myer, L.; Lesosky, M. Mixed-method estimation of population-level HIV viral suppression rate in the Western Cape, South Africa. BMJ Glob. Health 2020, 5, e002522. [Google Scholar] [CrossRef]
- Conan, N.; Simons, E.; Chihana, M.L.; Ohler, L.; FordKamara, E.; Mbatha, M.; vanCutsem, G.; Huerga, H. Increase in HIV viral suppression in KwaZulu-Natal, South Africa: Community-based cross sectional surveys 2018 and 2013. What remains to be done? PLoS ONE 2022, 17, e0265488. [Google Scholar] [CrossRef]
- Bessong, P.O.; Matume, N.D.; Tebit, D.M. Potential challenges to sustained viral load suppression in the HIV treatment programme in South Africa: A narrative overview. AIDS Res. Ther. 2021, 18, 1. [Google Scholar] [CrossRef]
- Msomi, N.; Lessells, R.; Mlisana, K.; de Oliveira, T. Africa: Tackle HIV and COVID-19 together. Nature 2021, 600, 33–36. [Google Scholar] [CrossRef]
- Lederman, M.M.; Funderburg, N.T.; Sekaly, R.P.; Klatt, N.R.; Hunt, P.W. Residual immune dysregulation syndrome in treated HIV infection. Adv. Immunol. 2013, 119, 51–83. [Google Scholar]
- Cele, S.; Karim, F.; Lustig, G.; San, J.E.; Hermanus, T.; Tegally, H.; Snyman, J.; Moyo-Gwete, T.; Wilkinson, E.; Bernstein, M.; et al. SARS-CoV-2 prolonged infection during advanced HIV disease evolves extensive immune escape. Cell Host Microbe 2022, 30, 154–162.e5. [Google Scholar] [CrossRef]


| Characteristic | n (%) or Median (Range) | |
|---|---|---|
| Sex | Female | 104 (69.3) |
| Male | 46 (30.7) | |
| Age, years | 39 (20–65) | |
| Weight, kgs | 69 (34–150) | |
| Time since HIV diagnosis, days | 1305 (0–10303) | |
| HIV VL, copies/mL | 49 (1–1050867) | |
| HIV VL | <1000 copies/ml | 105 (73.4) |
| >1000 copies/ml | 38 (26.6) | |
| Last known CD4 at time of recruitment 1, cells/µL | 154 (3–347) | |
| Absolute CD4, cells/µl | 220 (17–604) | |
| Absolute CD4 | Within normal range 2 (332–1642 cells/µL) | 29 (20.0) |
| Below normal range 2 (< 332 cells/µL) | 116 (80.0) | |
| WHO clinical stage of HIV disease | 1 | 79 (57.7) |
| 2 | 33 (24.1) | |
| 3 | 23 (16.8) | |
| 4 | 2 (1.5) | |
| Receiving ART 3 | Yes | 143 (95.3) |
| Defaulted | 7 (4.7) | |
| Time since ART start 3, days | 527 (0–5238) | |
| ART regimen 3 | TDF, FTC, EFV (TEE) | 64 (44.8) |
| TDF, 3TC, DTG (TLD) | 48 (33.6) | |
| ABC, 3TC, EFV | 2 (1.4) | |
| ABC, 3TC, NVP | 1 (0.7) | |
| AZT, 3TC, LPV/r | 9 (6.3) | |
| TDF, FTC, LPV/r | 6 (4.2) | |
| ABC, 3TC, LPV/r | 1 (0.7) | |
| TDF, FTC, ATV/r | 2 (1.4) | |
| ABC, 3TC, DTG | 3 (2.1) | |
| AZT, 3TC, DTG | 2 (1.4) | |
| ABC, 3TC, ATV/r | 4 (2.8) | |
| TDF, FTC, EFV, LPV/r | 1 (0.7) | |
| SARS-CoV-2 antibody 4 | Negative | 44 (29.3) |
| Positive | 106 (70.7) | |
| SARS-CoV-2 vaccinated | 0 (0%) | |
| Parameter | SARS-CoV-2 Antibody Negative (n = 44) N (%) or Median (Range) | SARS-CoV-2 Antibody Positive (n = 106) N (%) or Median (Range) | p-Value | ||
|---|---|---|---|---|---|
| Demographic information | |||||
| Age, years | 39 (27–58) | 38 (20–65) | 0.898 | ||
| Sex | Female | 29 (65.9%) | 74 (70.5%) | 0.582 | |
| Male | 15 (34.1%) | 31 (29.5%) | |||
| Weight, kgs | 69.5 (34.0–102.0) | 69.0 (41.2–150.0) | 0.773 | ||
| HIV-related parameters | |||||
| Time since HIV diagnosis, days | 709 (0–9993) | 1610 (0–10303) | 0.082 | ||
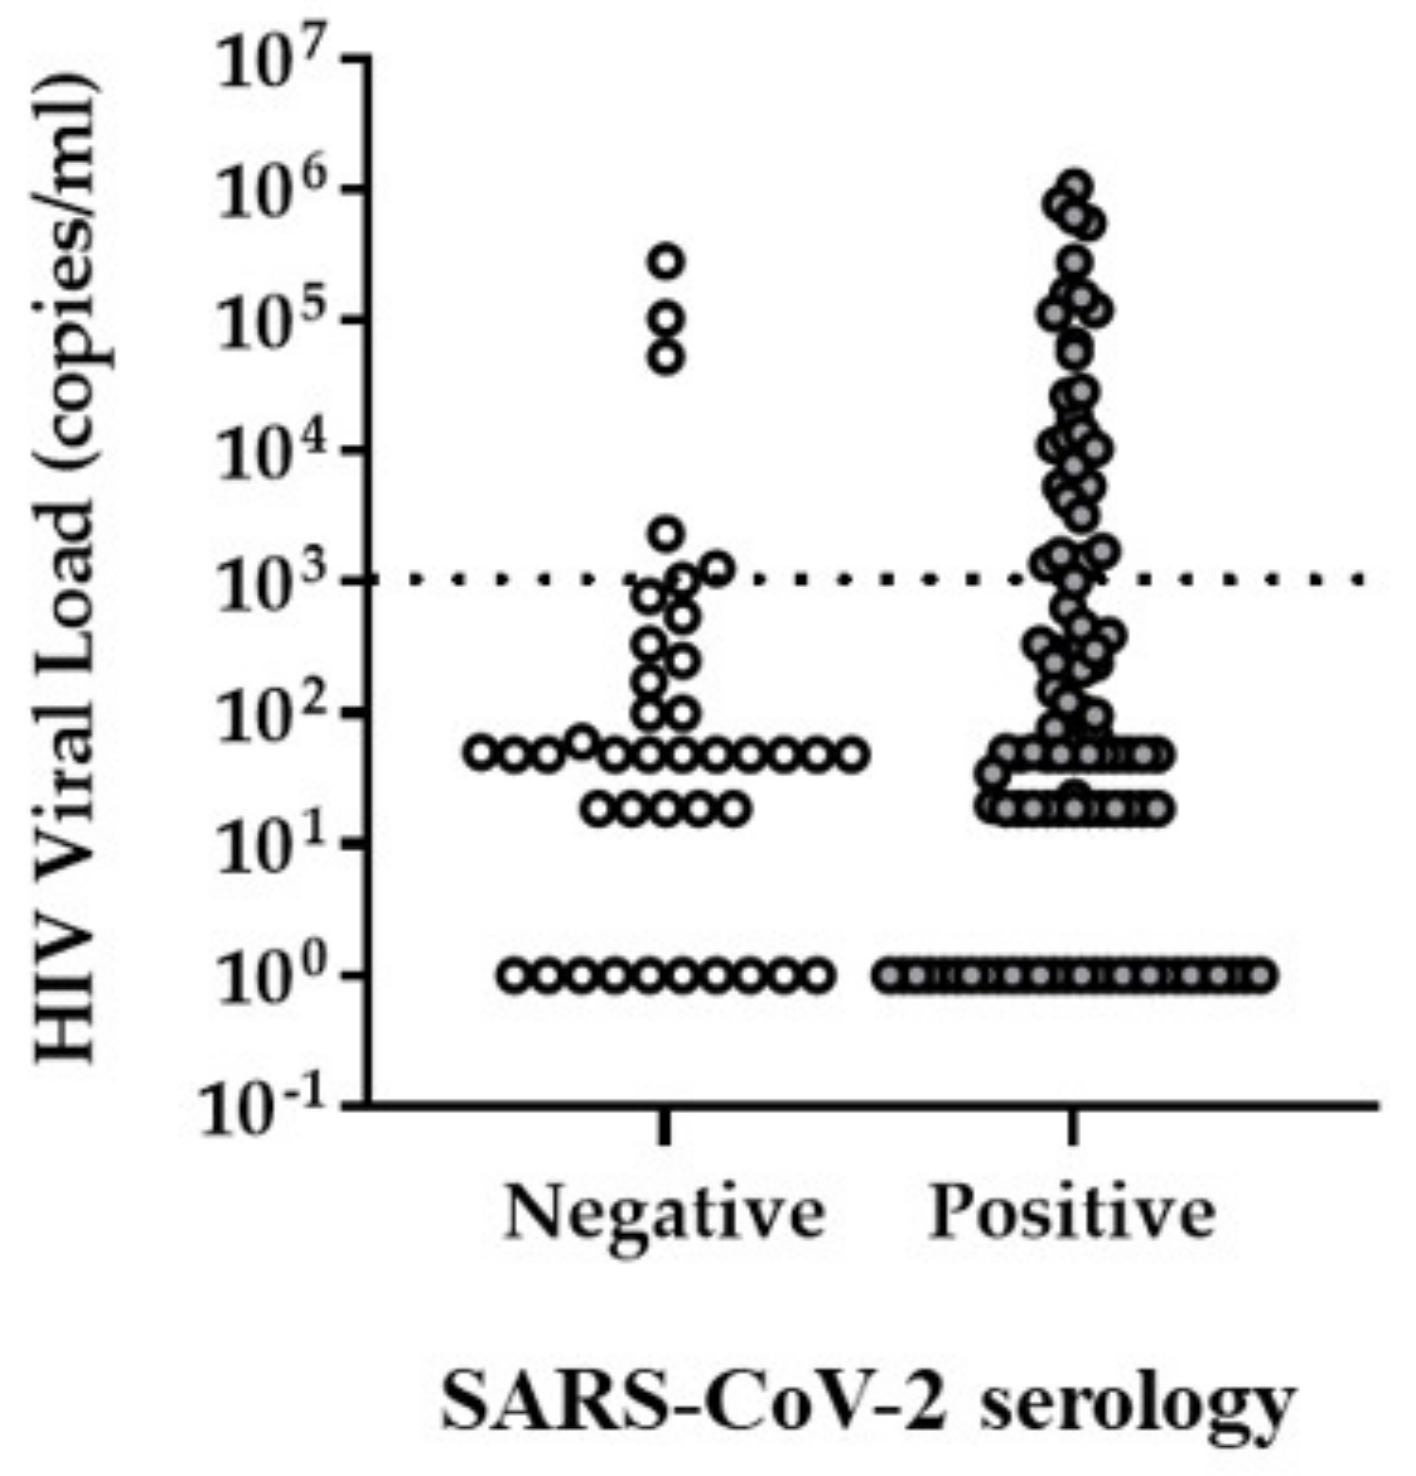
| HIV VL, copies/mL | 49 (1–283875) | 50 (1–1050867) | 0.411 | ||
| HIV VL | < 1000 copies/mL | 35 (85.4%) | 70 (68.6%) | 0.04 * | |
| > 1000 copies/mL | 6 (14.6%) | 32 (31.4%) | |||
| Last known CD4 at time of recruitment 1, cells/µL | 171 (3–336) | 147 (4–347) | 0.607 | ||
| Absolute CD4, cells/µL | 222 (32–589) | 209 (17–604) | 0.925 | ||
| Absolute CD4 | Low (200–332 cells/µL) | 14 (33.3%) | 39 (37.9%) | 0.740 | |
| Very low (< 200 cells/µL) | 18 (42.9%) | 45 (43.75) | |||
| WHO clinical stage of HIV disease | 1 | 28 (68.3%) | 51 (53.1%) | 0.174 | |
| 2 | 5 (12.2%) | 28 (29.2%) | |||
| 3 | 7 (17.1%) | 16 (16.7%) | |||
| 4 | 1 (2.4%) | 1 (1.0%) | |||
| Receiving ART 3 | Yes | 42 (95.5%) | 101 (95.3%) | 1.00 | |
| Defaulted | 2 (4.5%) | 5 (4.7%) | |||
| Time since ART start 3, days | 527 (0–5238) | 526 (0–5064) | 0.597 | ||
| ART regimen 3 | 1 | TDF, FTC, EFV (TEE) | 23 (54.8%) | 41 (40.6%) | 0.098 |
| 2 | TDF, 3TC, DTG (TLD) | 14 (33.3%) | 34 (33.7%) | ||
| 3 | ABC, 3TC, EFV | 0 (0.0%) | 2 (2.0%) | ||
| 4 | ABC, 3TC, NVP | 1 (2.4%) | 0 (0.0%) | ||
| 5 | AZT, 3TC, LPV/r | 0 (0.0%) | 9 (8.9%) | ||
| 6 | TDF, FTC, LPV/r | 0 (0.0%) | 6 (5.9%) | ||
| 7 | ABC, 3TC, LPV/r | 0 (0.0%) | 1 (1.0%) | ||
| 8 | TDF, FTC, ATV/r | 0 (0.0%) | 2 (2.0%) | ||
| 9 | ABC, 3TC, DTG | 2 (4.8%) | 1 (1.0%) | ||
| 10 | AZT, 3TC, DTG | 0 (0.0%) | 2 (2.0%) | ||
| 11 | ABC, 3TC, ATV/r | 1 (2.4%) | 3 (3.0%) | ||
| 12 | TDF, FTC, EFV, LPV/r | 1 (2.4%) | 0 (0.0%) | ||
| Laboratory blood analysis | |||||
| Sodium, mmol/L | 137.00 (134.00–143.00) | 136.00 (128.00–144.00) | 0.026 * | ||
| Sodium | Within normal range (136–145 mmol/L) 2 | 31 (72.1%) | 56 (54.4%) | 0.047 * | |
| Below normal range (<136 mmol/L) 2 | 12 (27.9%) | 47 (45.6%) | |||
| Creatinine, µmol/L | 68.00 (47.00–124.00) | 67.50 (34.00–109.00) | 0.562 | ||
| Creatinine | Within normal range (F:49–90 µmol/L, M: 64–104 µmol/L) 2 | 37 (86.0%) | 86 (82.7%) | 0.771 | |
| Below normal range (F: <49 µmol/L, M: <64 µmol/L) 2 | 4 (9.3%) | 14 (13.5%) | |||
| Above normal range (F: >90 µmol/L, M: >104 µmol/L) 2 | 2 (4.7%) | 4 (3.8%) | |||
| Albumin, g/L | 43.00 (32.00–51.00) | 42.00 (28.00–55.00) | 0.214 | ||
| Albumin | Within normal range (35–52 g/L) 2 | 42 (97.7%) | 91 (88.3%) | 0.186 | |
| Below normal range (<35 g/L) 2 | 1 (2.3%) | 9 (8.7%) | |||
| Above normal range (>52 g/L) 2 | 0 (0.0%) | 3 (2.9%) | |||
| Alanine transaminase, (IU/L) | 23.00 (8.00–193.00) | 20.50 (5.00–67.00) | 0.194 | ||
| Alanine transaminase | Within normal range (F: 7–35 IU/L, M: 10–40 IU/L) 2 | 38 (88.4%) | 88 (86.3%) | 0.651 | |
| Below normal range (F: <7 IU/L, M: <10 IU/L) 2 | 0 (0.0%) | 2 (2.0%) | |||
| Above normal range (F: >35 IU/L, M: >40 IU/L) 2 | 5 (11.6%) | 12 (11.8%) | |||
| C-reactive protein, mg/L | 4.00 (1.00–347.00) | 4.00 (1.00–82.00) | 0.805 | ||
| C-reactive protein | Within normal range (<10 mg/L) 2 | 34 (79.1%) | 74 (71.2%) | 0.323 | |
| Elevated(>10 mg/L) 2 | 9 (20.9%) | 30 (28.8%) | |||
| White cell count, ×109/L | 5.06 (2.53–11.61) | 4.91 (2.73–8.77) | 0.70 | ||
| White cell count | Within normal range (F: 3.9–12.6 × 10⁹/L, M: 3.92–10.4 × 10⁹/L) 2 | 33 (75.0%) | 81 (78.6%) | 0.628 | |
| Below normal range (F: <3.9 × 10⁹/L, M: <3.92 × 10⁹/L) 2 | 11 (25.0%) | 22 (21.4%) | |||
| Red cell count, ×1012/L | 4.14 (3.18–5.55) | 4.14 (3.08–5.51) | 0.460 | ||
| Red cell count | Within normal range (F: 3.8–4.8 × 10¹²/L, M: 4.5–5.5 × 10¹²/L) 2 | 33 (75.0%) | 57 (55.3%) | 0.081 | |
| Below normal range (F: <3.8 × 10¹²/L, M: <4.5 × 10¹²/L) 2 | 10 (22.7%) | 42 (40.8%) | |||
| Above normal range (F: >4.8 × 10¹²/L, M: >5.5 × 10¹²/L) 2 | 1 (2.3%) | 4 (3.9%) | |||
| Haemoglobin, g/dL | 12.70 (8.70–16.60) | 12.50 (6.00–17.00) | 0.269 | ||
| Haemoglobin | Within normal range (F: 12–15 g/dL, M: 13–17 g/dL) 2 | 26 (59.1%) | 64 (62.1%) | 0.729 | |
| Below normal range (F: <12 g/dL, M: <13 g/dL) 2 | 18 (40.9%) | 39 (37.9%) | |||
| Haematocrit, I/L | 0.39 (0.27–0.50) | 0.39 (0.24–0.52) | 0.209 | ||
| Haematocrit | Within normal range (F: 0.36–0.46 I/L, M: 0.4–0.5 I/L) 2 | 30 (68.2%) | 69 (67.0%) | 0.805 | |
| Below normal range (F: <0.36 I/L, M: <0.4 I/L) 2 | 14 (31.8%) | 33 (32.0%) | |||
| Above normal range (F: >0.46 I/L, M: >0.5 I/L) 2 | 0 (0.0%) | 1 (1.0%) | |||
| Mean corpuscular volume, fl | 93.40 (85.10–109.00) | 93.50 (63.40–115.70) | 0.726 | ||
| Mean corpuscular volume | Within normal range (F: 78.9–98.5 fl, M: 83.1–101.6 fl) 2 | 38 (86.4%) | 80 (77.7%) | 0.187 | |
| Below normal range (F: <78.9 fl, M: <83.1 fl) 2 | 0 (0.0%) | 7 (6.8%) | |||
| Above normal range (F: >98.5 fl, M: >101.6 fl) 2 | 6 (13.6%) | 16 (15.5%) | |||
| Mean corpuscular haemoglobin, pg | 30.80 (27.20–33.70) | 30.60 (16.10–40.20) | 0.764 | ||
| Mean corpuscular haemoglobin | Within normal range (F: 26.1–33.5 pg, M: 27.8–34.8 pg) 2 | 43 (97.7%) | 86 (83.5%) | 0.048 * | |
| Below normal range (F: <26.1 pg, M: <27.8 pg) 2 | 0 (0.0%) | 9 (8.7%) | |||
| Above normal range (F: >33.5 pg, M: >34.8 pg) 2 | 1 (2.3%) | 8 (7.8%) | |||
| Mean corpuscular haemoglobin concentration, g/dL | 32.40 (29.70–35.30) | 32.40 (25.40–35.70) | 0.944 | ||
| Mean corpuscular haemoglobin concentration | Within normal range (F: 32.7–34.9 g/dL, M: 33–35 g/dL) 2 | 16 (36.4%) | 47 (45.6%) | 0.582 | |
| Below normal range (F: <32.7 g/dL, M: <33 g/dL) 2 | 27 (61.4%) | 54 (52.4%) | |||
| Above normal range (F: >34.9 g/dL, M: >35 g/dL) 2 | 1 (2.3%) | 2 (1.9%) | |||
| Red cell distribution width, % | 13.55 (11.60–21.30) | 14.00 (11.20–22.10) | 0.143 | ||
| Red cell distribution width | Within normal range (F: 12.4–17.3%, M: 12.1–16.3%) 2 | 35 (79.5%) | 92 (89.3%) | 0.254 | |
| Below normal range (F: <12.4%, M: <12.1%) 2 | 5 (11.4%) | 5 (4.9%) | |||
| Above normal range (F: >17.3%, M: >16.3%) 2 | 4 (9.1%) | 6 (5.8%) | |||
| Platelet count, ×109/L | 294.00 (163.00–490.00) | 304.00 (101.00–808.00) | 0.587 | ||
| Platelet count | Within normal range (F: 186–454 × 109/L, M: 171–388 × 109/L) 2 | 41 (93.2%) | 88 (85.4%) | 0.398 | |
| Below normal range (F: <186 × 109/L, M: <171 × 109/L) 2 | 1 (2.3%) | 7 (6.8%) | |||
| Above normal range (F: >454 × 109/L, M: >388 × 109/L) 2 | 2 (4.5%) | 8 (7.8%) | |||
| Neutrophils, % | 53.95 (18.10–81.40) | 52.95 (19.90–79.10) | 0.969 | ||
| Neutrophil count, ×109/L | 2.55 (0.62–9.23) | 2.54 (0.68–6.34) | 0.952 | ||
| Neutrophil count | Within normal range (F: 1.6–8.3 × 10⁹/L, M: 1.6–6.98 × 10⁹/L)2 | 32 (72.7%) | 86 (84.3%) | 0.05 | |
| Below normal range (<1.6 × 10⁹/L)2 | 10 (22.7%) | 16 (15.7%) | |||
| Above normal range (F: >8.3 × 10⁹/L, M: >6.98 × 10⁹/L)2 | 2 (4.5%) | 0 (0.0%) | |||
| Lymphocytes, % | 33.30 (9.90–323.50) | 34.90 (12.60–60.70) | 0.765 | ||
| Lymphocyte count, ×109/L | 1.63 (0.75–6.12) | 1.65 (0.36–2.91) | 0.389 | ||
| Lymphocyte count | Within normal range (F: 1.4–4.5 × 10⁹/L, M: 1.4–4.2 × 10⁹/L)2 | 25 (56.8%) | 72 (70.6%) | 0.109 | |
| Below normal range (<1.4 × 10⁹/L)2 | 18 (40.9%) | 30 (29.4%) | |||
| Above normal range (F: >4.5 × 10⁹/L, M: >4.2 × 10⁹/L)2 | 1 (2.3%) | 0 (0.0%) | |||
| Monocytes, % | 8.55 (3.90–15.70) | 7.65 (4.10–25.50) | 0.207 | ||
| Monocyte count, ×109/L | 0.39 (0.20–1.28) | 0.38 (0.15–0.93) | 0.286 | ||
| Monocyte count | Within normal range (F: 0.2–0.8 × 10⁹/L, M: 0.3–0.8 × 10⁹/L) 2 | 39 (88.6%) | 97 (95.1%) | 0.029 * | |
| Below normal range (F: <0.2 × 10⁹/L, M: <0.3 × 10⁹/L) 2 | 2 (4.5%) | 5 (4.9%) | |||
| Above normal range (>0.8 ×10⁹/L) 2 | 3 (6.8%) | 0 (0.0%) | |||
| Eosinophils, % | 2.00 (0.00–39.50) | 2.45 (0.00–33.30) | 0.316 | ||
| Eosinophil count, ×109/L | 0.12 (0.00–1.39) | 0.12 (0.00–1.52) | 0.564 | ||
| Eosinophil count | Within normal range (F: 0–0.4 × 10⁹/L, M: 0–0.95 × 10⁹/L) 2 | 41 (93.2%) | 98 (96.1%) | 0.431 | |
| Above normal range (F: >0.4 × 10⁹/L, M: >0.95 × 10⁹/L) 2 | 3 (6.8%) | 4 (3.9%) | |||
| Basophils, % | 0.50 (0.10–2.10) | 0.60 (0.00–1.70) | 0.471 | ||
| Basophil count, ×109/L | 0.03 (0.01–0.30) | 0.03 (0.00–0.07) | 0.856 | ||
| Basophil count | Within normal range (0–0.1 × 10⁹/L) 2 | 44 (100.0%) | 102 (100.0%) | - | |
| Above normal range (>0.1 × 10⁹/L) 2 | 0 (0.0%) | 0 (0.0%) | |||
| Immature cells, % | 0.30 (0.00–0.90) | 0.30 (0.00–3.70) | 0.884 | ||
| Immature cell count, ×109/L | 0.02 (0.00–0.09) | 0.02 (0.00–0.18) | 0.623 | ||
| CD45+ white cell count, ×109/L | 4.79 (2.35–11.31) | 4.74 (2.67–7.93) | 0.711 | ||
| CD45+ white cell count | Within normal range (4–10 × 109/L) 2 | 25 (59.5%) | 75 (72.8%) | 0.041 * | |
| Below normal range (<4 × 10⁹/L) 2 | 15 (35.7%) | 28 (27.2%) | |||
| Above normal range (>10 × 109/L) 2 | 2 (4.8%) | 0 (0.0%) | |||
| CD4 percentage of lymphocytes, % | 13.28 (2.86–41.69) | 14.57 (1.84–37.13) | 0.965 | ||
| CD4 percentage of lymphocytes | Within normal range (28–51%) 2 | 7 (16.7%) | 4 (3.9%) | 0.014 * | |
| Below normal range (<28%) 2 | 35 (83.3%) | 99 (96.1%) | |||
| Model A | |||||||
|---|---|---|---|---|---|---|---|
| Characteristic | Unadjusted Odds Ratio | 95% CI for Odds Ratio | Adjusted Odds Ratio | 95% CI for Odds Ratio | p-Value | ||
| Lower | Upper | Lower | Upper | ||||
| Age | 0.998 | 0.962 | 1.036 | 1.008 | 0.965 | 1.052 | 0.721 |
| Sex 1 | 1.235 | 0.582 | 2.617 | 0.785 | 0.323 | 1.908 | 0.593 |
| ART 2 | 1.040 | 0.194 | 5.572 | 0.323 | 0.046 | 2.279 | 0.257 |
| HIV VL control 3 | 2.667 | 1.019 | 6.977 | 2.915 | 1.035 | 8.210 | 0.043 |
| CD45 positive white cell count 4 | 0.672 | 0.312 | 1.446 | 0.737 | 0.312 | 1.744 | 0.488 |
| Mean corpuscular haemoglobin 5 | 0.000 | 0.000 | 0.000 | 0.000 | 0.000 | 0.000 | 0.999 |
| Sodium 6 | 2.168 | 1.003 | 4.687 | 2.327 | 0.958 | 5.651 | 0.062 |
| Model B | |||||||
| Characteristic | Unadjusted Odds Ratio | 95% CI for Odds Ratio | Adjusted Odds Ratio | 95% CI for Odds Ratio | p-Value | ||
| Lower | Upper | Lower | Upper | ||||
| Age | 0.998 | 0.962 | 1.036 | 1.001 | 0.962 | 1.041 | 0.975 |
| Sex 1 | 1.235 | 0.582 | 2.617 | 0.831 | 0.364 | 1.893 | 0.659 |
| ART 2 | 1.040 | 0.194 | 5.572 | 0.575 | 0.092 | 3.577 | 0.553 |
| HIV VL control 3 | 2.667 | 1.019 | 6.977 | 2.961 | 1.078 | 8.133 | 0.035 |
Publisher’s Note: MDPI stays neutral with regard to jurisdictional claims in published maps and institutional affiliations. |
© 2022 by the authors. Licensee MDPI, Basel, Switzerland. This article is an open access article distributed under the terms and conditions of the Creative Commons Attribution (CC BY) license (https://creativecommons.org/licenses/by/4.0/).
Share and Cite
Lambarey, H.; Blumenthal, M.J.; Chetram, A.; Joyimbana, W.; Jennings, L.; Tincho, M.B.; Burgers, W.A.; Orrell, C.; Schäfer, G. SARS-CoV-2 Infection Is Associated with Uncontrolled HIV Viral Load in Non-Hospitalized HIV-Infected Patients from Gugulethu, South Africa. Viruses 2022, 14, 1222. https://doi.org/10.3390/v14061222
Lambarey H, Blumenthal MJ, Chetram A, Joyimbana W, Jennings L, Tincho MB, Burgers WA, Orrell C, Schäfer G. SARS-CoV-2 Infection Is Associated with Uncontrolled HIV Viral Load in Non-Hospitalized HIV-Infected Patients from Gugulethu, South Africa. Viruses. 2022; 14(6):1222. https://doi.org/10.3390/v14061222
Chicago/Turabian StyleLambarey, Humaira, Melissa J. Blumenthal, Abeen Chetram, Wendy Joyimbana, Lauren Jennings, Marius B. Tincho, Wendy A. Burgers, Catherine Orrell, and Georgia Schäfer. 2022. "SARS-CoV-2 Infection Is Associated with Uncontrolled HIV Viral Load in Non-Hospitalized HIV-Infected Patients from Gugulethu, South Africa" Viruses 14, no. 6: 1222. https://doi.org/10.3390/v14061222