
Inflammatory Gene Expression Associates with Hepatitis B Virus cccDNA- but Not Integrant-Derived Transcripts in HBeAg Negative Disease


 , , , ,
  , , and
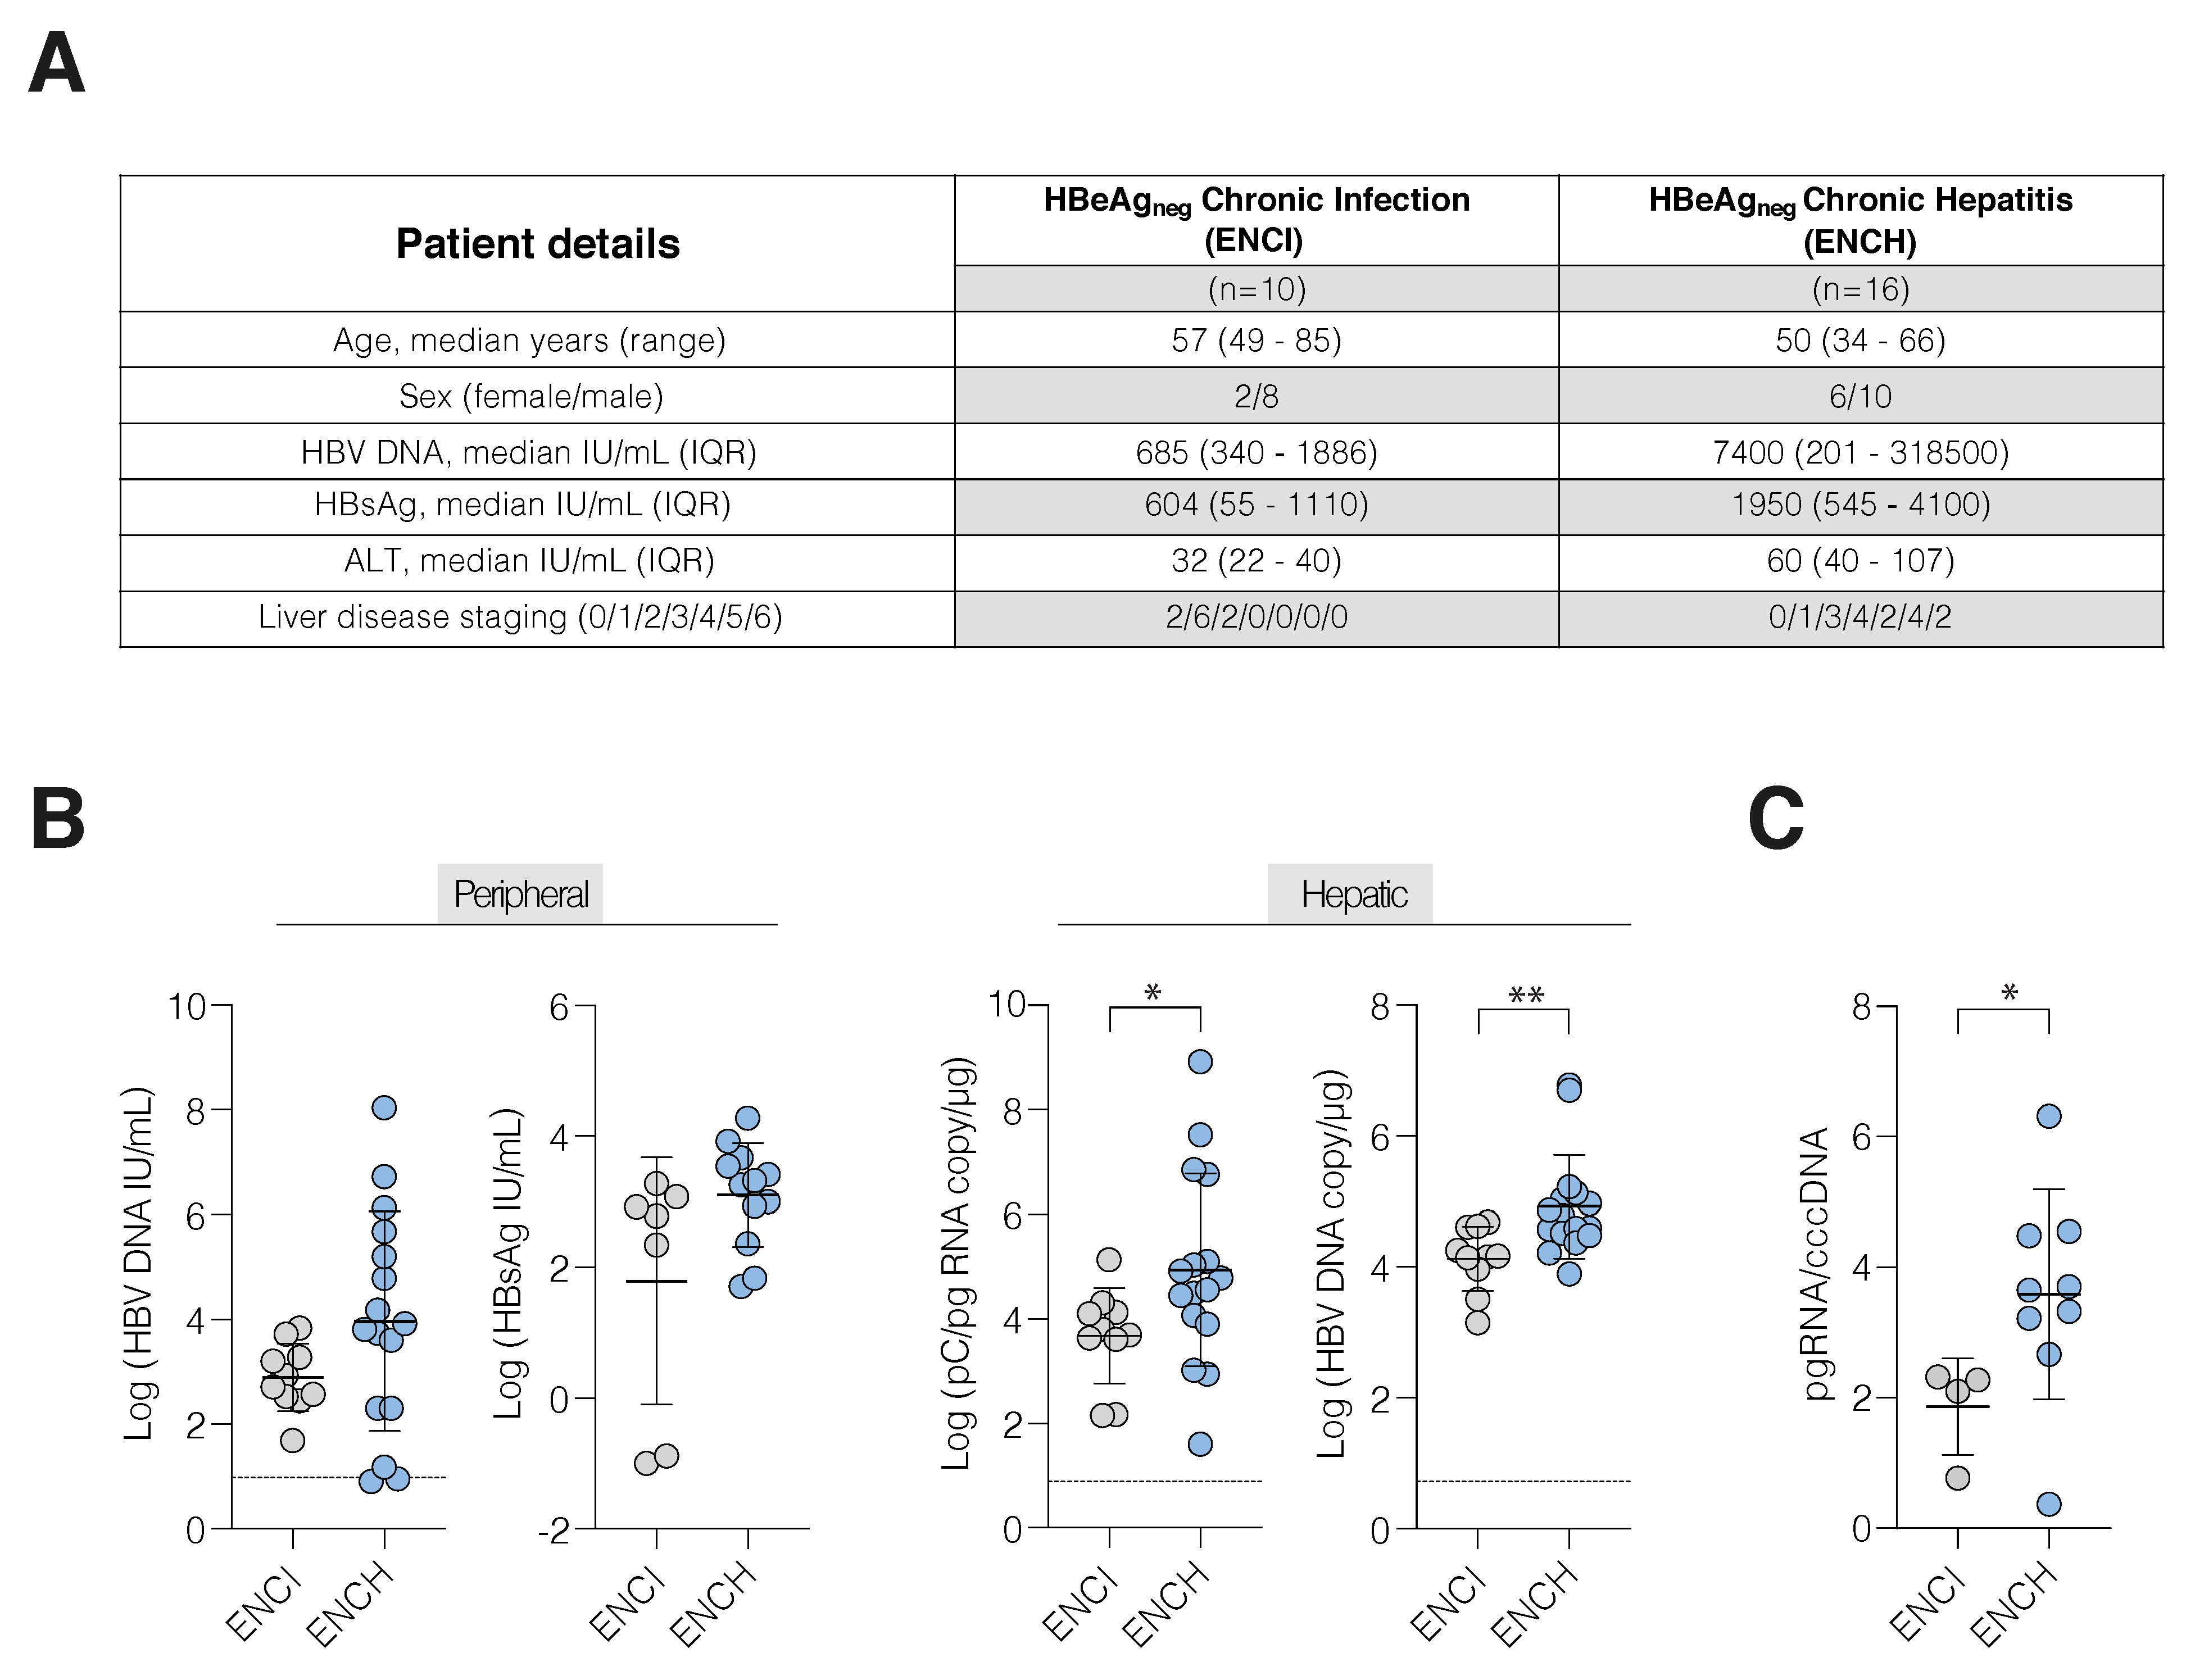
Abstract
:1. Introduction
2. Materials and Methods
2.1. Liver Biopsies, RNA Extraction and HBV Antigen Immunohistochemistry
2.2. Peripheral HBsAg Quantification
2.3. RNA and DNA Extraction
2.4. Quantification of HBV Transcripts
2.5. Quantification of HBV DNA
2.6. Nanostring Inflammatory Gene Analysis
2.7. Pathway Analysis
2.8. Single Cell RNA-Seq Analysis
2.9. Statistics
3. Results
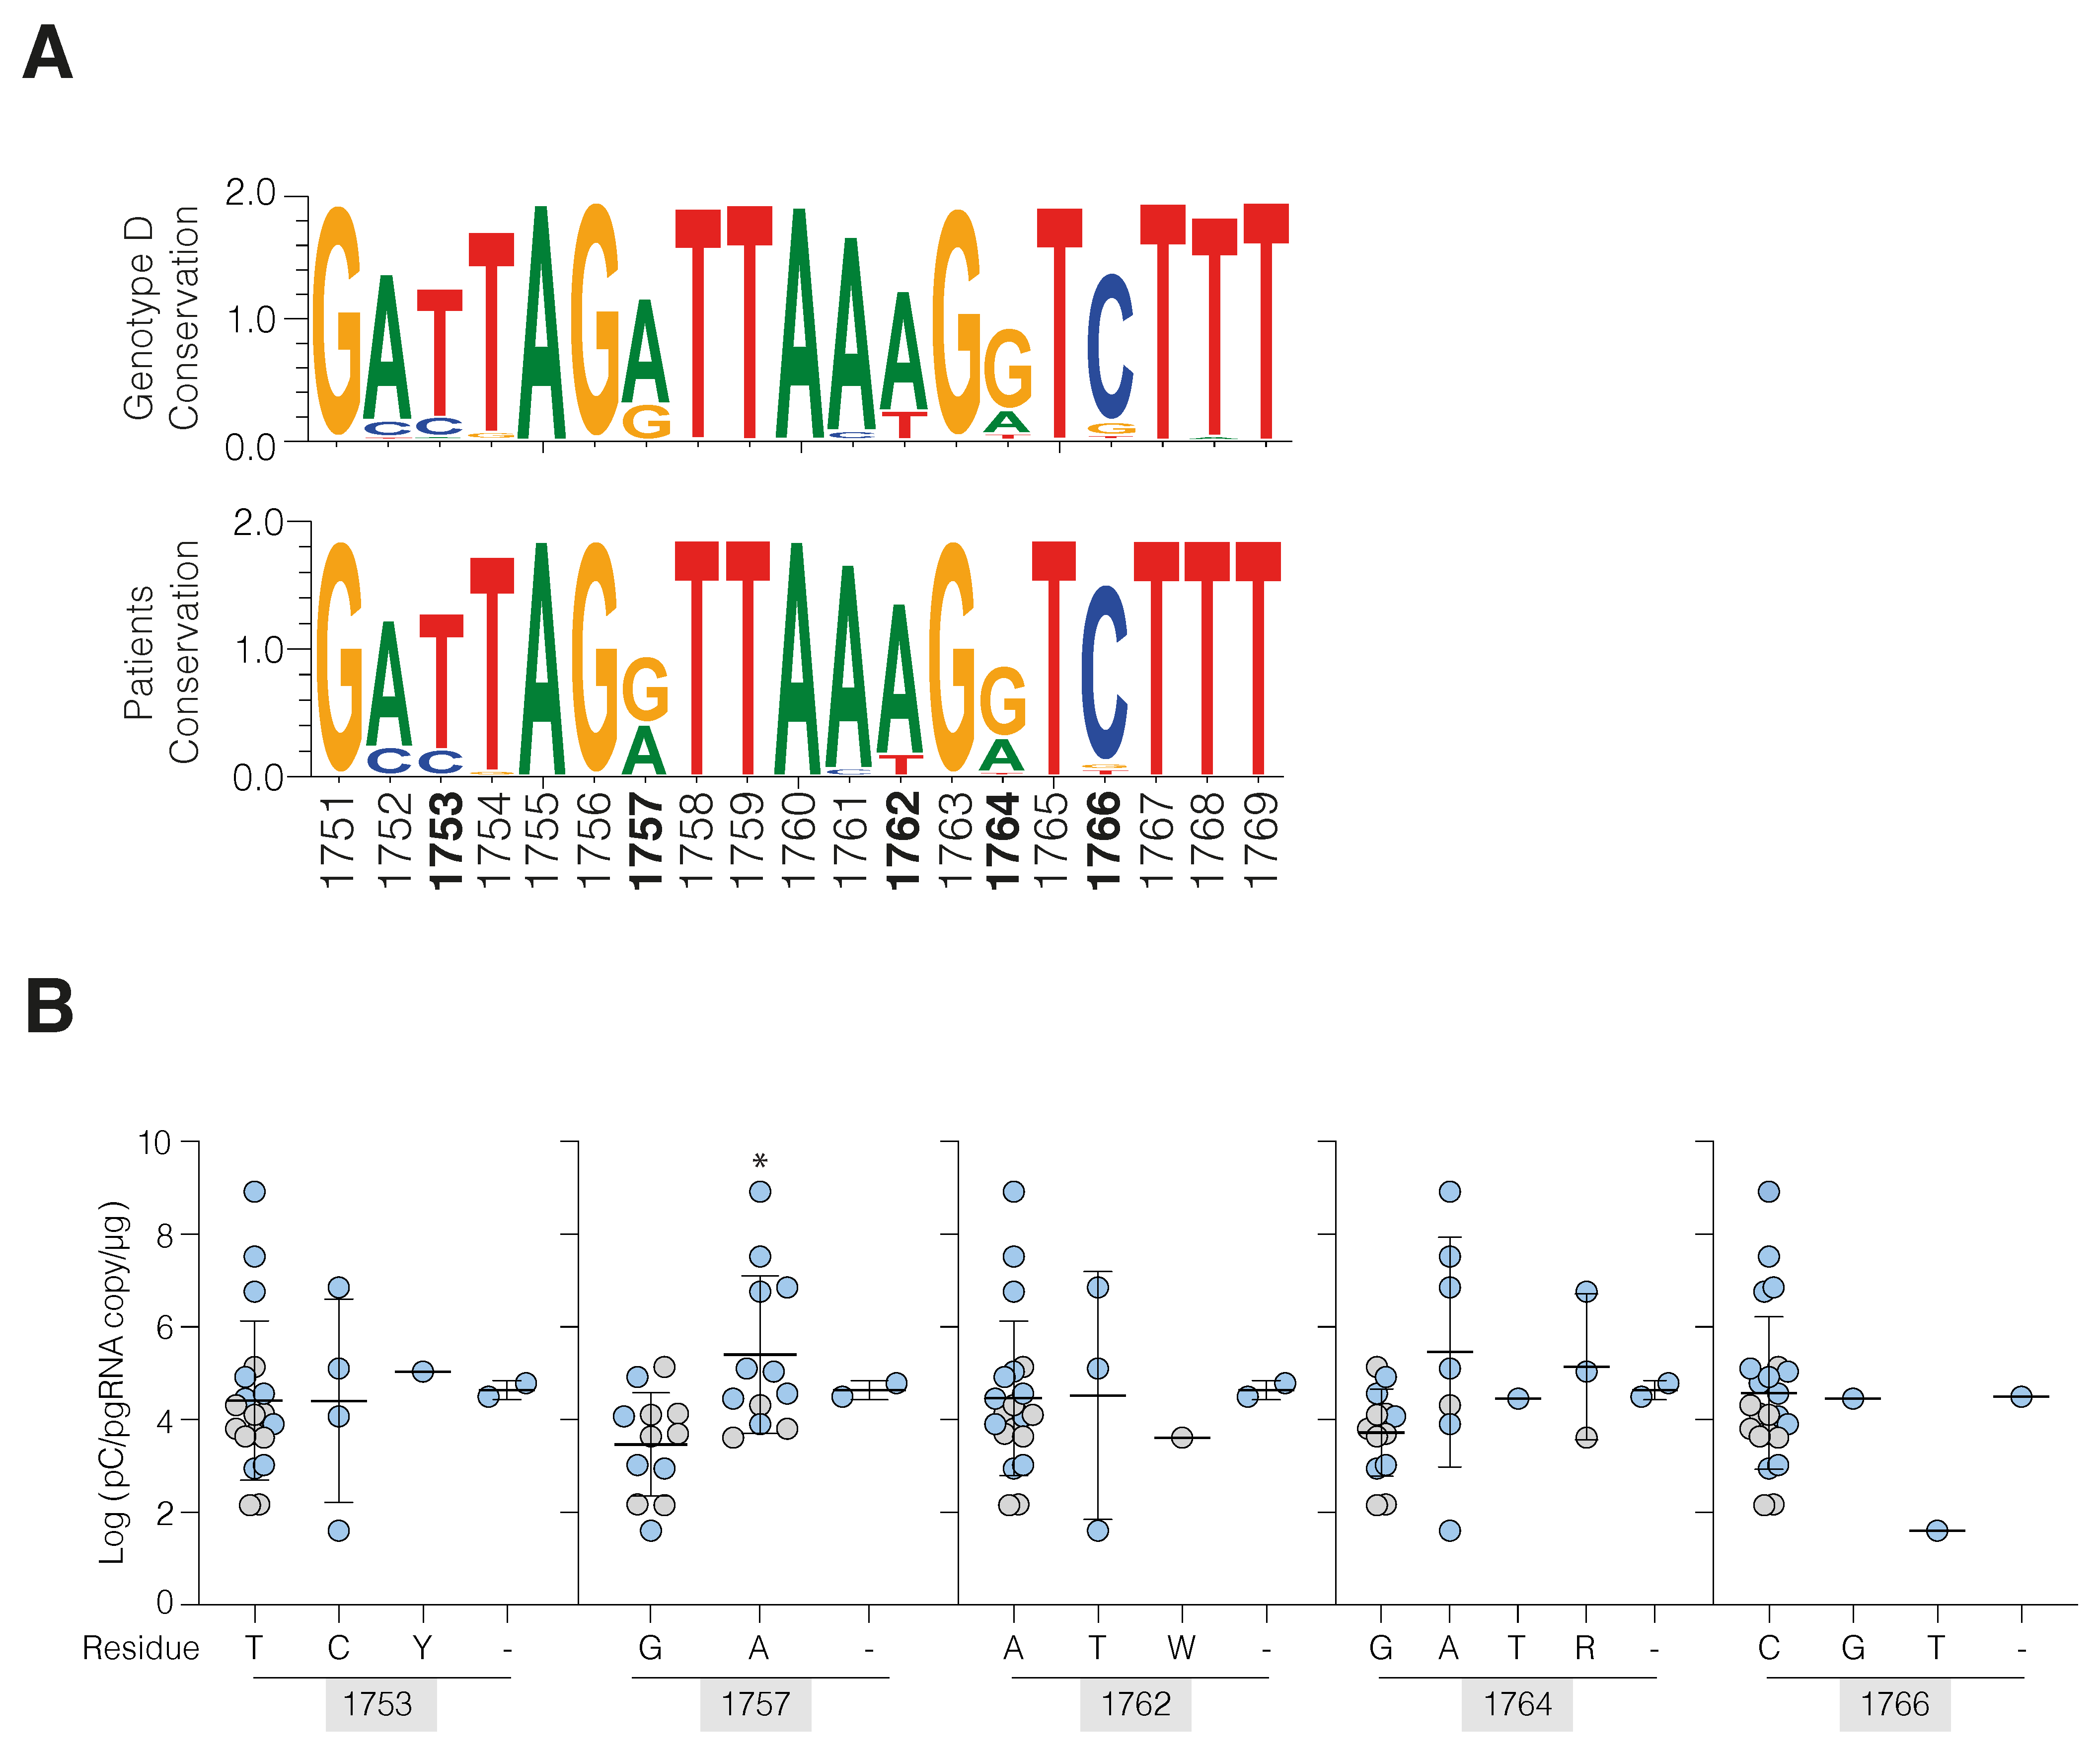
3.1. Increased HBV Transcription in Active Hepatitis
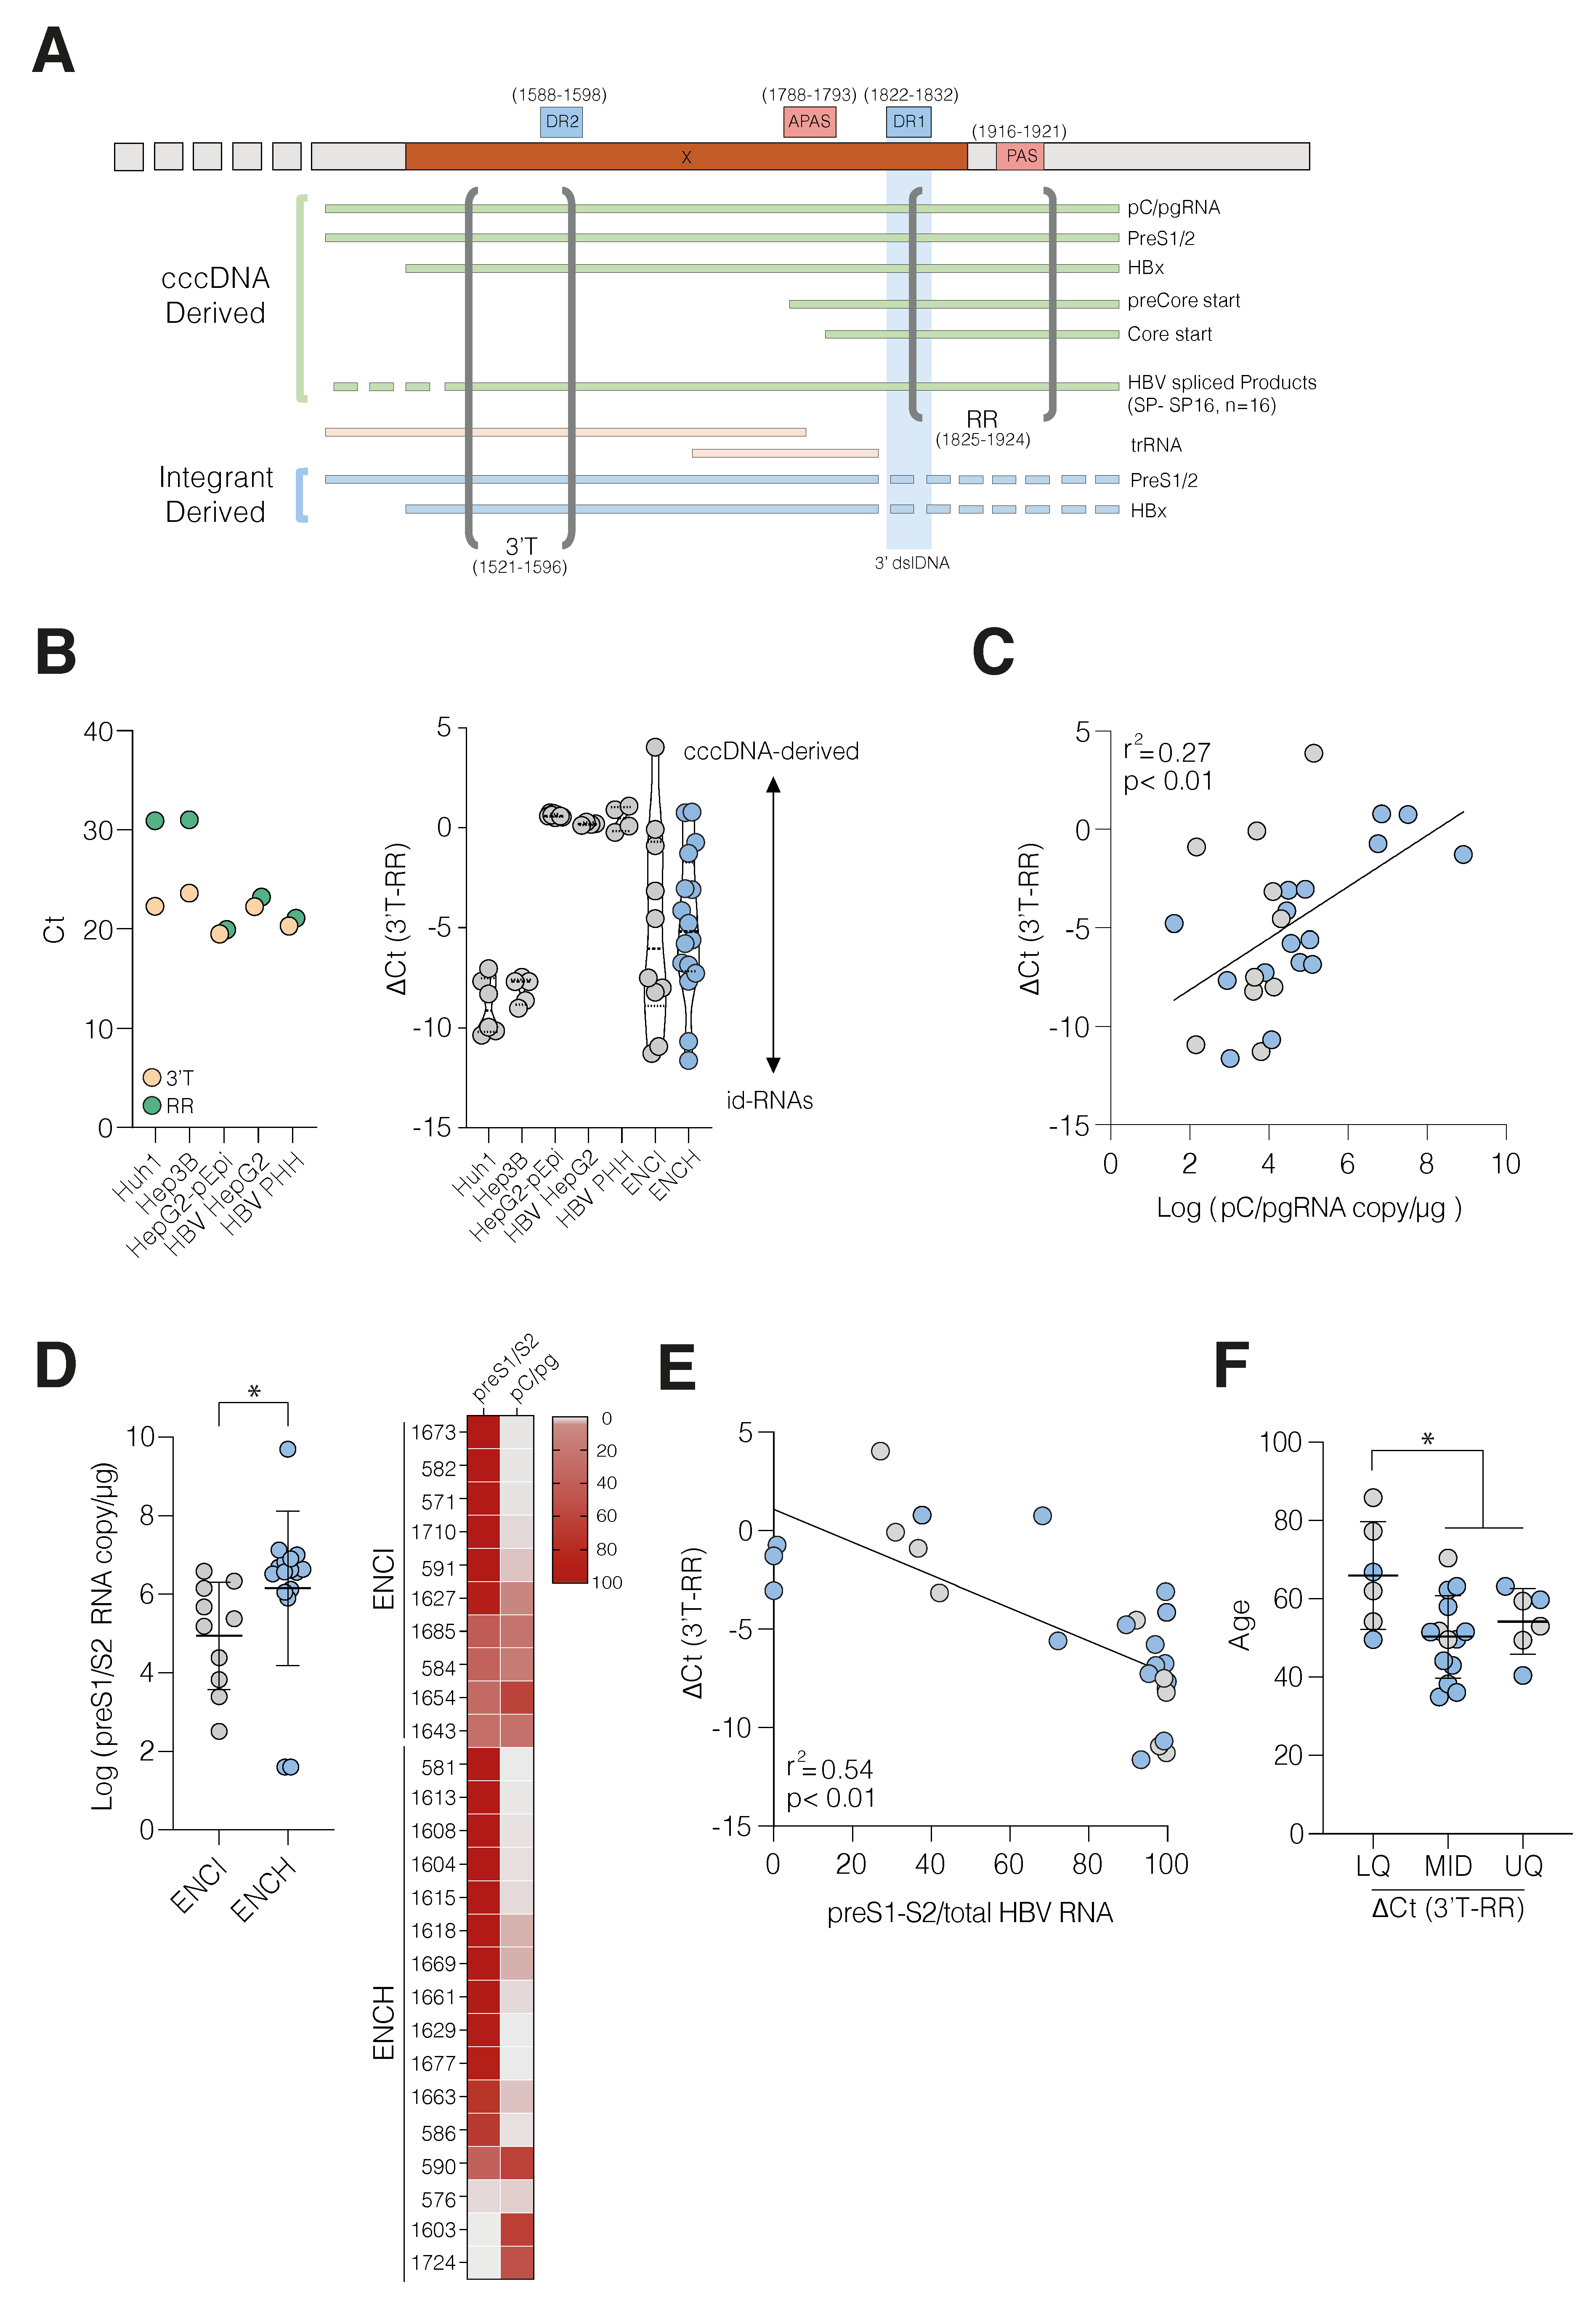
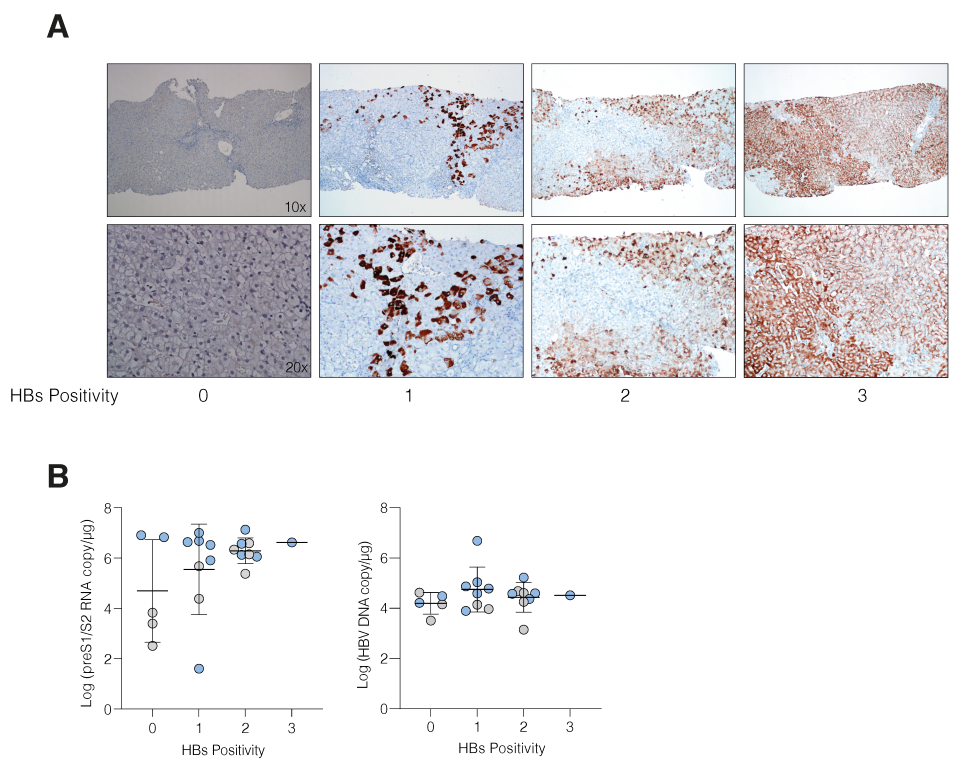
3.2. HBV cccDNA and Integrant-Derived RNAs and Antigen Expression
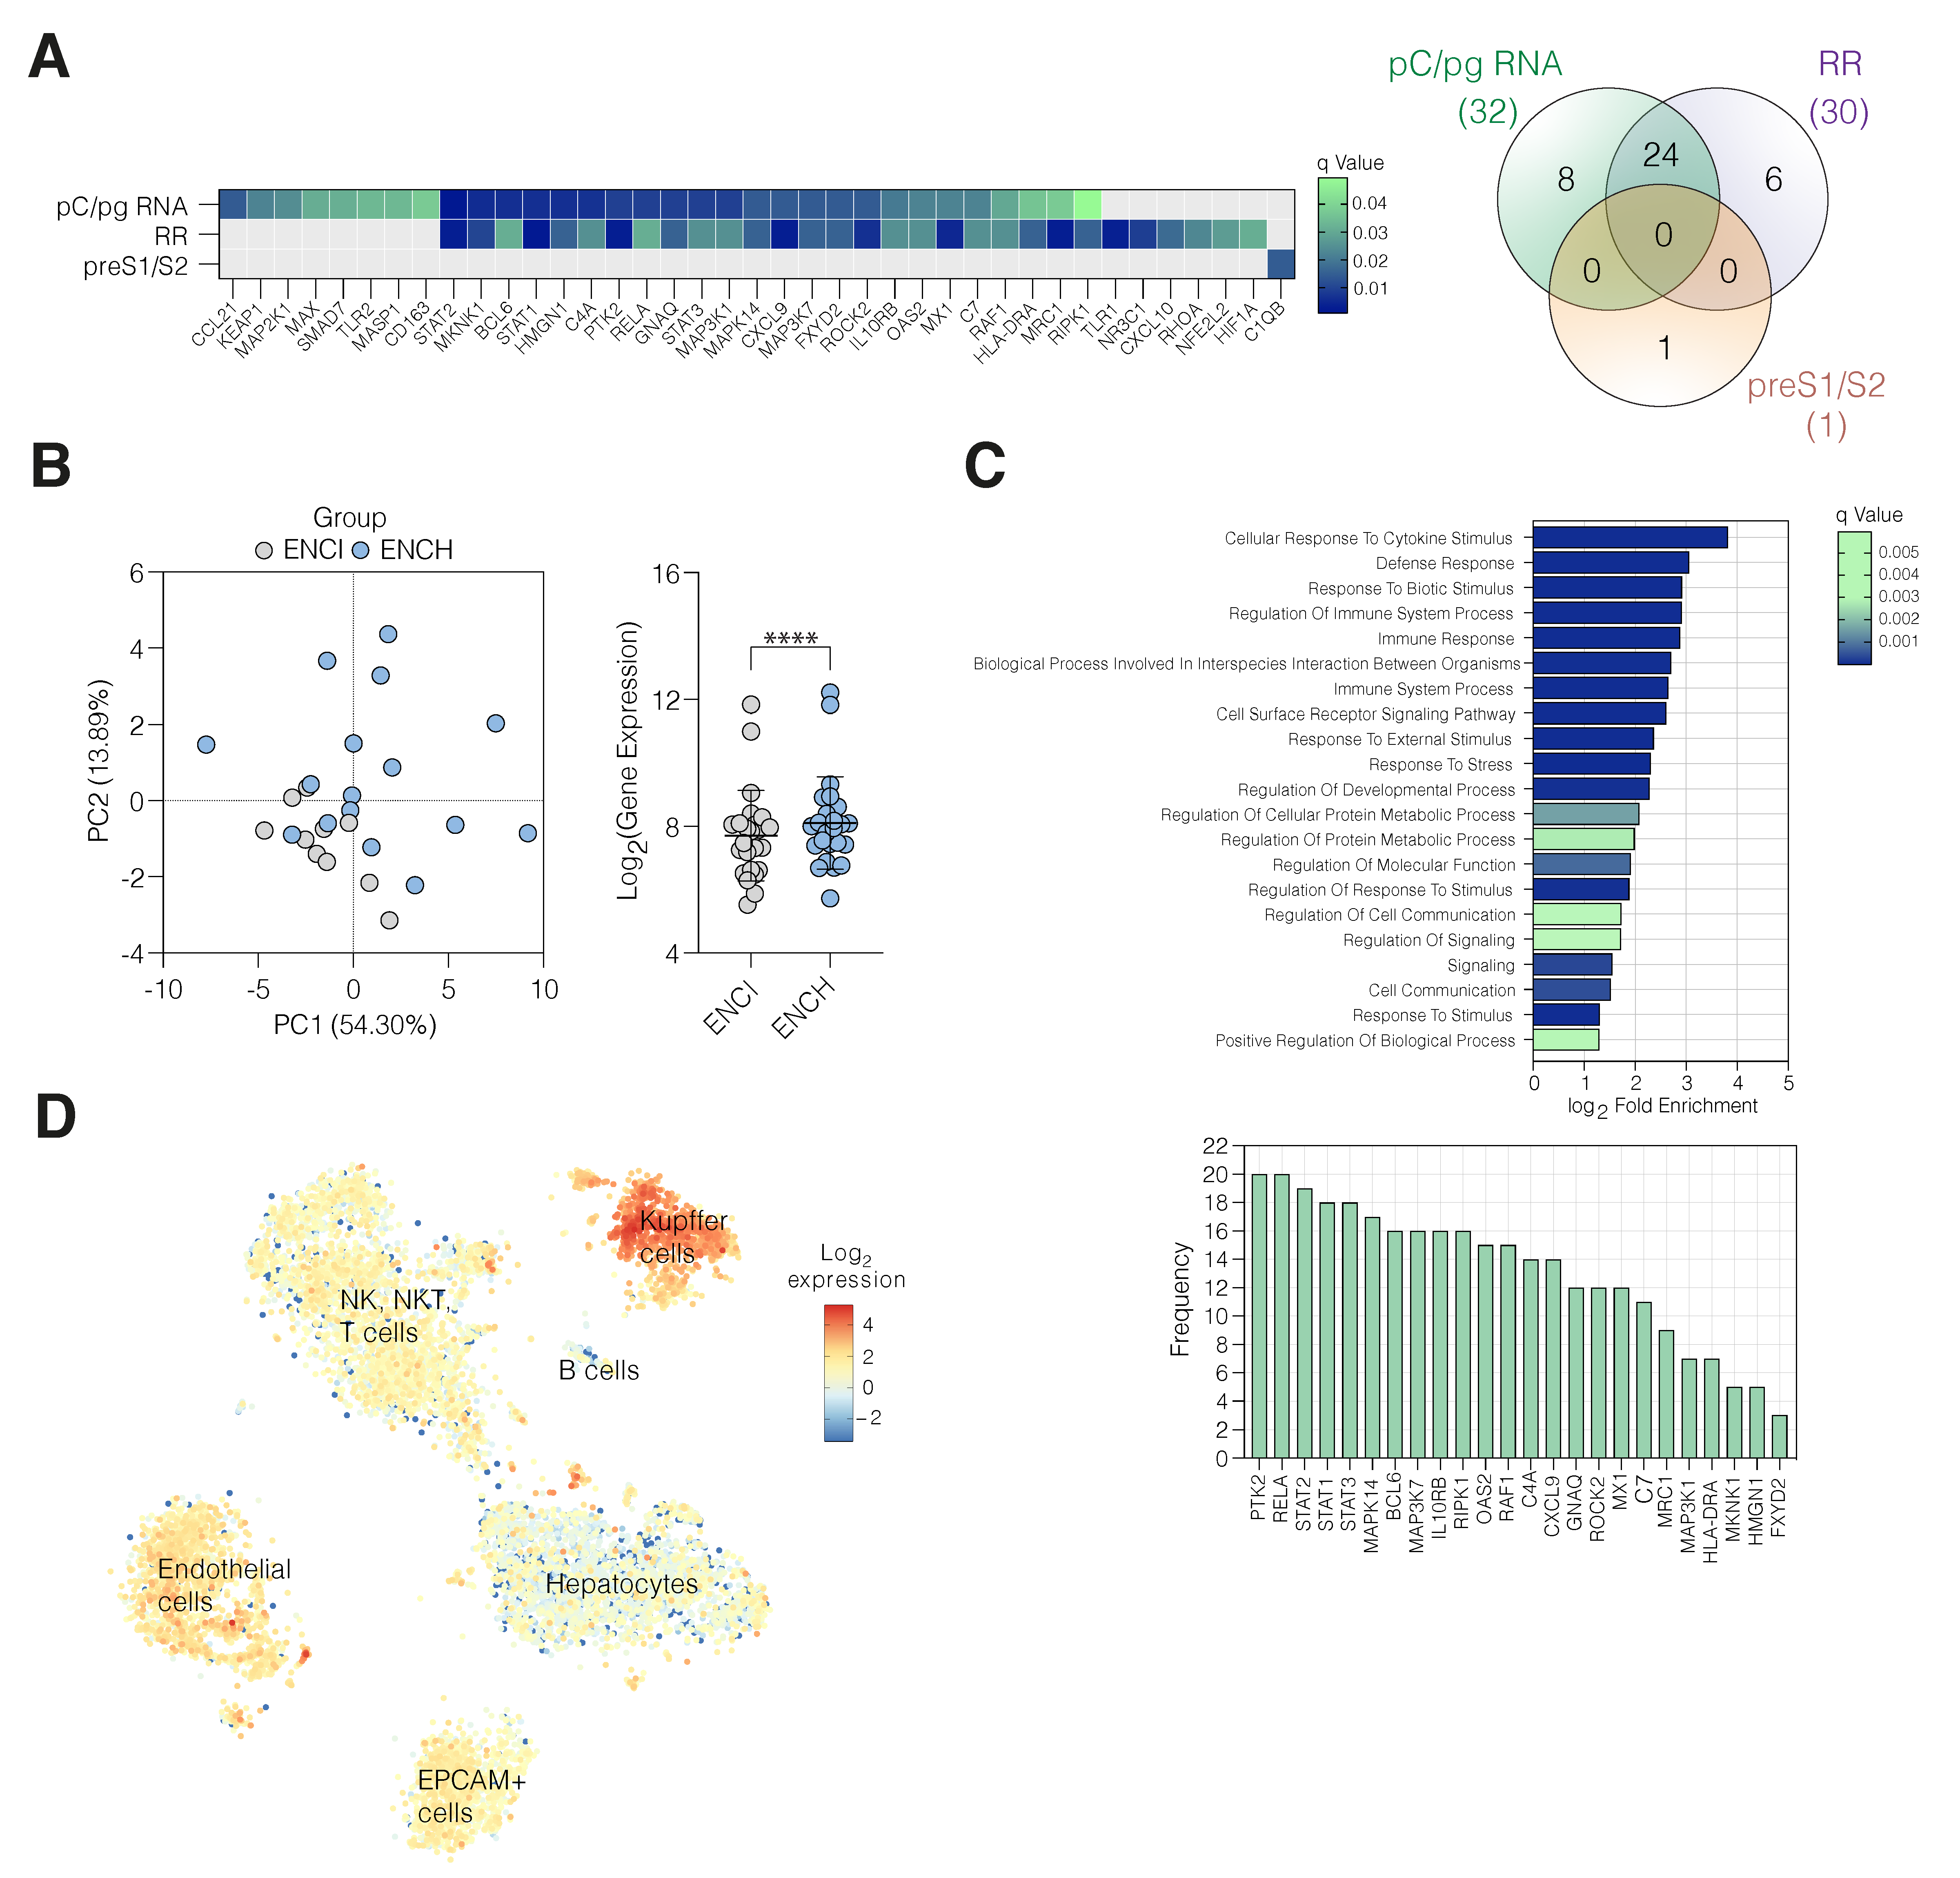
3.3. Active HBV Replication Associates with Inflammatory Gene Expression
4. Conclusions
Supplementary Materials
Author Contributions
Funding
Institutional Review Board Statement
Informed Consent Statement
Data Availability Statement
Acknowledgments
Conflicts of Interest
References
- Rehermann, B.; Thimme, R. Insights from Antiviral Therapy into Immune Responses to Hepatitis B and C Virus Infection. Gastroenterology 2019, 156, 369–383. [Google Scholar] [CrossRef] [PubMed]
- Maini, M.K.; Pallett, L.J. Defective T-cell immunity in hepatitis B virus infection: Why therapeutic vaccination needs a helping hand. Lancet Gastroenterol. Hepatol. 2018, 3, 192–202. [Google Scholar] [CrossRef]
- Turton, K.L.; Meier-Stephenson, V.; Badmalia, M.D.; Coffin, C.S.; Patel, T.R. Host Transcription Factors in Hepatitis B Virus RNA Synthesis. Viruses 2020, 12, 160. [Google Scholar] [CrossRef] [Green Version]
- Belloni, L.; Allweiss, L.; Guerrieri, F.; Pediconi, N.; Volz, T.; Pollicino, T.; Petersen, J.; Raimondo, G.; Dandri, M.; Levrero, M. IFN-α inhibits HBV transcription and replication in cell culture and in humanized mice by targeting the epigenetic regulation of the nuclear cccDNA minichromosome. J. Clin. Investig. 2012, 122, 529–537. [Google Scholar] [CrossRef] [Green Version]
- Tropberger, P.; Mercier, A.; Robinson, M.; Zhong, W.; Ganem, D.E.; Holdorf, M. Mapping of histone modifications in episomal HBV cccDNA uncovers an unusual chromatin organization amenable to epigenetic manipulation. Proc. Natl. Acad. Sci. USA 2015, 112, E5715–E5724. [Google Scholar] [CrossRef] [Green Version]
- Wu, J.; Meng, Z.; Jiang, M.; Pei, R.; Trippler, M.; Broering, R.; Bucchi, A.; Sowa, J.-P.; Dittmer, U.; Yang, D.; et al. Hepatitis B virus suppresses toll-like receptor-mediated innate immune responses in murine parenchymal and nonparenchymal liver cells. Hepatology 2008, 49, 1132–1140. [Google Scholar] [CrossRef] [PubMed]
- Ma, Z.; Cao, Q.; Xiong, Y.; Zhang, E.; Lu, M. Interaction between Hepatitis B Virus and Toll-Like Receptors: Current Status and Potential Therapeutic Use for Chronic Hepatitis B. Vaccines 2018, 6, 6. [Google Scholar] [CrossRef] [PubMed] [Green Version]
- Xia, Y.; Guo, H. Hepatitis B virus cccDNA: Formation, regulation and therapeutic potential. Antivir. Res. 2020, 180, 104824. [Google Scholar] [CrossRef] [PubMed]
- Lythgoe, K.A.; Lumley, S.F.; Pellis, L.; McKeating, J.A.; Matthews, P.C. Estimating hepatitis B virus cccDNA persistence in chronic infection. Virus Evol. 2020, 7, veaa063. [Google Scholar] [CrossRef]
- Suslov, A.; Meier, M.A.; Ketterer, S.; Wang, X.; Wieland, S.; Heim, M.H. Transition to HBeAg-negative chronic hepatitis B virus in-fection is associated with reduced cccDNA transcriptional activity. J. Hepatol. 2021, 74, 794–800. [Google Scholar] [CrossRef]
- Lim, C.S.; Sozzi, V.; Littlejohn, M.; Yuen, L.K.; Warner, N.; Betz-Stablein, B.; Luciani, F.; Revill, P.A.; Brown, C.M. Quantitative analysis of the splice variants ex-pressed by the major hepatitis B virus genotypes. Microb. Genom. 2021, 7, mgen000492. [Google Scholar]
- Tu, T.; Budzinska, M.A.; Shackel, N.A.; Urban, S. HBV DNA Integration: Molecular Mechanisms and Clinical Implications. Viruses 2017, 9, 75. [Google Scholar] [CrossRef] [PubMed]
- Wooddell, C.I.; Yuen, M.-F.; Chan, H.L.-Y.; Gish, R.G.; Locarnini, S.A.; Chavez, D.; Ferrari, C.; Given, B.D.; Hamilton, J.; Kanner, S.B.; et al. RNAi-based treatment of chronically infected patients and chimpanzees reveals that integrated hepatitis B virus DNA is a source of HBsAg. Sci. Transl. Med. 2017, 9, eaan0241. [Google Scholar] [CrossRef] [PubMed] [Green Version]
- Meier, M.-A.; Calabrese, D.; Suslov, A.; Terracciano, L.M.; Heim, M.H.; Wieland, S. Ubiquitous expression of HBsAg from integrated HBV DNA in patients with low viral load. J. Hepatol. 2021, 75, 840–847. [Google Scholar] [CrossRef] [PubMed]
- European Association for the Study of the Liver (EASL). Clinical Practice Guidelines on the management of hepatitis B virus infection. J. Hepatol. 2017, 67, 370–398. [Google Scholar] [CrossRef] [Green Version]
- Testoni, B.; Lebossé, F.; Scholtes, C.; Berby, F.; Miaglia, C.; Subic, M.; Loglio, A.; Facchetti, F.; Lampertico, P.; Levrero, M.; et al. Serum hepatitis B core-related antigen (HBcrAg) correlates with covalently closed circular DNA transcriptional activity in chronic hepatitis B patients. J. Hepatol. 2019, 70, 615–625. [Google Scholar] [CrossRef]
- Loomba, R.; Liang, T.J. Hepatitis B Reactivation Associated with Immune Suppressive and Biological Modifier Therapies: Current Concepts, Management Strategies, and Future Directions. Gastroenterology 2017, 152, 1297–1309. [Google Scholar] [CrossRef] [Green Version]
- Revill, P.A.; Chisari, F.V.; Block, J.M.; Dandri, M.; Gehring, A.J.; Guo, H.; Hu, J.; Kramvis, A.; Lampertico, P.; Janssen, H.L.A.; et al. A global scientific strategy to cure hepatitis B. Lancet Gastroenterol. Hepatol. 2019, 4, 545–558. [Google Scholar] [CrossRef]
- Ishak, K.; Baptista, A.; Bianchi, L.; Callea, F.; De Groote, J.; Gudat, F.; Denk, H.; Desmet, V.; Korb, G.; Macsween, R.N.; et al. Histological grading and staging of chronic hepatitis. J. Hepatol. 1995, 22, 696–699. [Google Scholar] [CrossRef]
- D’Arienzo, V.; Magri, A.; Harris, J.M.; Wing, P.A.C.; Ko, C.; Rubio, C.O.; Revill, P.A.; Protzer, U.; Balfe, P.; McKeating, J.A. A PCR assay to quantify patterns of HBV transcription. J. Gen. Virol. 2021, 102, 001373. [Google Scholar] [CrossRef]
- Lebossé, F.; Inchauspé, A.; Locatelli, M.; Miaglia, C.; Diederichs, A.; Fresquet, J.; Chapus, F.; Hamed, K.; Testoni, B.; Zoulim, F. Quantification and epigenetic evaluation of the residual pool of hepatitis B covalently closed circular DNA in long-term nucleoside analogue-treated patients. Sci. Rep. 2020, 10, 21097. [Google Scholar] [CrossRef] [PubMed]
- Lucifora, J.; Salvetti, A.; Marniquet, X.; Mailly, L.; Testoni, B.; Fusil, F.; Inchauspé, A.; Michelet, M.; Michel, M.L.; Levrero, M.; et al. Detection of the hepatitis B virus (HBV) covalent-ly-closed-circular DNA (cccDNA) in mice transduced with a recombinant AAV-HBV vector. Antivir. Res. 2017, 145, 14–19. [Google Scholar] [CrossRef]
- Aizarani, N.; Saviano, A.; Sagar Mailly, L.; Durand, S.; Herman, J.S.; Pessaux, P.; Baumert, T.F.; Grün, D. A human liver cell atlas reveals heterogeneity and epithelial progenitors. Nature 2019, 572, 199–204. [Google Scholar] [CrossRef] [PubMed]
- Prakash, K.; Larsson, S.B.; Rydell, G.E.; Andersson, M.E.; Ringlander, J.; Norkrans, G.; Norder, H.; Lindh, M. Hepatitis B Virus RNA Profiles in Liver Biopsies by Digital Polymerase Chain Reaction. Hepatol. Commun. 2020, 4, 973–982. [Google Scholar] [CrossRef] [PubMed]
- Siddiqui, Z.I.; Farooqui, S.R.; Azam, S.A.; Afroz, M.; Wajid, S.; Parveen, S.; Kazim, S.N. A comparative study of hepatitis B virus X protein mutants K130M, V131I and KV130/131MI to investigate their roles in fibrosis, cirrhosis and hepatocellular carcinoma. J. Viral Hepat. 2017, 24, 1121–1131. [Google Scholar] [CrossRef]
- Ren, X.; Xu, Z.; Liu, Y.; Li, X.; Bai, S.; Ding, N.; Zhong, Y.; Wang, L.; Mao, P.; Zoulim, F.; et al. Hepatitis B virus genotype and basal core promoter/precore mutations are associated with hepatitis B-related acute-on-chronic liver failure without pre-existing liver cirrhosis. J. Viral Hepat. 2010, 17, 887–895. [Google Scholar] [CrossRef] [Green Version]
- Lyu, H.; Lee, D.; Chung, Y.H.; Kim, J.A.; Lee, J.H.; Jin, Y.J.; Park, W.; Mathews, P.; Jaffee, E.; Zheng, L.; et al. Synergistic effects of A1896, T1653 and T1762/A1764 mutations in genotype c2 hepatitis B virus on development of hepatocellular carcinoma. J. Viral Hepat. 2013, 20, 219–224. [Google Scholar] [CrossRef] [Green Version]
- Sendi, H.; Mehrab-Mohseni, M.; Zali, M.R.; Norder, H.; Magnius, L.O. T1764G1766 core promoter double mutants are restricted to Hepatitis B virus strains with an A1757 and are common in genotype D. J. Gen. Virol. 2005, 86, 2451–2458. [Google Scholar] [CrossRef]
- Freitas, N.; Lukash, T.; Gunewardena, S.; Chappell, B.; Slagle, B.L.; Gudima, S.O. Relative Abundance of Integrant-Derived Viral RNAs in Infected Tissues Harvested from Chronic Hepatitis B Virus Carriers. J. Virol. 2018, 92. [Google Scholar] [CrossRef] [Green Version]
- Al-Anazi, M.R.; Nazir, N.; Colak, D.; Al-Ahdal, M.N.; Al-Qahtani, A.A. Deletion and Functional Analysis of Hepatitis B Virus X Protein: Evidence for an Effect on Cell Cycle Regulators. Cell. Physiol. Biochem. 2018, 49, 1987–1998. [Google Scholar] [CrossRef]
- Ramirez, R.; van Buuren, N.; Gamelin, L.; Soulette, C.; May, L.; Han, D.; Yu, M.; Choy, R.; Cheng, G.; Bhardwaj, N.; et al. Targeted Long-Read Sequencing Reveals Compre-hensive Architecture, Burden, and Transcriptional Signatures from Hepatitis B Virus-Associated Integrations and Transloca-tions in Hepatocellular Carcinoma Cell Lines. J. Virol. 2021, 95, e0029921. [Google Scholar] [CrossRef] [PubMed]
- Wing, P.A.C.; Liu, P.J.; Harris, J.M.; Magri, A.; Michler, T.; Zhuang, X.; Borrmann, H.; Minisini, R.; Frampton, N.R.; Wettengel, J.M.; et al. Hypoxia inducible factors regulate hepatitis B virus rep-lication by activating the basal core promoter. J. Hepatol. 2021, 75, 64–73. [Google Scholar] [CrossRef] [PubMed]
- Larsson, S.B.; Tripodi, G.; Raimondo, G.; Saitta, C.; Norkrans, G.; Pollicino, T.; Lindh, M. Integration of hepatitis B virus DNA in chronically infected patients assessed by Alu-PCR. J. Med. Virol. 2018, 90, 1568–1575. [Google Scholar] [CrossRef] [PubMed]
- Mason, W.S.; Gill, U.S.; Litwin, S.; Zhou, Y.; Peri, S.; Pop, O.; Hong, M.; Naik, S.; Quaglia, A.; Bertoletti, A.; et al. HBV DNA Integration and Clonal Hepatocyte Expansion in Chronic Hepatitis B Patients Considered Immune Tolerant. Gastroenterology 2016, 151, 986–998.e984. [Google Scholar] [CrossRef] [PubMed] [Green Version]
- Mi, H.; Ebert, D.; Muruganujan, A.; Mills, C.; Albou, L.P.; Mushayamaha, T.; Thomas, P.D. PANTHER version 16: A revised family classifi-cation, tree-based classification tool, enhancer regions and extensive API. Nucleic Acids Res. 2021, 49, D394–D403. [Google Scholar] [CrossRef]
- Kidd, A.H.; Kidd-Ljunggren, K. A revised secondary structure model for the 3’-end of hepatitis B virus pregenomic RNA. Nucleic Acids Res. 1996, 24, 3295–3301. [Google Scholar] [CrossRef] [Green Version]
- Cornberg, M.; Wong, V.W.-S.; Locarnini, S.; Brunetto, M.R.; Janssen, H.L.A.; Chan, H.L.-Y. The role of quantitative hepatitis B surface antigen revisited. J. Hepatol. 2017, 66, 398–411. [Google Scholar] [CrossRef] [Green Version]
- Fisicaro, P.; Barili, V.; Rossi, M.; Montali, I.; Vecchi, A.; Acerbi, G.; Laccabue, D.; Zecca, A.; Penna, A.; Missale, G.; et al. Pathogenetic Mechanisms of T Cell Dysfunction in Chronic HBV Infection and Related Therapeutic Approaches. Front. Immunol. 2020, 11, 849. [Google Scholar] [CrossRef]
- Le Bert, N.; Gill, U.S.; Hong, M.; Kunasegaran, K.; Tan, D.Z.M.; Ahmad, R.; Cheng, Y.; Dutertre, C.A.; Heinecke, A.; Rivino, L. Effects of Hepatitis B Surface Antigen on Virus-Specific and Global T Cells in Patients with Chronic Hepatitis B Virus infection. Gastroenterology 2020, 159, 652–664. [Google Scholar] [CrossRef]
- Lok, A.S.; Zoulim, F.; Dusheiko, G.; Ghany, M.G. Hepatitis B cure: From discovery to regulatory approval. Hepatology 2017, 66, 1296–1313. [Google Scholar] [CrossRef]
- Erken, R.; Loukachov, V.; van Dort, K.; van den Hurk, A.V.D.; Takkenberg, R.B.; de Niet, A.; Jansen, L.; Willemse, S.; Reesink, H.W.; Kootstra, N. Quantified integrated hepatitis B virus is related to viral activity in patients with chronic hepatitis B. Hepatology 2022, 2022, hep.32352. [Google Scholar] [CrossRef] [PubMed]
- Chang, M.-L.; Liaw, Y.-F. Hepatitis B flares in chronic hepatitis B: Pathogenesis, natural course, and management. J. Hepatol. 2014, 61, 1407–1417. [Google Scholar] [CrossRef] [PubMed] [Green Version]
- Liu, P.J.; Harris, J.M.; Marchi, E.; D’Arienzo, V.; Michler, T.; Wing, P.A.C.; Magri, A.; Ortega-Prieto, A.M.; van de Klundert, M.; Wettengel, J.; et al. Hypoxic gene expression in chronic hepatitis B virus infected patients is not observed in state-of-the-art in vitro and mouse infection models. Sci. Rep. 2020, 10, 14101. [Google Scholar] [CrossRef] [PubMed]
- Kim, H.; Nguyen, N.P.; Turner, K.; Wu, S.; Gujar, A.D.; Luebeck, J.; Liu, J.; Deshpande, V.; Rajkumar, U.; Namburi, S.; et al. Extrachromosomal DNA is associated with oncogene am-plification and poor outcome across multiple cancers. Nat. Genet. 2020, 52, 891–897. [Google Scholar] [CrossRef]
- Zhang, D.; Zhang, K.; Protzer, U.; Zeng, C. HBV Integration Induces Complex Interactions between Host and Viral Genomic Functions at the Insertion Site. J. Clin. Transl. Hepatol. 2021, 9, 399. [Google Scholar] [CrossRef]
- Christen, V.; Duong, F.; Bernsmeier, C.; Sun, D.; Nassal, M.; Heim, M.H. Inhibition of Alpha Interferon Signaling by Hepatitis B Virus. J. Virol. 2007, 81, 159–165. [Google Scholar] [CrossRef] [Green Version]
- Faure-Dupuy, S.; Durantel, D.; Lucifora, J. Liver macrophages: Friend or foe during hepatitis B infection? Liver Int. 2018, 38, 1718–1729. [Google Scholar] [CrossRef] [Green Version]
- Boltjes, A.; Van Montfoort, N.; Biesta, P.J.; Op den Brouw, M.L.; Kwekkeboom, J.; van der Laan, L.; Janssen, H.L.; Boonstra, A.; Woltman, A.M. Kupffer Cells Interact with Hepatitis B Surface Antigen In Vivo and In Vitro, Leading to Proinflammatory Cytokine Production and Natural Killer Cell Function. J. Infect. Dis. 2014, 211, 1268–1278. [Google Scholar] [CrossRef] [Green Version]
- Huang, S.; Zou, S.; Chen, M.; Gao, X.; Chen, L.; Yang, X.; Yu, Q.; Zhao, X.; Du, Y.; Yang, X.; et al. Local Stimulation of Liver Sinusoidal Endothelial Cells with a NOD1 Agonist Activates T Cells and Suppresses Hepatitis B Virus Replication in Mice. J. Immunol. 2018, 200, 3170–3179. [Google Scholar] [CrossRef]
- Du, Y.; Yan, H.; Zou, S.; Khera, T.; Li, J.; Han, M.; Yang, X.; Wang, B.; Sun, S.; Zheng, X.; et al. Natural Killer Cells Regulate the Maturation of Liver Sinusoidal Endothelial Cells Thereby Promoting Intrahepatic T-Cell Responses in a Mouse Model. Hepatol. Commun. 2021, 5, 865–881. [Google Scholar] [CrossRef]


Publisher’s Note: MDPI stays neutral with regard to jurisdictional claims in published maps and institutional affiliations. |
© 2022 by the authors. Licensee MDPI, Basel, Switzerland. This article is an open access article distributed under the terms and conditions of the Creative Commons Attribution (CC BY) license (https://creativecommons.org/licenses/by/4.0/).
Share and Cite
Magri, A.; Harris, J.M.; D’Arienzo, V.; Minisini, R.; Jühling, F.; Wing, P.A.C.; Rapetti, R.; Leutner, M.; Testoni, B.; Baumert, T.F.; et al. Inflammatory Gene Expression Associates with Hepatitis B Virus cccDNA- but Not Integrant-Derived Transcripts in HBeAg Negative Disease. Viruses 2022, 14, 1070. https://doi.org/10.3390/v14051070
Magri A, Harris JM, D’Arienzo V, Minisini R, Jühling F, Wing PAC, Rapetti R, Leutner M, Testoni B, Baumert TF, et al. Inflammatory Gene Expression Associates with Hepatitis B Virus cccDNA- but Not Integrant-Derived Transcripts in HBeAg Negative Disease. Viruses. 2022; 14(5):1070. https://doi.org/10.3390/v14051070
Chicago/Turabian StyleMagri, Andrea, James M. Harris, Valentina D’Arienzo, Rosalba Minisini, Frank Jühling, Peter A. C. Wing, Rachele Rapetti, Monica Leutner, Barbara Testoni, Thomas F. Baumert, and et al. 2022. "Inflammatory Gene Expression Associates with Hepatitis B Virus cccDNA- but Not Integrant-Derived Transcripts in HBeAg Negative Disease" Viruses 14, no. 5: 1070. https://doi.org/10.3390/v14051070