
The Picornavirus Precursor 3CD Has Different Conformational Dynamics Compared to 3Cpro and 3Dpol in Functionally Relevant Regions


Department of Chemistry, The Pennsylvania State University, University Park, PA 16802, USA
*
Author to whom correspondence should be addressed.
Viruses 2021, 13(3), 442; https://doi.org/10.3390/v13030442
Submission received: 11 February 2021
/
Revised: 6 March 2021
/
Accepted: 8 March 2021
/
Published: 9 March 2021
(This article belongs to the Special Issue Viral Replication Complexes)
Abstract
:Viruses have evolved numerous strategies to maximize the use of their limited genetic material, including proteolytic cleavage of polyproteins to yield products with different functions. The poliovirus polyprotein 3CD is involved in important protein-protein, protein-RNA and protein-lipid interactions in viral replication and infection. It is a precursor to the 3C protease and 3D RNA-dependent RNA polymerase, but has different protease specificity, is not an active polymerase, and participates in other interactions differently than its processed products. These functional differences are poorly explained by the known X-ray crystal structures. It has been proposed that functional differences might be due to differences in conformational dynamics between 3C, 3D and 3CD. To address this possibility, we conducted nuclear magnetic resonance spectroscopy experiments, including multiple quantum relaxation dispersion, chemical exchange saturation transfer and methyl spin-spin relaxation, to probe conformational dynamics across multiple timescales. Indeed, these studies identified differences in conformational dynamics in functionally important regions, including enzyme active sites, and RNA and lipid binding sites. Expansion of the conformational ensemble available to 3CD may allow it to perform additional functions not observed in 3C and 3D alone despite having nearly identical lowest-energy structures.
Keywords:
picornavirus; poliovirus; polyprotein; virus precursor protein; protease; polymerase; protein dynamics; allostery; NMR1. Introduction
RNA viruses need to produce proteins that help evade the host immune defense, allow the virus to replicate, and establish new infections [1,2,3]. A typical positive-strand RNA virus codes for less than a dozen proteins; poliovirus, studied here, codes for ten proteins after proteolytic processing, four of which make up the capsid [4,5]. Positive-strand RNA viruses have evolved strategies for maximizing the use of their limited coding capacity. One strategy, which we will focus on here, is to encode a polyprotein translated from one large open reading frame, which is then cleaved by virally encoded proteases to yield individual proteins with unique functions and precursor intermediates that may have different functions than the fully processed products [1,6,7]. An important example is the poliovirus 3CD protein, a key protein regulating the spatial and temporal control of virus replication through its interactions with replication membranes, virus RNA and virus and host proteins [8,9,10,11,12,13]. 3CD is also proteolytically processed to yield separate 3C and 3D proteins, which play distinct functions from those of 3CD in virus replication [9,10,11,12,13,14,15,16,17]. As the 3C and 3D proteins are nearly structurally identical to their domain counterparts in 3CD, how different functions arise between the precursor and fully processed proteins has remained unclear [5,8]. It has been proposed that conformational dynamics, that is, fluctuations away from the lowest energy conformations represented by the X-ray crystal structures, may be different between 3C, 3D and their domain counterparts in 3CD, thereby driving their different functions [18]. Indeed, we show in this manuscript that there are different conformational dynamics between 3C/3D and 3CD across multiple timescales, which may contribute to their different functions.
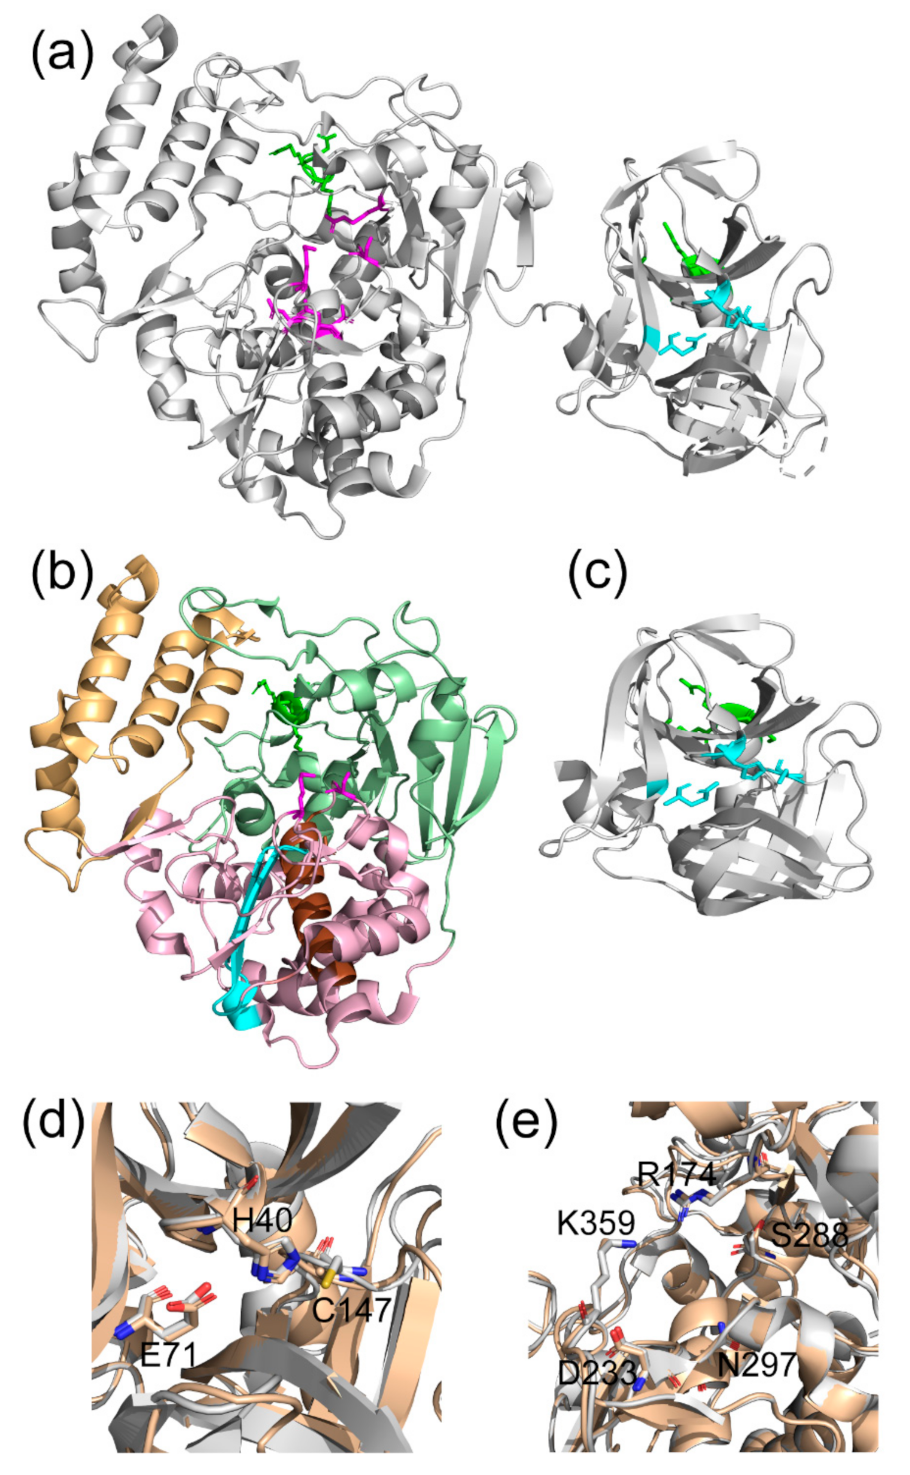
Poliovirus 3C, 3D and 3CD are all important proteins for the viral replication cycle. Here we will briefly discuss the structure and function of each. Structurally, 3C is cysteine protease with a chymotrypsin-like fold with the active site between two six-stranded β-barrels, with four helices (Figure 1). The catalytic triad consists of the general base His40, Glu71, and the nucleophilic Cys147, with Gly145, Gln146 and Cys147 contributing to the oxyanion hole [19]. The 3C protein also has an RNA binding site distant from the active site consisting mostly of residues 81–89 [20]. Overlapping with the RNA binding site is a phosphoinositide (PIP) binding site, important for lipid membrane interactions, which includes residues Lys12 and Arg13 in the N-terminal helix [21]. 3C can cleave most Gln/Gly junctions in the poliovirus polyprotein and interferes with cap-dependent translation, but only 3CD cleaves the capsid precursor P1 polyprotein [5,9,22]. While this finding indicates that the substrate specificity is different between 3C and 3CD, a structural explanation is lacking. Amino acid changes in the 3D domain distant from the 3C domain result in changes in substrate specificity [9,23], suggesting that the 3D domain has an allosteric effect on the protease active site that is not readily understood based on the X-ray crystal structures.
3D, the RNA-dependent RNA polymerase (RdRp), has the “cupped right hand” topology common to most nucleic acid polymerases [24], consisting of a fingers, palm, and thumb sub-domains (Figure 1). There are six conserved motifs, labeled A through F, within the palm and fingers domains. The active site consists of a three-stranded β-sheet with strands from motifs A and C and a long α-helix from motif B. Motifs A and C contain conserved aspartate residues, Asp233 and Asp328, which coordinate metal ions essential for catalysis. On motif B, Ser288 and Asn297 are important for recognition of the ribose sugar. Removing N-terminal residues of 3D or adding C-terminal residues of 3C to 3D decreases polymerase activity [25,26,27,28], suggesting that allosteric effects from the N terminus are important for polymerase function. While the structural basis of polymerase activation has been studied [29], differences in conformational dynamics in the context of 3CD may be important for understanding the lack of polymerase activity and the expanded functionality of 3CD compared to 3C and 3D. Given the structural similarity of 3D and 3CD, it has been proposed that molecular flexibility, rather than just a difference in structure, is an important determinant of polymerase activity [8,30,31].
Poliovirus 3CD is largely a structural composite of the 3C and 3D proteins, with a short linker connecting these domains (Figure 1). Unlike 3CD in some other RNA viruses (e.g., norovirus [32]), poliovirus 3CD does not function as a RdRp [30], although its 3D domain apparently modifies the functions of the 3C domain [9,10]. In addition to its proteolytic activity, 3CD is responsible for different interactions with RNA [14,15,16], induces formation of double-membrane vesicles [11,12,13] and likely interacts with PIP lipids in virus replication membranes [12]. Compared to the protease activity of 3C, 3CD cleaves the P1 capsid polyprotein and cleaves the other Gln-Gly junctions other than the P2/P3 junction more efficiently [9,10,22]. The different protease specificity between 3C and 3CD allows for temporal control over replication and translation via regulation of the relative amounts of each viral protein resulting from polyprotein cleavage [6,33,34].
The distinct and emergent functions of 3CD compared to the fully processed 3C and 3D proteins cannot be explained by structural considerations alone, given the nearly identical X-ray crystal structures of 3C/3D compared to 3CD (Figure 1). It is now appreciated that protein conformational dynamics play important roles in determining protein function. Specifically, conformational dynamics have been previously been shown to be important for protease activity and substrate specificity for many other systems [35,36,37,38,39] and the conformational dynamics of viral RdRps have likewise been shown to play critical roles in replication speed and fidelity [40,41,42,43,44]. Conformational dynamics and protein flexibility are also important in structure-based drug design [45,46,47,48,49]. Domain-domain motions within 3CD may also be functionally important; small angle X-ray scattering (SAXS) and molecular dynamics (MD) simulations have indicated that 3CD likely adopts multiple conformations in solution [18].
Here, we have used nuclear magnetic resonance (NMR) based methods to explore the conformational dynamic differences between 3C, 3D and 3CD as a potential explanation for their different functions. These experiments capture conformational dynamics across many timescales, including chemical exchange saturation transfer (CEST) [50] that monitors conformational exchange on the millisecond-to-second (ms-s) timescale, Carr-Purcell-Meiboom-Gill (CPMG) relaxation dispersion [51] that monitors conformational exchange on the microsecond-to-millisecond (µs-ms) timescale, and relaxation violated coherence transfer [52], which allows determination of conformational dynamics from the picosecond-to-nanosecond (ps-ns) timescale [53,54]. Conformational dynamics across these multiple timescales may be functionally important, with loop motion and side chain rotation occurring on the picosecond-to-nanosecond (ps-ns) timescale [55,56] and larger domain motions associated with ligand binding, allosteric regulation and catalytic turnover generally occurring on the µs-ms timescale [57,58]. Our studies reveal conformational dynamic differences between 3C/3D and 3CD in functionally relevant regions, suggesting that these dynamic differences may help to differentiate function between the polyprotein precursor and the fully processed proteins. Conformational dynamics within 3CD may also provide means of allosteric communication between the 3C and 3D domains, important for functional coordination of their activities.
2. Materials and Methods
2.1. Protein Expression and Isotopic Labeling
pSUMO plasmids with C-terminal hexahistidine tag expressing PV 3C, 3D, and 3CD were transformed into Escherichia coli BL21(DE3) pRARE cells. In 3D and in the 3D domain of 3CD, the following amino acid substitutions (relative to type 1 Mahoney strain) were present to prevent aggregation: L446D and R455D. In 3C and in the 3C domain of 3CD, the following amino acid substitutions were present to prevent aggregation in 3CD: E55A, D58A, E63A, and C147A to prevent intermolecular cleavage of 3CD [8]. Although not necessary to prevent aggregation in 3C, these mutations were present in 3C to make sure any differences in conformational dynamics were not due to these mutations. The aggregation-preventing mutations disrupt potential oligomerization interfaces on 3C and 3D and have been found to be necessary for achieving the high concentrations of 3CD necessary for NMR studies. Unless otherwise noted, reagents were purchased from VWR (Radnor, PA, USA).
After transforming cells with plasmids, cells were grown in 10 mL M9 minimal media (6.0 g/L Na2HPO4, 3.0 g/L KH2PO4, 0.5 g/L NaCl, 1.0 g/L NH4Cl, 2 g/L glucose, 1 mM MgSO4, 0.1 mM CaCl2, MEM vitamin mix (from Thermo Fisher, Bellefonte, PA, USA), trace metal mix (from Teknova, Hollister, CA, USA), 50 μg/mL kanamycin, 30 μg/mL chloramphenicol) for 16–20 h until optical density at 600 nm (OD600) was greater than 0.6. For 15N labeling, 50 mL M9 media were inoculated with 1 mL of the 10 mL culture and shaken overnight at 30 °C. Then, 20 mL were added to 1 L of M9 media (modified to contain 1 g/L 15N NH4Cl from Cambridge Isotope Laboratories, 12.0 g/L Na2HPO4, 6.0 g/L KH2PO4, 2 mM MgSO4). Protein production was initiated with 1 mM isopropyl-β-D-1-thiogalactopyranoside (IPTG) when OD600 was between 0.6–0.8 and the temperature was set to 25 °C. For perdeuterated Ileδ1-[13C,1H] labeling, 10–100 μL from the 10 mL M9 culture were plated onto M9 agar plates and incubated for 18–22 h at 37 °C. M9 minimal media (10 mL) with 50% D2O (D, 99% from Cambridge Isotope Laboratories, Andover, MA; USA) was inoculated with colonies from the M9 plate for 16–20 h until OD600 > 0.6, then 1 mL was transferred to 50 mL M9 minimal media with 100% D2O for 12–24 h until OD600 > 0.6. Cells (20 mL) were then added to 950 mL of 100% D2O M9 media. In the 100% D2O M9 media, glucose was replaced with deuterated glucose (1,2,3,4,5,6,6-D7, 97–98%, from Cambridge Isotope Laboratories, Andover, MA, USA) and the concentration of potassium phosphate buffer and magnesium sulfate were doubled [59]. Protein production was initiated with 1 mM IPTG when OD600 was between 0.6–0.8 and the temperature was set to 25 °C; 70 mg/L α-ketobutyric acid (Methyl-13C, 99% 3,3-D2, 98%; from Cambridge Isotope Laboratories, Andover, MA, USA) was added an hour before induction (around OD600 = 0.5). Cells were harvested after 16–20 h by centrifugation (3900× g, 30 min, 4 °C), rinsed with buffer (10 mM Tris, 1 mM EDTA pH 8), centrifuged again (3800× g, 15 min, 4 °C), decanted and the resulting pellets were weighed and frozen at −80 °C. All cultures were incubated at 37 °C with shaking at 200–250 rpm, unless otherwise specified. D2O (D, 99.9%) was from Cambridge Isotope Laboratories (Andover, MA, USA).
2.2. Protein Purification
PV 3D and 3CD pellets were resuspended in 100 mM potassium phosphate pH 8.0, 10 mM β-mercaptoethanol, 120 uM ZnCl2, 20% glycerol, 1.4 μg/mL pepstatin A, 1 μg/mL leupeptin, 500 μM phenylmethanesulfonyl fluoride (PMSF). PV 3C pellets were resuspended in 20 mM HEPES pH 7.5, 50 mM NaCl, 1 mM EDTA, 5 mM β-mercaptoethanol, 5 mM imidazole, 1.4 μg/mL pepstatin A, 1 μg/mL leupeptin. The cells were then lysed, followed by polyethylenimine (PEI) precipitation and ammonium sulfate precipitation to 60% saturation as previously described [8]. The resulting pellet was resuspended and the proteins were purified by Nickel-Nitrilotriacetic Acid (Ni-NTA) affinity chromatography as previously described [20,60]. After cleavage of the SUMO tag by 1–2 μg ubiquitin-like-specific-protease (ULP-1), samples were dialyzed against 100 mM potassium phosphate, 100 mM sodium chloride, 60 μM zinc chloride, 5 mM β-mercaptoethanol, 20% glycerol. The samples were then concentrated using 30 kD molecular weight cutoff (MWCO; 3D and 3CD) or 10 kD MWCO (3C) Sartorius Vivaspin spin concentrators.
2.3. NMR Sample Preparation
To prepare for methyl NMR spectroscopy, samples were buffer exchanged to 100 mM potassium phosphate, 100 mM sodium chloride, 60 μM zinc chloride, 5 mM β-mercaptoethanol, 20% d-8 glycerol (Cambridge Isotope Laboratories, Andover, MA, USA) in D2O using Zeba desalting columns (Thermo Scientific, Bellefonte, PA, USA). For 15N labeled samples, the buffer contained 90% H2O and 10% D2O. Samples were further concentrated by 0.5 mL Millipore Amicon Ultra Centrifugal Filters, 3K MWCO. The concentration was determined by measuring the absorbance at 280 nm (ε3CD = 84690 M−1 cm−1, ε3D = 75750 M−1 cm−1, ε3C = 8960 M−1 cm−1). For determination of methyl axis order parameters, the concentration of all samples was 400 μM. All NMR experiments were carried out on 850 MHz Bruker Avance III or 600 MHz Bruker Avance NEO with 5 mm TCI single-axis gradient cryoprobes (Bruker, Billerica, MA, USA). Perdeuterated Ileδ1-[13C,1H] samples and uniformly labeled 15N 3C were prepared as described above. Data was processed using NMRpipe software [61] on NMRbox [62]. The 1H-13C heteronuclear multiple quantum coherence (HMQC) spectra are from the first plane of the triple quantum relaxation violated coherence transfer allowed experiment. For 1H-13C spectra, 64 points were used in the indirect dimension (t1) and 768 points were used in the direct dimension (t2).
2.4. δ1-13. CH3 Resonance Assignments for 3C, 3D, and 3CD
Resonance assignments for the δ1-13CH3 groups of 3C were determined using three-dimensional correlation experiments described in ref [63] using previously established backbone assignments [20]. Resonance assignments for 3D were determined by comparisons against a series of HMQC spectra of single Ile-to-Leu or Ile-to-Met variants in which assignments were made according to the missing resonances in the variants. Resonance assignments for 3CD were readily transferred over from the 3C and 3D spectra, as there were only small chemical shift differences and limited resonance overlap between 3C and 3D. Additional results of these experiments will be published elsewhere.
2.5. Determination of Methyl Axis Order Parameters
Triple quantum relaxation violated coherence transfer experiments were performed at 600 MHz at 298 K and analyzed as previously described [64]. The allowed and forbidden experiments were interleaved. For 3C, delays of 1.5, 5, 3, 15, 8, 2, 10, 4, 6, 12.5, 2.5, 9, 5, 3.5, 7, 1.5 ms were used. For 3CD, delays of 1.7, 3.4, 1.2, 6, 0.4, 4.2, 0.8, 1.2, and 2.2 ms were used. For 3D, delays of 1.7, 3.8, 1.3, 10, 7, 0.4, 4.5, 0.9, 1.3, 2.5, and 5.4 ms were used.
The data were fit to Equation (1):
where Ia/Ib is the ratio of intensities of the forbidden and allowed experiments, η is the intramethyl 1H-1H cross-correlated relaxation rate, δ is a parameter that accounts for relaxation due to external protons, and T is the relaxation delay period. η and δ for each residue were determined by nonlinear least squares fitting using the Trust Region Reflective algorithm. Uncertainty in fit parameters calculated by Monte Carlo bootstrapping resampling from a normal distribution using the standard deviation of repeating measurements was very small, so residual bootstrapping was used to determine uncertainty.
Ia/Ib = ¾ (ηtanh((η2 + δ2)1/2 T))/((η2 + δ2)1/2 − δtanh((η2 + δ2)1/2T))
Methyl axis order parameters (S2) were calculated according to Equation (2):
where τc is the rotational correlation time for the protein molecule, μ0 is the vacuum permittivity constant, γH is the gyromagnetic ratio for a proton spin, rHH is the distance between methyl proton pairs, P2(x) is the second order Legendre polynomial 1/2(3x2−1), θaxis,HH is the angle between the methyl 3-fold axis and a vector connecting a pair of methyl protons [64]. For 3C and 3D, calculations by HydroNMR predict that the rotational diffusion tensor is isotropic (D∥/D⊥ < 1.17 [65]), so we used a single isotropic τc for all residues. Calculation of order parameters with separate τc for each residue using an axially symmetric model results in a difference in order parameters of less than 3%. For 3CD, the rotational diffusion tensor calculated by HydroNMR [66] is approximately axially symmetric (D∥/D⊥ = 1.66), raising the possibility that the methyl 3-fold axis orientation relative to the principal axis of the diffusion tensor could affect the intramethyl cross- relaxation rate, with bond vectors aligned along the principal axis experiencing lower rotational correlation times than bond vectors aligned perpendicular [67]. However, there is good agreement between relative order parameters calculated using a single isotropic τc and relative order parameters calculated using different values of τc for each residue calculated from the axially symmetric rotational diffusion tensor [67,68,69], suggesting that the effect of anisotropic rotational diffusion on the interpretation of our results is small. Furthermore, because of the flexible linker, the domains are expected to tumble somewhat independently, leading to a more isotropic rotational diffusion for each domain than for the whole molecule tumbling together.
η = 9/10 (μ0/4π)2 (P2(cosθaxis,HH))2 (S2γH4ℏ2τc)/(rHH6)
2.6. CPMG Relaxation Dispersion
1H-13C multiple quantum CPMG relaxation dispersion experiments were performed at 850 MHz at 295 K and 298 K, as previously described [70], with a total CPMG period of 20 ms and CPMG frequencies of 50, 1000, 500, 250, 800, 150, 600, 900, 200, 400, 100, 300, 400, 700, and 800 s−1. Error bars were calculated from spectral noise. Rex was calculated by subtracting the value of R2,eff at the highest νcpmg from R2,eff at the lowest νcpmg for each residue. If both values of R2,eff were within error due to noise, Rex was considered to be 0. Curves for Ile151 in 3C and 3CD were fit using GUARDD in MATLAB [71].
2.7. H and 13C CEST
1H chemical exchange saturation transfer (CEST) experiments were performed at 850 MHz at 298 K, as previously described [72]. An exchange period of 500 ms was used, with saturation frequencies varied from −0.65 to 1.05 ppm for 3C and −0.89 to 1.33 ppm for 3D and 3CD, with a step size of 30 Hz. The B1 frequency was 30 Hz.
13C CEST experiments were performed at 850 MHz at 298 K on 3C, as previously described [73]. An exchange period of 40 ms was used, with saturation frequencies varied from 7.26 to 13.95 ppm with a step size of 25 Hz. The B1 frequency was 25 Hz.
3. Results
As the structural similarities between 3C and 3D with their corresponding domains in 3CD largely failed to explain functional differences, we sought to understand these differences by comparing conformational dynamics via NMR spectroscopy. Since our interest is primarily in comparing the conformational dynamics between the fully processed 3C and 3D proteins to their counterpart domains in the 3CD protein, we report first on NMR experiments with 3C and comparisons against the 3C domain of 3CD, before reporting on the NMR experiments of 3D and comparisons against the 3D domain of 3CD. At the end of this section, we then compare the rotational correlation times of 3C and 3D by themselves and in the context of 3CD to learn about the degree of independence of the domains in 3CD. To avoid confusion, residues belonging to the 3C and 3D proteins will be identified according to 3C and 3D superscripts, respectively. We will also refer to residues in the 3C domain of 3CD with a superscript 3C*D and residues in the 3D domain of 3CD with a superscript 3CD*. In this way, we can keep the numbering convention for 3D while referring to the corresponding domain in 3CD.
3.1. Ile Methyl Resonance Assignments for 3C
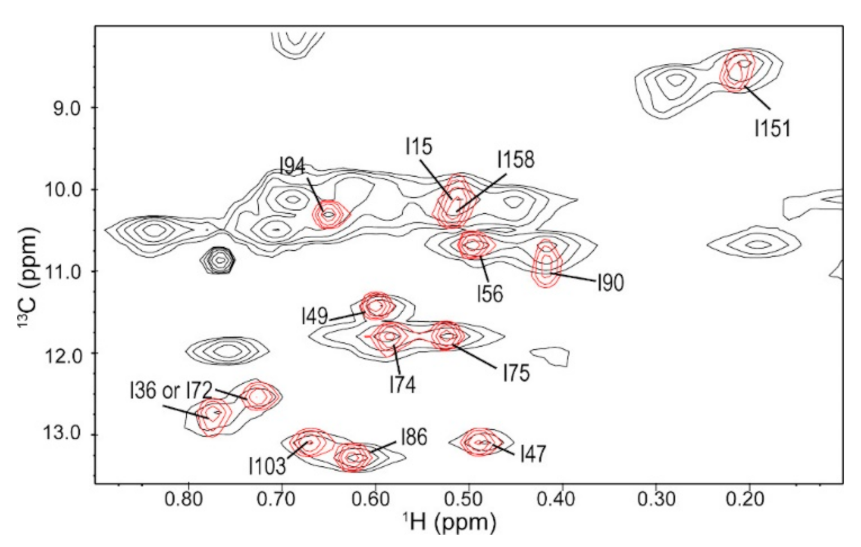
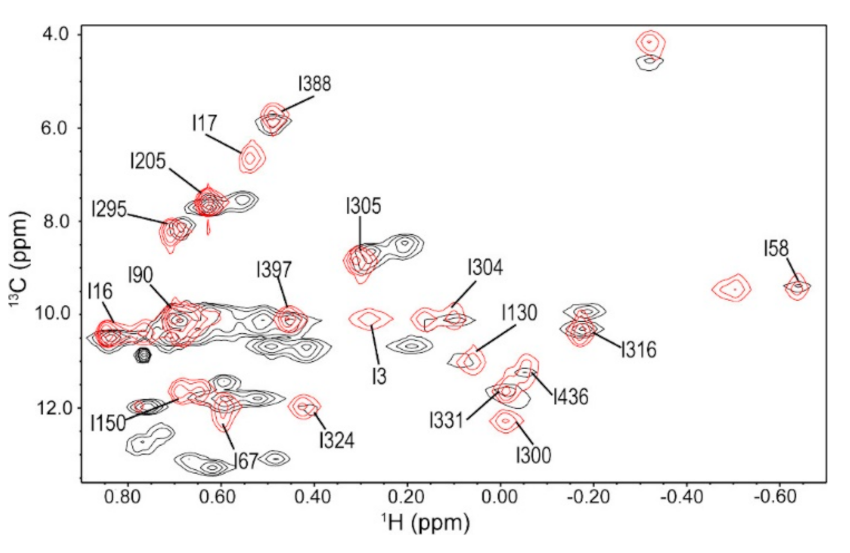
1H-13C methyl HMQC NMR spectra were collected for poliovirus 3C labeled with 13C at the delta-1 carbon of all Ile residues (Figure 2). Conventionally, 15N in the amide backbone is used in two-dimensional protein NMR, but there is too much spectral overlap in the spectrum of 3CD. By labeling the isoleucine methyl groups, we were able to avoid this spectral overlap. Furthermore, methyl groups are especially sensitive probes for large proteins such as 3CD due to the methyl TROSY effect [74]. Isoleucine was chosen as the NMR probe because these residues are well-dispersed throughout the protein structure and are well resolved in the spectrum, except for Ile153C and Ile1583C. The methyl δ1-[13C,1H] Ile resonances were assigned using 3D correlation experiments as described in ref. [63] based on backbone resonance assignments reported in ref. [20]. All residues appear in the spectrum as single resonances and do not appear to be noticeably exchange-broadened.
3.2. Conformational Dynamics of 3C on the Micro-to-Millisecond Timescale
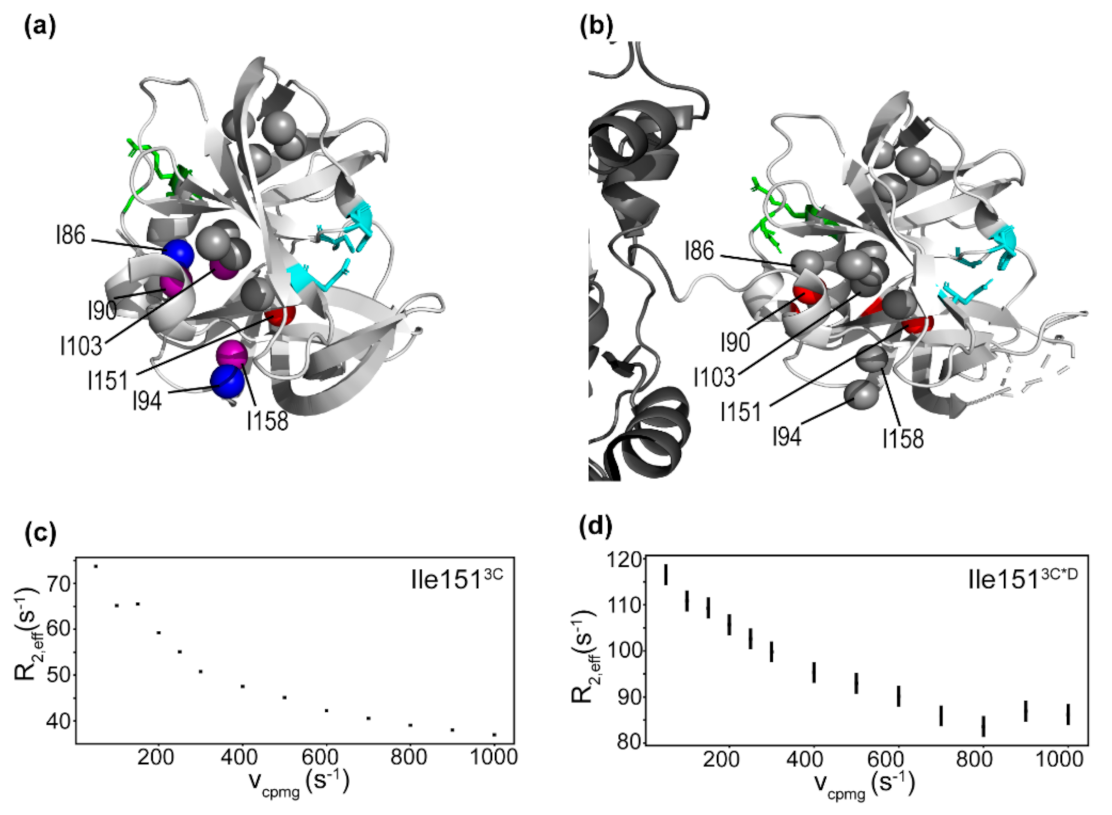
Multiple-quantum 1H-13C CPMG relaxation dispersion experiments were performed on 3C to provide insight into conformational exchange events occurring on the µs-ms timescale. In short, CPMG relaxation dispersion measures the difference in intensity of resonances as nuclear spin relaxation due to conformational exchange is refocused by a train of rapid pulses, and can determine exchange parameters for residues exchanging on a timescale comparable to the frequency of the refocusing pulses [51,75]. Residues with detectable conformational exchange include Ile863C, Ile903C and Ile943C on the RNA binding loop [19,20], Ile1033C that contacts the PIP-binding N-terminal helix [21], Ile1513C on the same loop as the active site nucleophile Cys147, and Ile1583C/Ile153C (Figure 3 and Figure S1). Ile1513C has a particularly large contribution to relaxation from exchange, indicating that it is probably exchanging between states with large differences in chemical shift. One possible explanation for the large contribution to relaxation from exchange is that the δ1 methyl of Ile151 contacts the hydroxyl of Tyr138, which is on a substrate-binding loop. The μs-ms timescale dynamics observed here are consistent with previous backbone 15Ν CPMG relaxation dispersion studies in which it was found that residues in the active site were dynamic on the μs-ms timescale [76]. It is possible that at least some of the apparent dynamics in the active site are due to protonation/deprotonation of His40 [77], although Ile151 is likely too far away to be directly affected. Given residues in and around the active site are dynamic on a catalytically relevant timescale, these dynamics may be important for the selection of a protease active conformation and/or substrate specificity.
3.3. Conformational Dynamics of 3C on the Millisecond-Second Timescale
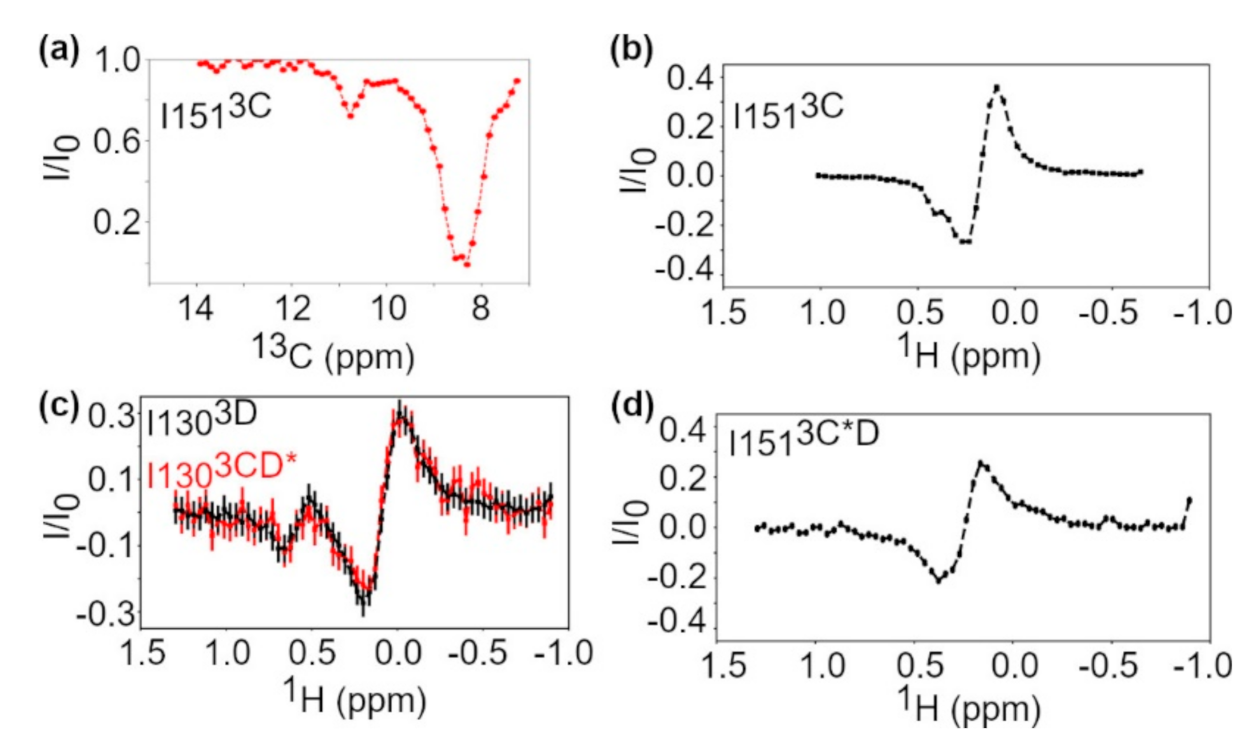
CEST experiments were also performed, which provide insight into conformational exchange on the ms-s timescale. Briefly, CEST measures the decrease in resonance intensity when a weak transverse magnetic field is applied at the resonance frequency. When a residue is exchanging to a state, unobservable in the standard correlation spectrum, whose resonance frequency is saturated by the transverse field, the intensity of the observable resonance decreases as the chemical shift of the normally invisible exchanging state is saturated [50,78]. The CEST experiments indicate that Ile1513C is undergoing conformational exchange, in which the minor state has substantial 1H and 13C chemical shift differences with the major state (Figure 4a,b). This result is consistent with conformational exchange as detected by the relaxation dispersion experiment (Figure 3). Other active site residues do not appear to be exchanging on this timescale (Figures S2 and S3), but there are limited probes in the active site and the chemical shift difference for the Ile residues may be too small to observe the minor state.
3.4. Conformational Dynamics of 3C on the Picosecond-Nanosecond Timescale
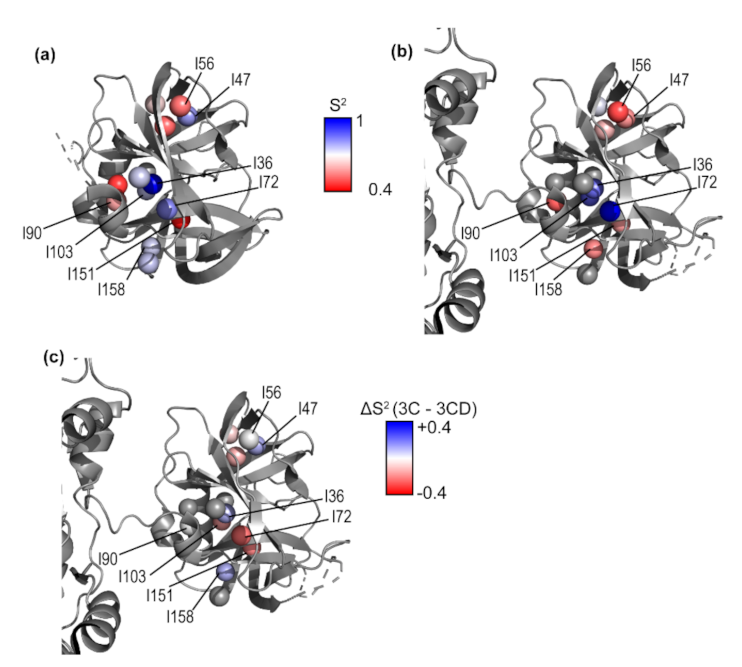
While slower conformational dynamics include potentially functionally relevant larger movements such as domain motions, faster motions such as loop motions on the ps-ns timescale may also be important for substrate binding or allostery [55,56]. Methyl axis order parameters (S2), which report on ps-ns timescale dynamics [79], were determined by triple quantum relaxation violated coherence transfer NMR experiments [64,80] (Figure 5 and Figure S4). Using a rotational correlation time (τc) of 24.8 ns so that the highest order parameter was 1, the average value of the order parameters calculated for 3C was 0.69. This value for τc agrees very well with the value calculated by HydroNMR (25.1 ns). Order parameters calculated using the τc determined by TRACT NMR are given in parentheses (see discussion Figure S5). Ile363C and Ile723C have the highest methyl axis order parameters, 1.0 and 0.83 (0.86 and 0.72). The side chains of Ile363C and Ile723C are contacting via hydrophobic interactions, and Ile723C is adjacent to the active site residue Glu71, which is part of the catalytic triad. Ile1513C has the lowest methyl axis order parameter in 3C, 0.46 (0.39), indicating that it is the most dynamic on the ps-ns timescale.
3.5. Conformational Dynamics of 3CD: 3C Domain
One of our major goals was to compare and contrast internal motions between 3CD and the corresponding 3C and 3D proteins. As such, we performed similar experiments (i.e., multiple quantum relaxation dispersion, CEST and methyl axis order parameters) for 3CD (Figures S6–S8). Here, we report only on the 3C domain, and leave the analysis of the 3D domain until after reporting on the 3D conformational dynamics in the next sections.
Conformational exchange processes on the μs-s timescales were quite similar between the 3C protein and the 3C domain of 3CD (Figure 3 and Figure 4). In particular, residues with detectable exchange in the 3C domain included Ile903C*D in the RNA-binding loop and Ile1513C*D in the protease active site. Ile903C*D may be associated with a larger Rex value in 3CD suggesting changes in kinetics and/or thermodynamics associated with conformational exchange, and/or a change in the exchanging conformation. It is notable that there was also a small chemical shift difference for Ile90 between 3C and 3CD (Figure 2). Ile86 and Ile94, which are exchanging in 3C, may not be exchanging in 3CD (Figure 3), although the relaxation dispersion curves are generally noisier for 3CD. The CEST experiments also indicated that Ile151 may be exchanging in 3C but not in 3CD, which again may be suggestive of a difference in timescale for Ile151 exchange between 3C and 3CD (Figure 4b,d).
For analyzing methyl axis order parameters in 3CD, the rotational correlation time (τc) was determined by assuming the highest order parameter was 1 because residues in the 3C and 3D domains could not be analyzed for τc separately due to 1H-15N resonance overlap. More specifically, measurement of the rotational correlation time by the TRACT NMR experiment resulted in a value lower than used here because without separation of the resonances in the 1H and 15N dimensions, slower-relaxing resonances overpower the faster-relaxing resonances that are needed to accurately determine τc [81].
The highest methyl axis order parameters in the 3C domain of 3CD were for Ile363C*D, Ile723C*D, and Ile1033C*D. Ile363C*D and Ile723C*D are near the active site residue Glu71 and Ile103 is near the RNA binding site. The residues with lowest order parameters were Ile563C*D and Ile903C*D. Ile563C*D is next to Val54 which when mutated reduces the processing of 3CD [82]. These results largely mirrored the results for the 3C protein (Figure 5), although some residues (e.g., Ile473C*D, Ile1513C*D) appeared to have higher order parameters, while other residues (e.g., Ile723C*D) had lower order parameters for 3C compared to 3CD (Figure 5c). It should be noted that the order parameter values we calculated depend on the τc values, which we can only estimate for 3CD but the analysis presented here is expected to be valid for a wide range of τc values. That is, these results indicate that there are at least some small relative changes in the ps-ns timescale dynamics in the 3C domain of 3CD compared to the isolated 3C protein.
3.6. Ile Methyl Resonance Assignments for 3D
We used a mutagenesis approach to assign the δ1-13CH3 Ile resonances for 3D. Briefly, we compared HMQC spectra of 3D against a series of Ile-to-Leu and Ile-to-Met variants, so that missing resonances in the variants were assigned to the corresponding substituted Ile residue. In most cases, these assignments were straightforward, although some additional chemical shift changes were noted. We will report on these mutagenesis studies and their implications for allostery in 3D in a future manuscript, as a comprehensive analysis of these results would distract from, and are not necessarily pertinent to, the current analysis. Germane for the current manuscript, these experiments allowed us to assign most of the δ1-13CH3 Ile resonances for 3D (Figure 6).
3.7. Conformational Dynamics of 3D on the Microsecond to Second Timescale
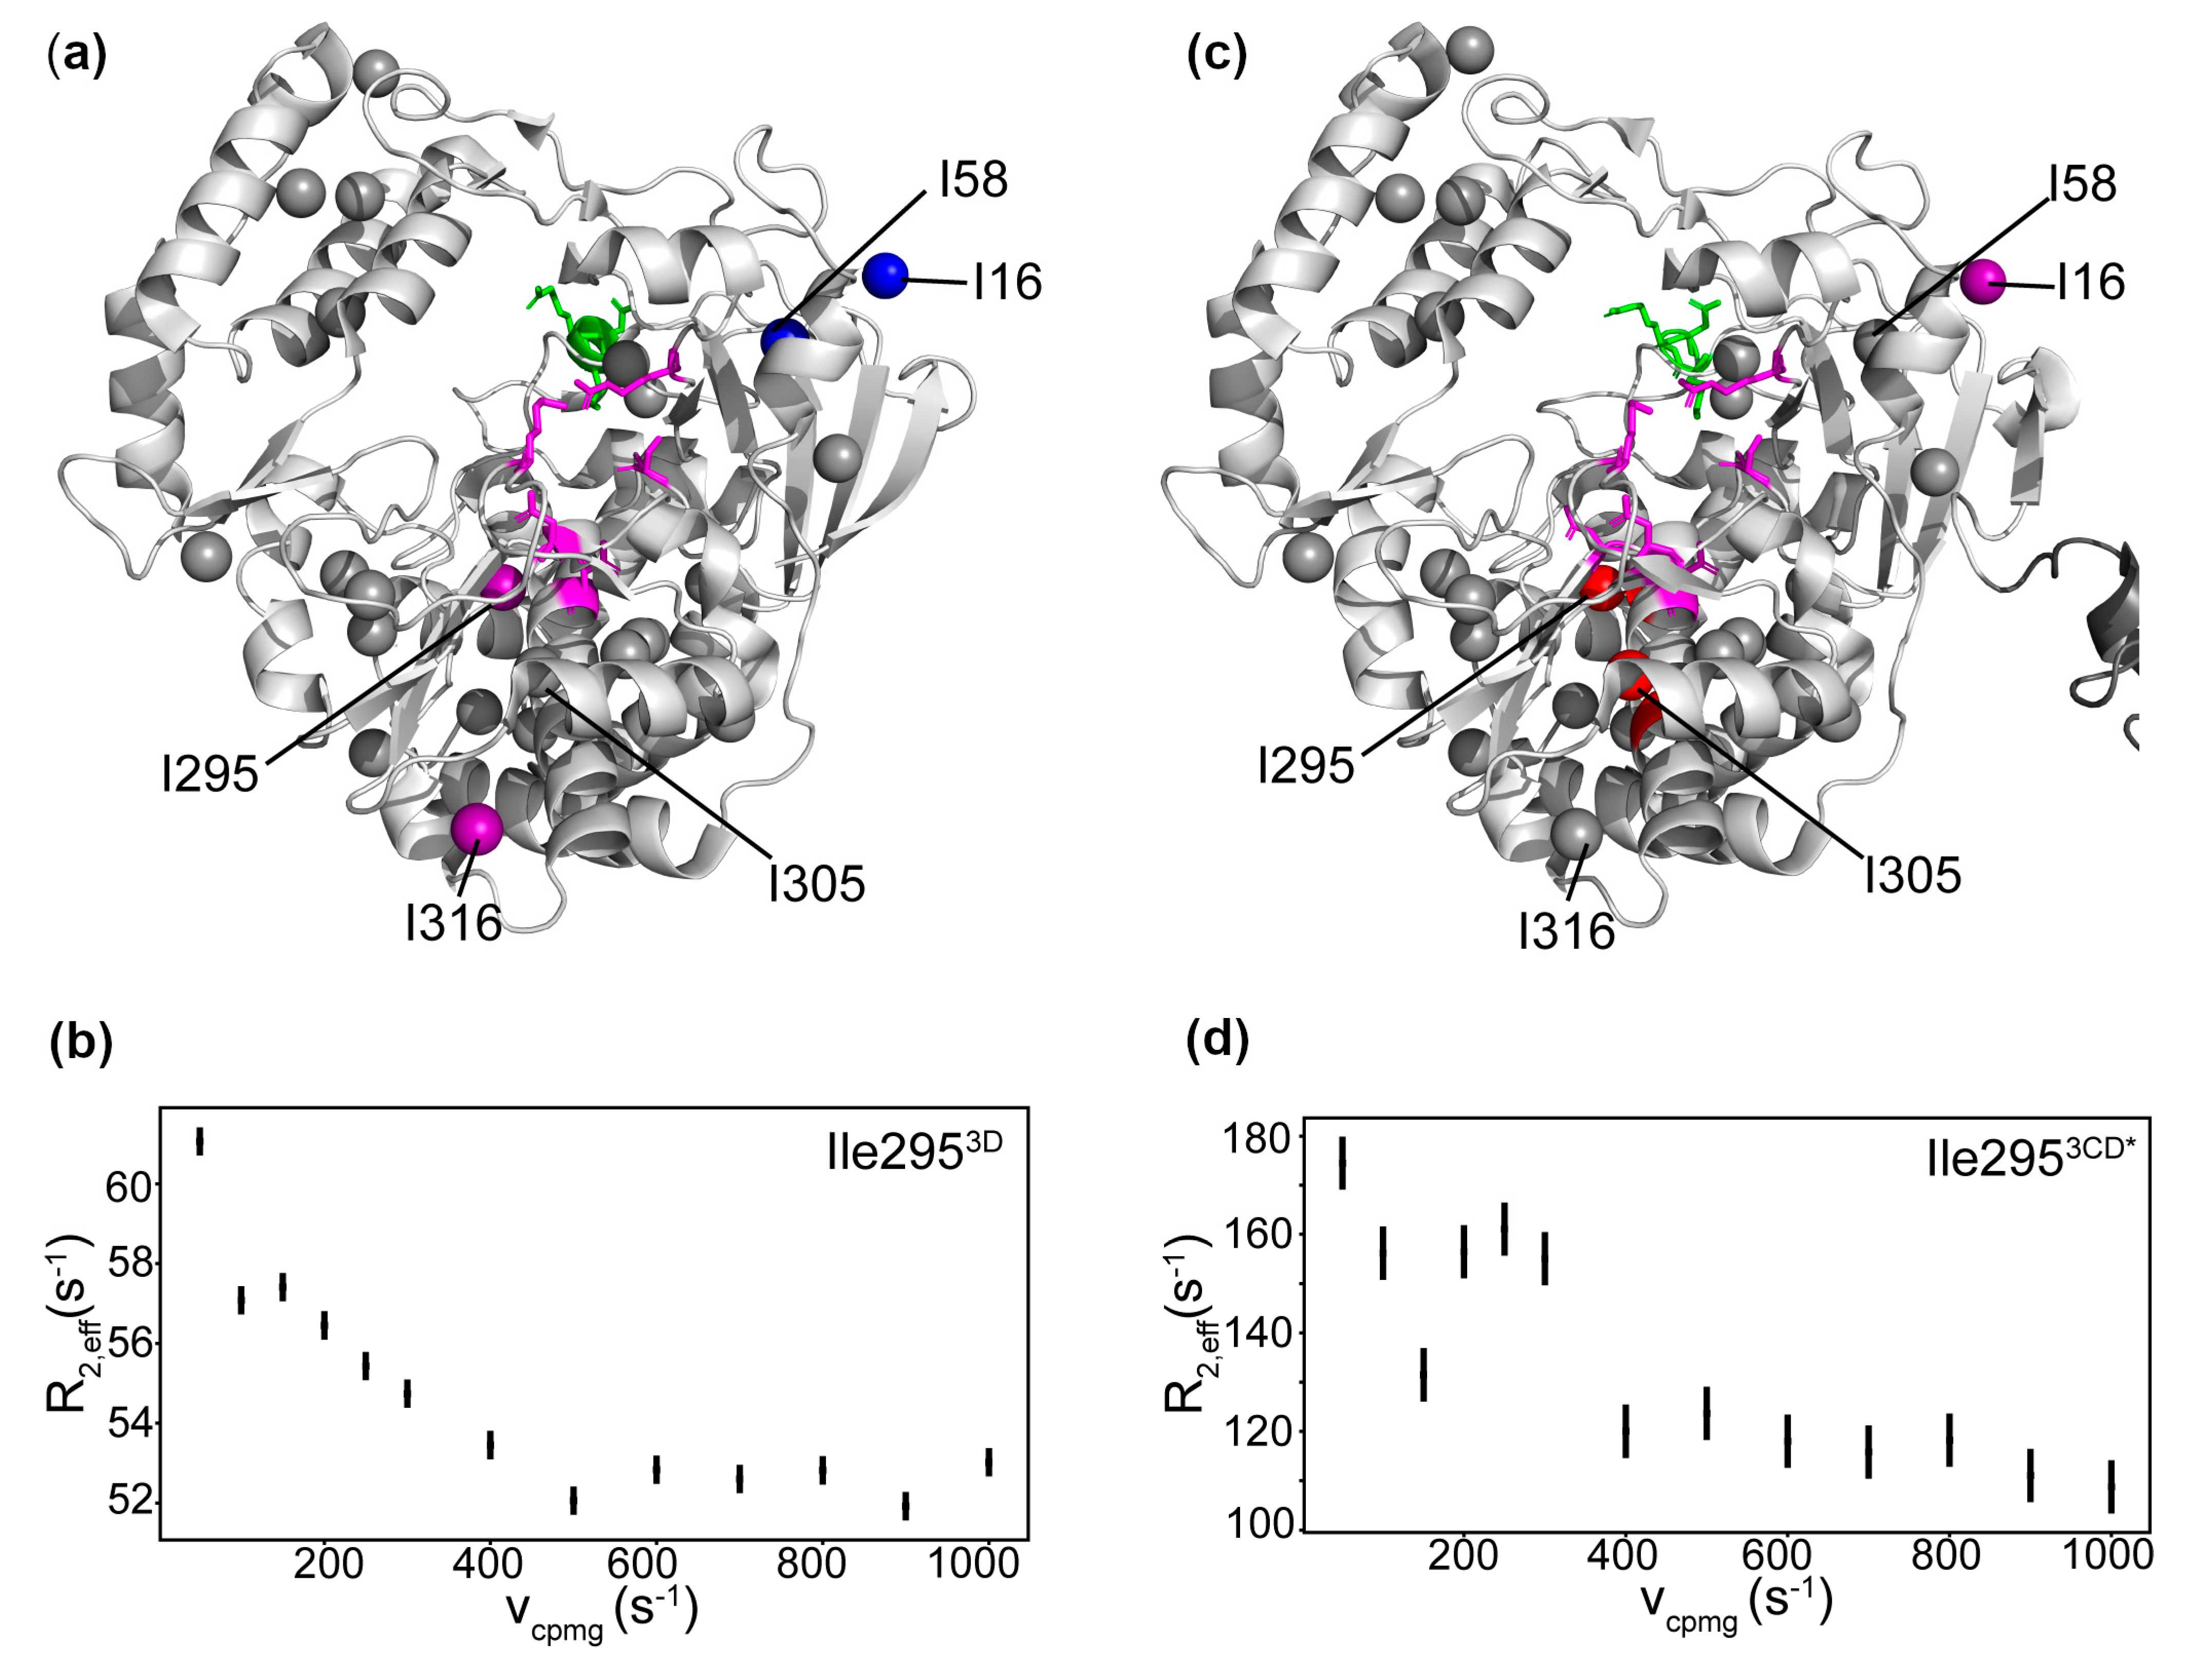
We collected multiple quantum relaxation dispersion and CEST experiments to likewise identify μs-s conformational exchange events in the 3D protein (Figures S9 and S10). Based on the relaxation dispersion experiments, Ile2953D and Ile3163D, located in the palm subdomain, had the largest contribution to relaxation from exchange (Figure 7). Ile163D and Ile583D, located in the fingers subdomain, appeared to have small but observable contributions to relaxation from exchange. Ile2953D is located on motif B, and Ile3163D is on the loop between motifs B and C. 1H CEST revealed a minor conformational state for Ile1303D (Figure 4c), which is located in a potential PIP binding site [83]. Conformational exchange in the PIP binding site may be important for the conformational selection of a more binding-competent conformation.
3.8. Conformational Dynamics of 3D on the Picosecond to Nanosecond Timescale
The ps-ns timescale dynamics were also investigated in 3D (Figure 8 and Figure S11). Using a rotational correlation time (τc) of 81 ns so that the highest order parameter was 1, the average value of the order parameters calculated for 3D was 0.64. The τc value was chosen this way because spectral overlap in the 1H-15N correlation spectrum would likely result in an underestimation of τc. The residues with highest order parameters were Ile3003D, Ile33D, and Ile3313D with values of 1.00, 0.90, and 0.88, respectively. Ile3003D is in the palm domain in motif B, Ile33D is at the N-terminal loop of 3D, and Ile3313D is in the palm domain in motif C. These residues have been proposed to stabilize the active polymerase conformation via a hydrogen-bonding network [29,60,84]. The residues with lowest order parameters were Ile2053D, Ile2953D, and Ile3053D in the palm domain, and Ile3973D in the thumb domain. Ile2953D and Ile3053D are located in motif B.
3.9. Conformational Dynamics of 3CD: 3D Domain
Here, we have used 3D numbering in the analysis of the 3D domain of 3CD, as the 3D RdRp is more commonly studied than the 3CD precursor protein. The reader would need to add 183 to the 3D numbering to get the corresponding residues in 3CD. In the 3D domain of 3CD, Ile163CD*, lle2953CD*, and Ile3053CD* were dynamic on the μs-ms timescale according to the multiple quantum relaxation dispersion experiments, similar to what was observed for 3D (Figure 8 and Figure S12). The 1H CEST experiment also revealed slower conformational dynamics in Ile1303CD* in the 3D domain (Figure 4c and Figure S13). Unfortunately, many of the CEST profiles were noisy and difficult to interpret, likely due to the higher molecular weight of 3CD.
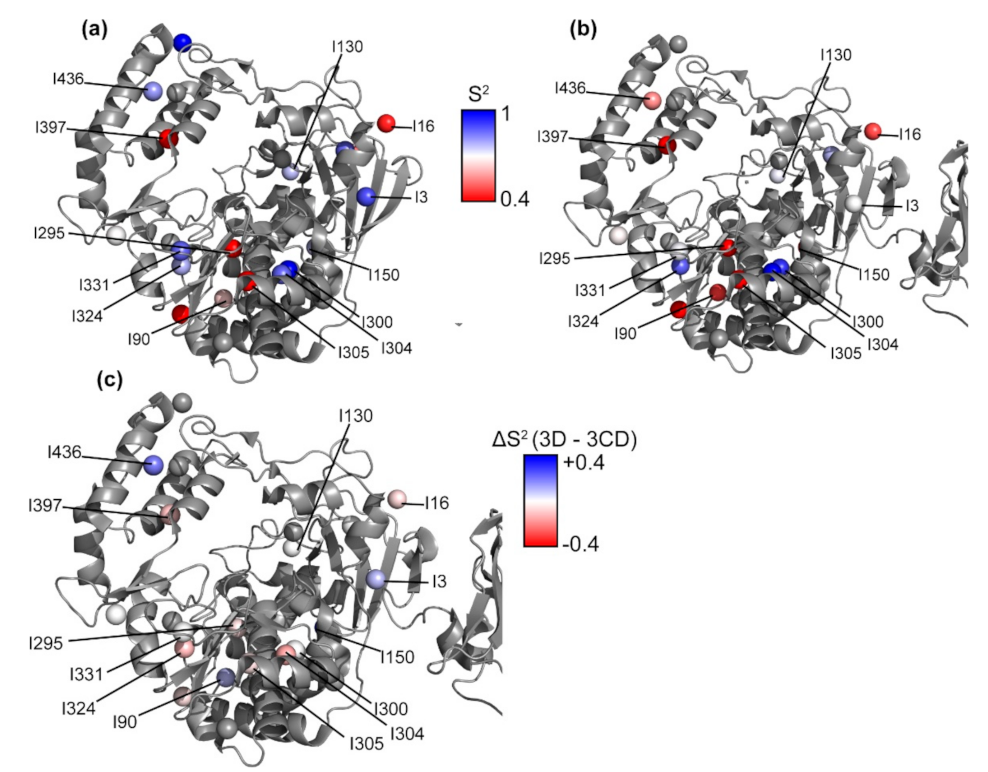
The residues with highest methyl axis order parameters were all in the palm domain: Ile3003CD*, Ile3043CD*, and Ile3243CD*; Ile3003CD* and Ile3043CD* are in motif B, and Ile3243CD* is in motif C. The residues with lowest order parameters were Ile2953CD* and Ile3053CD*, also in the palm domain in motif B (Figure 8b and Figure S8). These results were quite similar to those for 3D, with some notable exceptions in which residues were associated with higher (e.g., Ile3, Ile90, Ile436) or lower (e.g., Ile304, Ile324) methyl axis order parameters for 3D compared to the 3D domain of 3CD. Again, it should be kept in mind that the methyl axis order parameters depend on the τc values, which were estimated for both 3D and 3CD. Nonetheless, these comparisons indicate that there are relative conformational dynamics differences within 3CD compared to 3D.
3.10. Domain Independence in 3CD
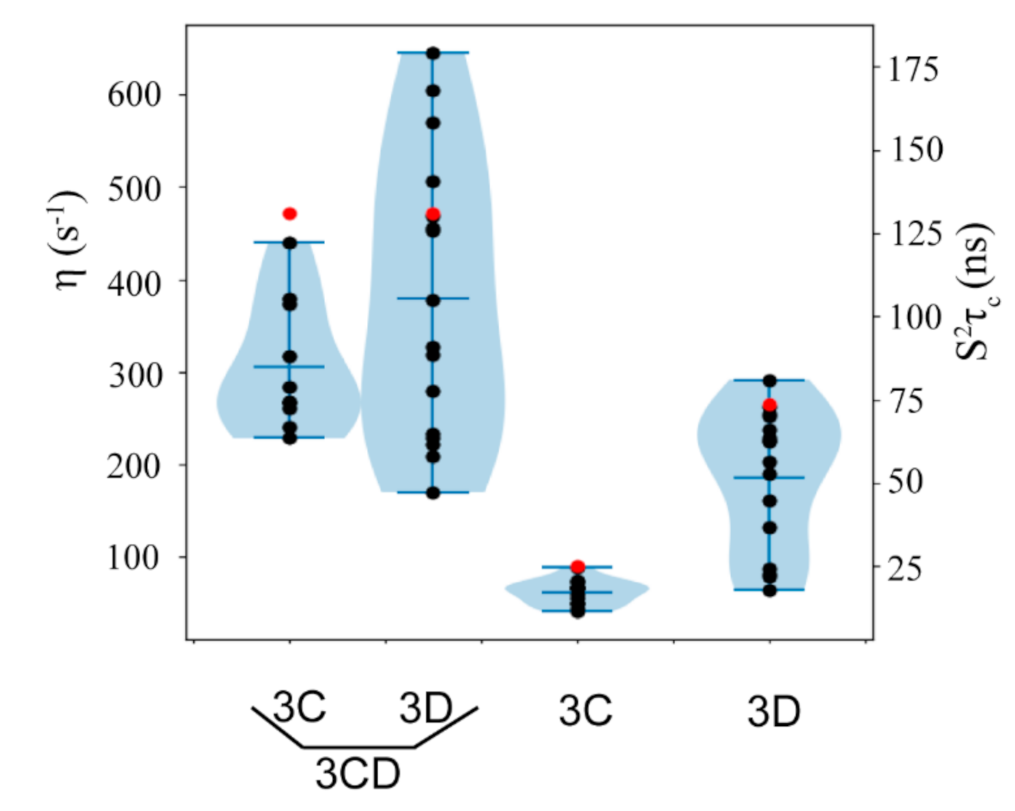
Having determined methyl axis order parameters for 3CD, we can gain some insight into the independence of the 3C and 3D domains in the context of 3CD by comparing the rotational correlation time (τc) of the independent domains to the domains in the context of 3CD. The τc value can be thought of as the average time it takes for a molecule to rotate 1 radian. If the 3C and 3D domains in 3CD tumble independently and do not interact, τc for each domain would be less than τc for the whole protein considered as a rigid body, with τc for each domain roughly proportional to its molecular weight [85]. On the other hand, if their rotation was completely coupled, the τc values would be identical and larger than the τc of the individual domains [86,87]. As the magnitude of the methyl axis order parameters scale with the chosen value of τc, we will focus on the value of the intramethyl 1H-1H cross-correlated relaxation rates, η (see Figures S4, S8 and S11), which is independent of any assumptions about τc.
For the 3C and 3D domains in the context of 3CD, the distribution of η values were more similar than when the two domains were not connected (Figure 9), although the 3D domain has higher values of η overall. The overlap of the η distribution suggests that the 3C and 3D domains in 3CD have somewhat similar τc. Due to the linker, the domains are not expected to be completely independent, but the τc of 3CD is much larger than expected for non-interacting domains [85]. The larger τc in 3CD may be due to increased aggregation [88], inter-protein electrostatics [89], slow interdomain motions [90], or interdomain contacts [86,87]. That the 3D domain in 3CD undergoes a larger degree of nanosecond timescale motion than the 3C domain, and so would have a larger τc in 3CD, is supported by MD simulations [18]. While interdomain contacts do not fully explain why the τc in 3CD is so much larger than predicted by hydrodynamic calculations (160–180 ns vs. 130 ns), they could contribute to each domain having a larger τc by limiting the rotational diffusion, which would result in a longer rotational correlation time. Interdomain contacts, i.e., 3CD adopting a more compact conformation in solution than in the X-ray crystal structure (Figure 1), have been proposed based on SAXS and MD simulations [18].
4. Discussion
While poliovirus 3CD appears to be nearly structurally identical to its isolated domains (Figure 1), it is functionally different, enabling the virus to expand the functionality of its limited genome. 3CD has different protease specificity from 3C [9,10], and unlike 3D it does not function as a polymerase [30]. As these functional differences are not explained by existing structural information, it has been proposed that differences in conformational dynamics between 3CD and 3C/3D may be responsible for the different functionality [18]. Here we used NMR spectroscopy to compare residue-specific conformational dynamics between 3CD and its processed products in order to gain insight into the role of conformational dynamics in functional differences between the proteins.
There is an important caveat when discussing the methyl axis order parameters (S2), especially in comparisons between 3CD and 3C/3D. To calculate order parameters from intramethyl cross-correlated relaxation rates (η), we used the simplest version of the Lipari-Szabo model-free formalism [52,79], where η depends on two parameters: S2 and τc. Any comparison of order parameters between different proteins depends on the chosen values of τc. When discussing order parameters, we are comparing the distribution of order parameters within the protein rather than absolute values of S2 because the true value of τc is not known for 3CD due to its large molecular weight and separate domains of 3CD making traditional methods for determining τc unavailable. To assess the accuracy of our use of the highest order parameter to determine τc, we used the TRACT NMR experiment [81] to determine τc for 3C (see Supplementary Materials). The resulting value of 28.7 ± 1.6 ns is close to the value of 24.8 ns determined by assuming the highest order parameter is 1, and the differences in order parameters identified here are fairly large, so the qualitative analysis of differences in order parameters presented in the following discussion is expected to be valid.
4.1. Comparison of 3C and 3CD Conformational Dynamics
Multiple quantum 1H-13C CPMG relaxation dispersion NMR experiments were performed on 3C and 3CD to determine conformational dynamics on the μs-ms timescale. In both 3C and 3CD, Ile1513C, which is on the same loop as the active site nucleophile Cys147, appears to undergo conformational exchange on the μs-ms timescale (Figure 3 and Figure 4). Residues around Cys147 in 3C have previously been shown to undergo conformational exchange by 15N R2 relaxation dispersion experiments [76]. The conformational exchange kinetics may be different between 3C and 3CD, considering that the 1H CEST experiments were unable to identify a minor conformation for Ile151 (Figure 4), although it is noted that these experiments become more challenging to interpret with larger proteins. There also appeared to be differences for the ps-ns timescale dynamics around the active site. Ile1513C has a higher apparent methyl axis order parameter in 3CD compared to 3C (Figure 5). Ile473C, connected by a loop to the catalytic triad base His40, is less ordered in 3CD compared to 3C. The dynamic differences near the active site may be related to the different substrate specificity between 3CD and 3C, as has been proposed for other proteases [35,36,38,39].
There are also differences in conformational dynamics between the 3C protein and the 3C domain in 3CD outside of the protease active site. For example, there was a small upfield shift for Ile903C in the 13C dimension in 3CD relative to 3C (Figure 2). Ile903C*D is located near the linker between the 3C and 3D domains, and so its magnetic environment may be affected by the presence of the 3D domain. This residue also exchanges in both 3C and 3CD, although the kinetics, thermodynamics and/or exchanging conformation may be different (Figure 3). As the 3C and 3D domains do not interact in this region according to the X-ray crystal structure, these results may suggest that there is a difference in the average solution conformation for 3CD near the linker compared to the X-ray crystal structure.
While Ile1583C (or Ile153C; which have been difficult to resolve, although they are close in three-dimensional space) are exchanging in 3C, they do not appear to be exchanging in 3CD. Ile153C is adjacent to the PIP binding site containing Lys12 and Arg13. Ile943C*D and Ile1033C*D also do not appear to undergo detectable exchange, although the resonances are of low intensity and the relaxation dispersion profiles were noisy, likely due to the slow tumbling time, and hence elevated transverse relaxation rate, of 3CD. Ile943C is adjacent to the RNA and lipid binding site in 3C [20,21,91]. The presence of the linked 3D domain may result in conformational dynamic differences important for the RNA binding differences between 3C and 3CD [14,15,16].
4.2. Comparison of 3D and 3CD Conformational Dynamics
Ile33D, Ile3003D and Ile3313D, which are in the palm domain in between the N terminus of 3D and the active site, have been proposed to stiffen the structure of the polymerase via a hydrogen bonding network [29,84]. These residues all have higher order parameters in 3D than in 3CD, confirming that the conformational dynamics are reduced in 3D compared to 3CD. The only residues that were found to be much more ordered in 3CD compared to 3D are Ile3043D and Ile3243D, located in the palm domain. Ile3243D is on motif C, which contains the metal-coordinating Asp328. Ile3053D and Ile3163D, in the palm domain on motif B, are distant from the N terminus and 3C domain and appear to be in a very similar chemical environment in the x-ray crystal structures. However, they have different chemical shifts between 3D and 3CD. Ile3053D is on the same α-helix as Asn297, which contacts the 2′ OH of the incoming NTP [92]. Ile3003D, also on this helix, does not appear in the 3CD spectrum indicating that it is likely broadened by conformational exchange. Ile2953D, also on motif B, has a much higher Rex in 3CD than in 3D (Figure 7). This difference indicates that in 3CD, Ile2953CD* is likely exchanging to a state with a larger difference in chemical shift and/or a higher relative population. Alternatively, Ile2953D may be exchanging too fast for the contribution to relaxation from conformational exchange to be refocused as effectively by the CPMG pulse train. If the larger Rex in 3CD is due to a higher excited state population, this would be consistent with the idea that 3CD adopts additional conformations in solution relative to its isolated domains [18]. Ile903D is less ordered in 3CD than in 3D; this residue contacts Phe258, which has been shown to be necessary for recruitment of guanine nucleotide exchange factors required for membrane reorganization in 3CD but not 3D and 3C separately [11].
Ile173D and Ile583D, located near the N terminus of 3D in the fingers domain, have chemical shift differences between 3D and 3CD (Figure 6). These differences may be because the N terminus of 3D is tucked into the fingers domain whereas in 3CD it forms the linker between 3C and 3D. Residues Tyr118 and Tyr148 in the fingers domain have been shown to be important for initiation of RNA synthesis [93]. Ile1303D and Ile1503D, near these two residues, also have chemical shift differences between 3D and 3CD (Figure 6) and both have higher order parameters in 3D than in 3CD (Figure 8c). These differences in structure and/or conformational dynamics may contribute to the lack of polymerase functionality in 3CD. 1H CEST experiments revealed that Ile1303D is exchanging with a conformation that has a large difference in 1H chemical shift on the slow timescale in both 3D and 3CD. Insertion of four amino acids after Asp146, which is distant from the 3C domain, has been shown to decrease proteolytic processing of P1 by 3CD [23]. Ile1503D, which is on the same loop as Asp146, has a much higher order parameter in 3D than in 3CD, so the conformational dynamics observed for Ile1503CD* may be important for allosteric communication with the 3C domain.
5. Conclusions
We identified differences in conformational dynamics on the picosecond to second timescales between the poliovirus 3C, 3D and 3CD proteins via NMR spectroscopy that may be important for understanding the differences in protease specificity, RNA and lipid interactions and polymerase activity. Differences in conformational dynamics near the protease active site and RNA binding site in 3C may be important for differentiating functions between the 3C and 3CD proteases. Similarly, enhanced flexibility of the 3D domain of 3CD may help to explain its lack of polymerase activity. Addition of protease substrates, RNA and/or PIP lipids may further accentuate these dynamic differences. Our results indicate that allosteric coordination between the 3C and 3D domains of 3CD likely operates through changes in these conformational dynamics.
Supplementary Materials
The following are available online at https://www.mdpi.com/1999-4915/13/3/442/s1, Supplementary Methods: Validation of rotational correlation time τc by TRACT, Figure S1: Multiple quantum 1H-13C CPMG relaxation dispersion plots for δ1-methyl Ile groups in the 3C protein, Figure S2: 1H CEST profiles for δ1-methyl Ile groups in the 3C protein, Figure S3: 13C CEST profiles for δ1-methyl Ile groups in the 3C protein, Figure S4: Nonlinear fits for the intramethyl 1H-1H cross-correlated relaxation (eta), including the correction for dipolar interactions with external protons (delta) for δ1-methyl Ile groups in the 3C protein, Figure S5: Fitted 1H-15N TRACT results for determination of τc for 3C, Figure S6: Multiple quantum 1H-13C CPMG relaxation dispersion plots for δ1-methyl Ile groups in the 3C domain of the 3CD protein (i.e., 3C*D), Figure S7: 1H CEST profiles for δ1-methyl Ile groups in the 3C domain of the 3CD protein (i.e., 3C*D), Figure S8: Nonlinear fits for the intramethyl 1H-1H cross-correlated relaxation (eta), including the correction for dipolar interactions with external protons (delta) for δ1-methyl Ile groups in the 3CD protein, Figure S9: Multiple quantum 1H-13C CPMG relaxation dispersion plots for δ1-methyl Ile groups in 3D protein, Figure S10: 1H CEST profiles for δ1-methyl Ile groups in the 3D protein, Figure S11: Nonlinear fits for the intramethyl 1H-1H cross-correlated relaxation (eta), including the correction for dipolar interactions with external protons (delta) for δ1-methyl Ile groups in the 3D protein, Figure S12: Multiple quantum 1H-13C CPMG relaxation dispersion plots for δ1-methyl Ile groups in the 3D domain of the 3CD protein (i.e., 3CD*), Figure S13: 1H CEST profiles for δ1-methyl Ile groups in the 3D domain of the 3CD protein (i.e., 3CD*).
Author Contributions
Conceptualization, D.S.W. and D.D.B.; methodology, D.S.W. and D.D.B.; validation, D.S.W. and D.D.B.; formal analysis, D.S.W.; investigation, D.S.W.; resources, D.D.B.; data curation, D.S.W. and D.D.B.; writing—original draft preparation, D.S.W.; writing—review and editing, D.S.W. and D.D.B.; visualization, D.S.W. and D.D.B.; supervision, D.D.B.; project administration, D.D.B.; funding acquisition, D.D.B. All authors have read and agreed to the published version of the manuscript.
Funding
This research was funded by NIH, grant number AI104878.
Institutional Review Board Statement
Not applicable.
Informed Consent Statement
Not applicable.
Data Availability Statement
The data presented in this study are reported in the current manuscript or Supplementary Materials.
Acknowledgments
The authors would like to thank Drs. Scott Gorman and Tapas Mal for helping setting up the relaxation dispersion and CEST experiments, and Drs. Lewis Kay and Ranjith Muhandiram for help with setting up the triple quantum relaxation violated coherence transfer experiments and providing the pulse sequence. We acknowledge Christopher Bailey and Debashish Sahu for initial 3C resonance assignments, and Prasad Krishnan for initial 3D resonance assignments. This study made use of NMRbox: National Center for Biomolecular NMR Data Processing and Analysis, a Biomedical Technology Research Resource (BTRR), which is supported by NIH grant P41GM111135 (NIGMS).
Conflicts of Interest
The authors declare no conflict of interest. The funders had no role in the design of the study; in the collection, analyses, or interpretation of data; in the writing of the manuscript, or in the decision to publish the results.
References
- Spall, V.E.; Shanks, M.; Lomonossoff, G.P. Polyprotein Processing as a Strategy for Gene Expression in RNA Viruses. Semin. Virol. 1997, 8, 15–23. [Google Scholar] [CrossRef]
- Belshaw, R.; Pybus, O.G.; Rambaut, A. The evolution of genome compression and genomic novelty in RNA viruses. Genome Res. 2007, 17, 1496–1504. [Google Scholar] [CrossRef] [Green Version]
- Holmes, E.C. Error thresholds and the constraints to RNA virus evolution. Trends Microbiol. 2003, 11, 543–546. [Google Scholar] [CrossRef] [PubMed]
- Ni, P.; Cheng Kao, C. Non-encapsidation activities of the capsid proteins of positive-strand RNA viruses. Virology 2013, 446, 123–132. [Google Scholar] [CrossRef] [Green Version]
- Cameron, C.E.; Oh, H.S.; Moustafa, I.M. Expanding knowledge of P3 proteins in the poliovirus lifecycle. Future Microbiol. 2017, 5, 867–881. [Google Scholar] [CrossRef] [Green Version]
- Hellen, C.U.T.; Kraeusslich, H.G.; Wimmer, E. Proteolytic processing of polyproteins in the replication of RNA viruses. Biochemistry 1989, 28, 9881–9890. [Google Scholar] [CrossRef]
- Emmott, E.; de Rougemont, A.; Hosmillo, M.; Lu, J.; Fitzmaurice, T.; Haas, J.; Goodfellow, I. Polyprotein processing and intermolecular interactions within the viral replication complex spatially and temporally control norovirus protease activity. J. Biol. Chem. 2019, 294, 4259–4271. [Google Scholar] [CrossRef] [Green Version]
- Marcotte, L.L.; Wass, A.B.; Gohara, D.W.; Pathak, H.B.; Arnold, J.J.; Filman, D.J.; Cameron, C.E.; Hogle, J.M. Crystal Structure of Poliovirus 3CD Protein: Virally Encoded Protease and Precursor to the RNA-Dependent RNA Polymerase. J. Virol. 2007, 81, 3583–3596. [Google Scholar] [CrossRef] [Green Version]
- Parsley, T.B.; Cornell, C.T.; Semler, B.L. Modulation of the RNA Binding and Protein Processing Activities of Poliovirus Polypeptide 3CD by the Viral RNA Polymerase Domain. J. Biol. Chem. 1999, 274, 12867–12876. [Google Scholar] [CrossRef] [PubMed] [Green Version]
- Ypma-Wong, M.F.; Dewalt, P.G.; Johnson, V.H.; Lamb, J.G.; Semler, B.L. Protein 3CD is the major poliovirus proteinase responsible for cleavage of the p1 capsid precursor. Virology 1988, 166, 265–270. [Google Scholar] [CrossRef]
- Belov, G.A.; Habbersett, C.; Franco, D.; Ehrenfeld, E. Activation of cellular Arf GTPases by poliovirus protein 3CD correlates with virus replication. J. Virol. 2007, 81, 9259–9267. [Google Scholar] [CrossRef] [Green Version]
- Banerjee, S.; Aponte-Diaz, D.; Yeager, C.; Sharma, S.D.; Ning, G.; Oh, H.S.; Han, Q.; Umeda, M.; Hara, Y.; Wang, R.Y.L.; et al. Hijacking of multiple phospholipid biosynthetic pathways and induction of membrane biogenesis by a picornaviral 3CD protein. PLoS Pathog. 2018, 14, e1007086. [Google Scholar] [CrossRef] [Green Version]
- Oh, H.S.; Banerjee, S.; Aponte-Diaz, D.; Sharma, S.D.; Aligo, J.; Lodeiro, M.F.; Ning, G.; Sharma, R.; Arnold, J.J.; Cameron, C.E. Multiple poliovirus-induced organelles suggested by comparison of spatiotemporal dynamics of membranous structures and phosphoinositides. PLoS Pathog. 2018, 14, e1007036. [Google Scholar] [CrossRef] [PubMed] [Green Version]
- Andino, R.; Rieckhof, G.E.; Achacoso, P.L.; Baltimore, D. Poliovirus RNA synthesis utilizes an RNP complex formed around the 5′-end of viral RNA. EMBO J. 1993, 12, 3587–3598. [Google Scholar] [CrossRef]
- Gamarnik, A.V.; Andino, R. Interactions of Viral Protein 3CD and Poly(rC) Binding Protein with the 5′ Untranslated Region of the Poliovirus Genome. J. Virol. 2000, 74, 2219–2226. [Google Scholar] [CrossRef] [PubMed] [Green Version]
- Spear, A.; Ogram, S.A.; Morasco, B.J.; Smerage, L.E.; Flanegan, J.B. Viral precursor protein P3 and its processed products perform discrete and essential functions in the poliovirus RNA replication complex. Virology 2015, 485, 492–501. [Google Scholar] [CrossRef] [Green Version]
- Ypma-Wong, M.F.; Semler, B.L. Processing determinants required for in vitro cleavage of the poliovirus P1 precursor to capsid proteins. J. Virol. 1987, 61, 3181–3189. [Google Scholar] [CrossRef] [Green Version]
- Moustafa, I.M.; Gohara, D.W.; Uchida, A.; Yennawar, N.; Cameron, C.E. Conformational Ensemble of the Poliovirus 3CD Precursor Observed by MD Simulations and Confirmed by SAXS: A Strategy to Expand the Viral Proteome? Viruses 2015, 7, 5962–5986. [Google Scholar] [CrossRef] [Green Version]
- Mosimann, S.C.; Cherney, M.M.; Sia, S.; Plotch, S.; James, M.N.G. Refined X-ray crystallographic structure of the poliovirus 3C gene product11Edited By, D. Rees. J. Mol. Biol. 1997, 273, 1032–1047. [Google Scholar] [CrossRef] [PubMed]
- Amero, C.D.; Arnold, J.J.; Moustafa, I.M.M.; Cameron, C.E.E.; Foster, M.P. Identification of the oriI-Binding Site of Poliovirus 3C Protein by Nuclear Magnetic Resonance Spectroscopy. J. Virol. 2017, 82, 4363–4370. [Google Scholar] [CrossRef] [Green Version]
- Shengjuler, D.; Chan, Y.M.; Sun, S.; Moustafa, I.M.; Li, Z.-L.; Gohara, D.W.; Buck, M.; Cremer, P.S.; Boehr, D.D.; Cameron, C.E. The RNA-Binding Site of Poliovirus 3C Protein Doubles as a Phosphoinositide-Binding Domain. Structure 2017, 25, 1875–1886.e7. [Google Scholar] [CrossRef] [Green Version]
- Jore, J.; De Geus, B.; Jackson, R.J.; Pouwels, P.H.; Enger-Valk, B.E. Poliovirus protein 3CD is the active protease for processing of the precursor protein P1 in vitro. J. Gen. Virol. 1988, 69, 1627–1636. [Google Scholar] [CrossRef] [PubMed]
- Semler, B.L.; Johnson, V.H.; Dewalt, P.G.; Ypma-Wong, M.F. Site-specific mutagenesis of cDNA clones expressing a poliovirus proteinase. J. Cell. Biochem. 1987, 33, 39–51. [Google Scholar] [CrossRef]
- Černý, J.; Bolfíková, B.Č.; Valdés, J.J.; Grubhoffer, L.; Růžek, D. Evolution of Tertiary Structure of Viral RNA Dependent Polymerases. PLoS ONE 2014, 9, e96070. [Google Scholar] [CrossRef] [PubMed] [Green Version]
- Hobson, S.D.; Rosenblum, E.S.; Richards, O.C.; Richmond, K.; Kirkegaard, K.; Schultz, S.C. Oligomeric structures of poliovirus polymerase are important for function. EMBO J. 2001, 20, 1153–1163. [Google Scholar] [CrossRef] [PubMed] [Green Version]
- Rothstein, M.A.; Richards, O.C.; Amin, C.; Ehrenfeld, E. Enzymatic activity of poliovirus RNA polymerase synthesized in Escherichia coli from viral cDNA. Virology 1988, 164, 301–308. [Google Scholar] [CrossRef]
- Plotch, S.J.; Palant, O.; Gluzman, Y. Purification and properties of poliovirus RNA polymerase expressed in Escherichia coli. J. Virol. 1989, 63, 216–225. [Google Scholar] [CrossRef] [Green Version]
- Gohara, D.W.; Ha, C.S.; Kumar, S.; Ghosh, B.; Arnold, J.J.; Wisniewski, T.J.; Cameron, C.E. Production of “Authentic” Poliovirus RNA-Dependent RNA Polymerase (3Dpol) by Ubiquitin–Protease-Mediated Cleavage in Escherichia coli. Protein Expr. Purif. 1999, 17, 128–138. [Google Scholar] [CrossRef]
- Thompson, A.A.; Peersen, O.B. Structural basis for proteolysis-dependent activation of the poliovirus RNA-dependent RNA polymerase. EMBO J. 2004, 23, 3462–3471. [Google Scholar] [CrossRef] [Green Version]
- Harris, K.S.; Reddigari, S.R.; Nicklin, M.J.; Hämmerle, T.; Wimmer, E. Purification and characterization of poliovirus polypeptide 3CD, a proteinase and a precursor for RNA polymerase. J. Virol. 1992, 66, 7481–7489. [Google Scholar] [CrossRef] [Green Version]
- Kim, T.W.; Brieba, L.G.; Ellenberger, T.; Kool, E.T. Functional Evidence for a Small and Rigid Active Site in a High Fidelity DNA Polymerase Probing T7 DNA polymerase with variably sized base pairs. J. Biol. Chem. 2006, 281, 2289–2295. [Google Scholar] [CrossRef] [Green Version]
- Belliot, G.; Sosnovtsev, S.V.; Chang, K.-O.; Babu, V.; Uche, U.; Arnold, J.J.; Cameron, C.E.; Green, K.Y. Norovirus Proteinase-Polymerase and Polymerase Are Both Active Forms of RNA-Dependent RNA Polymerase. J. Virol. 2005, 79, 2393–2403. [Google Scholar] [CrossRef] [Green Version]
- Verlinden, Y.; Cuconati, A.; Wimmer, E.; Rombau, B. The viral protein 3CD induces an equilibrium between the viral protein and RNA synthesis in a cell-free system for poliovirus replication. Arch. Virol. 2002, 147, 731–744. [Google Scholar] [CrossRef] [PubMed]
- Blair, W.S.; Li, X.; Semler, B.L. 3CD Cleavage of the Poliovirus P1 Precursor: A Model for Complex Proteinase/Substrate Interactions. Regul. Gene Expr. Anim. Viruses 1993, 225–244. [Google Scholar] [CrossRef]
- Piana, S.; Carloni, P.; Parrinello, M. Role of Conformational Fluctuations in the Enzymatic Reaction of HIV-1 Protease. J. Mol. Biol. 2002, 319, 567–583. [Google Scholar] [CrossRef]
- Hedstrom, L.; Szilagyi, L.; Rutter, W.J. Converting trypsin to chymotrypsin: The role of surface loops. Science 1992, 255, 1249–1253. [Google Scholar] [CrossRef]
- Hedstrom, L.; Farr-Jones, S.; Kettner, C.A.; Rutter, W.J. Converting Trypsin to Chymotrypsin: Ground-State Binding Does Not Determine Substrate Specificity. Biochemistry 1994, 33, 8764–8769. [Google Scholar] [CrossRef] [PubMed]
- Miller, D.W.; Agard, D.A. Enzyme specificity under dynamic control: A normal mode analysis of α-lytic protease 11Edited by P. E. Wright. J. Mol. Biol. 1999, 286, 267–278. [Google Scholar] [CrossRef]
- Ma, W.; Tang, C.; Lai, L. Specificity of Trypsin and Chymotrypsin: Loop-Motion-Controlled Dynamic Correlation as a Determinant. Biophys. J. 2005, 89, 1183–1193. [Google Scholar] [CrossRef] [Green Version]
- Moustafa, I.M.; Korboukh, V.K.; Arnold, J.J.; Smidansky, E.D.; Marcotte, L.L.; Gohara, D.W.; Yang, X.; Sánchez-Farrán, M.A.; Filman, D.; Maranas, J.K.; et al. Structural Dynamics as a Contributor to Error-prone Replication by an RNA-dependent RNA Polymerase. J. Biol. Chem. 2014, 289, 36229–36248. [Google Scholar] [CrossRef] [Green Version]
- Liu, X.; Yang, X.; Lee, C.A.; Moustafa, I.M.; Smidansky, E.D.; Lum, D.; Arnold, J.J.; Cameron, C.E.; Boehr, D.D. Vaccine-derived Mutation in Motif D of Poliovirus RNA-dependent RNA Polymerase Lowers Nucleotide Incorporation Fidelity. J. Biol. Chem. 2013, 288, 32753–32765. [Google Scholar] [CrossRef] [Green Version]
- Shi, J.; Perryman, J.M.; Yang, X.; Liu, X.; Musser, D.M.; Boehr, A.K.; Moustafa, I.M.; Arnold, J.J.; Cameron, C.E.; Boehr, D.D. Rational Control of Poliovirus RNA-Dependent RNA Polymerase Fidelity by Modulating Motif-D Loop Conformational Dynamics. Biochemistry 2019, 58, 3735–3743. [Google Scholar] [CrossRef]
- Ren, Z.; Ghose, R. Slow Conformational Dynamics in the Cystoviral RNA-Directed RNA Polymerase P2: Influence of Substrate Nucleotides and Template RNA. Biochemistry 2011, 50, 1875–1884. [Google Scholar] [CrossRef] [PubMed] [Green Version]
- Alphonse, S.; Ghose, R. Methyl NMR spectroscopy: Measurement of dynamics in viral RNA-directed RNA polymerases. Methods 2018, 148, 100–114. [Google Scholar] [CrossRef]
- Damm, K.L.; Carlson, H.A. Exploring experimental sources of multiple protein conformations in structure-based drug design. J. Am. Chem. Soc. 2007, 129, 8225–8235. [Google Scholar] [CrossRef] [PubMed]
- Schames, J.R.; Henchman, R.H.; Siegel, J.S.; Sotriffer, C.A.; Ni, H.; McCammon, J.A. Discovery of a Novel Binding Trench in HIV Integrase. J. Med. Chem. 2004, 47, 1879–1881. [Google Scholar] [CrossRef]
- Cozzini, P.; Kellogg, G.E.; Spyrakis, F.; Abraham, D.J.; Costantino, G.; Emerson, A.; Fanelli, F.; Gohlke, H.; Kuhn, L.A.; Morris, G.M.; et al. Target flexibility: An emerging consideration in drug discovery and design. J. Med. Chem. 2008, 51, 6237–6255. [Google Scholar] [CrossRef] [PubMed] [Green Version]
- Fuentes, G.; Dastidar, S.G.; Madhumalar, A.; Verma, C.S. Role of protein flexibility in the discovery of new drugs. Drug Dev. Res. 2011, 72, 26–35. [Google Scholar] [CrossRef]
- Antunes, D.A.; Devaurs, D.; Kavraki, L.E. Understanding the challenges of protein flexibility in drug design. Expert Opin. Drug Discov. 2015, 10, 1301–1313. [Google Scholar] [CrossRef] [PubMed] [Green Version]
- Vallurupalli, P.; Sekhar, A.; Yuwen, T.; Kay, L.E. Probing conformational dynamics in biomolecules via chemical exchange saturation transfer: A primer. J. Biomol. NMR 2017, 67, 243–271. [Google Scholar] [CrossRef] [PubMed]
- Ishima, R. CPMG Relaxation Dispersion. In Protein Dynamics: Methods and Protocols; Livesay, D.R., Ed.; Methods in Molecular Biology; Humana Press: Totowa, NJ, USA, 2014; pp. 29–49. ISBN 978-1-62703-658-0. [Google Scholar]
- Tugarinov, V.; Sprangers, R.; Kay, L.E. Probing Side-Chain Dynamics in the Proteasome by Relaxation Violated Coherence Transfer NMR Spectroscopy. J. Am. Chem. Soc. 2007, 129, 1743–1750. [Google Scholar] [CrossRef]
- Kovermann, M.; Rogne, P.; Wolf-Watz, M. Protein dynamics and function from solution state NMR spectroscopy. Q. Rev. Biophys. 2016, 49. [Google Scholar] [CrossRef]
- Mittermaier, A.K.; Kay, L.E. Observing biological dynamics at atomic resolution using NMR. Trends Biochem. Sci. 2009, 34, 601–611. [Google Scholar] [CrossRef] [PubMed]
- Caro, J.A.; Harpole, K.W.; Kasinath, V.; Lim, J.; Granja, J.; Valentine, K.G.; Sharp, K.A.; Wand, A.J. Entropy in molecular recognition by proteins. Proc. Natl. Acad. Sci. USA 2017, 114, 6563–6568. [Google Scholar] [CrossRef] [Green Version]
- Capdevila, D.A.; Braymer, J.J.; Edmonds, K.A.; Wu, H.; Giedroc, D.P. Entropy redistribution controls allostery in a metalloregulatory protein. Proc. Natl. Acad. Sci. USA 2017, 114, 4424–4429. [Google Scholar] [CrossRef] [Green Version]
- Kleckner, I.R.; Foster, M.P. An introduction to NMR-based approaches for measuring protein dynamics. Biochim. Biophys. Acta 2011, 1814, 942–968. [Google Scholar] [CrossRef] [PubMed] [Green Version]
- Henzler-Wildman, K.; Kern, D. Dynamic personalities of proteins. Nature 2007, 450, 964–972. [Google Scholar] [CrossRef] [PubMed]
- Azatian, S.B.; Kaur, N.; Latham, M.P. Increasing the buffering capacity of minimal media leads to higher protein yield. J. Biomol. NMR 2019, 73, 11–17. [Google Scholar] [CrossRef] [PubMed]
- Yang, X.; Welch, J.L.; Arnold, J.J.; Boehr, D.D. Long-Range Interaction Networks in the Function and Fidelity of Poliovirus RNA-Dependent RNA Polymerase Studied by Nuclear Magnetic Resonance. Biochemistry 2010, 49, 9361–9371. [Google Scholar] [CrossRef] [PubMed] [Green Version]
- Delaglio, F.; Grzesiek, S.; Vuister, G.W.; Zhu, G.; Pfeifer, J.; Bax, A. NMRPipe: A multidimensional spectral processing system based on UNIX pipes. J. Biomol. NMR 1995, 6, 277–293. [Google Scholar] [CrossRef]
- Maciejewski, M.W.; Schuyler, A.D.; Gryk, M.R.; Moraru, I.I.; Romero, P.R.; Ulrich, E.L.; Eghbalnia, H.R.; Livny, M.; Delaglio, F.; Hoch, J.C. NMRbox: A Resource for Biomolecular NMR Computation. Biophys. J. 2017, 112, 1529–1534. [Google Scholar] [CrossRef] [Green Version]
- Tugarinov, V.; Kay, L.E. Ile, Leu, and Val Methyl Assignments of the 723-Residue Malate Synthase G Using a New Labeling Strategy and Novel NMR Methods. J. Am. Chem. Soc. 2003, 125, 13868–13878. [Google Scholar] [CrossRef]
- Sun, H.; Kay, L.E.; Tugarinov, V. An Optimized Relaxation-Based Coherence Transfer NMR Experiment for the Measurement of Side-Chain Order in Methyl-Protonated, Highly Deuterated Proteins. J. Phys. Chem. B 2011, 115, 14878–14884. [Google Scholar] [CrossRef]
- Hoffmann, F.; Xue, M.; Schäfer, L.V.; Mulder, F.A.A. Narrowing the gap between experimental and computational determination of methyl group dynamics in proteins. Phys. Chem. Chem. Phys. 2018, 20, 24577–24590. [Google Scholar] [CrossRef] [Green Version]
- Bernado, P.; Garcia de la Torre, J.; Pons, M. Interpretation of 15N NMR relaxation data of globular proteins using hydrodynamic calculations with HYDRONMR. J. Biomol. NMR 2002, 23, 139–150. [Google Scholar] [CrossRef]
- Tugarinov, V.; Kay, L.E. Relaxation rates of degenerate 1H transitions in methyl groups of proteins as reporters of side-chain dynamics. J. Am. Chem. Soc. 2006, 128, 7299–7308. [Google Scholar] [CrossRef] [PubMed]
- Tjandra, N.; Bax, A.; Feller, S.E.; Pastor, R.W. Rotational Diffusion Anisotropy of Human Ubiquitin from 15N NMR Relaxation. J. Am. Chem. Soc. 1995, 117, 12562–12566. [Google Scholar] [CrossRef]
- Woessner, D.E. Nuclear spin relaxation in ellipsoids undergoing rotational brownian motion. J. Chem. Phys. 1962, 37, 647–654. [Google Scholar] [CrossRef]
- Korzhnev, D.M.; Kloiber, K.; Kanelis, V.; Tugarinov, V.; Kay, L.E. Probing Slow Dynamics in High Molecular Weight Proteins by Methyl-TROSY NMR Spectroscopy: Application to a 723-Residue Enzyme. J. Am. Chem. Soc. 2004, 126, 3964–3973. [Google Scholar] [CrossRef] [PubMed]
- Kleckner, I.R.; Foster, M.P. GUARDD: User-friendly MATLAB software for rigorous analysis of CPMG RD NMR data. J. Biomol. NMR 2012, 52, 11–22. [Google Scholar] [CrossRef] [PubMed] [Green Version]
- Yuwen, T.; Sekhar, A.; Kay, L.E. Separating Dipolar and Chemical Exchange Magnetization Transfer Processes in 1H-CEST. Angew. Chem. Int. Ed. 2017, 56, 6122–6125. [Google Scholar] [CrossRef]
- Bouvignies, G.; Kay, L.E. A 2D 13C-CEST experiment for studying slowly exchanging protein systems using methyl probes: An application to protein folding. J. Biomol. NMR 2012, 53, 303–310. [Google Scholar] [CrossRef] [PubMed]
- Ollerenshaw, J.E.; Tugarinov, V.; Kay, L.E. Methyl TROSY: Explanation and experimental verification. Magn. Reson. Chem. 2003, 41, 843–852. [Google Scholar] [CrossRef]
- Farber, P.J.; Mittermaier, A. Relaxation dispersion NMR spectroscopy for the study of protein allostery. Biophys. Rev. 2015, 7, 191–200. [Google Scholar] [CrossRef] [PubMed] [Green Version]
- Chan, Y.M. Functional Regulation and Protein Structural Dynamics of Poliovirus 3C Protease; The Pennsylvania State University: State College, PA, USA, 2015. [Google Scholar]
- Hass, M.A.S.; Hansen, D.F.; Christensen, H.E.M.; Led, J.J.; Kay, L.E. Characterization of conformational exchange of a histidine side chain: Protonation, rotamerization, and tautomerization of His61 in plastocyanin from Anabaena variabilis. J. Am. Chem. Soc. 2008. [Google Scholar] [CrossRef]
- Vallurupalli, P.; Bouvignies, G.; Kay, L.E. Studying “Invisible” Excited Protein States in Slow Exchange with a Major State Conformation. J. Am. Chem. Soc. 2012, 134, 8148–8161. [Google Scholar] [CrossRef]
- Lipari, G.; Szabo, A. Model-free approach to the interpretation of nuclear magnetic resonance relaxation in macromolecules. 1. Theory and range of validity. J. Am. Chem. Soc. 1982, 104, 4546–4559. [Google Scholar] [CrossRef]
- Frederick, K.K.; Sharp, K.A.; Warischalk, N.; Wand, A.J. Re-Evaluation of the Model-Free Analysis of Fast Internal Motion in Proteins Using NMR Relaxation. J. Phys. Chem. B 2008, 112, 12095–12103. [Google Scholar] [CrossRef] [PubMed] [Green Version]
- Lee, D.; Hilty, C.; Wider, G.; Wüthrich, K. Effective rotational correlation times of proteins from NMR relaxation interference. J. Magn. Reson. 2006, 178, 72–76. [Google Scholar] [CrossRef]
- Dewalt, P.G.; Semler, B.L. Site-directed mutagenesis of proteinase 3C results in a poliovirus deficient in synthesis of viral RNA polymerase. J. Virol. 1987, 61, 2162–2170. [Google Scholar] [CrossRef] [Green Version]
- Shengjuler, D. Targeting Viral Proteins to Sites of Genome Replication: Discovery and Characterization of Viral Phosphoinositide-Binding Domains; Pennsylvania State University: Philadelphia, PA, USA, 2017. [Google Scholar]
- Peersen, O.B. Picornaviral polymerase structure, function, and fidelity modulation. Virus Res. 2017, 234, 4–20. [Google Scholar] [CrossRef] [PubMed] [Green Version]
- Walsh, J.D.; Meier, K.; Ishima, R.; Gronenborn, A.M. NMR studies on domain diffusion and alignment in modular GB1 repeats. Biophys. J. 2010, 99, 2636–2646. [Google Scholar] [CrossRef] [Green Version]
- Jacobs, D.M.; Saxena, K.; Vogtherr, M.; Bernadó, P.; Pons, M.; Fiebig, K.M. Peptide Binding Induces Large Scale Changes in Inter-domain Mobility in Human Pin1. J. Biol. Chem. 2003, 278, 26174–26182. [Google Scholar] [CrossRef] [PubMed] [Green Version]
- Bernadó, P.; Fernandes, M.X.; Jacobs, D.M.; Fiebig, K.; García de la Torre, J.; Pons, M. Interpretation of NMR relaxation properties of Pin1, a two-domain protein, based on Brownian dynamic simulations. J. Biomol. NMR 2004, 29, 21–35. [Google Scholar] [CrossRef] [PubMed]
- Gottschalk, M.; Halle, B. Self-association of lysozyme as seen by magnetic relaxation dispersion. J. Phys. Chem. B 2003, 107, 7914–7922. [Google Scholar] [CrossRef]
- Krushelnitsky, A. Intermolecular electrostatic interactions and Brownian tumbling in protein solutions. Phys. Chem. Chem. Phys. 2006, 8, 2117–2128. [Google Scholar] [CrossRef]
- Vugmeyster, L.; Raleigh, D.P.; Palmer, A.G.; Vugmeister, B.E. Beyond the decoupling approximation in the model free approach for the interpretation of NMR relaxation of macromolecules in solution. J. Am. Chem. Soc. 2003, 125, 8400–8404. [Google Scholar] [CrossRef]
- Chan, Y.M.; Moustafa, I.M.; Arnold, J.J.; Cameron, C.E.; Boehr, D.D. Long-Range Communication between Different Functional Sites in the Picornaviral 3C Protein. Structure 2016, 24, 509–517. [Google Scholar] [CrossRef] [Green Version]
- Gong, P.; Kortus, M.G.; Nix, J.C.; Davis, R.E.; Peersen, O.B. Structures of Coxsackievirus, Rhinovirus, and Poliovirus Polymerase Elongation Complexes Solved by Engineering RNA Mediated Crystal Contacts. PLoS ONE 2013, 8, e60272. [Google Scholar] [CrossRef] [PubMed] [Green Version]
- Kortus, M.G.; Kempf, B.J.; Haworth, K.G.; Barton, D.J.; Peersen, O.B. A Template RNA Entry Channel in the Fingers Domain of the Poliovirus Polymerase. J. Mol. Biol. 2012, 417, 263–278. [Google Scholar] [CrossRef] [Green Version]
Figure 1.
Structural comparison of poliovirus 3C, 3D, and 3CD proteins. (a) X-ray crystal structure of poliovirus 3CD (PDB: 2IJD). (b) X-ray crystal structure of poliovirus 3D RNA-dependent RNA polymerase (PDB: 1RA6). The subdomains of 3D are colored: palm – purple, fingers – green, thumb – orange. Motifs B and C in the palm subdomain are also colored, brown and cyan, respectively. (c) X-ray crystal structure of poliovirus 3C protease (PDB: 1L1N). The protease catalytic triad is shown in cyan, polymerase active site residues are shown in magenta, and RNA/PIP binding region is shown in green. (d) Active sites of 3C (gray) and 3C domain of 3CD (brown). (e) Active sites of 3D (gray) and 3D domain of 3CD (brown).

Figure 2.
1H-13C heteronclear multiple quantum coherence (HMQC) Ile methyl NMR spectrum of 3C (red) and 3CD (black).
Figure 2.
1H-13C heteronclear multiple quantum coherence (HMQC) Ile methyl NMR spectrum of 3C (red) and 3CD (black).

Figure 3.
Conformational exchange processes in 3C and the 3C domain of 3CD on the µs-ms timescale. (a) Rex, the contribution to relaxation from conformational exchange, from multiple quantum 1H-13C CPMG (Carr-Purcell-Meiboom-Gill) relaxation dispersion for 3C is plotted as colored spheres (gray: no detectable exchange, blue < 2–4 s−1, purple: 4–10 s−1, red > 10 s−1). The protease active site is shown in cyan and the RNA binding site is shown in green. (b) Multiple quantum 1H-13CHHHH CPMG relaxation dispersion curve for Ile151 in 3C. The effective relaxation rate R2eff is plotted against the CPMG pulsing frequency. (c) Rex from multiple quantum 1H-13C CPMG relaxation dispersion for 3CD is plotted as colored spheres (gray: no detectable exchange, red > 10 s−1). (d) Multiple quantum 1H-13CHHHH CPMG relaxation dispersion curve for Ile151 in the 3C domain of 3CD.

Figure 4.
Chemical exchange saturation transfer (CEST) profiles for selected residues in 3C, 3D, and 3CD. Error bars were calculated from spectral noise. (a) 13C CEST profile for Ile151 in 3C. The decrease in intensity at 8.5 ppm is because the 13C chemical shift for Ile151 is at 8.5 ppm. The decrease around 11 ppm is due to conformational exchange. (b) 1H CEST profile for Ile151 in 3C. For the 1H CEST experiments used here, the measured intensity is only non-zero when the observed resonance or a state it is exchanging to has 1H chemical shift around the saturating frequency. (c) 1H CEST profile of Ile130 in 3D (black) and 3CD (red, 3D numbering). (d) 1H CEST profile for Ile151 in 3CD.

Figure 5.
Methyl axis order parameters for 3C and the 3C domain in 3CD. Methyl axis order parameters are plotted as colored spheres ranging from 0.4–1 (red to blue) as indicated for (a) 3C and (b) 3C domain of 3CD. (c) Differences in methyl axis order parameters between 3C and 3CD (ΔS2 = S2 (3C) − S2 (3CD)) are plotted as colored spheres, ranging from −0.4 to +0.4 (red to blue).

Figure 6.
1H-13C-HMQC Ile methyl NMR spectra of 3D (red) and 3CD (black). 3D numbering is used here for both 3D and the 3D domain in 3CD; to find the corresponding number in 3CD, the reader would need to add 183.
Figure 6.
1H-13C-HMQC Ile methyl NMR spectra of 3D (red) and 3CD (black). 3D numbering is used here for both 3D and the 3D domain in 3CD; to find the corresponding number in 3CD, the reader would need to add 183.

Figure 7.
Conformational exchange processes in 3D and the 3D domain of 3CD on the μs-ms timescale. (a) Rex, the contribution to transverse relaxation from conformational exchange, from multiple quantum 1H-13C CPMG relaxation dispersion for 3D plotted as colored spheres (gray: no detectable exchange, blue < 2–3 s−1, purple: 3–10 s−1). (b) Multiple quantum 1H-13CHHHH CPMG relaxation dispersion curve for Ile295 in 3D. (c) Rex from multiple quantum 1H-13C CPMG relaxation dispersion for 3CD plotted as colored spheres (gray: no detectable exchange, purple: 3–10 s−1, red > 10 s−1). (d) Multiple quantum 1H-13CHHHH CPMG relaxation dispersion curve for Ile295 in the 3D domain of 3CD. 3D numbering is used here for both 3D and the 3D domain in 3CD; to find the corresponding number in 3CD, the reader would need to add 183.

Figure 8.
Methyl axis order parameters for 3D and the 3D domain in 3CD. Methyl axis order parameters are plotted as colored spheres ranging from 0.4–1 (red to blue) as indicated for (a) 3D and (b) 3D domain of 3CD. (c) Differences in methyl axis order parameters between 3D and 3CD (ΔS2 = S2 (3D) − S2 (3CD)) are plotted as colored spheres, ranging from −0.4 to +0.4 (red to blue). 3D numbering is used here for both 3D and the 3D domain in 3CD; to find the corresponding number in 3CD, the reader would need to add 183.

Figure 9.
Distribution of intramethyl 1H-1H dipolar cross-correlated relaxation rates (η) and the equivalent S2τc values determined by triple quantum relaxation violated coherence transfer NMR experiments for the 3C and 3D domains independently and in 3CD. Values of τc calculated from HydroNMR are shown in red. Mean ± standard deviation of η: 3C: 62 ± 14 s−1, 3D: 186 ± 75 s−1, 3C in 3CD: 306 ± 70 s−1, 3D in 3CD: 379 ± 153 s−1.

Publisher’s Note: MDPI stays neutral with regard to jurisdictional claims in published maps and institutional affiliations. |
© 2021 by the authors. Licensee MDPI, Basel, Switzerland. This article is an open access article distributed under the terms and conditions of the Creative Commons Attribution (CC BY) license (http://creativecommons.org/licenses/by/4.0/).
Share and Cite
MDPI and ACS Style
Winston, D.S.; Boehr, D.D. The Picornavirus Precursor 3CD Has Different Conformational Dynamics Compared to 3Cpro and 3Dpol in Functionally Relevant Regions. Viruses 2021, 13, 442. https://doi.org/10.3390/v13030442
AMA Style
Winston DS, Boehr DD. The Picornavirus Precursor 3CD Has Different Conformational Dynamics Compared to 3Cpro and 3Dpol in Functionally Relevant Regions. Viruses. 2021; 13(3):442. https://doi.org/10.3390/v13030442
Chicago/Turabian StyleWinston, Dennis S., and David D. Boehr. 2021. "The Picornavirus Precursor 3CD Has Different Conformational Dynamics Compared to 3Cpro and 3Dpol in Functionally Relevant Regions" Viruses 13, no. 3: 442. https://doi.org/10.3390/v13030442
Note that from the first issue of 2016, this journal uses article numbers instead of page numbers. See further details here.