
Space Photometry with Brite-Constellation §

 , , , , , ,
  , , , , , , , , , , and
Abstract
:1. A Brief Flashback
2. The Birth of BRITE-Constellation
3. BRITE-Constellation
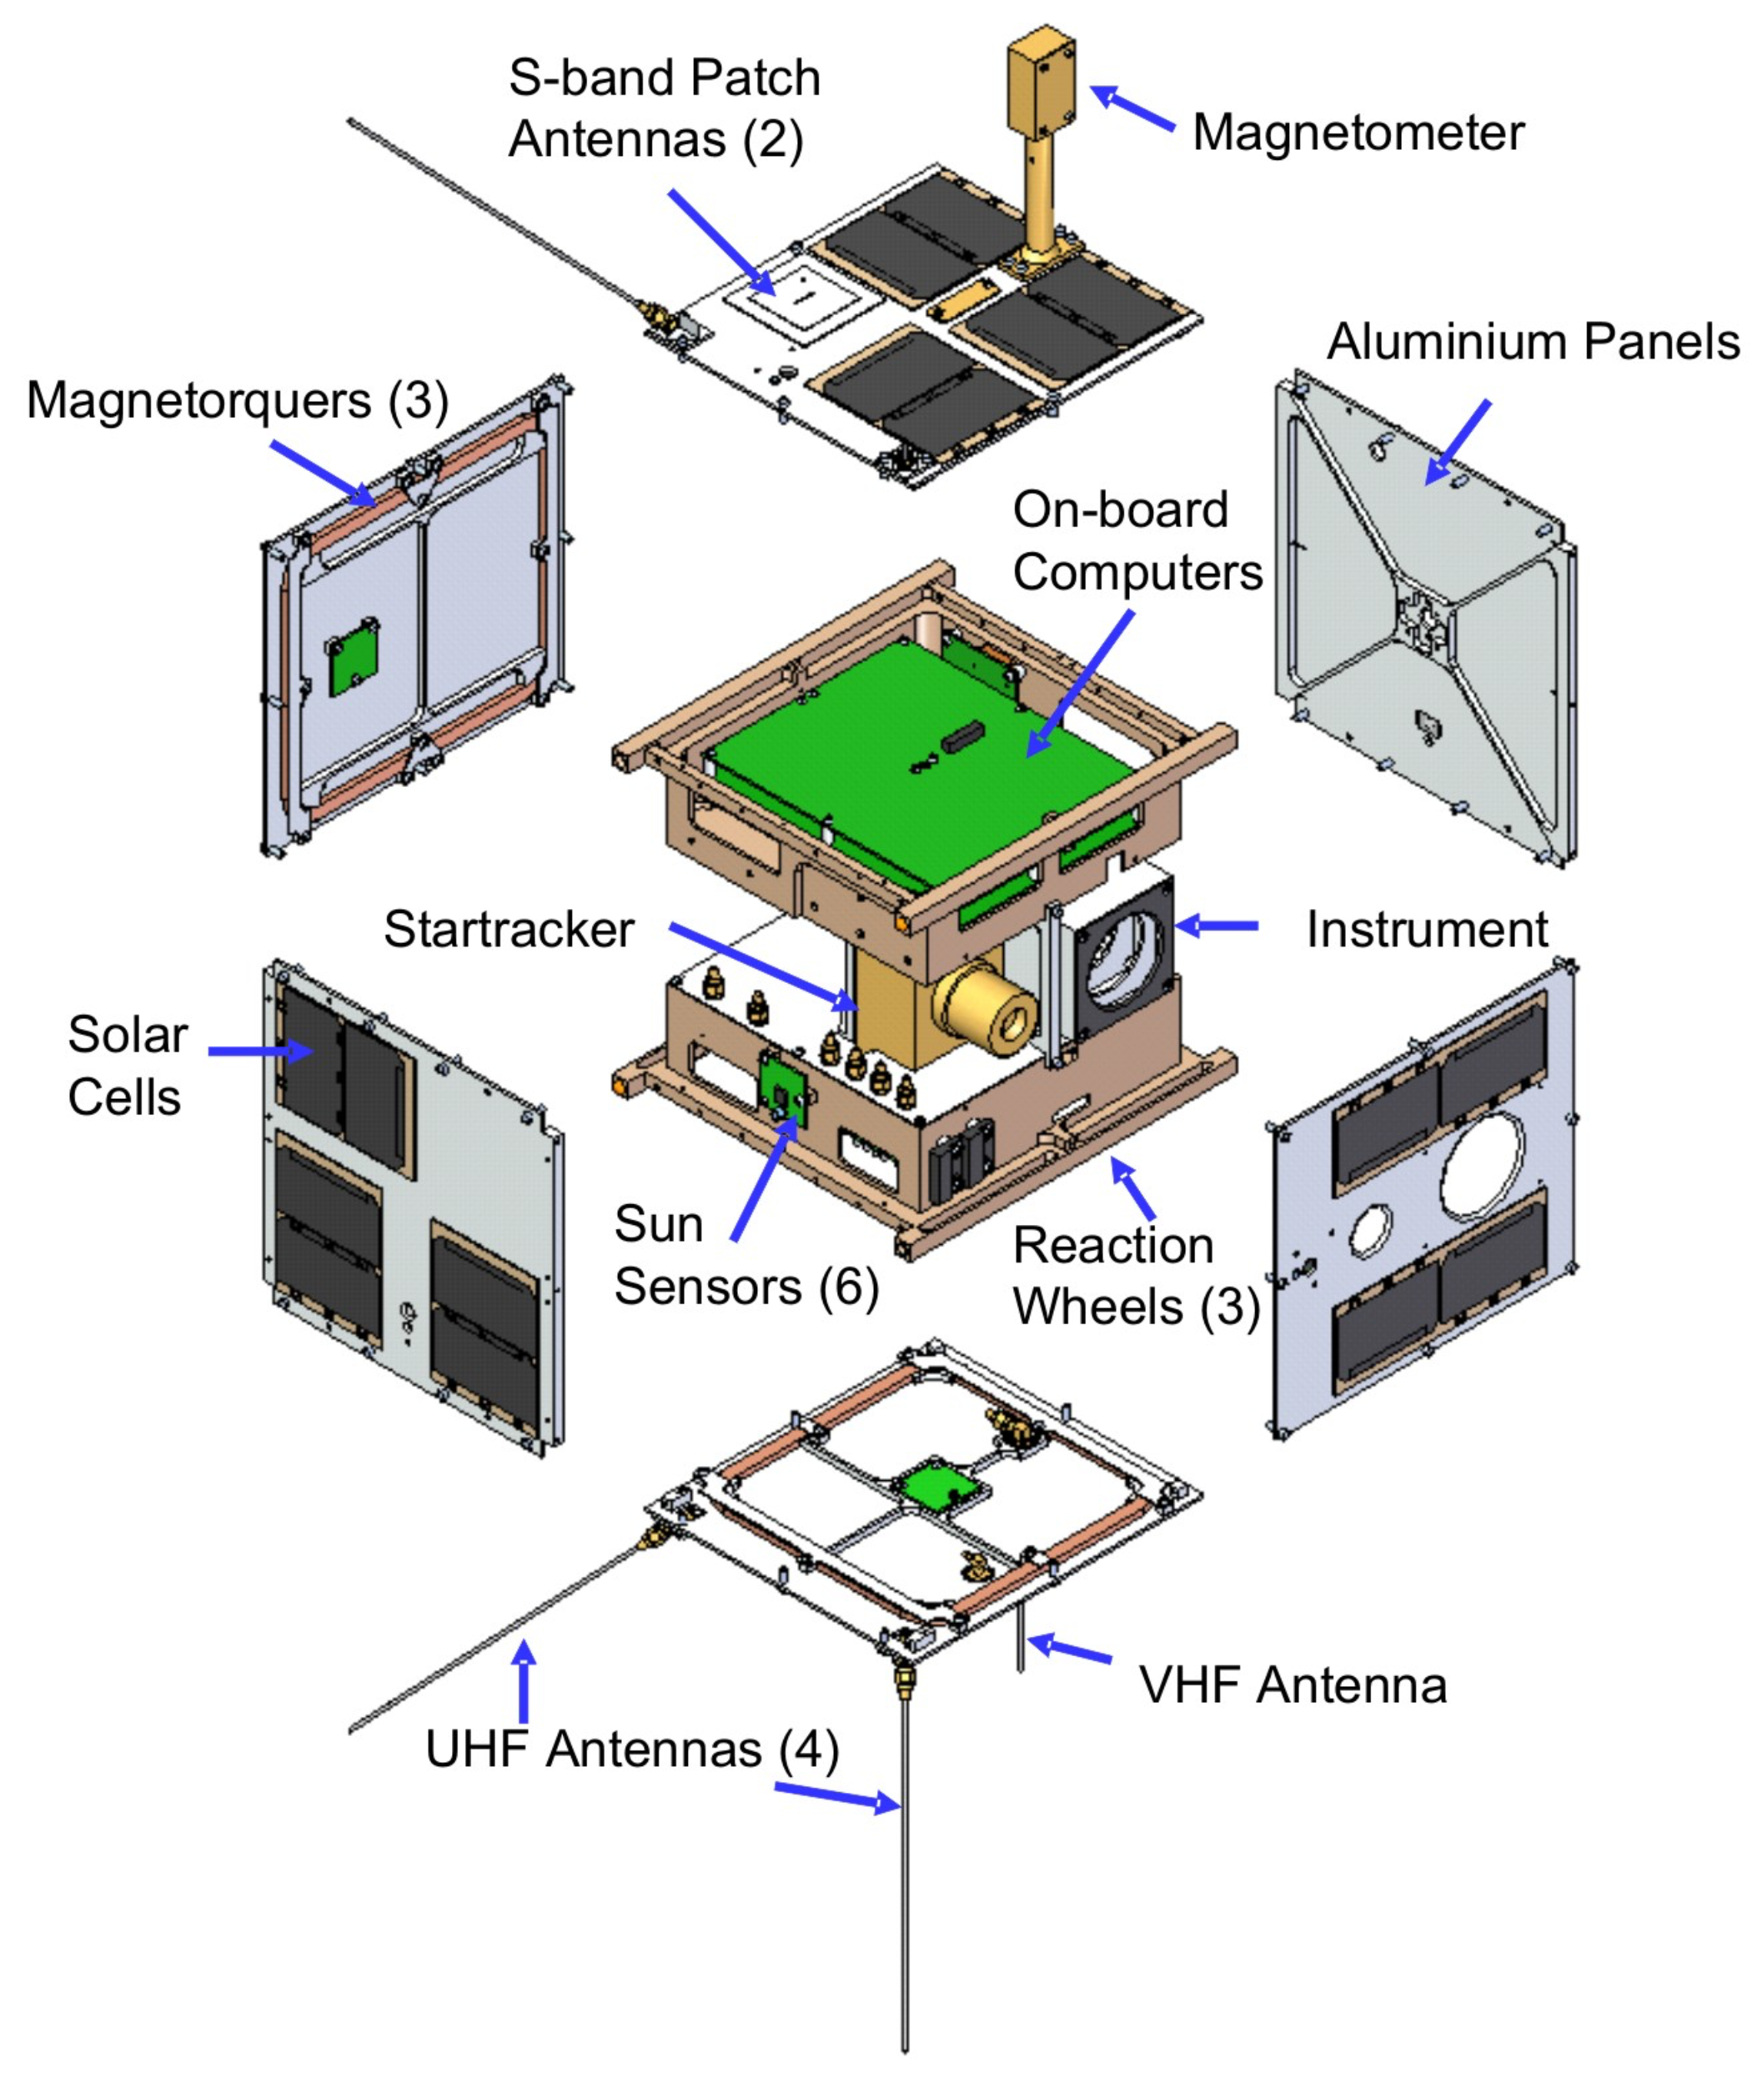
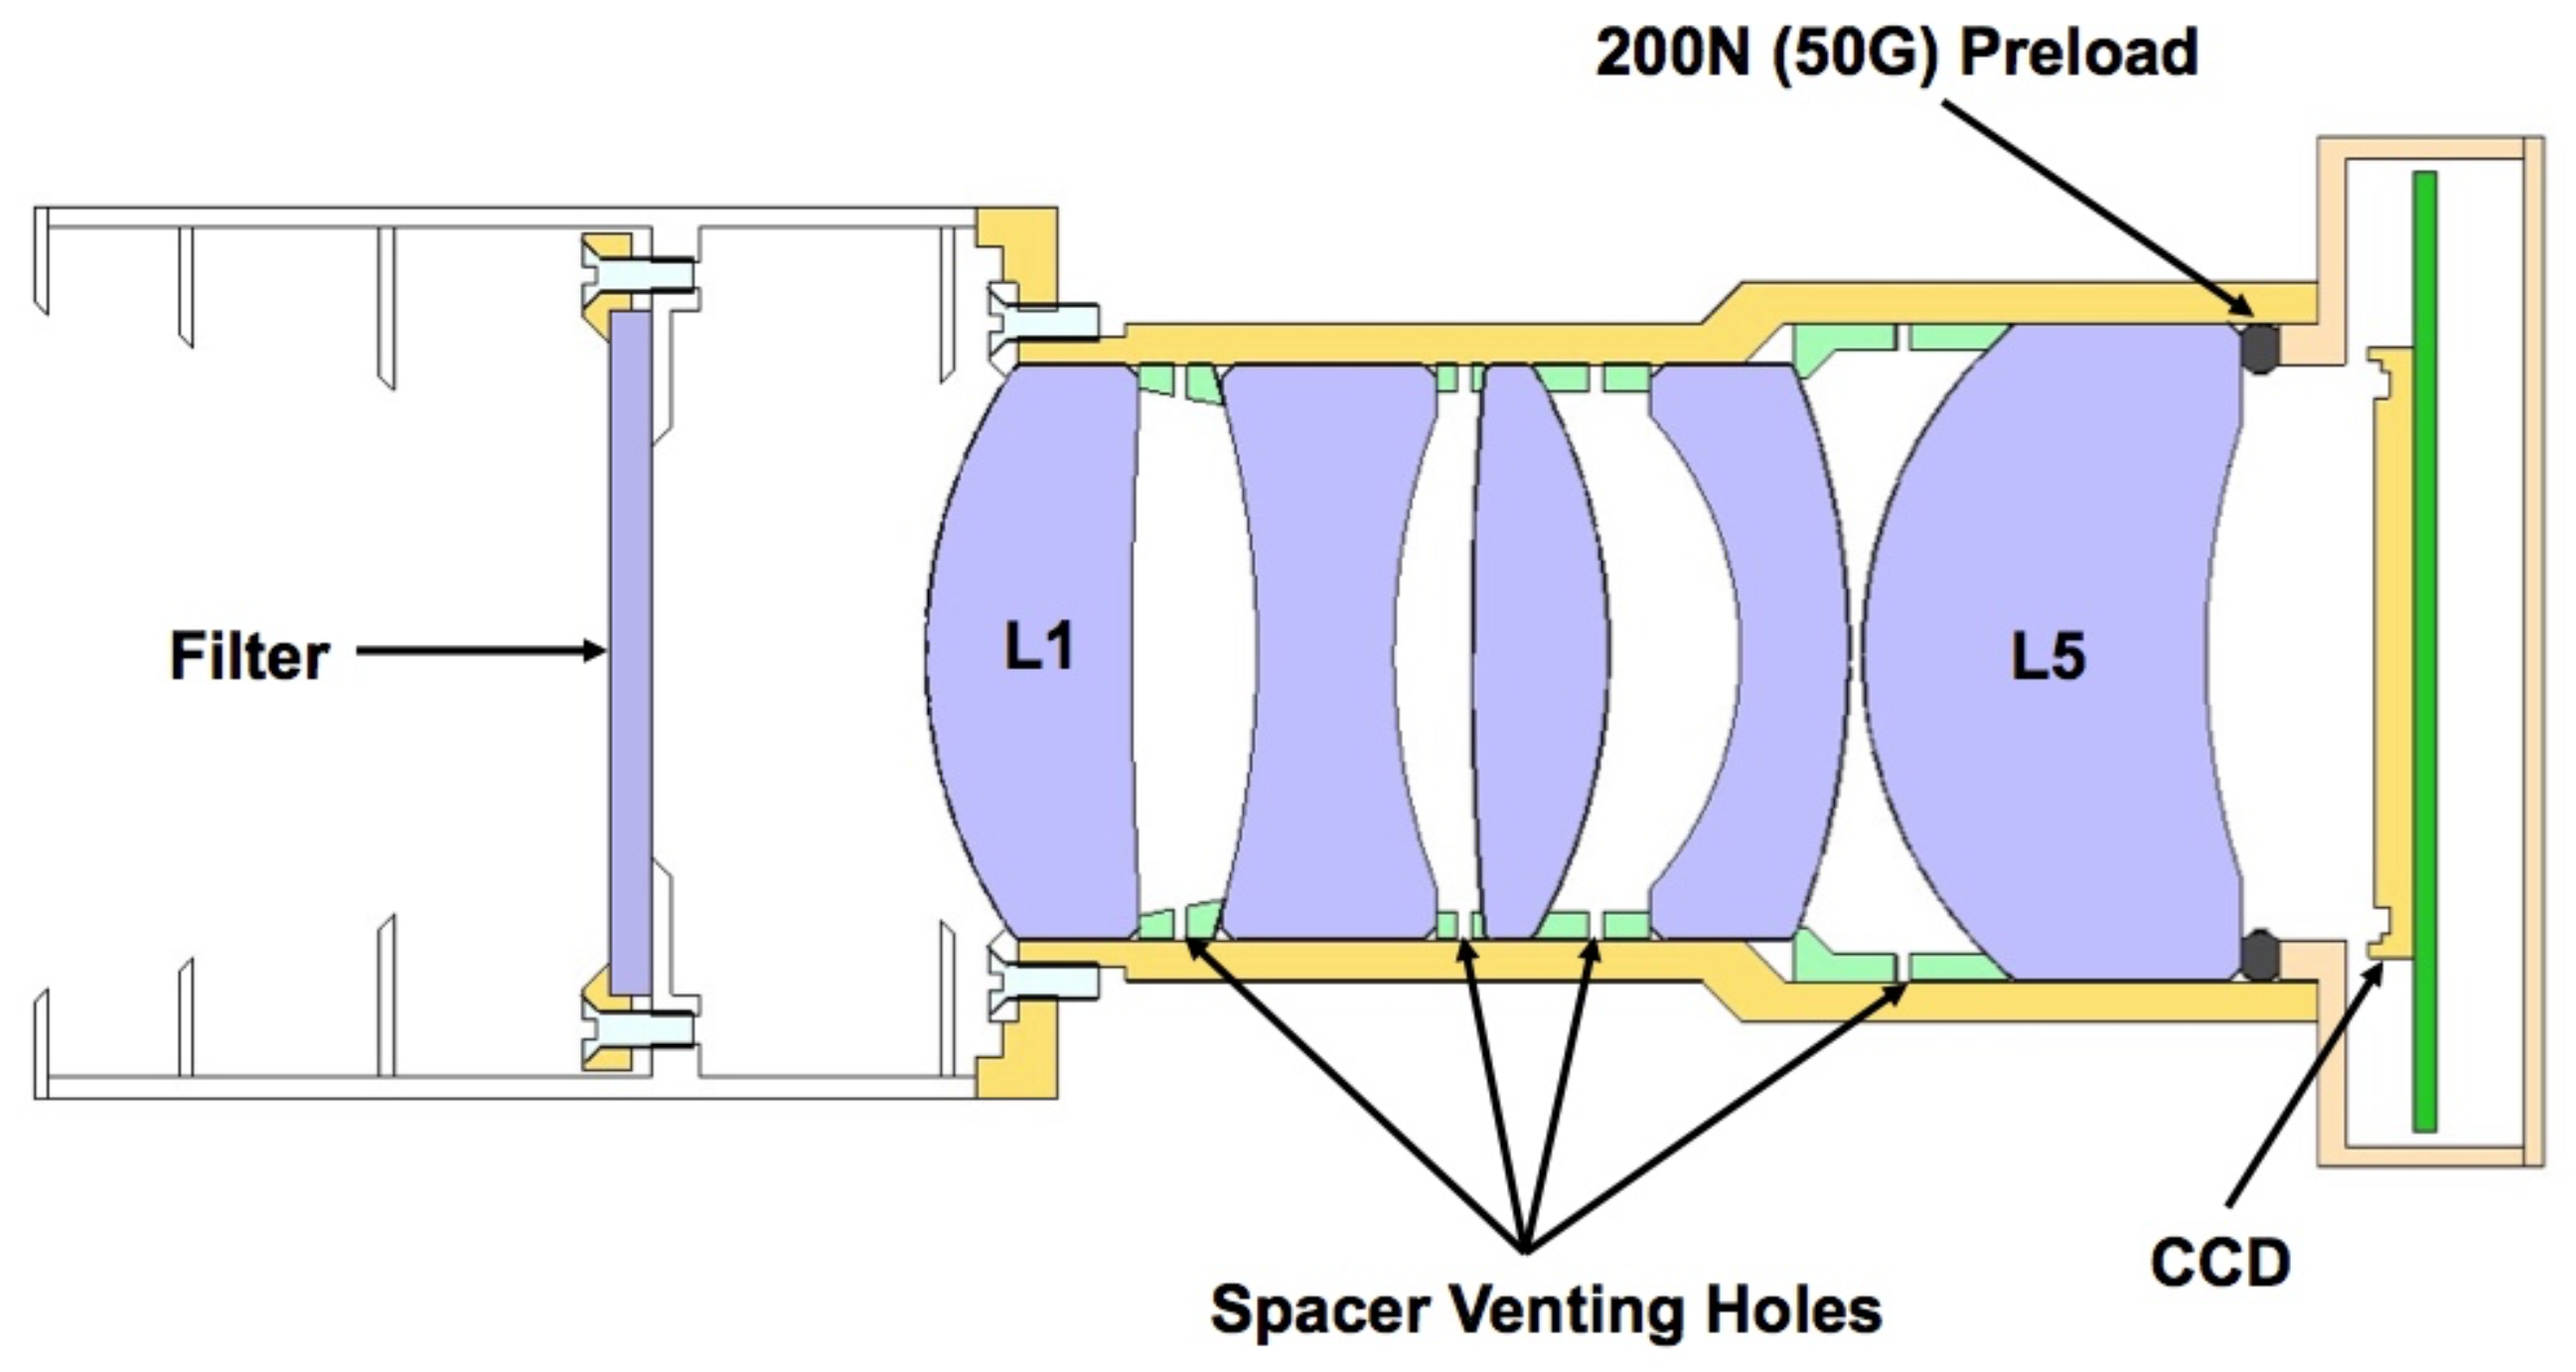
3.1. Instrumentation
3.2. Photometry and Data Processing
3.3. Organisation and Operation
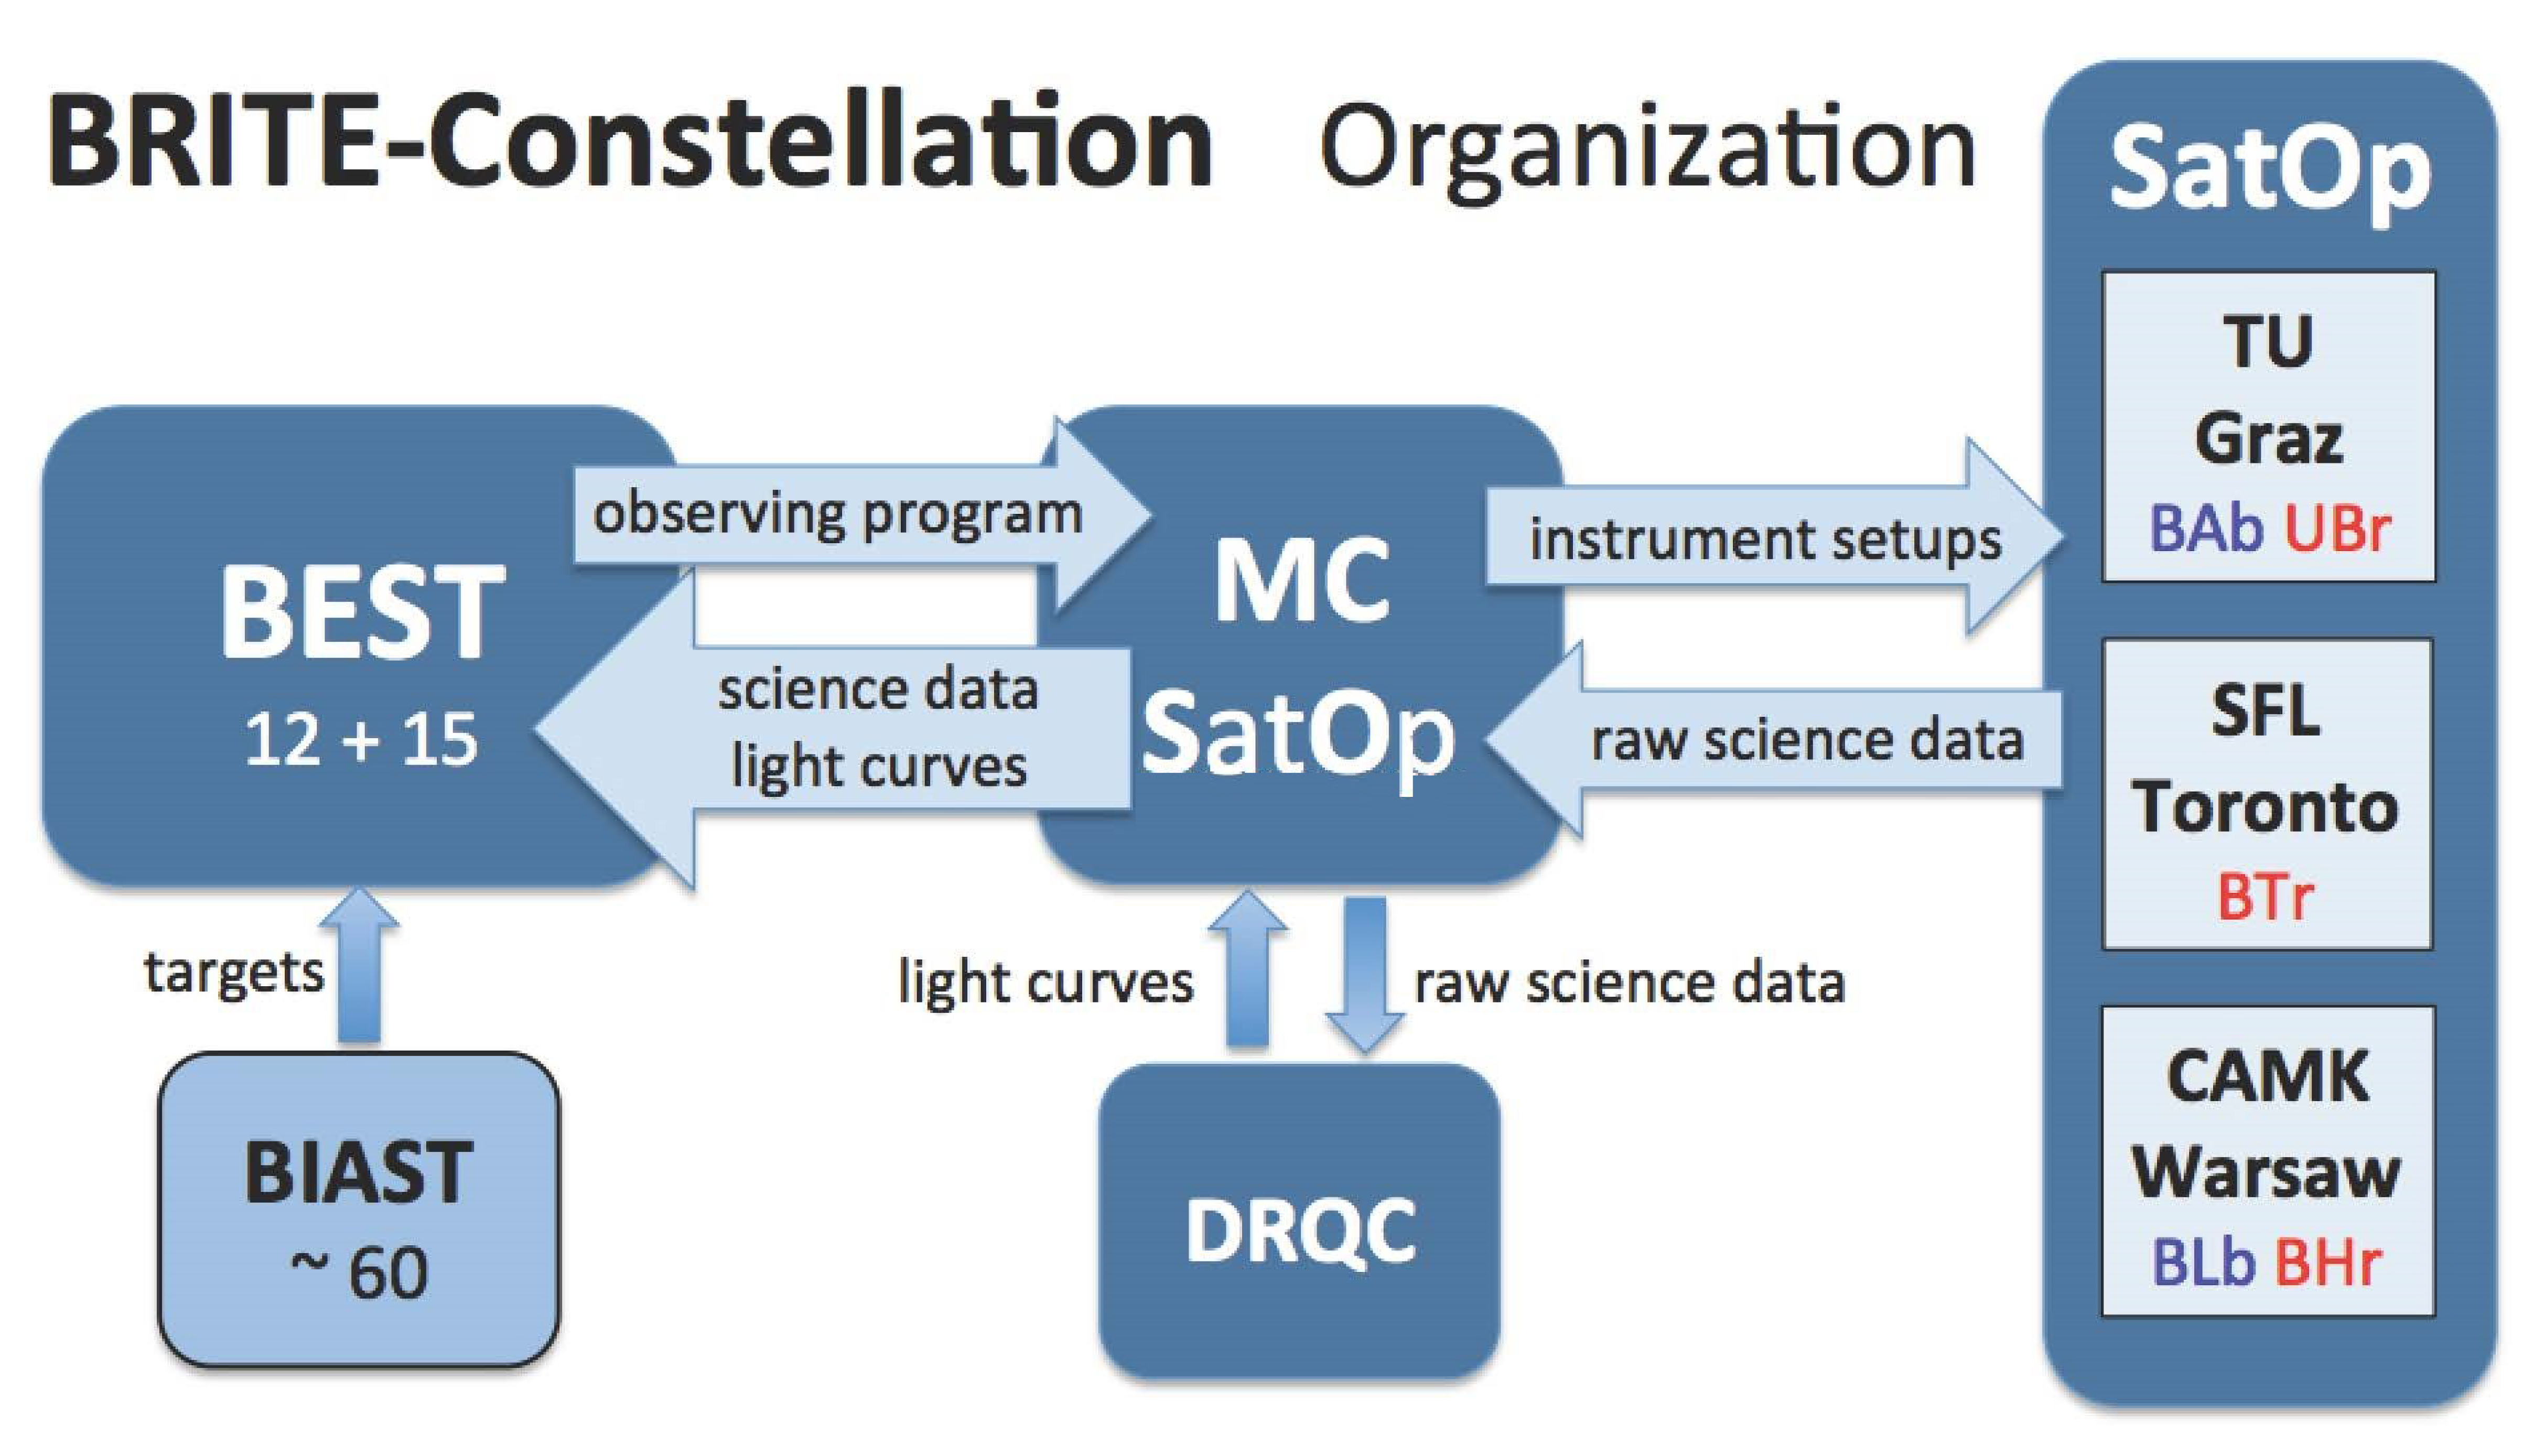
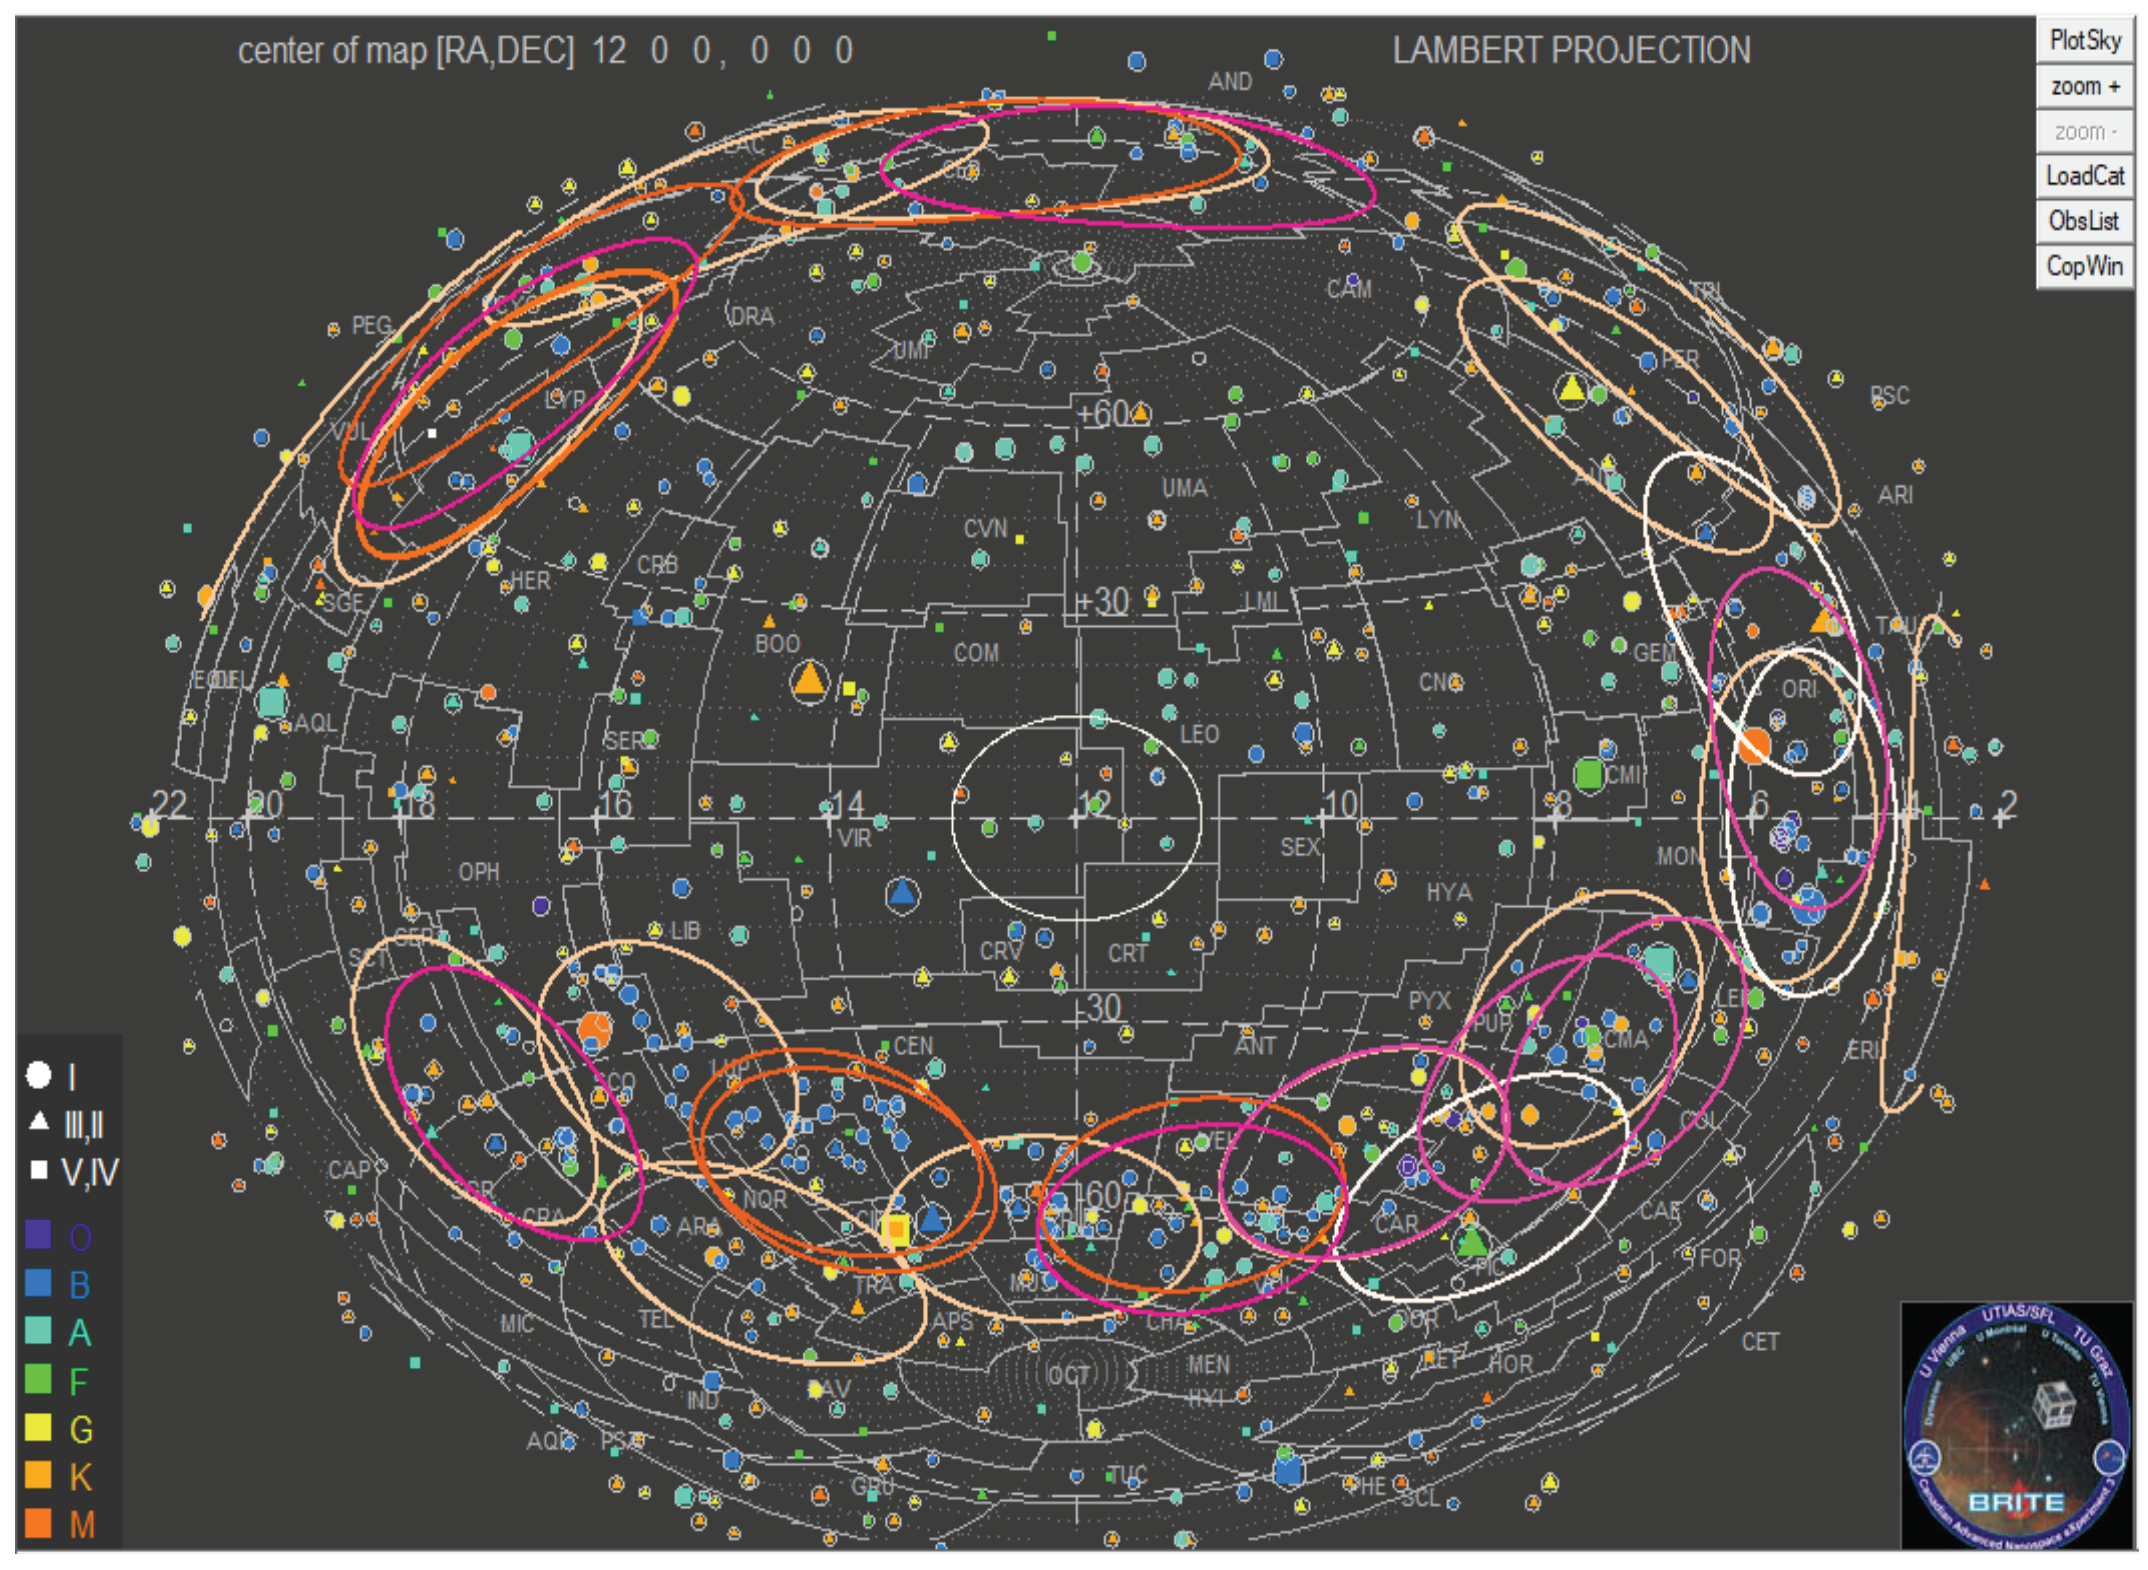
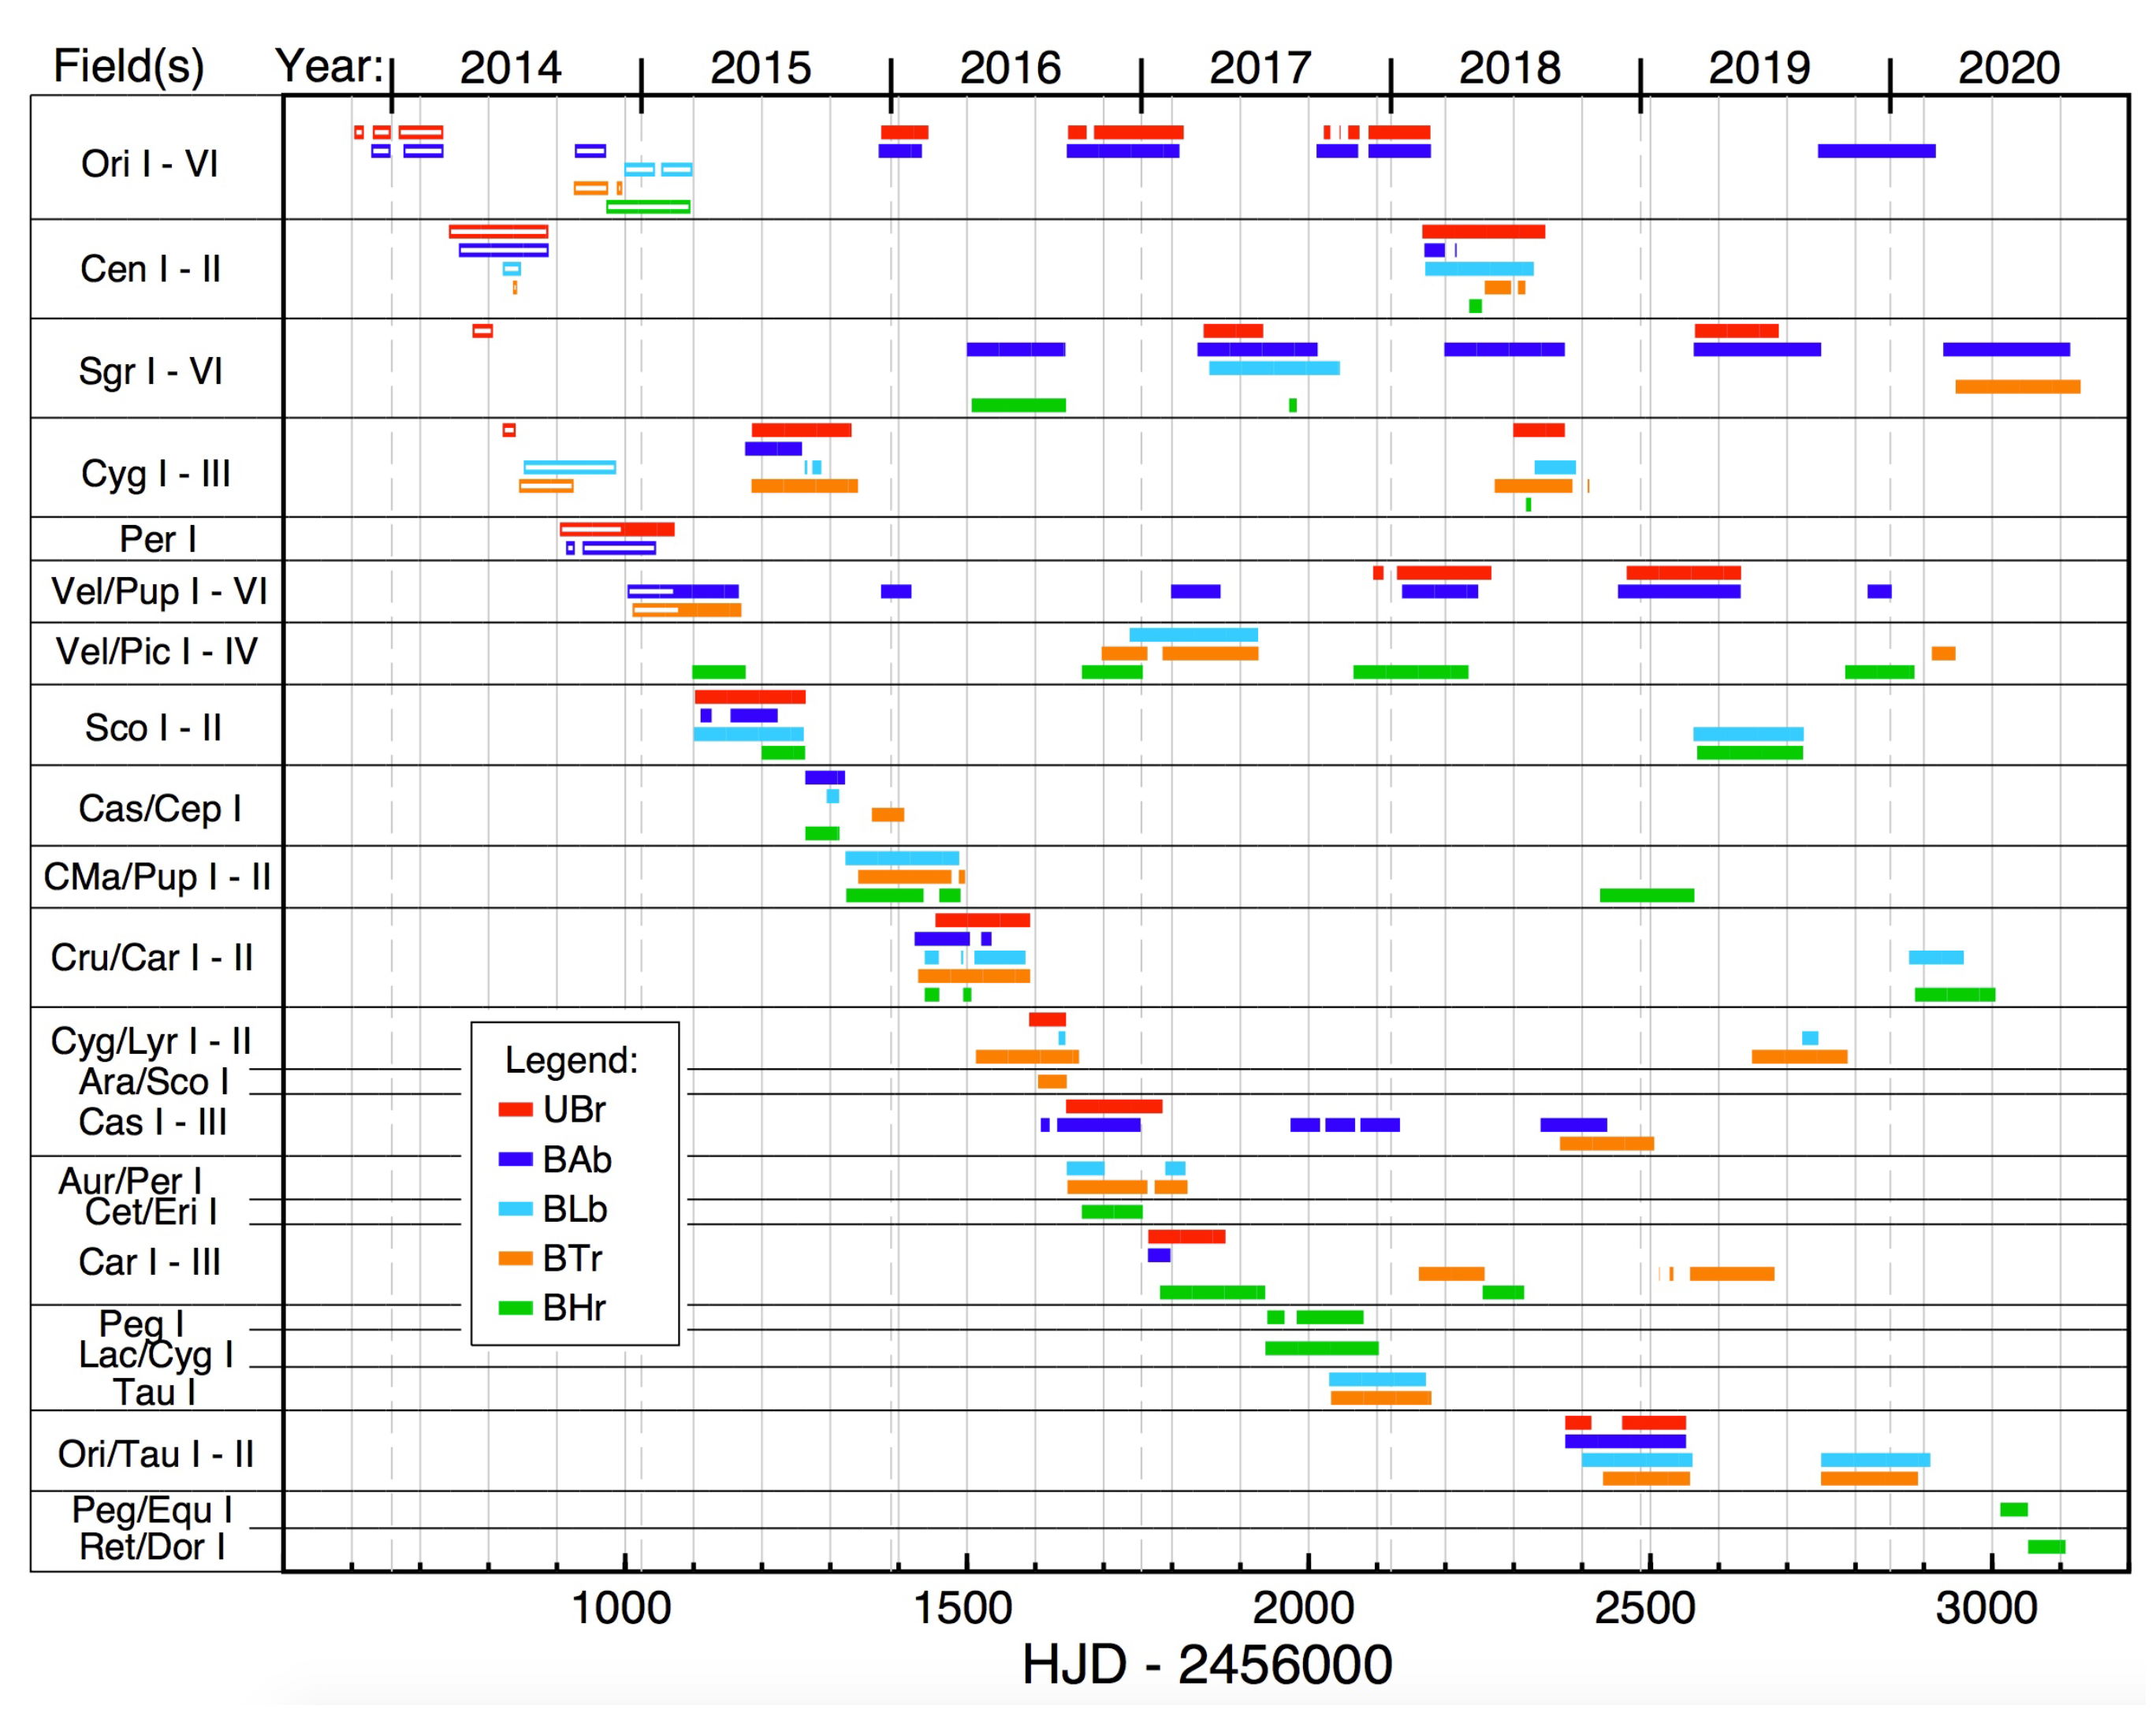
- BEST (BRITE Executive Science Team) is the ruling body of BRITE-Constellation. It consists of two voting members per satellite, nominated by the three member countries (Austria, Canada and Poland) which funded the BRITE satellites. BEST elects additional non-voting experts, presently 15. BEST releases 6 to 12 months before a new observing campaigns starts a BRITE Observing Plan (BOP), which typically covers 12 to 14 months of operation. The BOP defines which satellite is assigned to which field and for how long (Figure 9 and Figure 10). The rather long lead-time allows the PI’s to organise supplementary observations from the ground or from space.
- MC (Mission Control) team is headed by Rainer Kuschnig (IKS, TU-Graz, formerly IfA Uni-Vienna) and is responsible for the execution of BOP by providing satellite orientation and instrument setup data. To ensure a maximum efficiency of BRITE-Constellation, a frequent quality control of all data generated with all active satellites is another core activity of MC. Such tests are applied at least twice a week and reported to BEST every second week. In case of problems, MC interacts directly with the corresponding satellite operator in charge.A very short turn-around time between data check and satellite operation is possible, because BRITE-Constellation observes “only” up to 60 stars during a campaign and basically a single person inspects the data nearly in real time. The obvious benefit is a fast response to unexpected stellar variability. The best and most outstanding example is the serendipitous data collection from Nova Carinae 2018. Almost instantly it was apparent that BRITE-Constellation had caught the nova days before it was discovered visually. Hence, this early volatile phase could be covered by BRITE-Constellation in an unprecedented manner, as is explained in Section 4.16.
- SatOp (Satellite Operation) teams are other key elements of the mission. Satellite operators are in charge of controlling the national spacecraft via the ground stations, of which one is in Austria at TU-Graz, one in Canada at SFL-Toronto and a third one in Poland at CAMK-Warsaw. However, in case of emergency, communication is possible from each of the ground stations to any satellite to ensure uninterrupted satellite control and data management. This was, and still is, usually required during harsh weather conditions at particular ground stations or during maintenance periods.
- DRQC (Data Reduction and Quality Control) is another core element of the mission. The data received from each BRITE satellite on a daily basis is delivered by SatOp to MC for a preliminary quality check. Once a campaign on a given field is finished, all raw data are ASCII formatted with a FITS-like header and made available to DRQC, which generates pipeline-reduced data files (supervised by Adam Popowicz, Silesian University of Technology, Gliwice) [40], and performs quality control (supervised by Bert Pablo, AAVSO). The original data, the raw science data (ASCII) files and the time series datasets are then submitted to the BRITE Data Archive (maintained by Andrzej Pigulski, University of Wroclaw). Most of the archive can be accessed publicly, but some data are still protected for a limited time for the corresponding PIs. The BRITE Public Data Archive can be found at https://brite.camk.edu.pl/pub/index.html.
- BIAST (BRITE International Advisory Science Team) is an informal group of presently 60 scientists, who have already successfully proposed relevant observations and/or are planning this in the future. Hence, BIAST members have expertise in BRITE data, have published the results and can advise BEST in optimising the observing program.
- GBOT (Ground-Based Observing Team), which is headed by Konstanze Zwintz (U. Innsbruck), provides a platform for BRITE scientists and observers worldwide to support collaboration and to maximize the scientific output of BRITE-Constellation.
3.4. Present Status
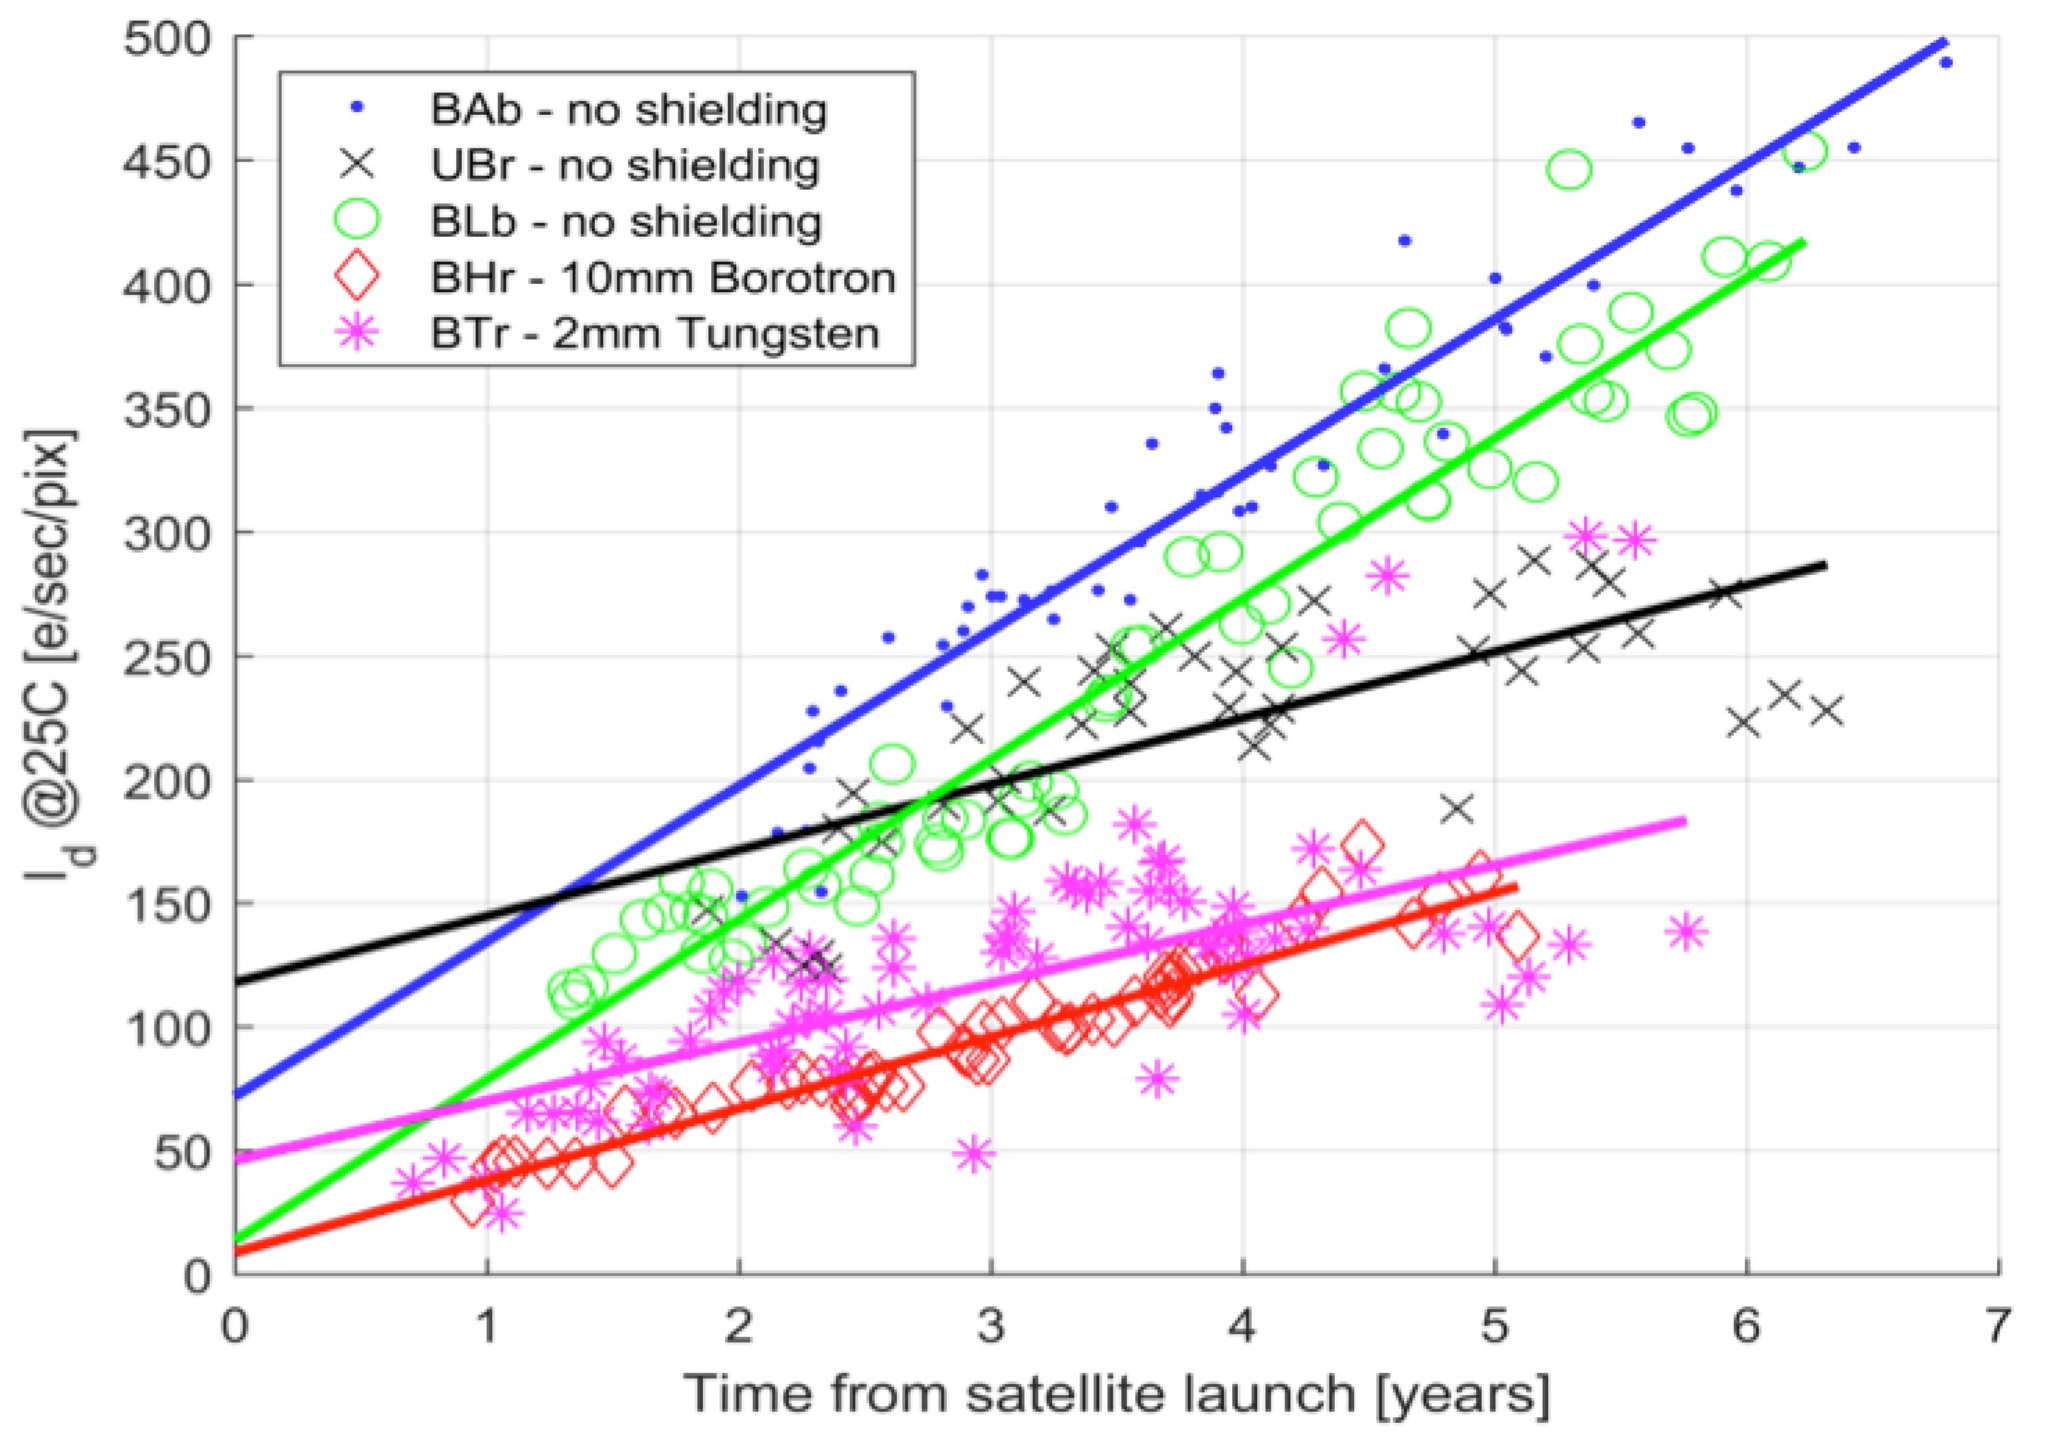
- BRITE-Toronto (BTr), is in good condition and produces among the best data, despite a significant amount of radiation damage. Primary target stars can be placed on the CCD where the background is least noisy.
- BRITE-Heweliusz (BHr), is working very well in general; some observing fields seem to cause problems for the pointing system, but usually alternative orientations of the field (different guide stars) can be chosen. It also has the least amount of radiation damage due to a better shielding of the CCD.
- BRITE-AUSTRIA (BAb) produces scientifically relevant data, even after more than eight years in orbit and an enhanced radiation environment. To obtain the best photometric consistency over the lifetime of BRITE-Constellation, this satellite has been assigned to observe every year essentially the same set of fields in Orion and Sagittarius.
- UniBRITE (UBr), was working well until June 2019, despite its high grade of radiation damage. However, it failed after that date and a failure analysis led by SFL and conducted by IKS TU-Graz concluded that one of the three reaction wheels seems to be damaged and cannot be used for stabilising the spacecraft. A repair concept is being developed.
- BRITE-Lem (BLb), worked well until April 2020 when it consistently failed to get into fine pointing. This is very likely due to a damaged reaction wheel. However more tests are still to be conducted to come to a firm decision.
4. Key Results of the Mission and Scientific Highlights
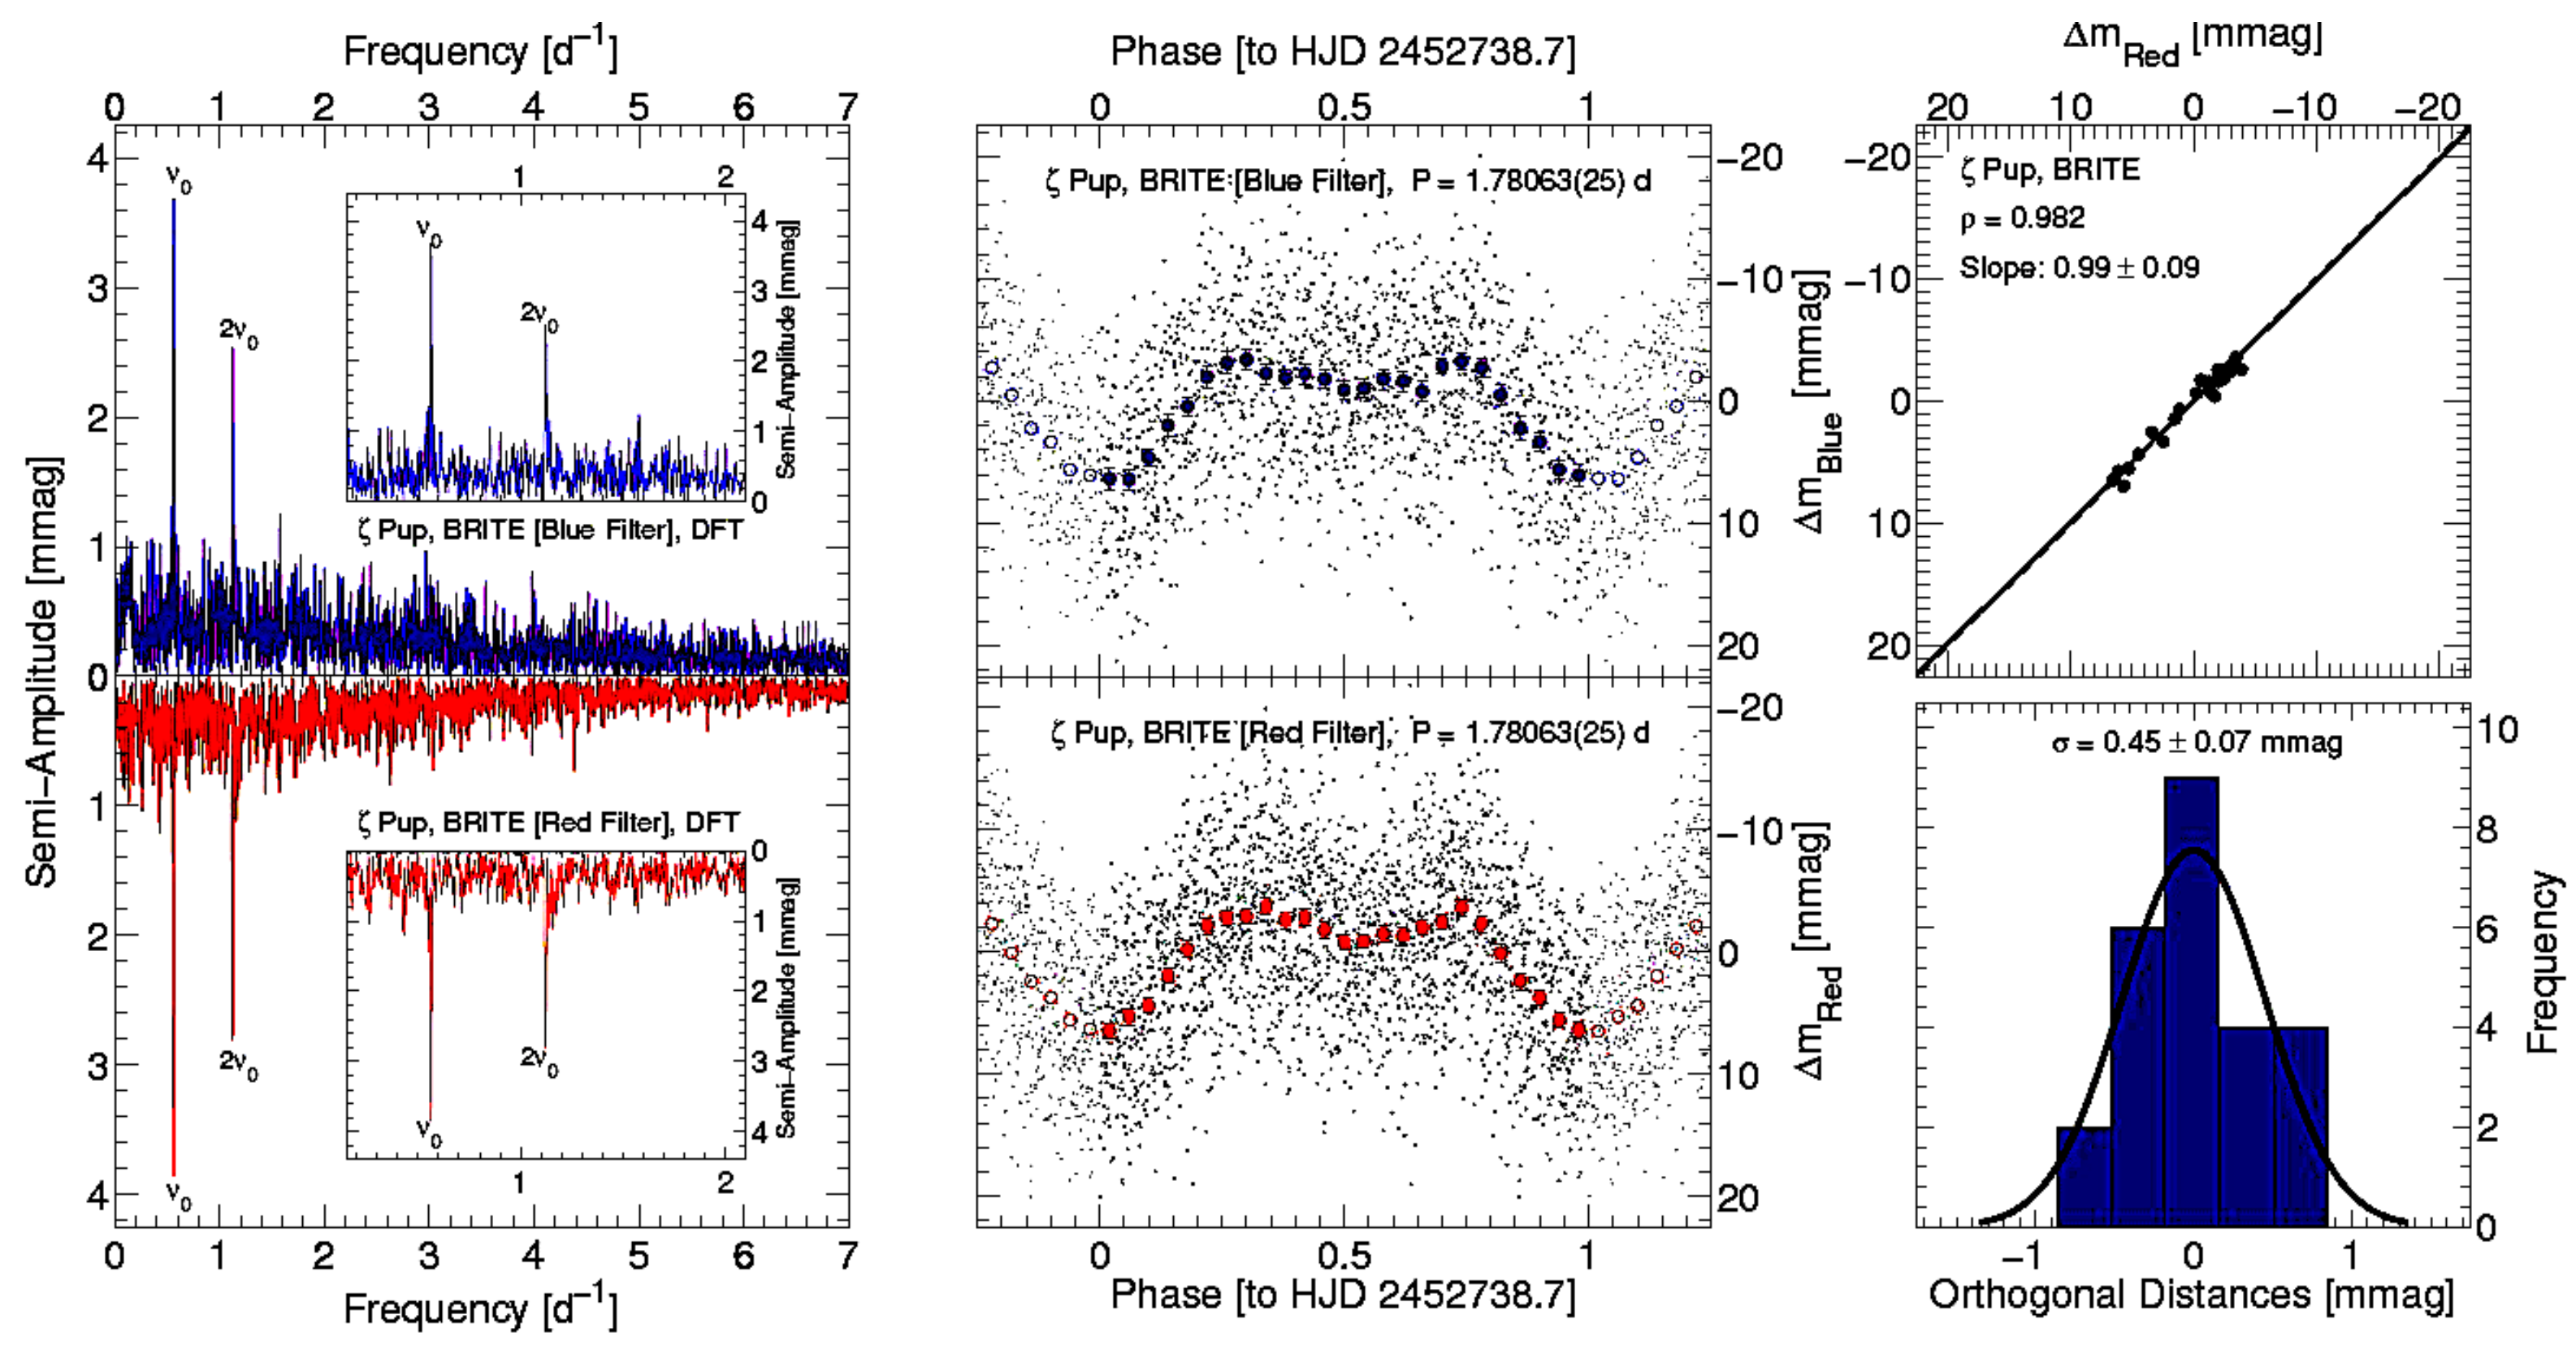
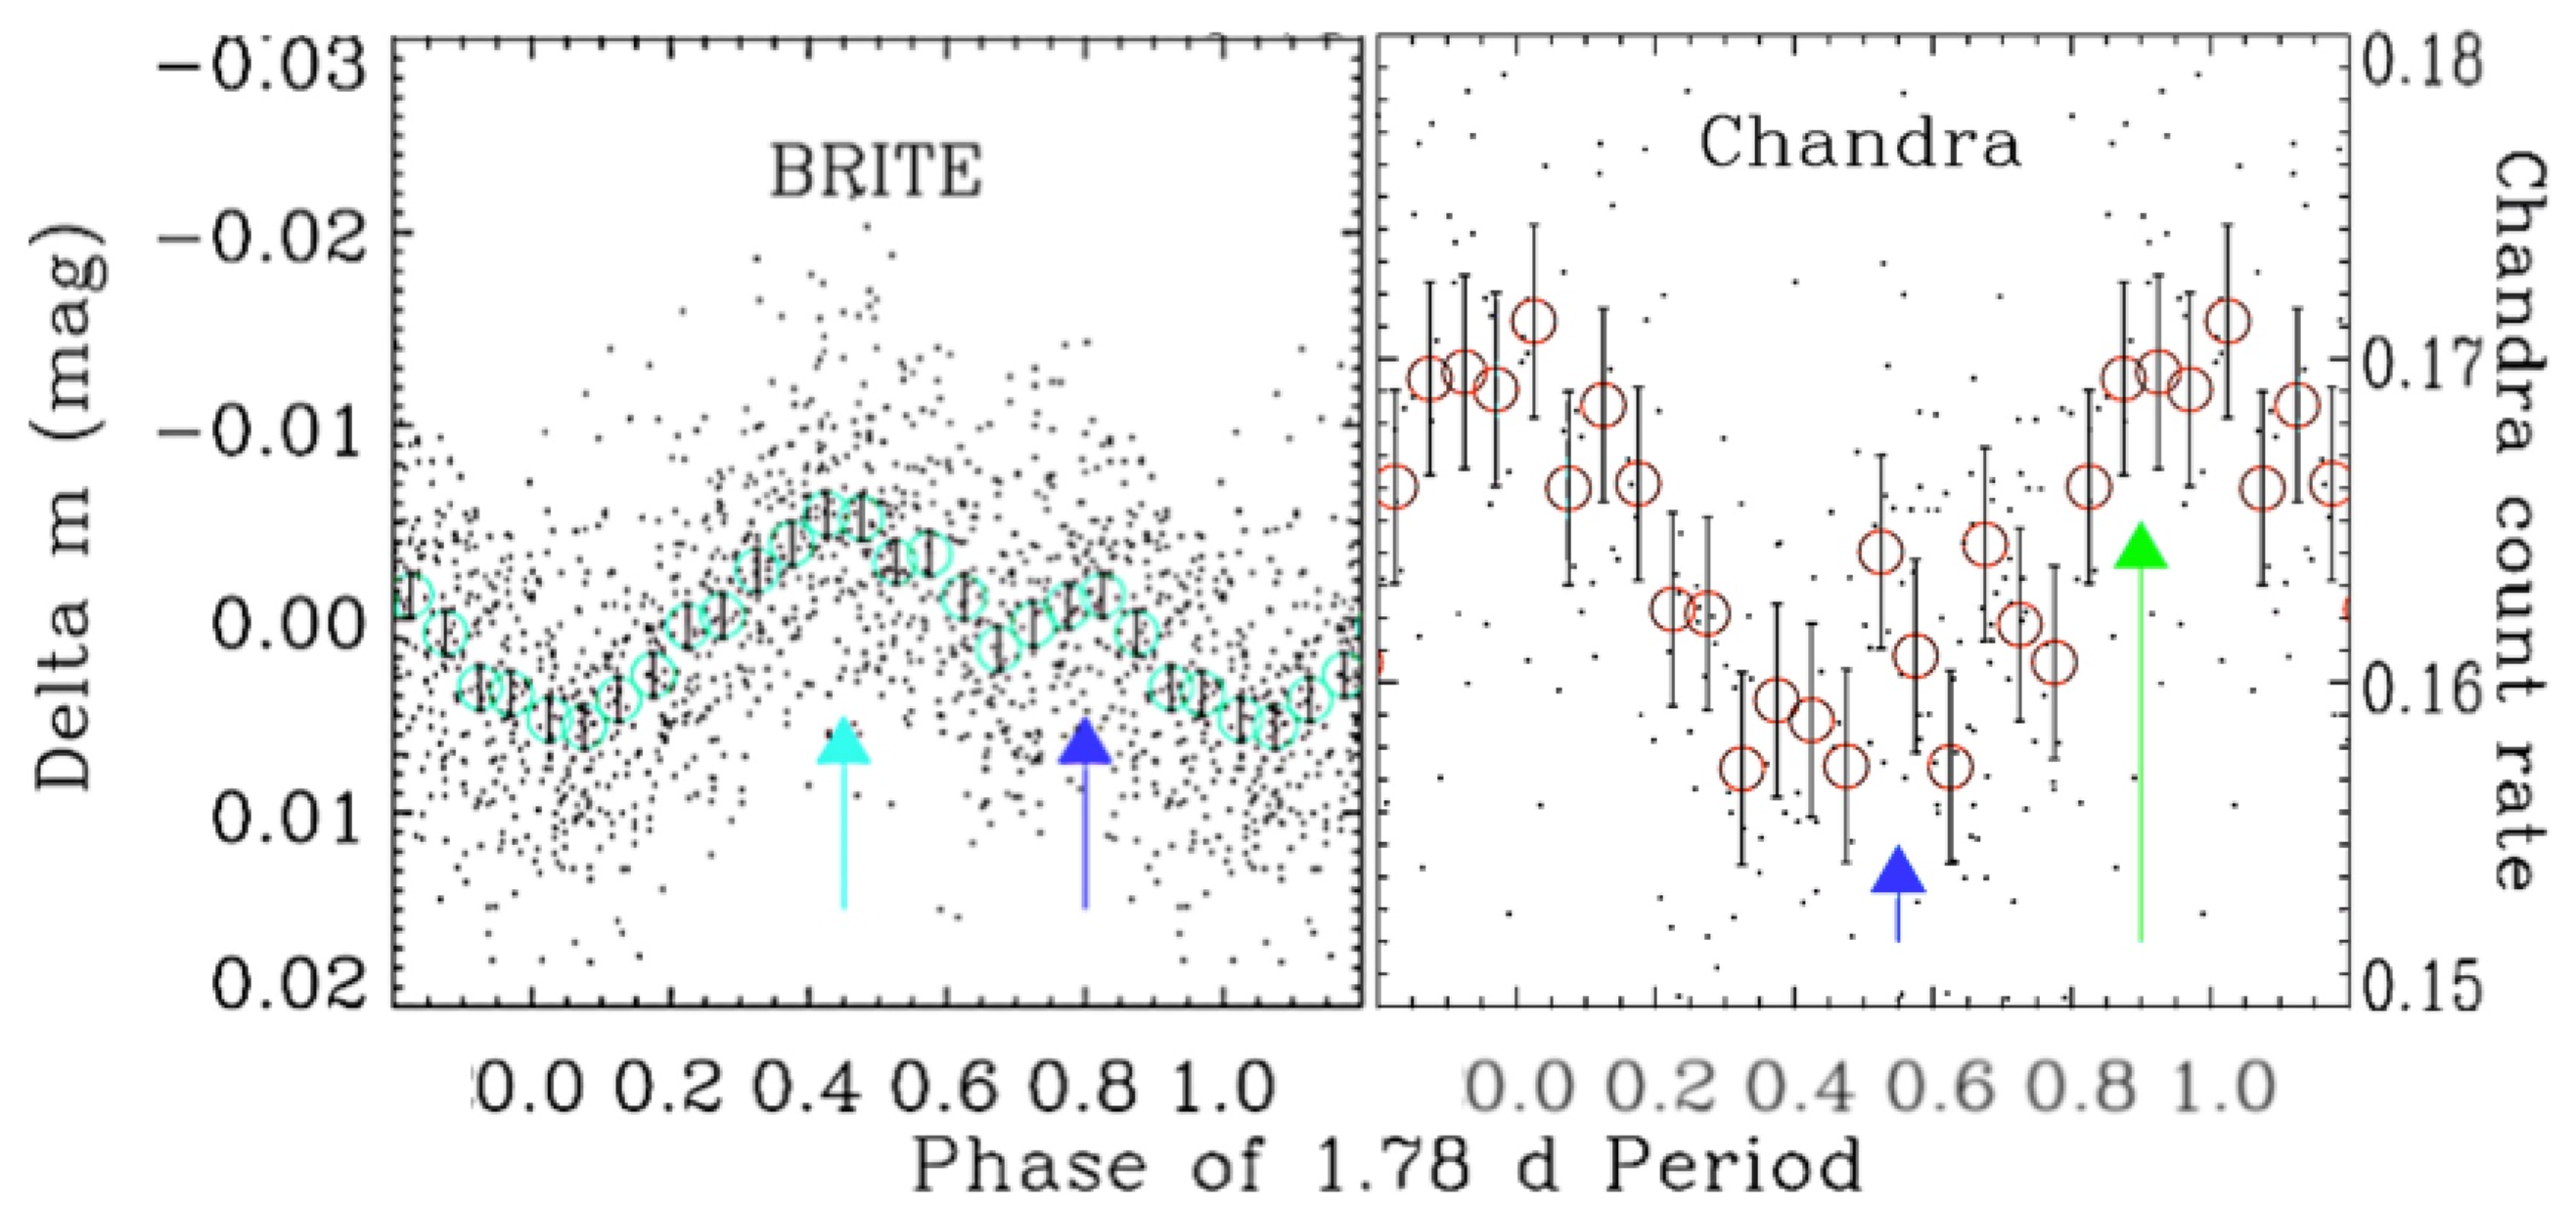
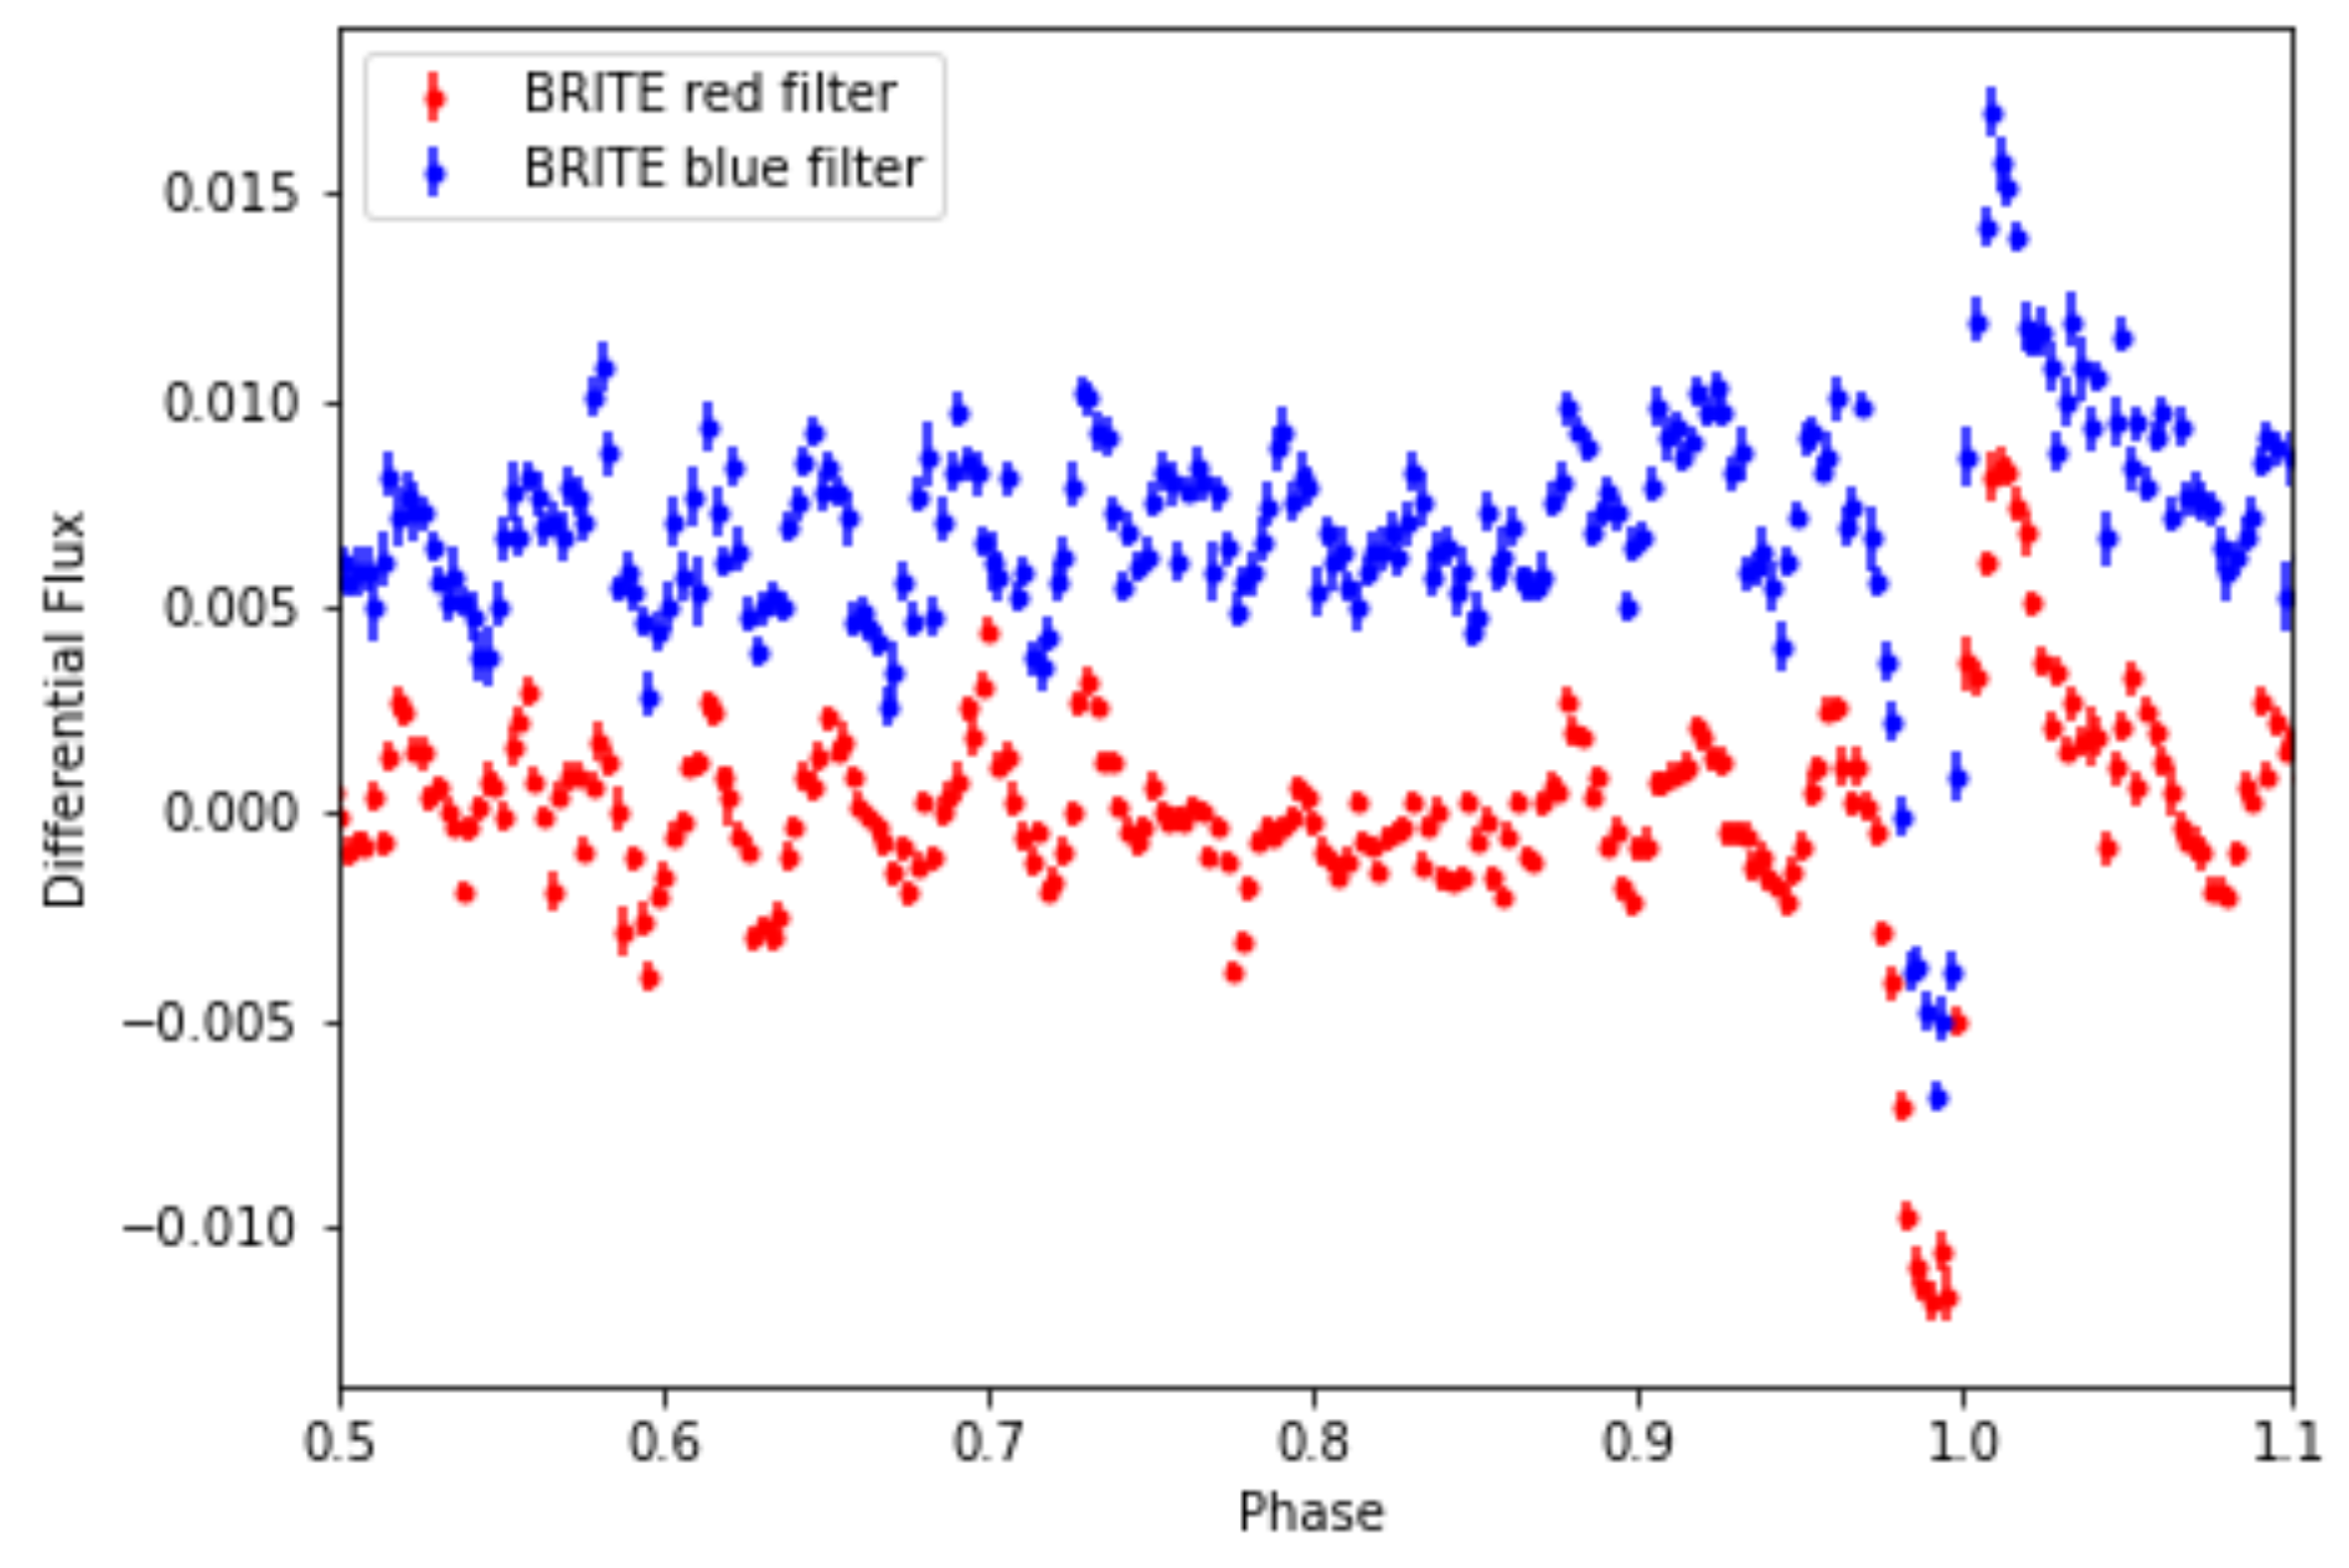
4.1. The Link between Stellar and Wind Variability in Very Massive Stars
4.2. The Heartbeat of Stars: Orionis and Lupi
4.3. The Riddle of Betelgeuse
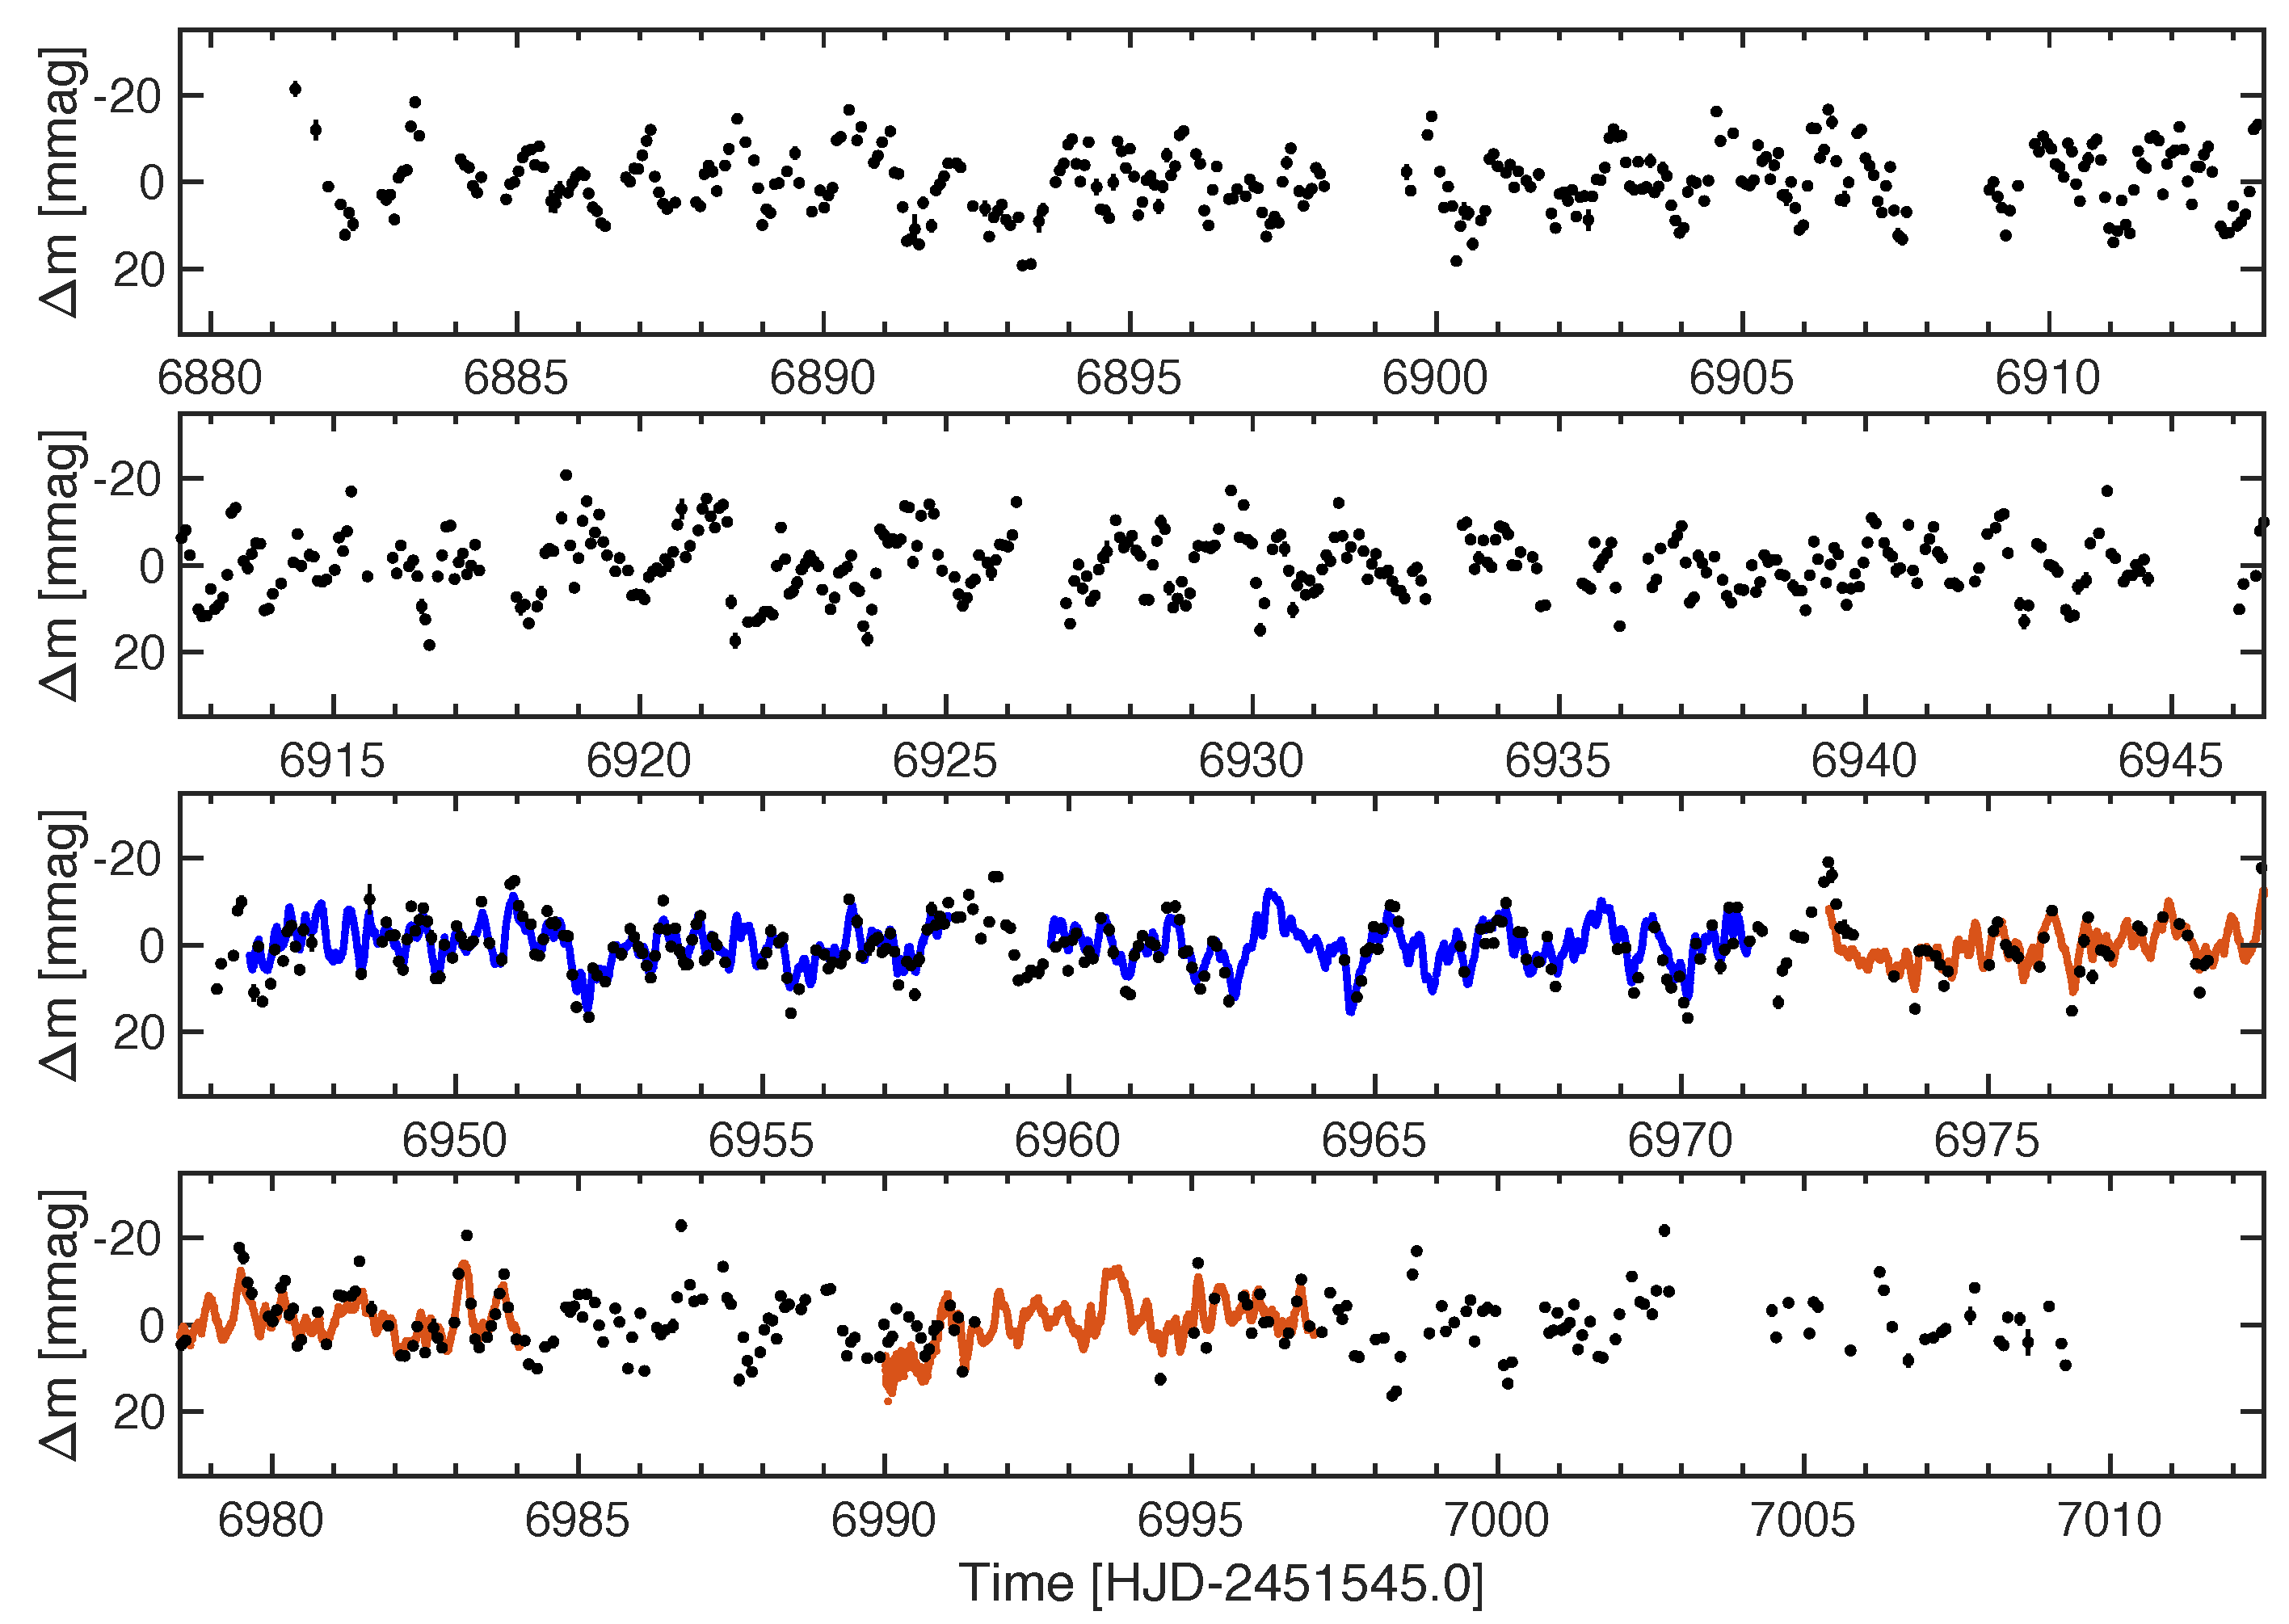
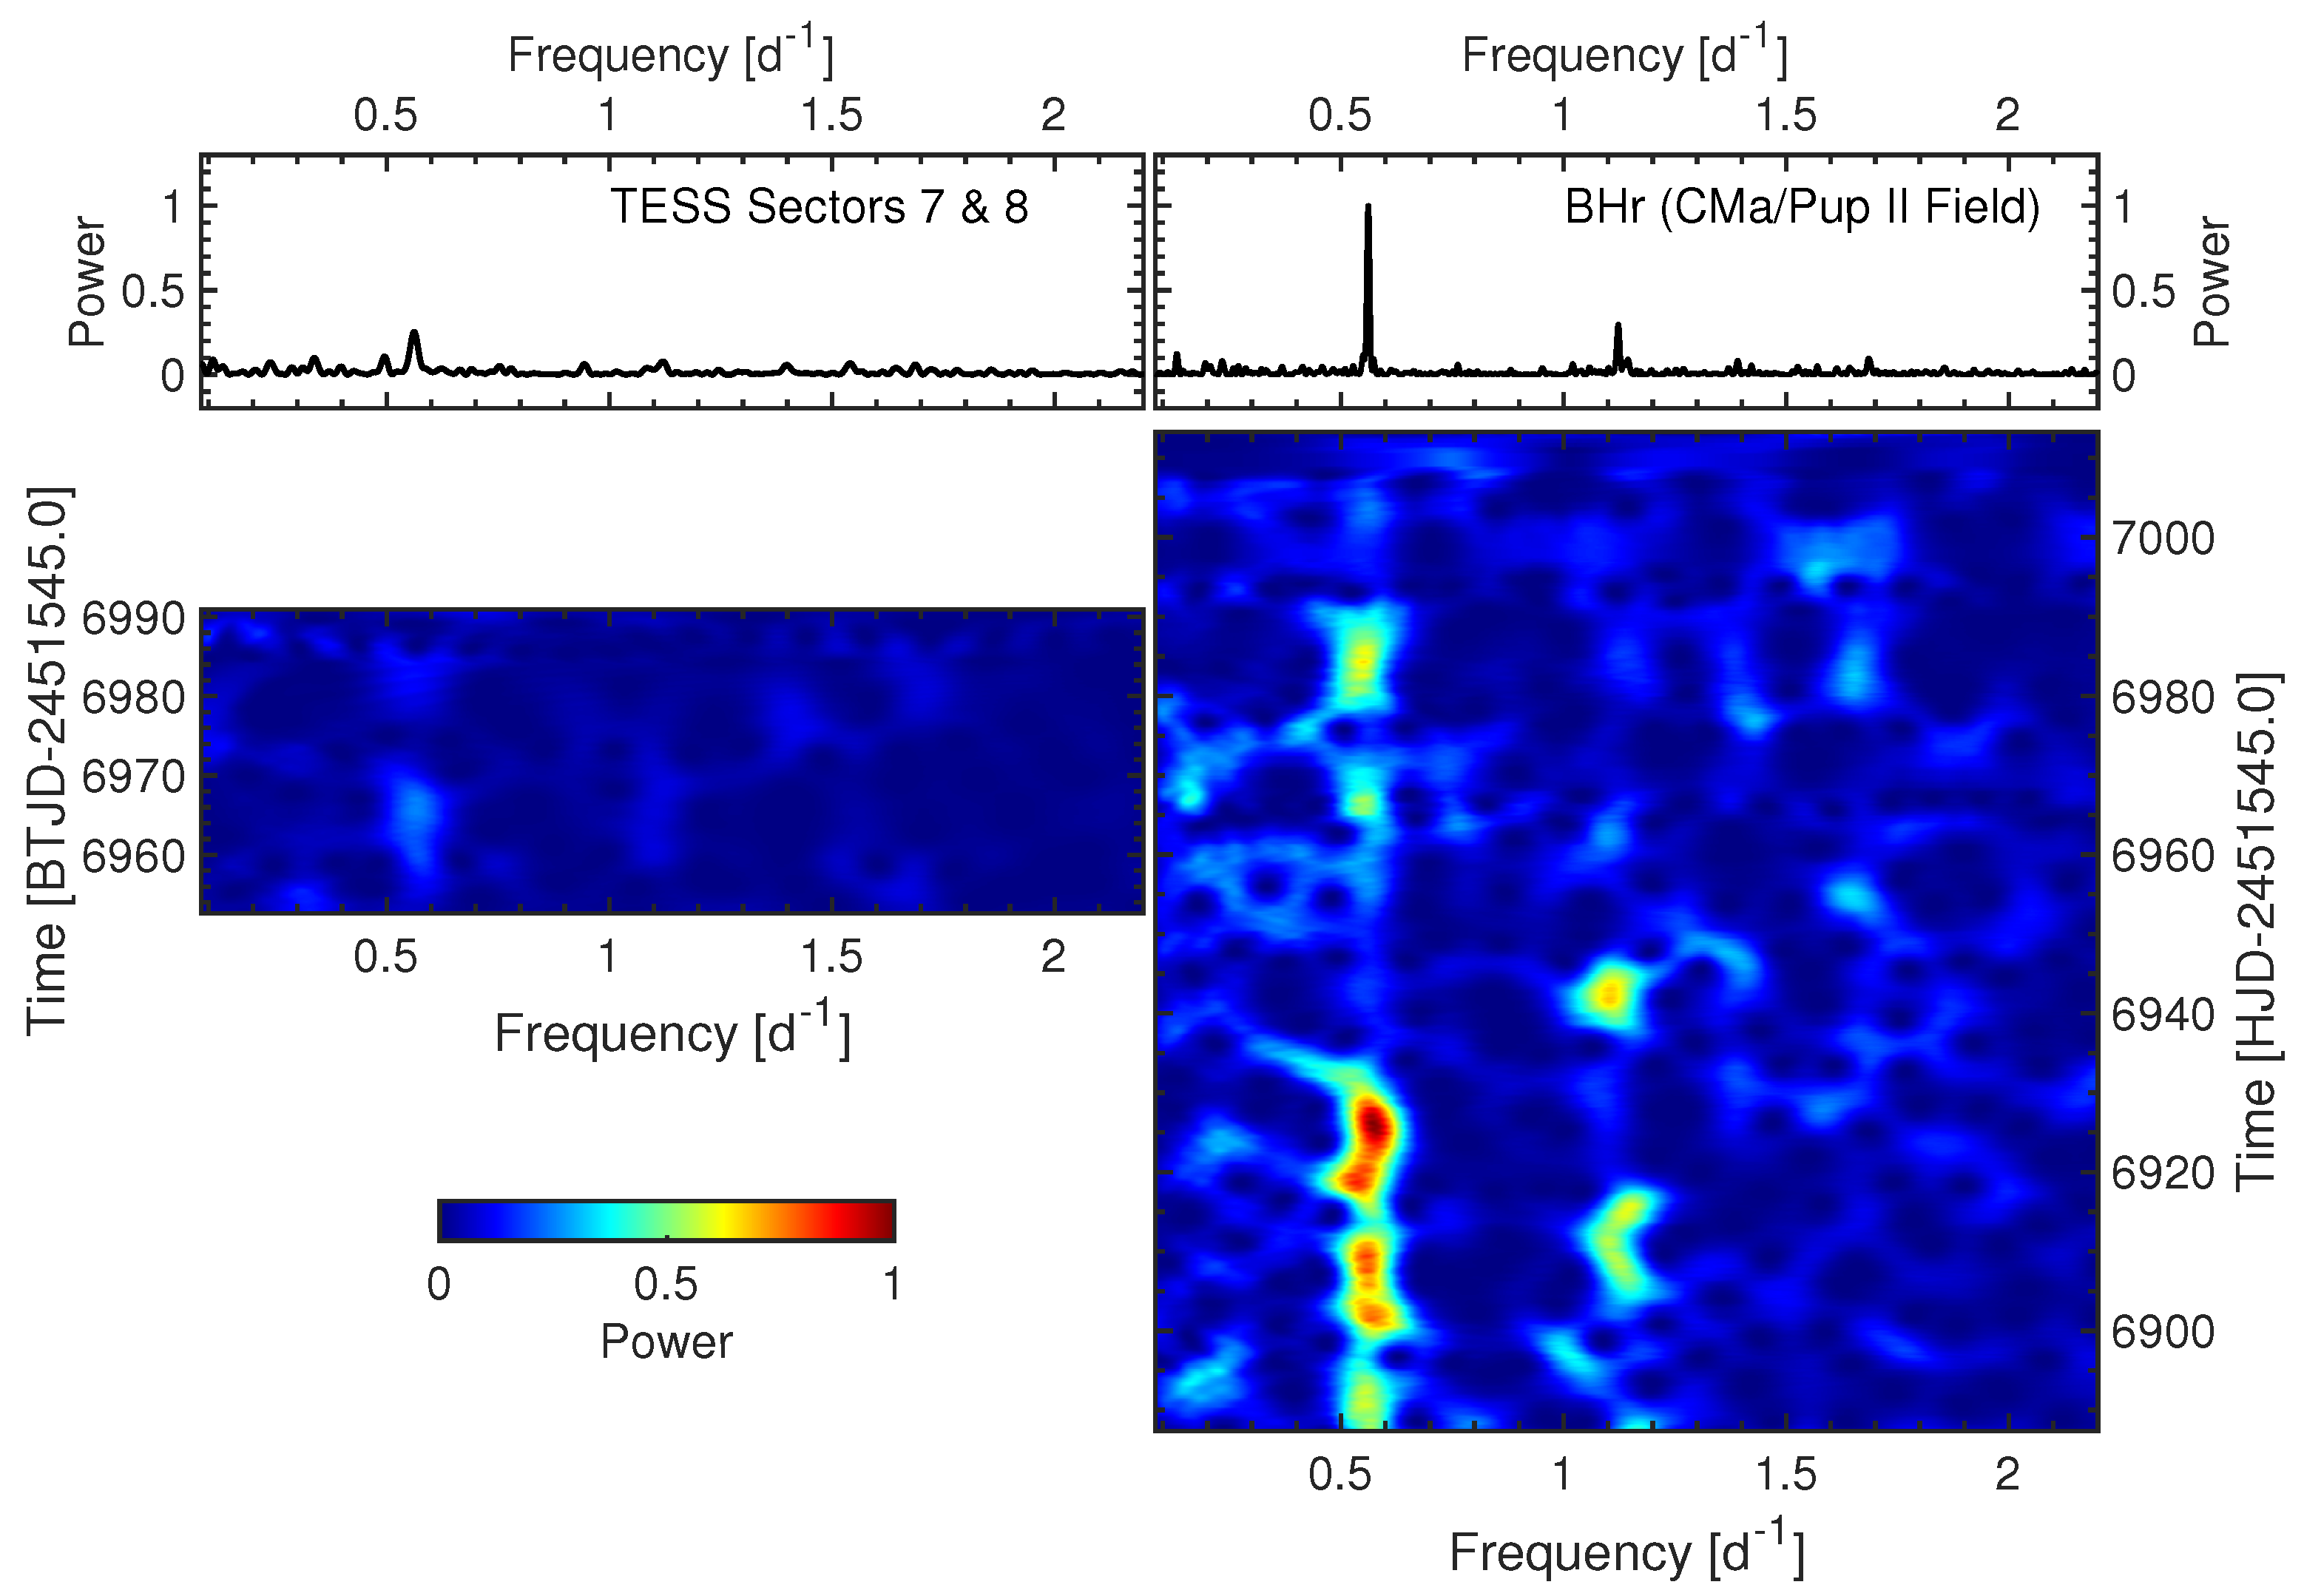
4.4. Evolving Pulsation of the Slowly Rotating Magnetic Cephei Pulsator CMa
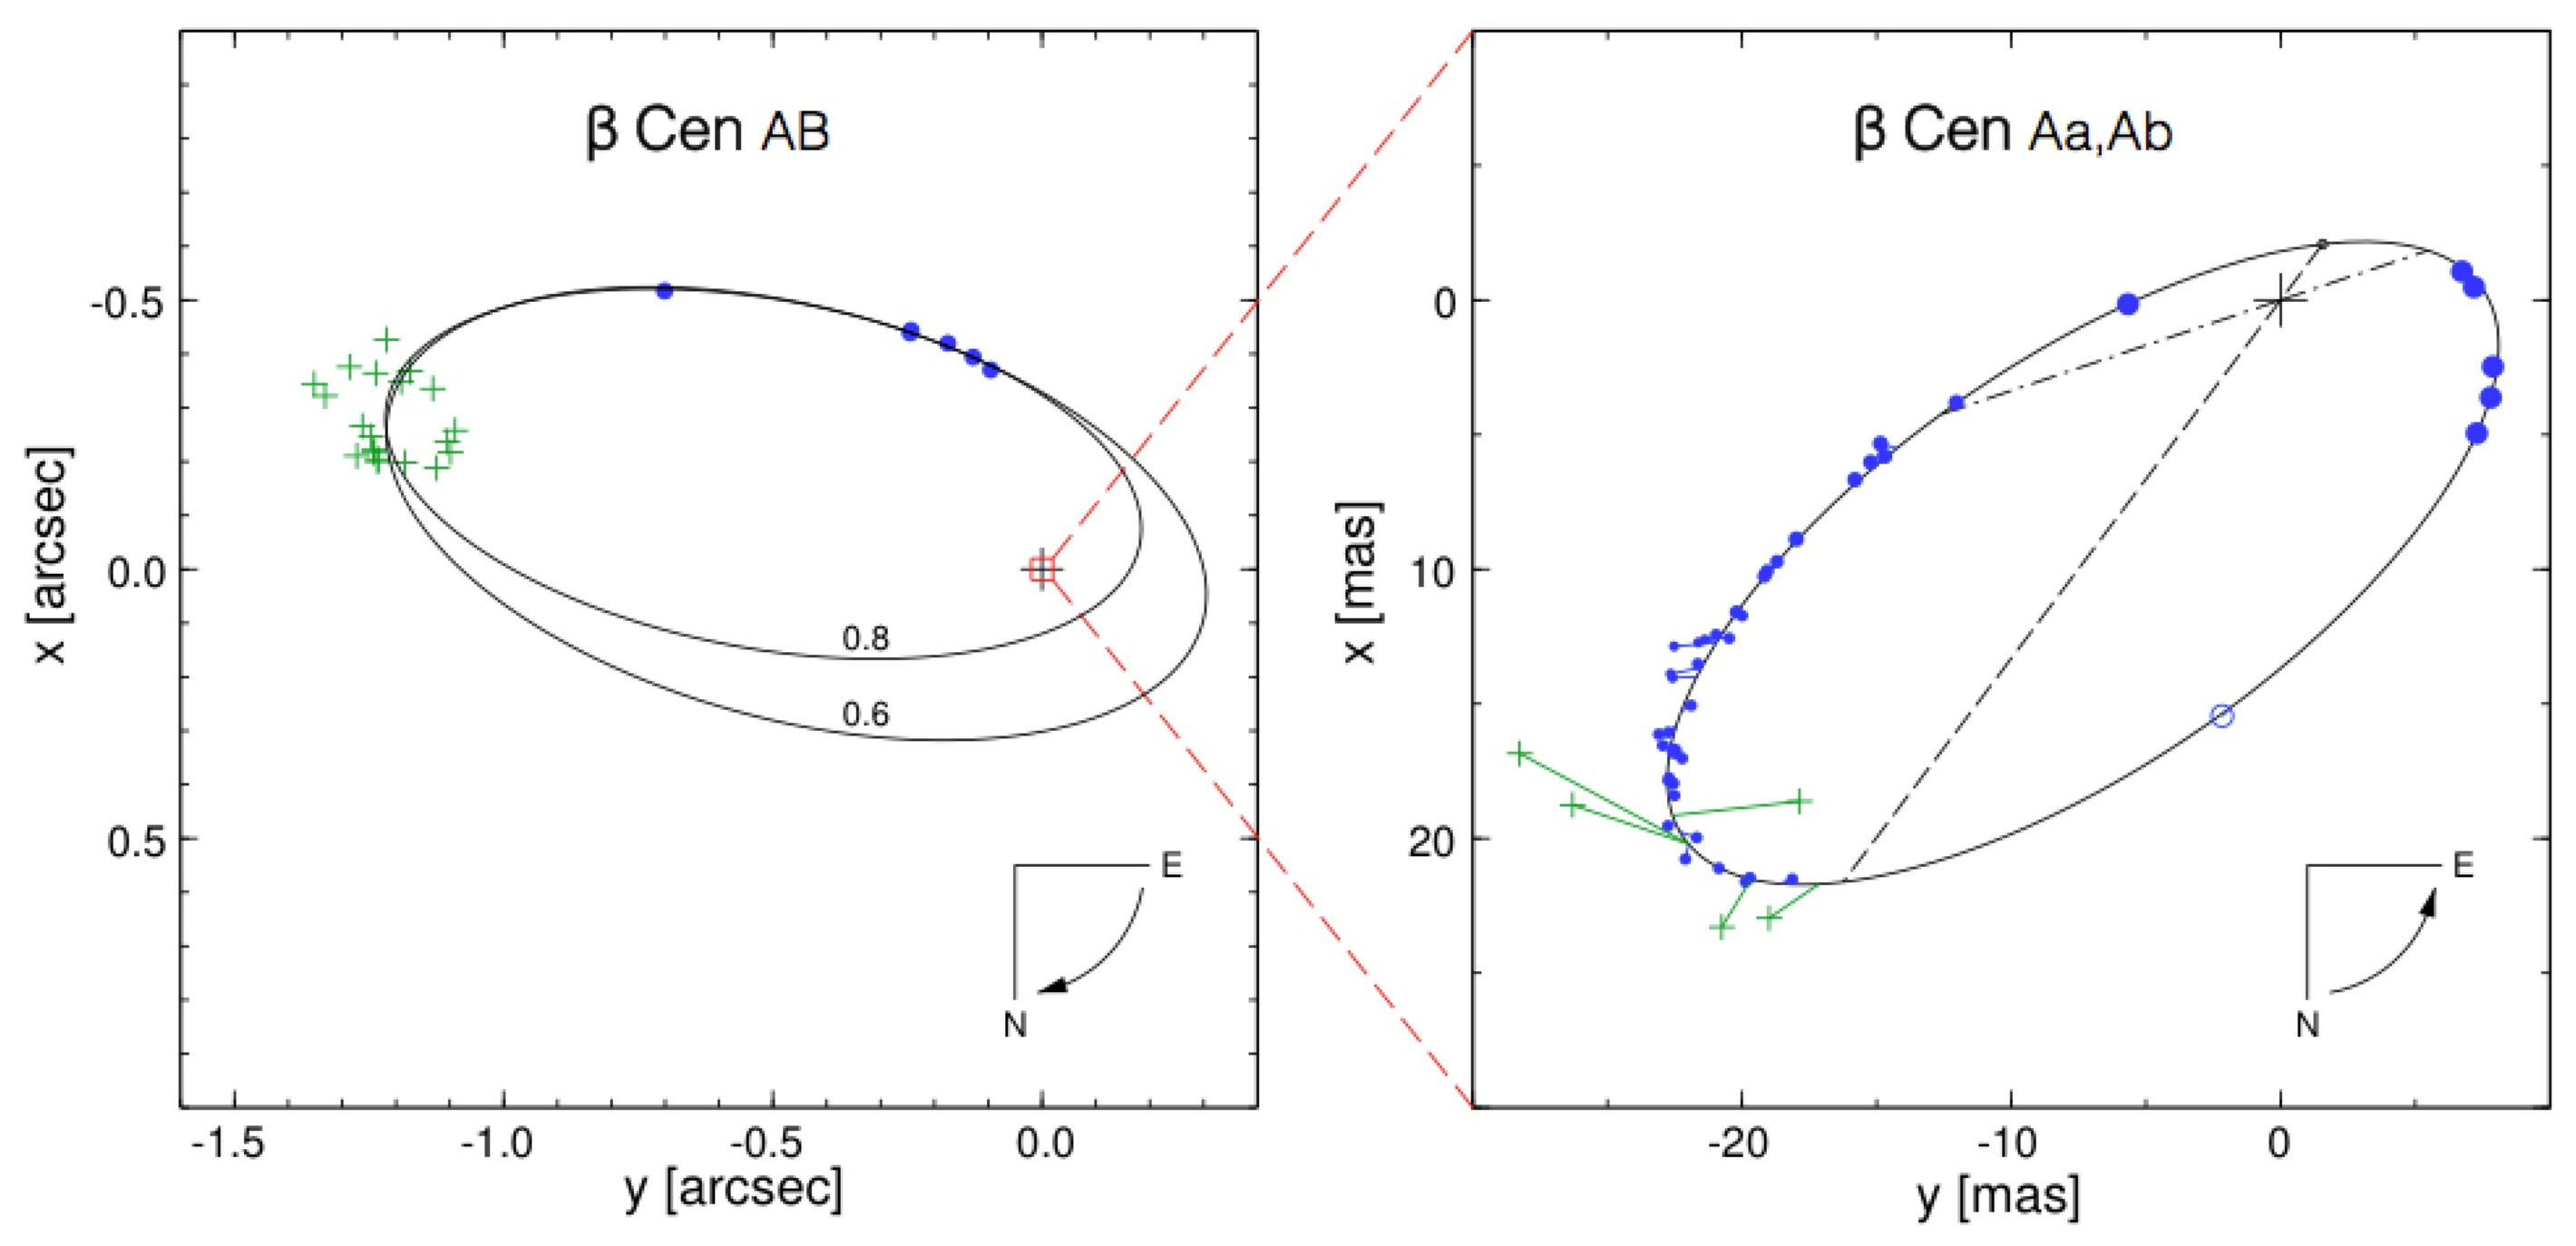
4.5. The Triple System Centauri
4.6. Long-Period Oscillations in the Cephei Pulsators Eridani and Ophiuchi
4.7. The Ellipsoidal SPB Variable Orionis
- −
- Ori is the first SPB star in which tidal perturbations have been identified and
- −
- these perturbations facilitate the identification of nonradial pulsation modes.BRITE allowed a valuable proof-of-concept of mode identification to be carried out, which opened up tidal asteroseismology of SPB stars in multiple systems.
4.8. Be Stars
- (i)
- How do Be stars maintain their Keplerian decretion disks where the eponymous emission lines form and that, without regular replenishment, dissipate within a year?
- (ii)
- How have Be stars acquired their ≳75% critical rotation? One way to explain the latter is mass transfer in a close binary. The former primaries often appear as hot, subluminous sdO stars that are challenging to detect even in UV spectra (Wang et al. [82]) and contribute little flux in the BRITE passbands. However, first photometric Doppler shifts derived from BRITE and SMEI data spanning 25 years have set an upper limit of ∼1 M⊙ on the mass of a putative companion of Pup (Baade et al. [83]).
4.9. Lyrae: A Binary with a Hidden Component?
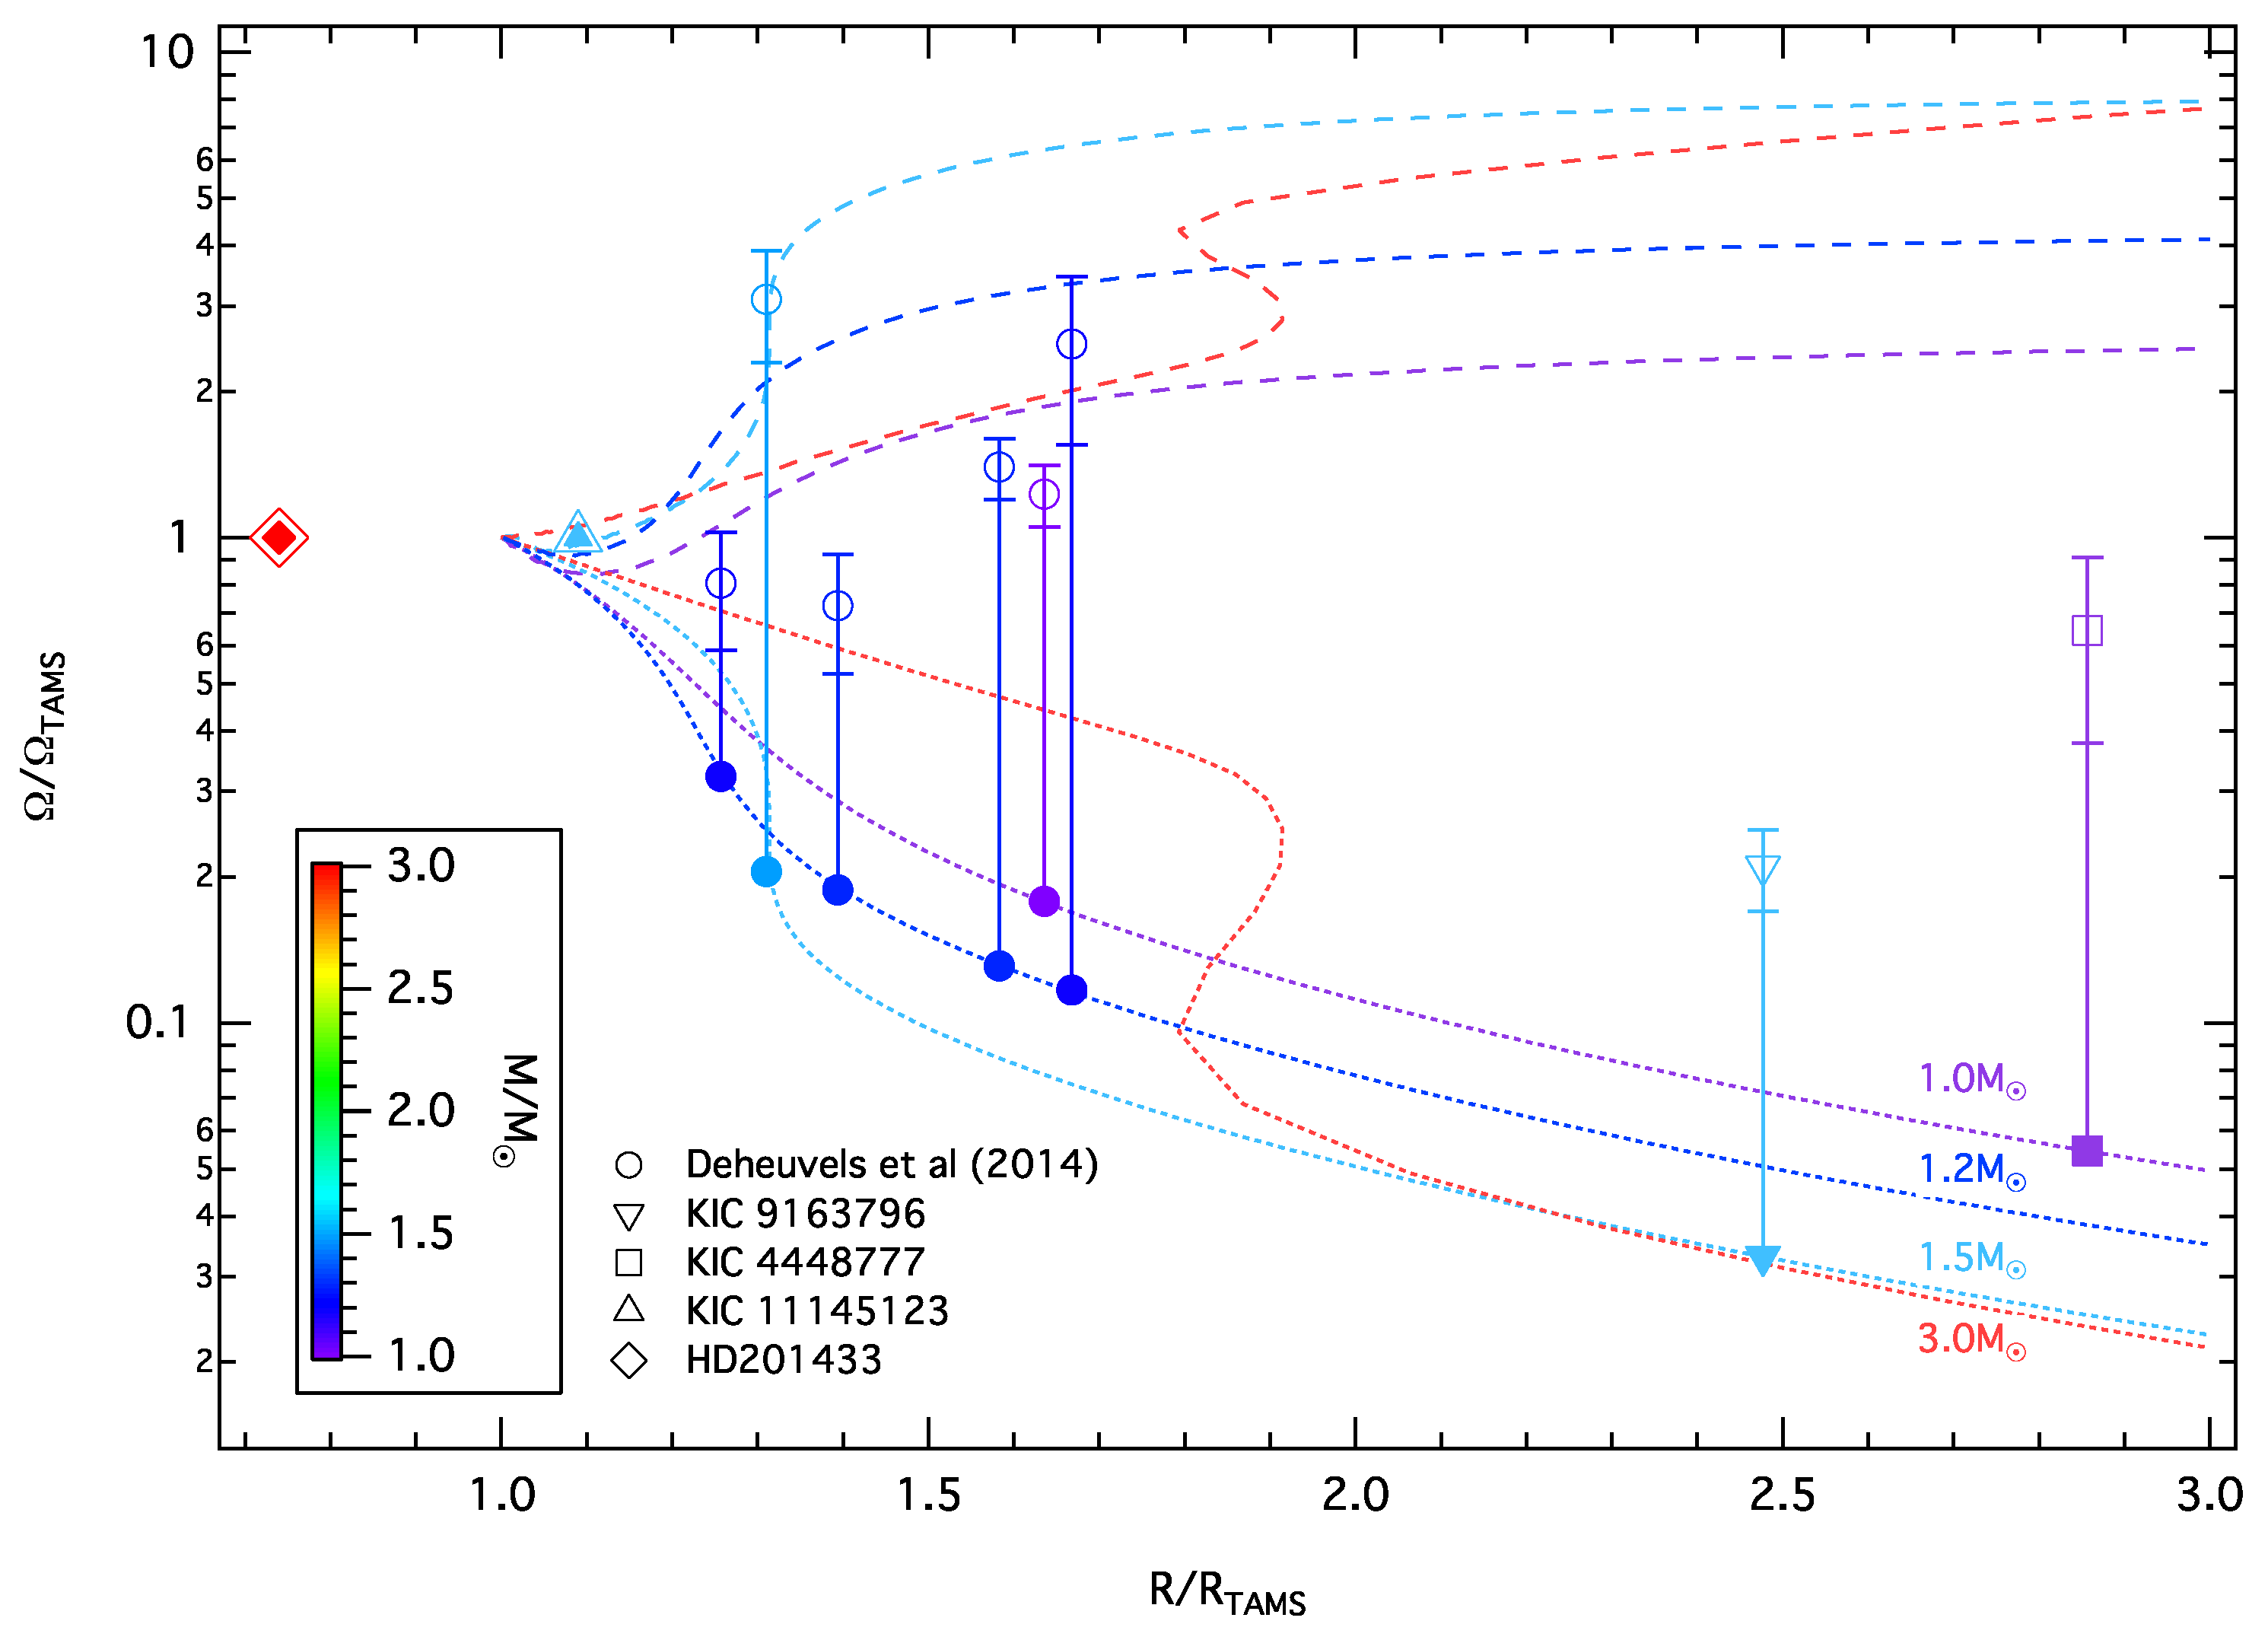
4.10. HD 201433—A Rosetta-Stone SPB Star in a Multiple System
4.11. The Young Star Pictoris and Its Exoplanetary System
4.12. The roAp Star Cir
4.13. Cas: The First Scuti Pulsator with a Dynamo Magnetic Field
- (i)
- It shows only two independent Scuti type p-mode frequencies. As Scuti stars are usually known to show up to hundreds of individual frequencies, this challenges the asteroseismic interpretation. Why only two frequencies can be detected with a total time base of over 2.5 years is still unclear.
- (ii)
- (iii)
- Additionally, the magnetic field structure of Cas is quite complex and almost certainly of dynamo origin. One may speculate that the presence of this dynamo field is related to the unusual lack of numerous Scuti frequencies.
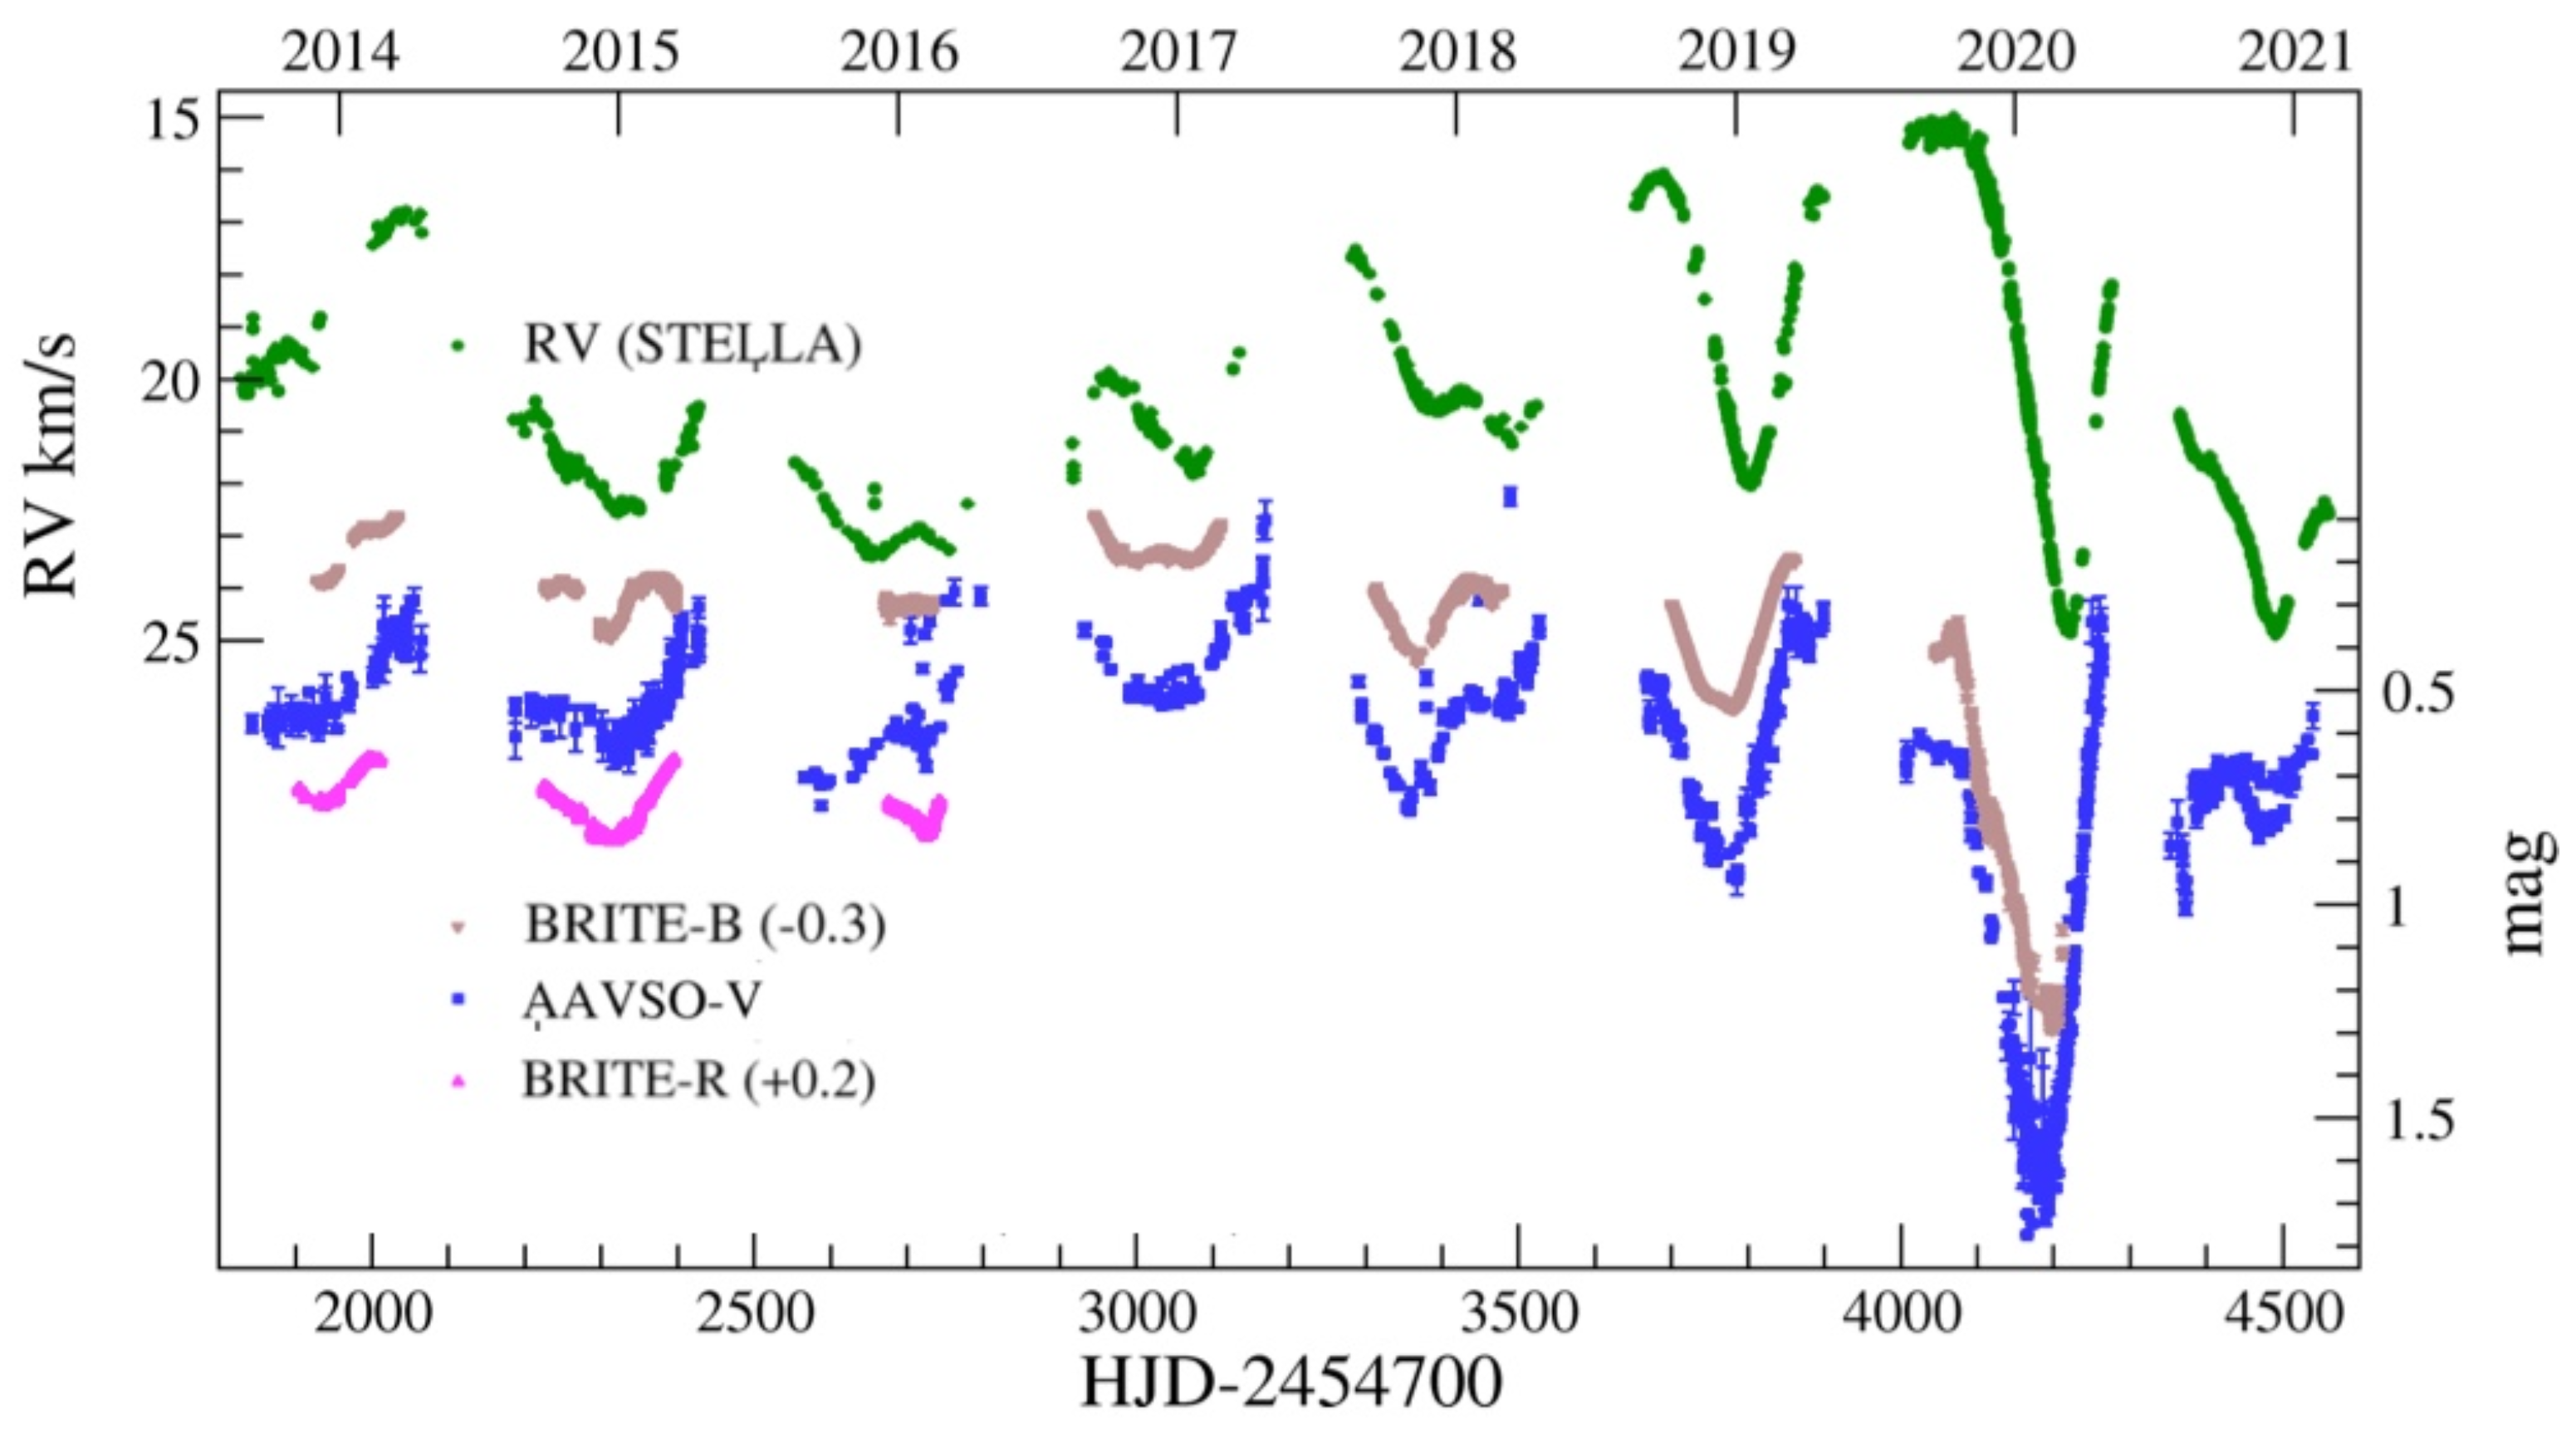
4.14. Rotation, Pulsation, Orbits and Eclipses in the Constellation of Auriga
- (i)
- The main pulsation period of the F0 supergiant Aur is detected by a multi-harmonic fit of the 152-day long light curve. This is noteworthy, because the RVs observed contemporaneously with the Stella spectrograph revealed a clear 68 d period. Although the light curve showed two minima separated by 74 d, a single period of that duration would not fit the data adequately. These RVs indicated that the (stellar) disk-integrated pulsations seem to revert when maximum or minimum light is reached, that is, the star is apparently most contracted when brightest and most expanded when faintest.
- (ii)
- An ingress of an eclipse of the Aur binary system was covered and a precise timing for its eclipse onset derived. We obtained a possible 70 d period from the outside-eclipse light-curve fits of the proposed tidally-induced, nonradial pulsations of this ellipsoidal K4 supergiant.
- (iii)
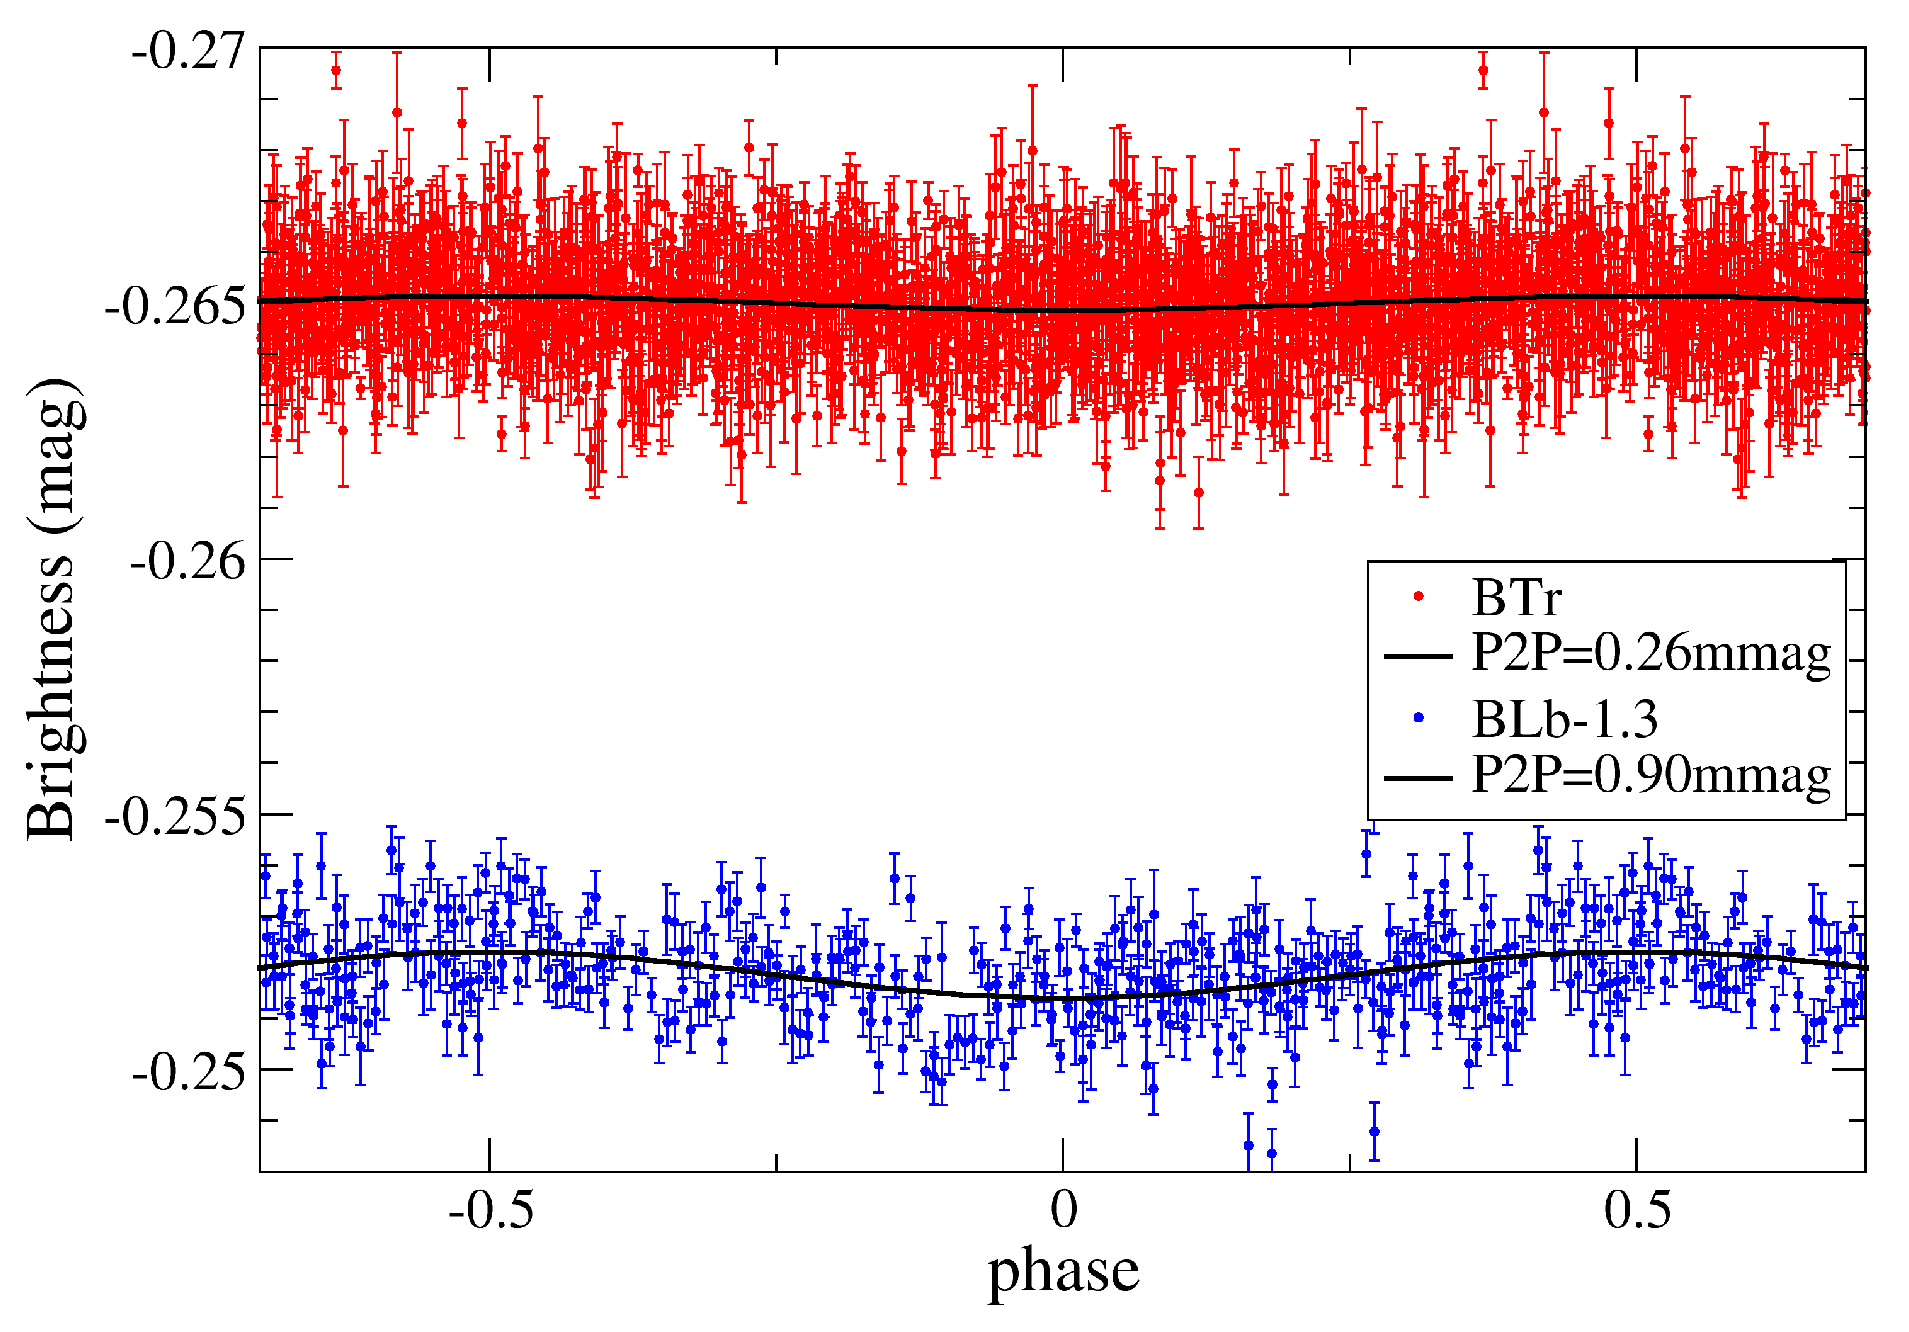
- Aur was identified as an SPB star with a main period of 1.289 ± 0.001 d. Five more periods are seen in the BRITE photometry and three of these are also seen in the RV data. The amplitude ratios as well as the phase lags between brightness and RV periods reflect those expected from low-degree gravity modes of SPB stars. Aur is, thus, among the brightest SPB stars known.
- (iv)
- Rotation of the magnetic Ap star Aur is easily detected by photometry and spectroscopy with a period of 3.6189 ± 0.0001 d and 3.6177 ± 0.0006 d, respectively. The RVs of this star show a striking non-sinusoidal shape with a large amplitude of 7 kms−1, which is likely due to the line-profile deformations from the inhomogeneous surface distribution of its chemical elements. Such a non-sinusoidal shape likely explains the small period difference and suggests that the two periods are actually in agreement.
- (v)
- Photometric rotation periods are also confirmed for the magnetic Ap star IQ Aur of 2.463 d and for the solar-type star Cet of 9.065 d, and also for the B7 HgMn giant Tau of 2.74 d. The latter remains uncertain because it was reconstructed only with the very small amplitude of 0.54 mmag.
- (vi)
- Revised orbital solutions are derived for the eclipsing SB2 binary Aur, which replaces the initial orbit from 1948, and for the RS CVn binary V711 Tau for which a spot-corrected orbital solution was achieved. The two K giants Aur and Aur are found with long-term trends in both the light curve and the RVs. Aur could be a long-period eccentric SB1 system with a low-mass companion for which a provisional orbital solution is predicted with a period of 20 yr and an eccentricity of 0.7. The RV variations of the hybrid giant Aur are of even lower amplitude (0.7 kms−1) but shorter period (≈4 yrs) and are more likely due to surface oscillations. Long-term brightness trends were seen for both stars and appear related with the RVs.
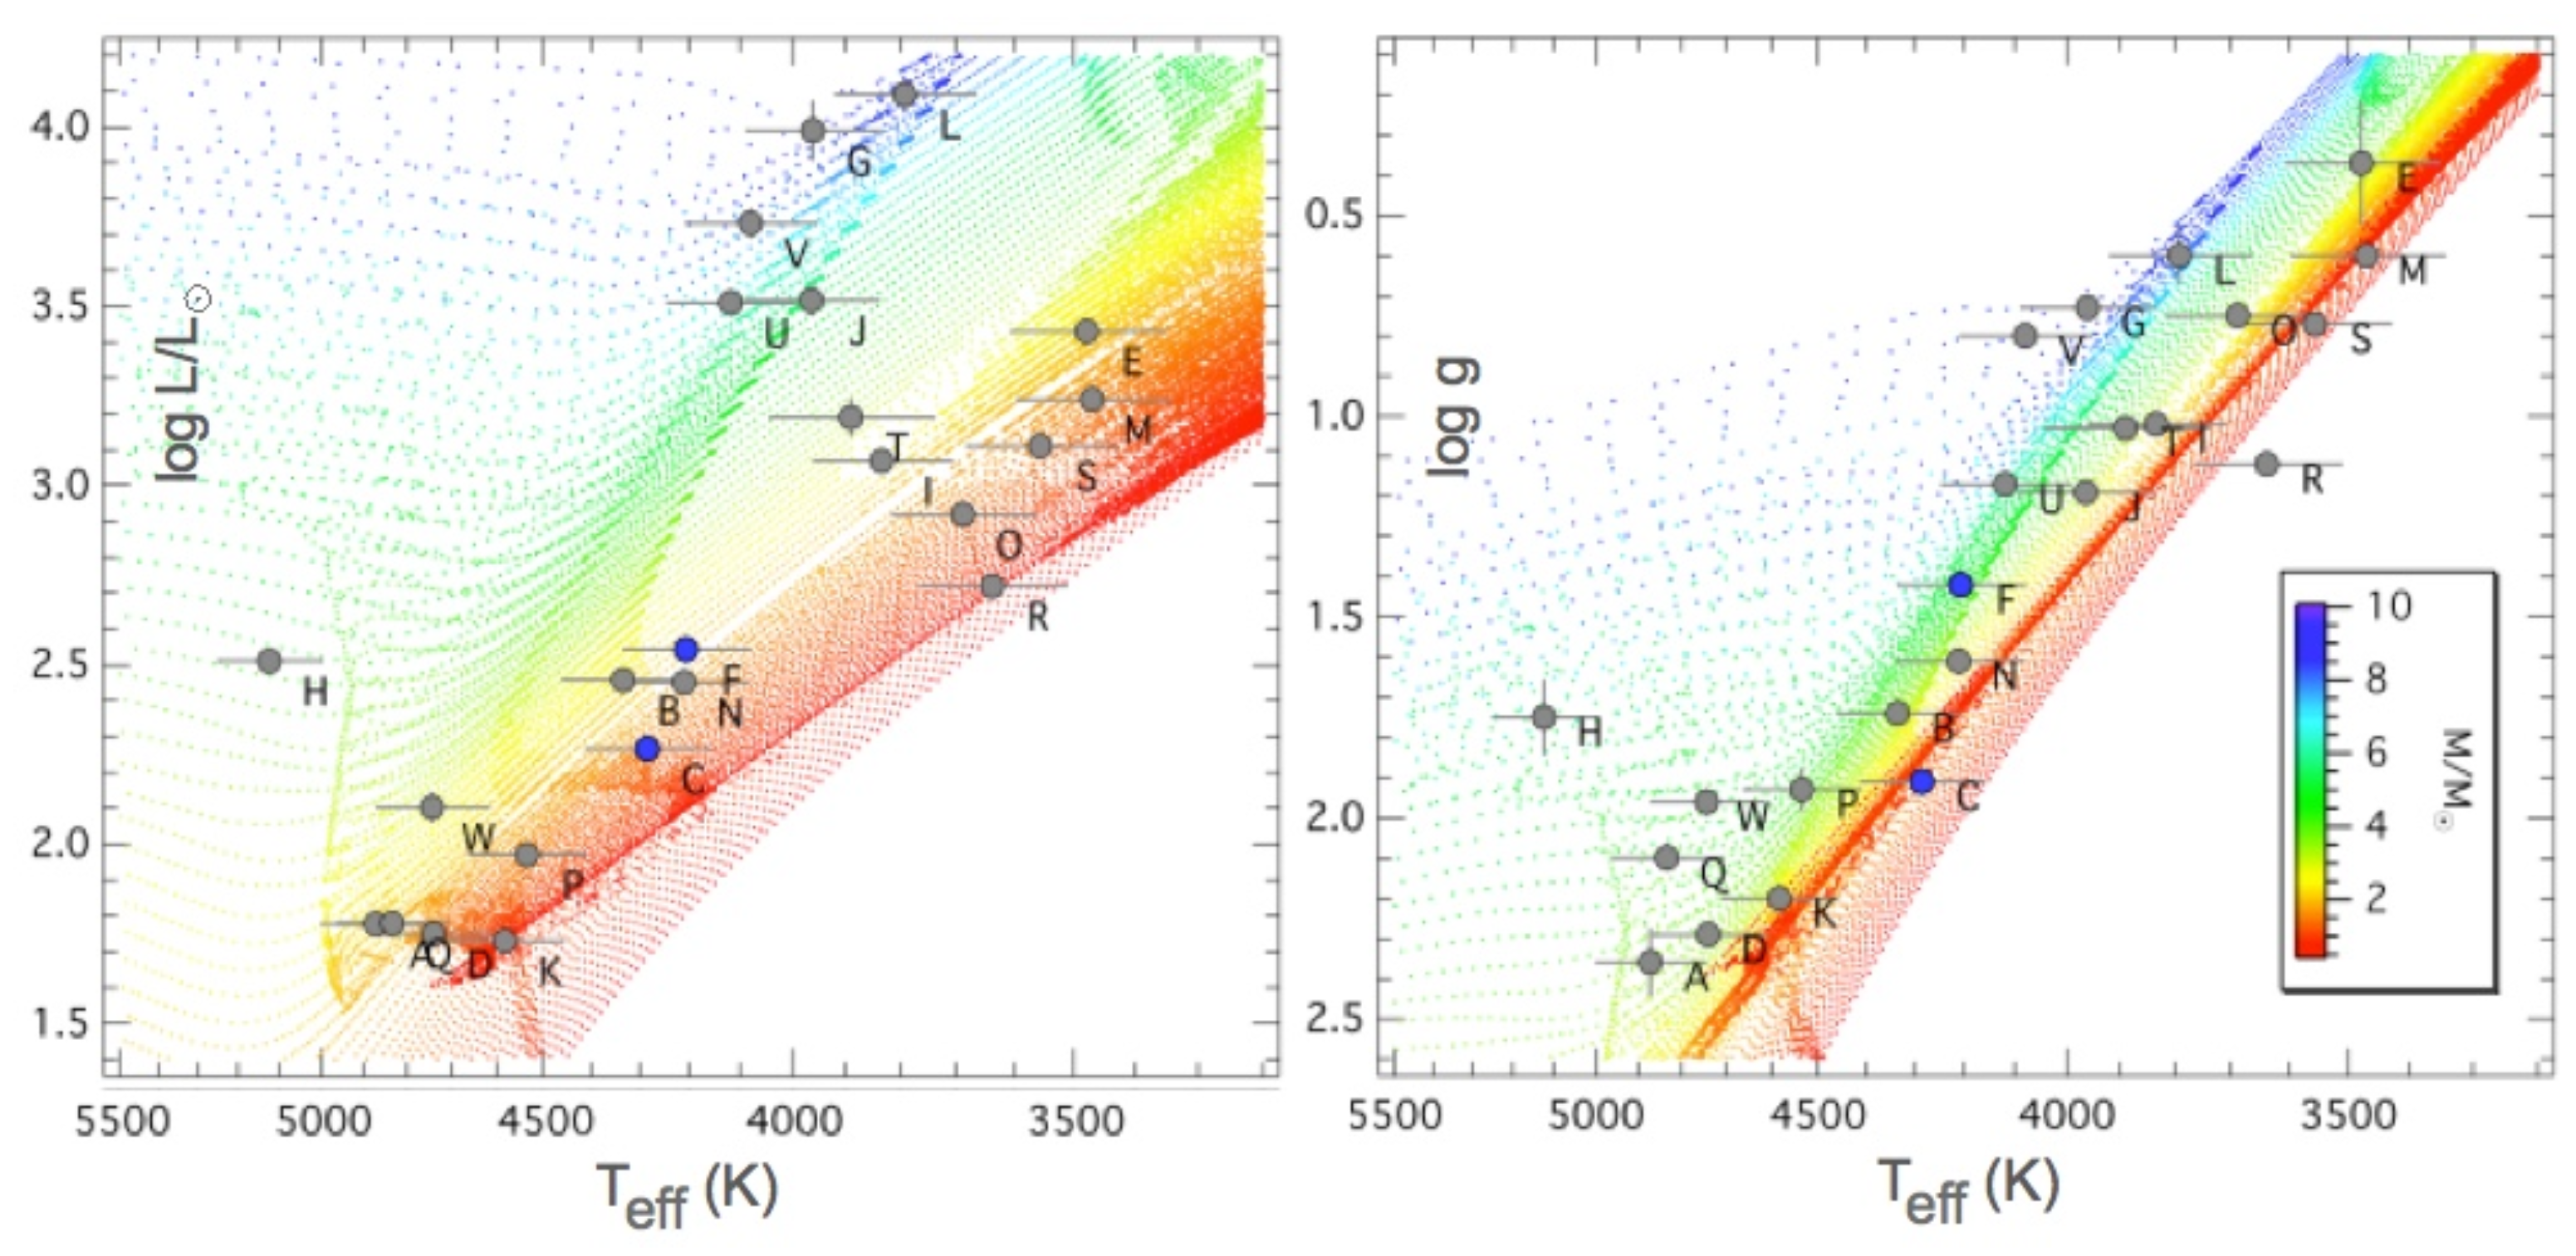
4.15. Stellar Masses of Red Giants from Their Granulation Signal
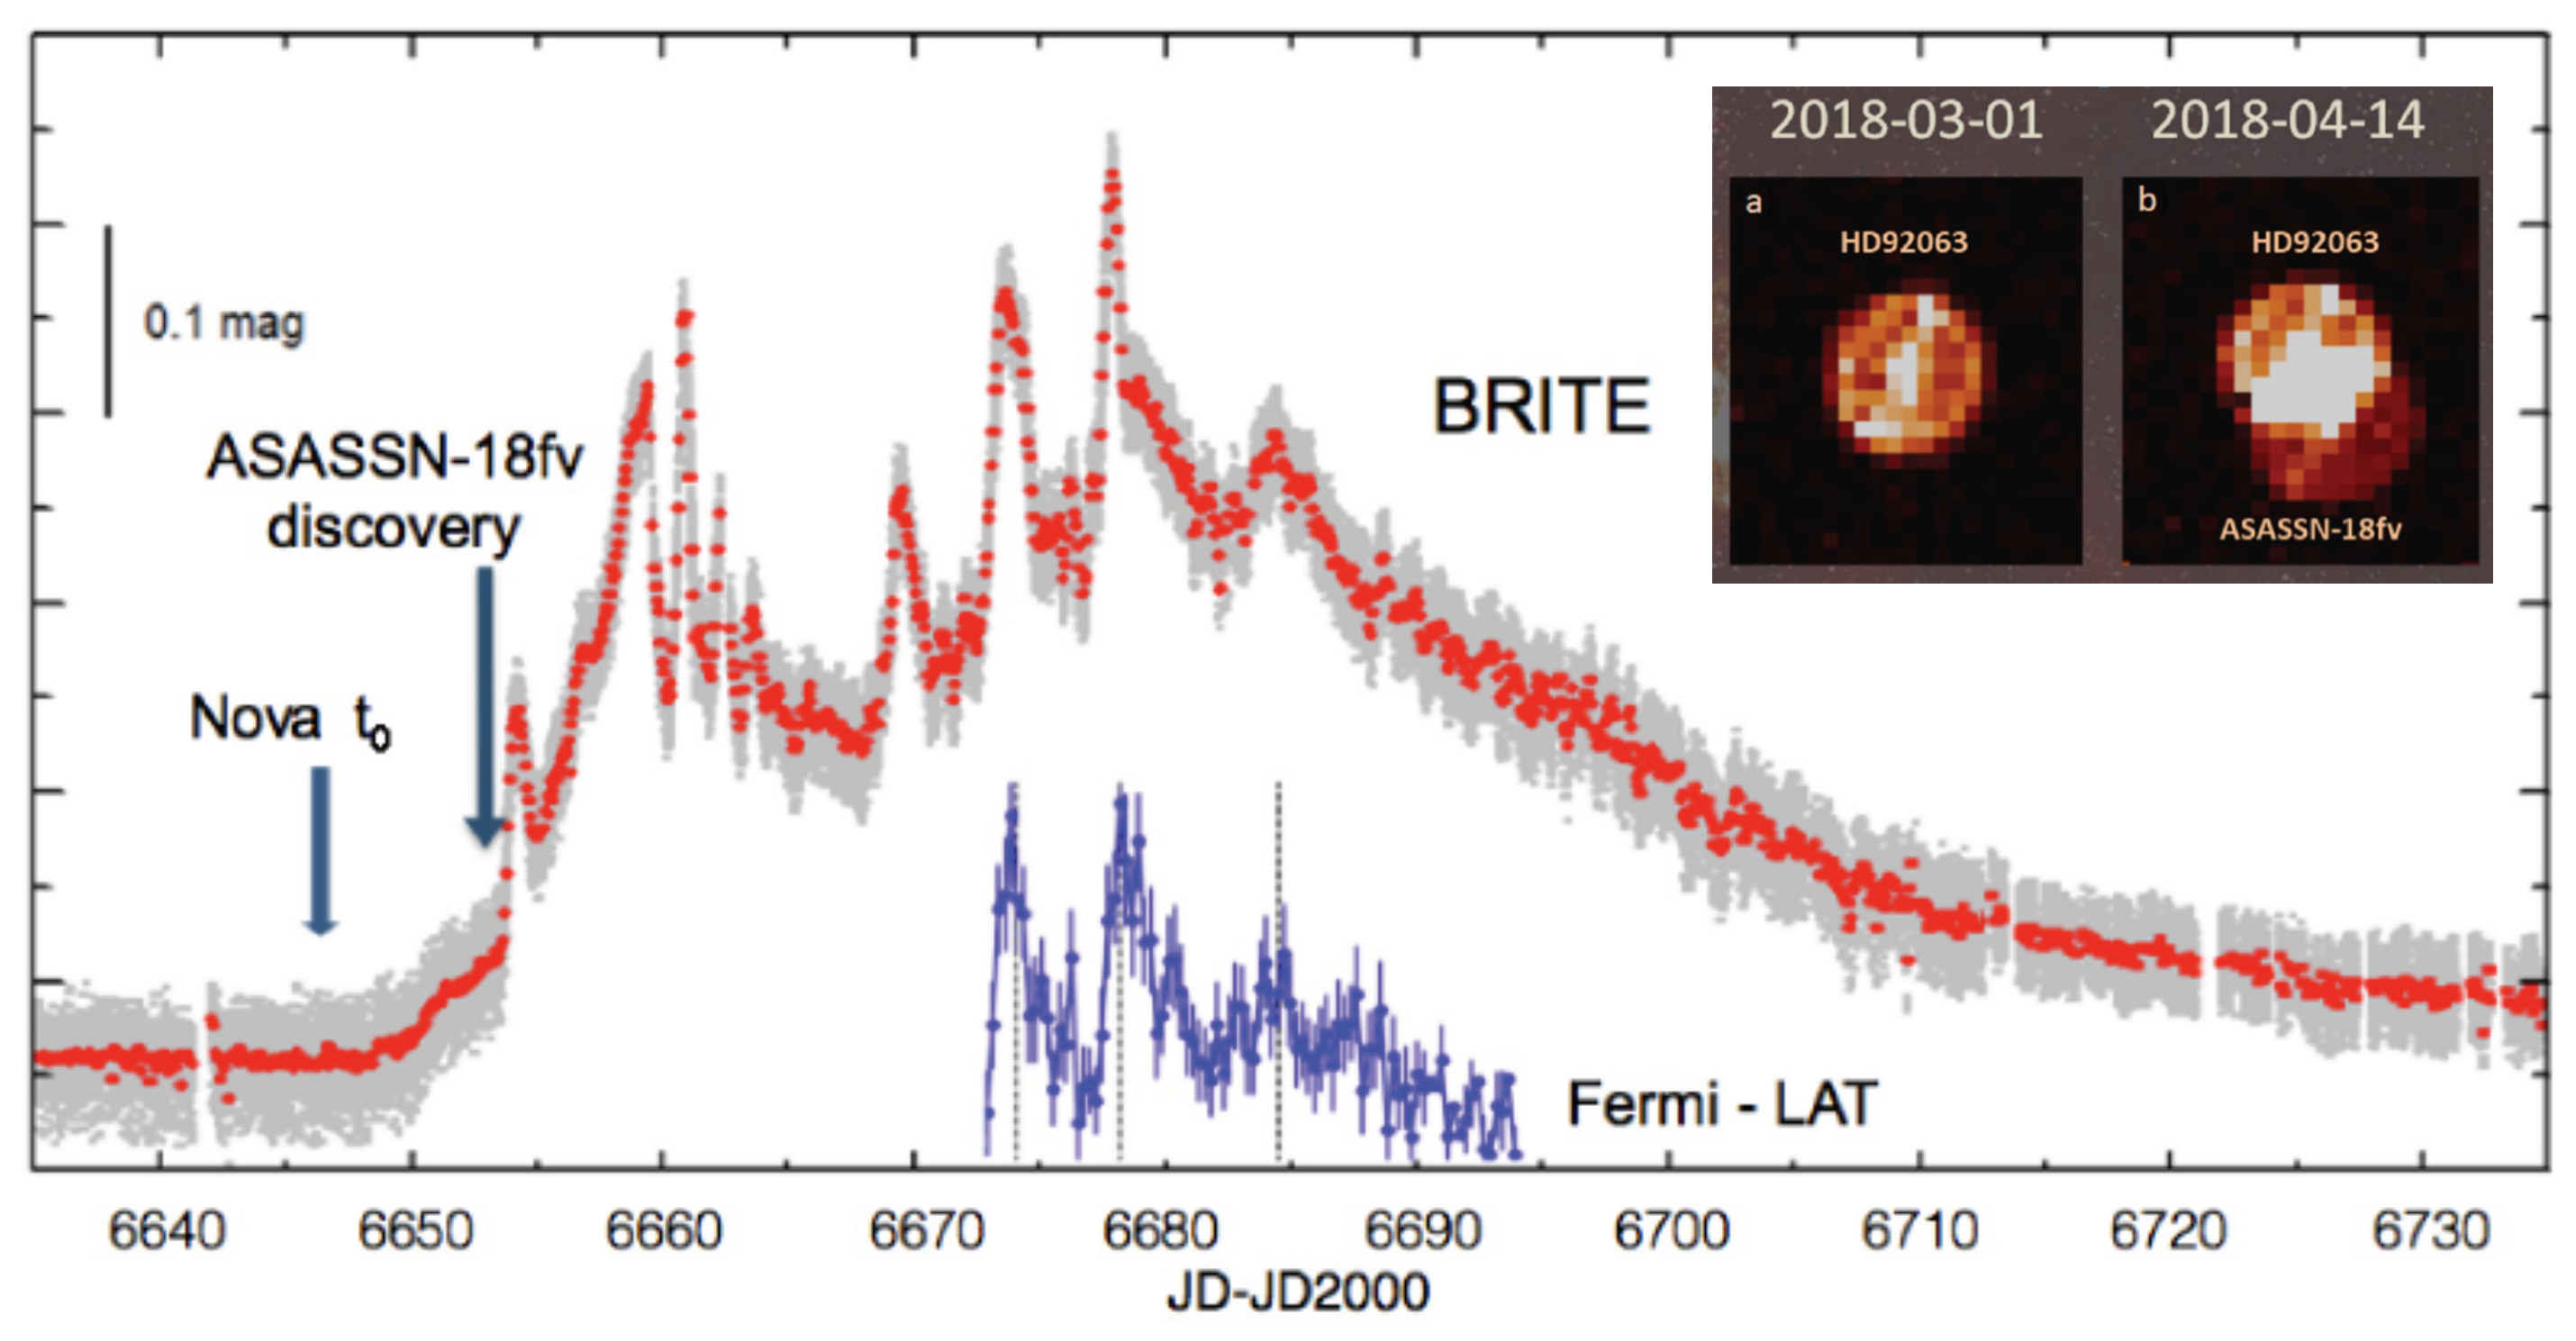
4.16. Complete Coverage of Nova Carinae 2018 (ASASSN-18fv)
- (i)
- The fact that the flares occur simultaneously in time in both BRITE bands implies that they very likely share the same origin, that is, shocks, because they power the -rays. Consequently, shocks are also powering some of the optical emission.
- (ii)
- Doubling of the luminosity of the nova during the flares, implies that the shocks power a substantial fraction of the nova luminosity.
- (iii)
- -ray and optical light curves (Figure 23) were very well sampled and indicate a time lag of approximately 5 h. This is an additional confirmation that the optical emission originates in the shocks. -rays escape from the shocks with little absorption, but it takes a few hours to reprocess the X-rays and to emit the energy in the optical regime, exactly as observed.
5. Summary
Author Contributions
Funding
Institutional Review Board Statement
Informed Consent Statement
Data Availability Statement
Conflicts of Interest
References
- Available online: http://ntrs.nasa.gov/archive/nasa/casi.ntrs.nasa.gov/19980003950_1997125989.pdf (accessed on 1 June 2021).
- Code, A.; Houck, T.; McNall, J.; Bless, R.; Lillie, C. Ultraviolet Photometry from the Orbiting Astronomical Observatory. I. Instrumentation and Operation. Astrophys. J. 1970, 181, 97. [Google Scholar] [CrossRef]
- Van Duinen, R.; Aalders, J.; Wesselius, P. The ultraviolet experiment onboard the Astronomical Netherlands Satellite-ANS. Astron. Astrophys. 1975, 39, 159–163. [Google Scholar]
- Boggess, A.; Carr, F.; Evans, D. The IUE spacecraft and instrumentation. Nature 1978, 275, 372–377. [Google Scholar] [CrossRef]
- Hall, D. The Space Telescope Observatory. In Proceedings of the Special Session of Commission 44, IAU 18th General Assembly, Patras, Greece, 17–26 August 1982. [Google Scholar]
- Van Leeuwen, F.; Evans, D.; Grenon, M.; Grossmann, V.; Mignard, F.; Perryman, M.A.C. The Hipparcos mission: Photometric data. Astron. Astrophys. 1997, 323, 61–64. [Google Scholar]
- Kallinger, T.; Weiss, W. Detecting low amplitude periodicities with Hipparcos. Astron. Astrophys. 2002, 385, 533–536. [Google Scholar] [CrossRef] [Green Version]
- Brown, A. Astrometry and Astrophysics in the Gaia Sky. In Proceedings of the International Astronomical Union, IAU Symposium 330, Nice, France, 24–28 April 2017. [Google Scholar]
- Kuschnig, R.; Weiss, W.; Gruber, R.; Bely, P.; Jenkner, H. Microvariability survey with the Hubble Space Telescope Fine Guidance Sensors. Exploring the instrumental properties. Astron. Astrophys. 1997, 328, 544–550. [Google Scholar]
- Kuschnig, R.; Weiss, W.W.; Zwintz, K. Microvariability Survey Based on Photometry with the HST Fine Guidance Sensors. ASPC 1998, 135, 362. [Google Scholar]
- Zwintz, K.; Kuschnig, R.; Weiss, W.W.; Gray, R.O.; Jenkner, H. Hubble Deep Field guide star photometry. Astron. Astrophys. 1999, 343, 899–903. [Google Scholar]
- Weiss, W.W.; Kuschnig, R.; Zwintz, K. Variability Survey with the HST. ASPC 2000, 203, 38. [Google Scholar] [CrossRef] [Green Version]
- Zwintz, K.; Weiss, W.W.; Kuschnig, R.; Gruber, R.; Frandsen, S.; Gray, R.; Jenkner, H. Variable HST guide stars. Astron. Astrophys. Suppl. Ser. 2000, 145, 481–490. [Google Scholar] [CrossRef] [Green Version]
- Kuschnig, R.; Weiss, W.; Bahr, R. A Search for Variable Stars based on the HST-FGS Photometry. In Proceedings of the Science with the Hubble Space Telescope- II, Paris, France, 4–8 December 1995. [Google Scholar]
- Mangeney, A.; Baglin, A.; Le Contel, J.-M.; Lemaire, P.; Praderie, F.; Vauclair, G. Projet de Mission Spatiale pour L’étude de la Variabilité et de L’activité des Étoiles: Evris; CNES: Paris, France, 1982. [Google Scholar]
- Vuillemin, A.; Tynok, A.; Baglin, A.; Weiss, W.W.; Auvergne, S.; Repin, S.; Bisnovatyi-Kogan, G. Towards Asteroseismology from Space, the Evris experiment. Optomechanical characteristics and pointing performances of the Evris/PAIS complex. Exp. Astron. 1998, 8, 257. [Google Scholar] [CrossRef]
- Schneider, J.; Auvergne, M.; Baglin, A.; Michel, E.; Rouan, D.; Appourchoux, T.; Barge, P.; Deleuil, M.; Vuillemin, A.; Catala, C.; et al. The CoRoT Mission: From Structure of Stars to Origin of Planetary Systems. ASPC 1998, 148, 298. [Google Scholar]
- Weiss, W.W.; Baglin, A. High-precision space photometer: CoRoT. In Proceedings of the SPIE, UV, Optical, and IR Space Telescopes and Instruments, Munich, Germany, 29–31 March 2000; Volume 4013, p. 450. [Google Scholar]
- Weiss, W.W. Microsatellites. In Proceedings of the Vienna Workshop on the Future of Asteroseismology, Vienna, Austria, 8–12 September 2008; Volume 10, p. 349. [Google Scholar]
- Lemaire, P.; Appourchaux, T.; Jones, A.; Catala, C.; Catalano, S.; Frandsen, S.; Weiss, W. PRISMA: A Space Facility for Studying the Rotation; Interior of Stars. ASP Conf. Ser. 1992, 26, 643. [Google Scholar]
- Jones, A.; Gough, D.; Andersen, B.; Baglin, A.; Bisnovatyi-Kogan, G. SRARS, Seismic Telescope for Astrophysical Research from Space; ESA: Paris, France, 1996. [Google Scholar]
- Favata, F.; Roxburgh, I.; Christensen-Dalsgaard, J. Eddington A Mission to Map Stellar Evolution through Oscillations and to Find Habitable Planets; ESA-SCI: Paris, Frence, 2000; p. 8. [Google Scholar]
- Roxburgh, I. Background to the Eddington mission. In Proceedings of the First Eddington Workshop, ESASP, Cordoba, Spain, 11–15 June 2001; Volume 485, p. 11. [Google Scholar]
- Plato SCience Advisory Team. Plato: Revealing Habitable Worlds around Solar-Like Stars; ESA-SCI: Paris, Frence, 2017. [Google Scholar]
- Rucinski, S.; Carroll, K.; Matthews, J.; Stibrany, P. MOST (Microvariability & Oscillation of STars) Canadian Astronomical Micro-Sattelite. AdSpR 2003, 31, 371. [Google Scholar]
- Borucki, W.; Koch, D.; Basri, G.; Batalha, N.; Brown, T.; Caldwell, D.; Caldwell, J.; Christensen-Dalsgaard, J.; Cochran, W.; DeVore, E.; et al. Kepler Planet-Detection Mission: Introduction and First Results. Science 2010, 327, 977–980. [Google Scholar] [CrossRef] [Green Version]
- Hacking, P.; Herter, T.; Stacey, C.; Houck, J.; Shupe, D.; Lonsdale, C.; Gautier, T.N.; Schember, H.R.; Werner, M.W.; Soifer, B.T.; et al. The Wide-Field Infrared Explorer (WIRE) Mission. ASPC 1997, 124, 432. [Google Scholar]
- Eyles, C.; Simnett, G.; Cooke, M.; Jackson, B.; Buffington, A.; Hick, P.P.; Waltham, N.R.; King, J.M.; Anderson, P.A.; Holladay, P.E.; et al. The Solar Mass Ejection Imager (SMEI). Sol. Phys. 2003, 217, 319–347. [Google Scholar] [CrossRef]
- Ricker, G.; Winn, J.; Vanderspek, R.; Latham, D.; Bakos, G.; Bean, J.; Berta-Thompson, Z.K.; Brown, T.M.; Buchhave, L.; Butler, N.R.; et al. The Transiting Exoplanet Survey Satellite (TESS). SPIE Proc. Vol. 2014, 9143, 556. [Google Scholar]
- Cunha, M.; Antoci, V.; Holdsworth, D.; Kurtz, D.; Balona, L.; Bognar, Z.; Bowman, D.M.; Guo, Z.; Kolaczek-Szymanski, P.A.; Lares-Martiz, M.; et al. Rotation and pulsation in Ap stars: First light results from TESS sectors 1 and 2. Mon. Not. R. Astron. Soc. 2019, 487, 3523–3549. [Google Scholar] [CrossRef] [Green Version]
- Antoci, V.; Cunha, M.; Bowman, D.; Murphy, S.; Kurtz, D.; Weiss, W. The first view of δ Scuti and γ Doradus stars with the TESS mission. Mon. Not. R. Astron. Soc. 2019, 490, 4040–4059. [Google Scholar] [CrossRef]
- Bowman, D.M. Asteroseismology of high-mass stars: New insights of stellar interiors with space telescopes. FrASS 2020, 7, 70. [Google Scholar]
- Burssens, S.; Simón-Díaz, S.; Bowman, D.; Holgado, G.; Michielsen, M.; de Burgos, A.; Castro, N.; Barbá, R.H.; Aerts, C. Variability of OB stars from TESS southern Sectors 1–13 and high-resolution IACOB and OWN spectroscopy. Astron. Astrophys. 2020, 639, 81. [Google Scholar] [CrossRef]
- BRITE. Available online: https://brite-constellation.at (accessed on 1 June 2021).
- Zwintz, K.; Kaiser, A. Proceedings of the first BRITE Workshop. In Communications in Asteroseismology; Breger: Vienna, Austria, 2008. [Google Scholar]
- Weiss, W.; Rucinski, S.; Moffat, A.; Schwarzenberg-Czerny, A.; Koudelka, O.; Grant, C.C.; Zee, R.E.; Kuschnig, R.; Mochnacki, S.; Matthews, J.M.; et al. BRITE-Constellation: Nanosatellites for precision photometry of bright stars. Publ. Astron. Soc. Pac. 2014, 126, 573–585. [Google Scholar] [CrossRef] [Green Version]
- Deschamps, N.; Grant, C.; Foisy, D.; Zee, R.; Moffat, A.; Weiss, W. BRITE-Constellation. Acta Astronaut. 2009, 65, 643. [Google Scholar] [CrossRef]
- Koudelka, O.; Unterberger, M.; Romano, P. Nanosatellites-the BRITE and OPS-SAT missions. e&i Elektrotechnik Und Inf. 2014, 131, 178–187. [Google Scholar]
- Pablo, H.; Whittaker, G.; Popowicz, A.; Mochnacki, S.; Kuschnig, R.; Grant, C.C.; Moffat, A.F.J.; Rucinski, S.M.; Matthews, J.M.; Schwarzenberg-Czerny, A.; et al. The BRITE-Constellation nanosatellite mission: Testing, commissioning, and operations. Publ. Astron. Soc. Pac. 2016, 128, 125001. [Google Scholar] [CrossRef] [Green Version]
- Popowicz, A.; Pigulski, A.; Bernacki, K.; Kuschnig, R.; Pablo, H.; Ramiaramanantsoa, T.; Zocoska, E.; Baade, D.; Handler, G.; Moffat, A.F.J.; et al. BRITE-Constellation: Data processing and photometry. Astron. Astrophys. 2017, 605, A26. [Google Scholar] [CrossRef] [Green Version]
- Popowicz, A. PSF photometry for BRITE nano-satellite mission. Proc SPIE 2018, 10698, 1069820. [Google Scholar]
- Zwintz, K.; Poretti, E. (Eds.) Small satellites-big science, Second BRITE-Constellation Science Conference, Innsbruck. Proc. Pol. Astron. Soc. (PPAS) 2016, 5, 15. [Google Scholar]
- Neiner, C.; Weiss, W.; Baade, D.; Griffin, E.; Lovekin, C.; Moffat, A. Stars and Their Variability. Observed from Space, Celebrating the 5th Anniversary of BRITE-Constellation. 2019. Available online: https://starsandspace.univie.ac.at/home/proceeding/ (accessed on 1 June 2021).
- Zwintz, K.; Van Reeth, T.; Tkachenko, A.; Gössl, S.; Pigulski, A. Constraining the near-core rotation of the γ Doradus star 43 Cygni using BRITE-Constellation data. Astron. Astrophys. 2017, 608, 103. [Google Scholar] [CrossRef] [Green Version]
- Popowicz, A. Analysis of Dark Current in BRITE Nanostellite CCD Sensors. Sensors 2018, 18, 479. [Google Scholar] [CrossRef] [Green Version]
- Popowicz, A.; Farah, A. Metastable Dark Current in BRITE Nano-Satellite Image Sensor. Remote Sens. 2020, 12, 3633. [Google Scholar] [CrossRef]
- Bowman, D.; Burssens, S.; Pedersen, M.; Johnston, C.; Aerts, C.; Buysschaert, B.; Michielsen, M.; Tkachenko, A.; Rogers, T.M.; Edelmann, P.V.F.; et al. Low-frequency gravity waves in blue supergiants revealed by high-precision space photometry. Nat. Astron. 2019, 3, 760–765. [Google Scholar] [CrossRef]
- Ramiaramanantsoa, T.; Moffat, A.; Harmon, R.; Ignace, R.; St-Louis, N.; Vanbeveren, D.; Shenar, T.; Pablo, H.; Richardson, N.D.; Howarth, I.D.; et al. BRITE-Constellation high-precision time-dependent photometry of the early-O-type supergiant ζ Puppis unveils the photospheric drivers of its small- and large-scale wind structures. Mon. Not. R. Astron. Soc. 2018, 473, 5532–5569. [Google Scholar] [CrossRef]
- Nichols, J.; Huenemoerder, D.; Naze, Y.; Lauer, J.; Ignace, R.; Miller, N. The zeta Pup Consortium: Correlated X-ray and optical variability in the O-type supergiant ζ Pup. Astrophys. J. 2021, 906, 89. [Google Scholar] [CrossRef]
- Lenoir-Craig, G.; St-Louis, N.; Moffat, A.; Ramiaramanantsoa, T.; Pablo, H. Variability of Wolf-Rayet Stars through MOST(LY) BRITE Eyes. In Proceedings of the Conference Stars and Their Variability Observed from Space, Vienna, Austria, 19–23 August 2019. [Google Scholar]
- Chené, A.; St-Louis, N.; Moffat, A.; Schnurr, O.; Crowther, P.; Wade, G.A.; Richardson, N.D.; Baranec, C.; Ziegler, C.A.; Law, N.M.; et al. BinaMIcS Collaboration: Investigating the origin of the spectral line profiles of the Hot Wolf-Rayet Star WR 2. Mon. Not. R. Astron. Soc. 2019, 484, 5834–5844. [Google Scholar] [CrossRef]
- Chené, A.; St-Louis, N.; Moffat, A.; Gayley, K. Clumping in the Winds of Wolf-Rayet Stars. Astrophys. J. 2020, 903, 113. [Google Scholar] [CrossRef]
- Ramiaramanantsoa, T.; Ignace, R.; Moffat, A.; St-Louis, N.; Shkolnik, E.; Popowicz, A.; Kuschnig, R.; Pigulski, A.; Wade, G.A.; Handler, G.; et al. The chaotic wind of WR 40 as probed by BRITE. Mon. Not. R. Astron. Soc. 2019, 490, 5921–5930. [Google Scholar] [CrossRef]
- Ramiaramanantsoa, T.; Ratnasingam, R.; Shenat, T.; Moffat, A.; Rogers, T.; Popowicz, A.; Kuschnig, R.; Pigulski, A.; Handler, G.; Wade, G.A.; et al. A BRITE view on the massive O-type supergiant V973 Scorpii: Hints towards internal gravity waves or sub-surface convection zones. Mon. Not. R. Astron. Soc. 2018, 480, 972–986. [Google Scholar] [CrossRef]
- Richardson, N.; Russell, C.; St-Jean, L.; Moffat, A.; St-Louis, N.; Shenar, T.; Pablo, H.; Hill, G.M.; Ramiaramanantsoa, T.; Corcoran, M.; et al. The variability of the BRITE-est Wolf-Rayet binary, γ2 Velorum-I. Photometric and spectroscopic evidence for colliding winds. Mon. Not. R. Astron. Soc. 2017, 471, 2715–2729. [Google Scholar] [CrossRef] [Green Version]
- Pablo, H.; Richardson, N.; Fuller, J.; Rowe, J.; Moffat, A.; Kuschnig, R.; Popowicz, A.; Handler, G.; Neiner, C.; Pigulski, A.; et al. The most massive heartbeat: An in-depth analysis of ι Orionis. Mon. Not. R. Astron. Soc. 2017, 467, 2494–2503. [Google Scholar] [CrossRef] [Green Version]
- Shultz, M.; Wade, G.; Alecian, E. BinaMIcS Collaboration: Detection of magnetic fields in both B-type components of the ϵ Lupi system: A new constraint on the origin of fossil fields? Mon. Not. R. Astron. Soc. 2015, 454, L1–L5. [Google Scholar] [CrossRef]
- Pablo, H.; Shultz, M.; Fuller, J.; Wade, G.A.; Paunzen, E.; Mathis, S.; Le Bouquin, J.-B.; Pigulski, A.; Handler, G.; Alecian, E.; et al. ϵ Lupi: Measuring the heartbeat of a doubly-magnetic massive binary with BRITE-Constellation. Mon. Not. R. Astron. Soc. 2019, 488, 64–77. [Google Scholar]
- Richardson, N.; Pablo, H.; Sterken, C.; Pigulski, A.; Koenigsberger, C.; Moffat, A.F.J.; Madura, T.I.; Hamaguchi, K.; Corcoran, M.F.; Damineli, A.; et al. BRITE-Constellation reveals evidence for pulsations in the enigmatic binary η Carinae. Mon. Not. R. Astron. Soc. 2018, 475, 5417–5423. [Google Scholar] [CrossRef] [Green Version]
- Van Genderen, A.; Sterken, C.; de Groot, M.; Stahl, O.; Andersen, J.; Andersen, M.I.; Caldwell, J.A.R.; Casey, B.; Clement, R.; Corradi, W.J.B.; et al. A pulsating star inside η Carinae I. Light variations 1992–1994. Astron. Astrophys. 1995, 304, 415. [Google Scholar]
- Sterken, C.; de Groot, M.; van Genderen, A. A pulsating star inside η Carinae. II. The variability of the pulsation period. Astron. Astrophys. Suppl. Ser. 1996, 116, 9–14. [Google Scholar]
- Goldberg, L. The variability of alpha Orionis. Publ. Astron. Soc. Pac. 1984, 96, 366. [Google Scholar] [CrossRef] [Green Version]
- Dupree, A.; Baliunas, S.; Guinan, E.; Hartmann, L.; Nassiopoulos, G.; Sonneborn, G. Periodic Photospheric and Chromospheric Modulation in Alpha Orionis (Betelgeuse). Astrophys. J. 1987, 317, L85–L89. [Google Scholar] [CrossRef]
- Smith, M.; Patten, B.; Goldberg, L. Radial Velocity Variations in Alpha Orionis, Alpha Scorpii, and Alpha Herculis. Astron. J. 1989, 98, 2233. [Google Scholar] [CrossRef]
- Kiss, L.; Szabó, G.; Bedding, T. Variability in red supergiant stars: Pulsations, long secondary periods and convection noise. Mon. Not. R. Astron. Soc. 2006, 372, 1721–1734. [Google Scholar] [CrossRef] [Green Version]
- Strassmeier, K.; Granzer, T.; Weber, M.; Woche, M.; Andersen, M.; Bartus, J.; Bauer, S.-M.; Dionies, F.; Popow, E.; Fechner, T.; et al. The STELLA robotic observatory. Stronomische Nachr. Astron. Notes 2004, 325, 527–532. [Google Scholar] [CrossRef]
- Dupree, A.; Strassmeier, K.; Matthews, L.; Uitenbroek, H.; Calderwood, T.; Granzer, T.; Guinan, E.F.; Leike, R.; Montarges, M.; Richards, A.M.S.; et al. Spatially Resolved Ultraviolet Spectroscopy of the Great Dimming of Betelgeuse. Astrophys. J. 2020, 899, 68. [Google Scholar] [CrossRef]
- Meynet, G.; Haemmerlé, L.; Ekström, S.; Georgy, C.; Groh, J.; Maeder, A. The past and future evolution of a star like Betelgeuse. EAS Publ. Ser. 2013, 60, 17–28. [Google Scholar] [CrossRef] [Green Version]
- Shultz, M.; Wade, G.; Rivinius, T.; Neiner, C.; Henrichs, H.; Marcolino, W.; MiMeS Collaboration. The pulsating magnetosphere of the extremely slowly rotating magnetic β Cep star ζ1 CMa. Mon. Not. R. Astron. Soc. 2017, 471, 2286–2310. [Google Scholar] [CrossRef] [Green Version]
- Oskinova, L.; Nazé, Y.; Todt, H.; Huenemoerder, D.; Ignace, R.; Hubrig, S.; Hamann, W.-R. Discovery of X-ray pulsations from a massive star. NatCo 2014, 5, 4024. [Google Scholar] [CrossRef] [PubMed] [Green Version]
- Pigulski, A. The light-time effect as the cause of period changes in beta Cephei stars. II. Sigma Scorpii. Astron. Astrophys. 1992, 261, 203–208. [Google Scholar]
- Jerzykiewicz, M. Long-term period and amplitude variations in β Cephei stars. NewAR 1999, 43, 455–460. [Google Scholar] [CrossRef]
- Wade, G.; Pigulski, A.; Begy, S.; Shultz, M.; Handler, G.; Sikora, J.; Neilson, H.; Cugier, H.; Erba, C.; Moffat, A.F.J.; et al. Evolving pulsation of the slowly rotating magnetic β Cep star ζ1CMa. Mon. Not. R. Astron. Soc. 2020, 492, 2762–2774. [Google Scholar] [CrossRef]
- Pigulski, A.; Cugier, H.; Popowicz, A.; Kuschnig, R.; Moffat, A.; Rucinski, S.M.; Schwarzenberg-Czerny, A.; Weiss, W.W.; Handler, G.; Wade, G.A.; et al. Massive pulsating stars observed by BRITE-Constellation I. The triple system β Centauri (Agena). Astron. Astrophys. 2016, 588, 55. [Google Scholar] [CrossRef] [Green Version]
- Alecian, E.; Kochukhov, O.; Neiner, C.; Wade, G.; de Batz1, B.; Henrichs, H.; Grunhut, J.H.; Bouret, J.-C.; Briquet, M.; Gagne, M.; et al. First HARPSpol discoveries of magnetic fields in massive stars. Astron. Astrophys. 2011, 536, 6. [Google Scholar] [CrossRef]
- Handler, G.; Rybicka, M.; Popowicz, A.; Pigulski, A.; Kuschnig, R.; Zocoska, E.; Moffat, A.F.J.; Weiss, W.W.; Grant, C.C.; Pablo, H.; et al. Combining BRITE and ground-based photometry for the β Cephei star ν Eri: Impact on photometric pulsation mode identification and detection of several g modes. Mon. Not. R. Astron. Soc. 2017, 464, 2249–2258. [Google Scholar] [CrossRef]
- Daszyńska-Daszkiewicz, J.; Pamyatnykh, A.; Walczak, P.; Colgan, J.; Fontes, C.; Kilcrease, D. Interpretation of the BRITE oscillation data of the hybrid pulsator ν Eridani: A call for the modification of stellar opacities. Mon. Not. R. Astron. Soc. 2017, 466, 2284–2293. [Google Scholar] [CrossRef] [Green Version]
- Daszyńska-Daszkiewicz, J.; Walczak, P.; Pamyatnykh, A.; The BRITE Team. What Have We Learnt About B-Type Main Sequence Pulsators from the BRITE Data? PTA Proc. 2018, 8, 65. [Google Scholar]
- Walczak, P.; Daszyńska-Daszkiewicz, J.; Pigulski, A.; Pamyatnykh, A.; Moffat, A.; Handler, G.; Pablo, H.; Popowicz, A.; Wade, G.; Weiss, W.W.; et al. Seismic modelling of early B-type pulsators observed by BRITE–I. θ Ophiuchi. Mon. Not. R. Astron. Soc. 2019, 485, 3544–3557. [Google Scholar] [CrossRef]
- Jerzykiewicz, M.; Pigulski, A.; Handler, G.; Moffat, A.; Popowicz, A.; Handler, G.; Pablo, H.; Popowicz, A.; Wade, G.; Weiss, W.W.; et al. BRITE-Constellation photometry of π5 Orionis, an ellipsoidal SPB variable. Mon. Not. R. Astron. Soc. 2020, 496, 2391–2401. [Google Scholar] [CrossRef]
- Rivinius, T.; Carciofi, A.; Martayan, C. Classical Be stars. Rapidly rotating B stars with viscous Keplerian decretion disks. Astron. Astrophys. Rev. 2013, 21, 69. [Google Scholar] [CrossRef] [Green Version]
- Wang, L.; Gies, D.R.; Peters, G.J. Detection of Additional Be+sdO Systems from IUE Spectroscopy. Astrophys. J. 2018, 853, 156. [Google Scholar] [CrossRef] [Green Version]
- Baade, D.; Pigulski, A.; Rivinius, T.; Wang, L.; Martayan, C.; Handler, G.; Panoglou, D.; Carciofi, A.C.; Kuschnig, R.; Mehner, A.; et al. Short-term variability and mass loss in Be stars. IV. Two groups of closely spaced, approximately equidistant frequencies in three decades of space photometry of ν Puppis (B7-8 IIIe). Astron. Astrophys. 2018, 620, A145. [Google Scholar] [CrossRef] [Green Version]
- Neiner, C.; Lee, U.; Mathis, S.; Saio, H.; Lovekin, C.; Augustson, K. Transport of angular momentum by stochastically excited waves as an explanation for the outburst of the rapidly rotating Be star HD 49330. Astron. Astrophys. 2020, 644, A9. [Google Scholar] [CrossRef]
- Rivinius, T.; Baade, D.; Stefl, S.; Stahl, O.; Wolf, B.; Kaufer, A. Multiperiodic Line-profile Variability and a Tentative Ephemeris for Line-Emission Outbursts of the Be Star μ Cen. ASP Conf. Ser. 1998, 135, 343. [Google Scholar]
- Haubois, X.; Carciofi, A.; Rivinius, T.; Okazaki, A.; Bjorkman, J. Dynamical Evolution of Viscous Disks around Be Stars. I. Photometry. Astrophys. J. 2012, 756, 156. [Google Scholar] [CrossRef] [Green Version]
- Baade, D.; Rivinius, T.; Pigulski, A.; Carciofi, A.; Martayan, C.; Moffat, A.F.J.; Wade, G.A.; Weiss, W.W.; Grunhut, J. Short-term variability and mass loss in Be stars. I. BRITE satellite photometry of η and μ Centauri. Astron. Astrophys. 2016, 588, 56. [Google Scholar] [CrossRef] [Green Version]
- Baade, D.; Pigulski, A.; Rivinius, T.; Carciofi, A.; Panoglou, D.; Ghoreyshi, M.R.; Handler, G.; Kuschnig, R.; Moffat, A.F.J.; Pablo, H.; et al. Short-term variability and mass loss in Be stars. III. BRITE and SMEI satellite photometry of 28 Cygni. Astron. Astrophys. 2018, 610, A70. [Google Scholar] [CrossRef] [Green Version]
- Baade, D.; Rivinius, T.; Pigulski, A.; Panoglou, D.; Carciofi, A.; Handler, G.; Kuschnig, R.; Martayan, C.; Mehner, A.; Moffat, A.F.J.; et al. BRITEning up the Be Phenomenon. 3rd BRITE Science Conference. Proc. Pol. Acad. Sci. 2018, 8, 69. [Google Scholar]
- Stefl, S.; Baade, D.; Rivinius, T.; Stahl, O.; Wolf, B.; Kaufer, A. Circumstellar Quasi-periods Accompanying Stellar Periods of Be Stars. ASP Conf. Ser. 1998, 135, 348. [Google Scholar]
- Labadie-Bartz, J.; Carciofi, A.; de Amorim, T.; Rubio, A.; Luiz, A. Classifying Be star variability with TESS I: The southern ecliptic. arXiv 2020, arXiv:2010.13905. [Google Scholar]
- Labadie-Bartz, J.; Baade, D.; Carciofi, A.; Rubio, A.; Rivinius, T.; Borre, C.C.; Martayan, C.; Siverd, R.J. Short-term variability and mass loss in Be stars—VI. Frequency groups in γ Cas detected by TESS. Mon. Not. R. Astron. Soc. 2021, 502, 242–259. [Google Scholar] [CrossRef]
- Baade, D.; Rivinius, T. The demystification of classical Be stars through space photometry. In Proceedings of the Conference Stars and their Variability Observed from Space, Vienna, Austria, 19–23 August 2019; p. 35. [Google Scholar]
- Borre, C.; Baade, D.; Pigulski, A.; Panoglou, D.; Weiss, A.; Rivinius, T.; Handler, G.; Moffat, A.F.J.; Popowicz, A.; Wade, G.A.; et al. Short-term variability and mass loss in Be stars. V. Space photometry and ground-based spectroscopy of γ Cas. Astron. Astrophys. 2020, 635, 140. [Google Scholar] [CrossRef] [Green Version]
- Smith, M.; Henry, G. Automated photometry of γ Cassiopeiae: The last roundup. arXiv 2021, arXiv:2103.03972. [Google Scholar]
- Rucinski, S.M.; Pigulski, A.; Popowicz, A.; Kuschnig, R.; Kozlowski, S.; Moffat, A.F.J.; Pavlovski, K.; Handler, G.; Pablo, H.; Wade, G.A.; et al. Light-curve instabilities of β Lyrae observed by the BRITE satellites. Astrophys. J. 2018, 156, 12. [Google Scholar] [CrossRef]
- Rucinski, S.; Pigulski, A.; Kuschnig, R.; Moffat, A.; Popowicz, A.; Pablo, H.; Wade, G.A.; Weiss, W.W.; Zwintz, K. Photometry of β Lyrae in 2018 by the BRITE satellites. Astrophys. J. 2019, 158, 148. [Google Scholar] [CrossRef]
- Kelly, B.; Bechtold, J.; Siemiginowska, A. Are the Variations in Quasar Optical Flux Driven by Thermal Fluctuations? Astrophys. J. 2009, 698, 895. [Google Scholar] [CrossRef]
- Zu, Y.; Kochanek, C.; Kozlowski, S.; Udalski, A. Is Quasar Optical Variability a Damped Random Walk? Astrophys. J. 2013, 765, 106. [Google Scholar] [CrossRef]
- Aerts, C.; Mathis, S.; Rogers, T. Angular Momentum Transport in Stellar Interiors. Annu. Rev. Astron. Astrophys. 2019, 57, 35–78. [Google Scholar] [CrossRef] [Green Version]
- Kallinger, T.; Weiss, W.; Beck, P.; Pigulski, A.; Kuschnig, R.; Tkachenko, A.; Pakhomov, Y.; Ryabchikova, T.; Lüftinger, T.; Palle, P.L.; et al. Triple system HD 201433 with a SPB star component seen by BRITE-Constellation: Pulsation, differential rotation, and angular momentum transfer. Astron. Astrophys. 2017, 603, 13. [Google Scholar] [CrossRef] [Green Version]
- Paxton, B.; Bildsten, L.; Dotter, A.; Herwig, F.; Lesaffre, P.; Timmes, F. Modules for Experiments in Stellar Astrophysics (MESA). Astrophys. J. Suppl. Ser. 2011, 192, 3. [Google Scholar] [CrossRef]
- Paxton, B.; Cantiello, M.; Arras, P.; Bildsten, L.; Brown, E.; Dotter, A.; Mankovich, C.; Montgomery, M.H.; Stello, D.; Timmes, F.X.; et al. Modules for Experiments in Stellar Astrophysics (MESA): Planets, Oscillations, Rotation, and Massive Stars. Astrophys. J. Suppl. Ser. 2013, 208, 4. [Google Scholar] [CrossRef] [Green Version]
- Lous, M.; Weenk, E.; Kenworthy, M.; Zwintz, K.; Kuschnig, R. A search for transiting planets in the β Pictoris system. Astron. Astrophys. 2018, 615, 145. [Google Scholar] [CrossRef] [Green Version]
- Kenworthy, M.; Mellon, S.; Bailey, J.; Stuik, R.; Dorval, P.; Talens, G.J.J.; Crawford, S.R.; Mamajek, E.E.; Laginja, I.; Ireland, M.; et al. The β Pictoris b Hill sphere transit campaign. Paper I: Photometric limits to dust and rings. Astron. Astrophys. 2021, 648, 15. [Google Scholar] [CrossRef]
- Zwintz, K.; Reese, D.; Neiner, C.; Pigulski, A.; Kuschnig, R.; Müllner, M.; Zieba, S.; Abe, L.; Guillot, T.; Handler, G.; et al. Revisiting the pulsational characteristics of the exoplanet host star β Pictoris. Astron. Astrophys. 2019, 678, 28. [Google Scholar] [CrossRef] [Green Version]
- Kurtz, D.; Cropper, M. The Discovery of 6.8 Minute Oscillations in α Cir. IBVS 1981, 1987, 1–3. [Google Scholar]
- Holdsworth, D.; Brunsden, E. SALT HRS Capabilities for Time Resolved Pulsation Analysis: A Test with the roAp Star α Circini. Publ. Astron. Soc. Pac. 2020, 132, 105001. [Google Scholar] [CrossRef]
- Weiss, W.; Froehlich, H.; Pigulski, A.; Popowicz, A.; Huber, D.; Kuschnig, R.; Moffat, A.F.J.; Matthews, J.M.; Saio, H.; Schwarzenberg-Czerny, A.; et al. The roAp star α Circinus as seen by BRITE-Constellation. Astron. Astrophys. 2016, 588, 54. [Google Scholar] [CrossRef]
- Weiss, W.W.; Froehlich, H.-E.; Kallinger, T.; Kuschnig, R.; Popowicz, A.; Baade, D.; Buzasi, D.; Handler, G.; Kochukhov, O.; Koudelka, O.; et al. New BRITE-Constellation observations of the roAp star α Cir. Astron. Astrophys. 2020, 642, 64. [Google Scholar] [CrossRef]
- Zwintz, K.; Neiner, C.; Kochukhov, O.; Ryabchikova, T.; Pigulski, A.; Müllner, M.; Steindl, T.; Kuschnig, R.; Handler, G.; Moffat, A.F.J.; et al. β Cas: The first δ Scuti star with a dynamo magnetic field. Astron. Astrophys. 2020, 643, 110. [Google Scholar] [CrossRef]
- Lampens, P.; Tkachenko, A.; Lehmann, H.; Debosscher, J.; Aerts, C.; Beck, P.G.; Bloemen, S.; Kochiashvili, N.; Derekas, A.; Smith, J.C.; et al. Low-frequency variations of unknown origin in the Kepler δ Scuti star KIC 5988140 = HD 188774. Astron. Astrophys. 2013, 549, 104. [Google Scholar] [CrossRef] [Green Version]
- Neiner, C.; Wade, G.; Sikora, J. Discovery of a magnetic field in the δ Scuti F2m star ρ Pup. Mon. Not. R. Astron. Soc. 2017, 468, 46–49. [Google Scholar] [CrossRef] [Green Version]
- Thomson-Paressant, K.; Neiner, C.; Zwintz, K.; Escorza, A. The complex fossil magnetic field of the δ Scuti star HD 41641. Mon. Not. R. Astron. Soc. 2021, 500, 1992–1999. [Google Scholar] [CrossRef]
- Strassmeier, K.; Granzer, T.; Weber, M.; Kuschnig, R.; Pigulski, A.; Popowicz, A.; Moffat, A.F.J.; Wade, G.A.; Zwintz, K.; Handler, G. BRITE photometry and STELLA spectroscopy of bright stars in Auriga: Rotation, pulsation, orbits, and eclipses. Astron. Astrophys. 2020, 644, 104. [Google Scholar] [CrossRef]
- Kallinger, T.; Beck, P.; Hekker, S.; Huber, D.; Kuschnig, R.; Rockenbauer, M.; Winter, P.M.; Weiss, W.W.; Handler, G.; Moffat, A.F.J.; et al. Stellar masses from granulation and oscillations of 23 bright red giants observed by BRITE-Constellation. Astron. Astrophys. 2019, 624, 35. [Google Scholar] [CrossRef] [Green Version]
- Kallinger, T.; Hekker, S.; Garcia, R.; Huber, D.; Matthews, J. Precise stellar surface gravities from the time scales of convectively driven brightness variations. Sci. Adv. 2016, 2, e1500654. [Google Scholar] [CrossRef] [Green Version]
- Chaplin, W.; Miglio, A. Asteroseismology of Solar-Type and Red-Giant Stars. Annu. Rev. Astron. Astrophys. 2013, 51, 353. [Google Scholar] [CrossRef] [Green Version]
- Atwood, W.; Abdo, A.; Ackermann, M.; Anderson, B.; Axelsson, M.; Axelsson, M.; Baldini, L.; Ballet, J.; Band, D.L.; Barbiellini, G.; et al. The Large Area Telescope on the Fermi Gamma-ray Space Telescope Mission. Astrophys. J. 2009, 697, 1071. [Google Scholar] [CrossRef] [Green Version]
- Aydi, E.; Sokolovsky, K.; Chomiuk, L.; Steinberg, E.; Li, K.; Vurm, I.; Metzger, B.D.; Strader, J.; Mukai, K.; Pejcha, O.; et al. Direct evidence for shock-powered optical emission in a nova. Nat. Astron. 2020, 4, 776–780. [Google Scholar] [CrossRef] [Green Version]
- Metzger, B.; Hascoët, R.; Vurm, I.; Beloborodov, A.; Chomiuk, L.; Sokoloski, J.L.; Nelson, T. Shocks in nova outflows—I. Thermal emission. Mon. Not. R. Astron. Soc. 2014, 442, 713–731. [Google Scholar] [CrossRef] [Green Version]
- Hounsell, R.; Darnley, M.; Bode, M.; Harman, D.; Surina, F.; Starrfield, S.; Holdsworth, D.L.; Bewsher, D.; Hick, P.P.; Jackson, B.V.; et al. Nova Light Curves From The Solar Mass Ejection Imager (SMEI)—II. The extended catalog. Astrophys. J. 2016, 820, 104. [Google Scholar] [CrossRef] [Green Version]
- Aydi, E.; Chomiuk, L.; Izzo, L.; Harvey, E.; Leahy-McGregor, J.; Strader, J.; Buckley, D.A.H.; Sokolovsky, K.V.; Kawash, A.; Kochanek, C.S.; et al. Early Spectral Evolution of Classical Novae: Consistent Evidence for Multiple Distinct Outflows. Astrophys. J. 2020, 905, 62. [Google Scholar] [CrossRef]


| Owner | Name | Filter | ID | Launch Date | Orbit (km) | Period (min) |
|---|---|---|---|---|---|---|
| Austria | UniBRITE | red | UBr | 25 Feb. 2013 | 100.37 | |
| BRITE-Austria | blue | BAb | 25 Feb. 2013 | 100.36 | ||
| Poland | BRITE-Heweliusz | red | BHr | 19 Aug. 2014 | 97.10 | |
| BRITE-Lem | blue | BLb | 21 Nov. 2013 | 99.57 | ||
| Canada | BRITE-Toronto | red | BTr | 19 June 2014 | 98.24 | |
| BRITE-Montréal | blue | 19 June 2014 | n/a |
Publisher’s Note: MDPI stays neutral with regard to jurisdictional claims in published maps and institutional affiliations. |
© 2021 by the authors. Licensee MDPI, Basel, Switzerland. This article is an open access article distributed under the terms and conditions of the Creative Commons Attribution (CC BY) license (https://creativecommons.org/licenses/by/4.0/).
Share and Cite
Weiss, W.W.; Zwintz, K.; Kuschnig, R.; Handler, G.; Moffat, A.F.J.; Baade, D.; Bowman, D.M.; Granzer, T.; Kallinger, T.; Koudelka, O.F.; et al. Space Photometry with Brite-Constellation. Universe 2021, 7, 199. https://doi.org/10.3390/universe7060199
Weiss WW, Zwintz K, Kuschnig R, Handler G, Moffat AFJ, Baade D, Bowman DM, Granzer T, Kallinger T, Koudelka OF, et al. Space Photometry with Brite-Constellation. Universe. 2021; 7(6):199. https://doi.org/10.3390/universe7060199
Chicago/Turabian StyleWeiss, Werner W., Konstanze Zwintz, Rainer Kuschnig, Gerald Handler, Anthony F. J. Moffat, Dietrich Baade, Dominic M. Bowman, Thomas Granzer, Thomas Kallinger, Otto F. Koudelka, and et al. 2021. "Space Photometry with Brite-Constellation" Universe 7, no. 6: 199. https://doi.org/10.3390/universe7060199