Article

RNA-Seq-Based Transcriptome Analysis of Aflatoxigenic Aspergillus flavus in Response to Water Activity

1
Key Laboratory of Pathogenic Fungi and Mycotoxins of Fujian Province, Key Laboratory of Biopesticide and Chemical Biology of the Education Ministry, and School of Life Sciences, Fujian Agriculture and Forestry University, Fuzhou 350002, China
2
Shenzhen Key Laboratory of Bioenergy, BGI-Shenzhen, Shenzhen 518083, China
*
Author to whom correspondence should be addressed.
These authors contributed equally to this work.
Toxins 2014, 6(11), 3187-3207; https://doi.org/10.3390/toxins6113187
Submission received: 24 September 2014 / Revised: 27 October 2014 / Accepted: 13 November 2014 / Published: 21 November 2014

Abstract

:
Aspergillus flavus is one of the most important producers of carcinogenic aflatoxins in crops, and the effect of water activity (aw) on growth and aflatoxin production of A. flavus has been previously studied. Here we found the strains under 0.93 aw exhibited decreased conidiation and aflatoxin biosynthesis compared to that under 0.99 aw. When RNA-Seq was used to delineate gene expression profile under different water activities, 23,320 non-redundant unigenes, with an average length of 1297 bp, were yielded. By database comparisons, 19,838 unigenes were matched well (e-value < 10−5) with known gene sequences, and another 6767 novel unigenes were obtained by comparison to the current genome annotation of A. flavus. Based on the RPKM equation, 5362 differentially expressed unigenes (with |log2Ratio| ≥ 1) were identified between 0.99 aw and 0.93 aw treatments, including 3156 up-regulated and 2206 down-regulated unigenes, suggesting that A. flavus underwent an extensive transcriptome response during water activity variation. Furthermore, we found that the expression of 16 aflatoxin producing-related genes decreased obviously when water activity decreased, and the expression of 11 development-related genes increased after 0.99 aw treatment. Our data corroborate a model where water activity affects aflatoxin biosynthesis through increasing the expression of aflatoxin producing-related genes and regulating development-related genes.

1. Introduction

Aspergillus flavus, a widely distributed saprophyte, is the second leading cause of aspergillosis infection in humans and is the leading agent of chronic sinonasal infection in immunocompetent patients [1]. A. flavus, which is also an important soil fungus producing highly carcinogenic aflatoxins (AFs), causes damage to different seedcrops, such as corn, cotton, peanuts and tree nuts, both before and after harvest. [2,3]. Structurally, the aflatoxins are highly substituted coumarins that contain a fused dihydrofurofuran moiety. The major AFs of concern in nature are designated as B1, B2, G1, and G2 [4]. However, among them, AFB1 is considered the most predominant, most toxic and most potent hepatocarcinogenic natural compound ever characterized [5]. It has been previously reported that AFB1 is produced by strains of A. flavus isolated from the corneal material of patients, commodities, and soils [6,7,8]. Mapping of overlapping cosmid clones of A. flavus genomic DNA established that the genes in the aflatoxin biosynthetic pathway are clustered and consist of 25 genes spanning approximately 70 kb [9]. Among them, Schmidt-Heydt et al. [10] clearly reported that the ratio of aflR vs. aflS affected aflatoxin pathway gene expression.
AF biosynthesis is regulated by many factors, one of which is environmental cues, including temperature, water activity and pH [11,12]. Although fungal growth is influenced by several environmental factors, the major etiological determinants of fungal growth and mycotoxin production are water activity (aw) and temperature [13,14]. Although many reports have profiled the transcriptomes of fungi under different temperatures, no report has yet addressed transcriptome analysis for fungi under water stress [15]. The aw is a measure of the amount of freely available water in an environment for microbial growth and is related to pure water, which has an aw of 100 percent relative moisture [16]. In a recent study, the influence of temperature and water activity on aflatoxin gene expression and phenotypic production of A. flavus was analyzed, and it could be demonstrated that aw was the leading parameter [17]. More freely available water induced more sporulation and better growth for A. flavus, as well as for other Aspergillus species, such as A. niger [18]. This phenomenon has been reported in the recent increasing number of studies dealing with the effect of water activity on microbial growth [14,17]. However, there are only a few studies reporting on the impact of water activity on A. flavus growth and toxin production using a sys tems approach [16].
Very recently, RNA sequencing (RNA-Seq), a high-throughput and high-resolution sequencing technology, has achieved widespread consideration as a revolutionary tool for transcriptomics study [15,19]. In this study, the RNA-Seq approach was adopted to provide a comprehensive view of the A. flavus transcriptome as well as specific data regarding differentially expressed genes between 0.93 aw and 0.99 aw. This work improves the understanding of the effect of water activity on development and aflatoxin biosynthesis of A. flavus at the transcriptome level. These findings are significant for predicting the impact of climate change on aflatoxin production, which might be used to improve food safety and to develop specific approaches to control such carcinogenic natural metabolites in the food chain.

2. Materials and Methods

2.1. Fungal Strains and Growth Conditions

The A. flavus NRRL 3357 was kindly provided by Zhumei He (Sun Yat-sen University, Guangzhou, China). The strains were inoculated in YES medium (20 g yeast extract, 150 g sucrose, 1 g MgSO4·7H2O, 1 L). Spores from a 7-day-old culture grown at 37 °C were dislodged with a sterile loop and placed into 10 mL of sterile water +0.05% DMSO in a 25 mL universal bottle. The spores were counted, and a 106 spore mL−1 concentration was prepared. The agar medium was modified with glycerol to adjust the water availability to 0.93 aw and 0.99 aw, and the following amounts were used per liter (108 mL, 0.99; 24.5 mL, 0.93) [17]. The 9 cm Petri plates containing media treatments were all overlaid with sterile 8.5 cm disc cellophanes and then centrally inoculated with a 10-μL-spore suspension. Replicates (five per treatment) were incubated at 28 °C.

2.2. Growth Assessment and Aflatoxin Analysis

After incubation at a different aw level, the colony morphology was observed after 5 days. For quantitative comparison of conidia production, conidia were washed off the agar plates using 0.05% DMSO solution and counted on a hemocytometer. Quantitative determination of aflatoxin B1 from fungal colonies was performed by TLC analysis. For this purpose, the biomass was removed from the cellophane surface for aflatoxin extraction. Extraction was performed using 40 mL of chloroform (twice with 20 mL each), and then the chloroform phase was filtered through filter paper and concentrated to dryness under 50 °C in an incubator. The residue was redissolved in 20 μL of methanol, and 10 μL of this solution was spotted and developed on a Si250 silica gel plate (Haiyang, Qingdao, China) with a solvent system of chloroform/acetone (90:10, v/v) [20]. Aflatoxin production was measured in micrograms per gram of culture biomass.

2.3. cDNA Preparation and Illumina Sequencing

Five day-old mycelium was removed from the cellophane surface for isolation of RNA, and cDNA was prepared according to a protocol with some modifications [21]. Genomic DNA was digested using DNase (New England Biolabs, Beijing, China), and total RNA was isolated using TRIzol reagent (Invitrogen, Shanghai, China). A Nano Drop 2000 and Agilent 2100 were used to evaluate the quality of RNA. After total RNA extraction and DNase I treatment, magnetic beads with oligo (dT) were used to isolate mRNA. Mixed with the fragmentation buffer, the mRNA was cleaved into short fragments. Then cDNA was synthesized using the mRNA fragments as templates. Short fragments were purified and resolved with elution buffer for end reparation and single nucleotide adenine addition. After that, the short fragments were connected with adapters. The suitable fragments were selected as templates for PCR amplification. During the QC steps, Agilent 2100 Bioanaylzer and ABI StepOnePlus Real-Time PCR System were used in quantification and qualification of the sample library. Lastly, the library was sequenced using an IlluminaHiSeqTM 2000.

2.4. Clean Reads and Sequence Assembly

Raw reads were filtered to remove adaptors, reads with more than 5% unknown nucleotides, and other low quality reads. After QC filtering, the following analysis was performed. Transcriptome de novo assembly was conducted with the short-reads assembly program Trinity. Trinity, including three independent software modules, Inchworm, Chrysalis, and Butterfly, was applied sequentially to process large volumes of RNA-seq reads. Trinity partitions the sequence data into many individual de Bruijn graphs, which represent the transcriptional complexity at a given gene or locus. Then, each graph was independently processed to extract full-length splicing isoforms and to tease apart transcripts derived from paralogous genes. The result sequences from Trinity are called unigenes.

2.5. Annotation and Analysis of Unigenes

BLASTx alignment (e-value < 10−5) between unigenes and protein databases, including Nr, Swiss-Prot, KEGG, and COG, was performed, and the best alignment results were used to decide sequence direction of unigenes. If results of different databases conflicted with each other, a priority order of Nr, Swiss-Prot, KEGG, and COG was followed. When a unigene happened to be unaligned to none of the above databases, ESTScan (http://estscan.sourceforge.net) [22], a program that can detect coding regions in low-quality sequences, was introduced to decide its sequence direction. To obtain protein functional annotation, unigenes were aligned by BLASTx to protein databases (e-value < 10−5), and aligned by blastn to nucleotide databases nt (e-value < 10−5), retrieving proteins with the highest sequence similarity with the given unigenes. With Nr annotation, the Blast2GO program was used to obtain GO annotation of unigenes. After obtaining GO annotation for every unigene, WEGO software was used to perform GO functional classification for all unigenes and to understand the distribution of gene functions [23]. With the help of KEGG database, we could further study the genes’ biological complex behaviors, and using KEGG annotation we could obtain pathway annotation for unigenes.

2.6. Identification and Analysis of Differentially Expressed Genes

First, the RPKM method was used to calculate the expressed value of genes (Reads Per kb per Million reads). The RPKM method is able to eliminate the influence of different gene length and sequencing level on the calculation of gene expression. Therefore the calculated gene expression can be directly used for comparing the different expression between samples. Then, the p value was applied to determine differentially expressed unigenes. FDR (False Discovery Rate) control is a statistical method used in multiple hypothesis testing to correct for p-value. In our analysis, we choose those with FDR ≤ 0.001 and a ratio ≥ 2. Finally, differentially expressed genes (DEGs) were then subjected to GO functional analysis and KEGG pathway analysis.

2.7. Availability of Supporting Data

The raw Illumina sequencing dataset of Aspergillus flavus was submitted to the NCBI Sequence Read Archive under the accession number of SRP034649.

3. Results and Discussion

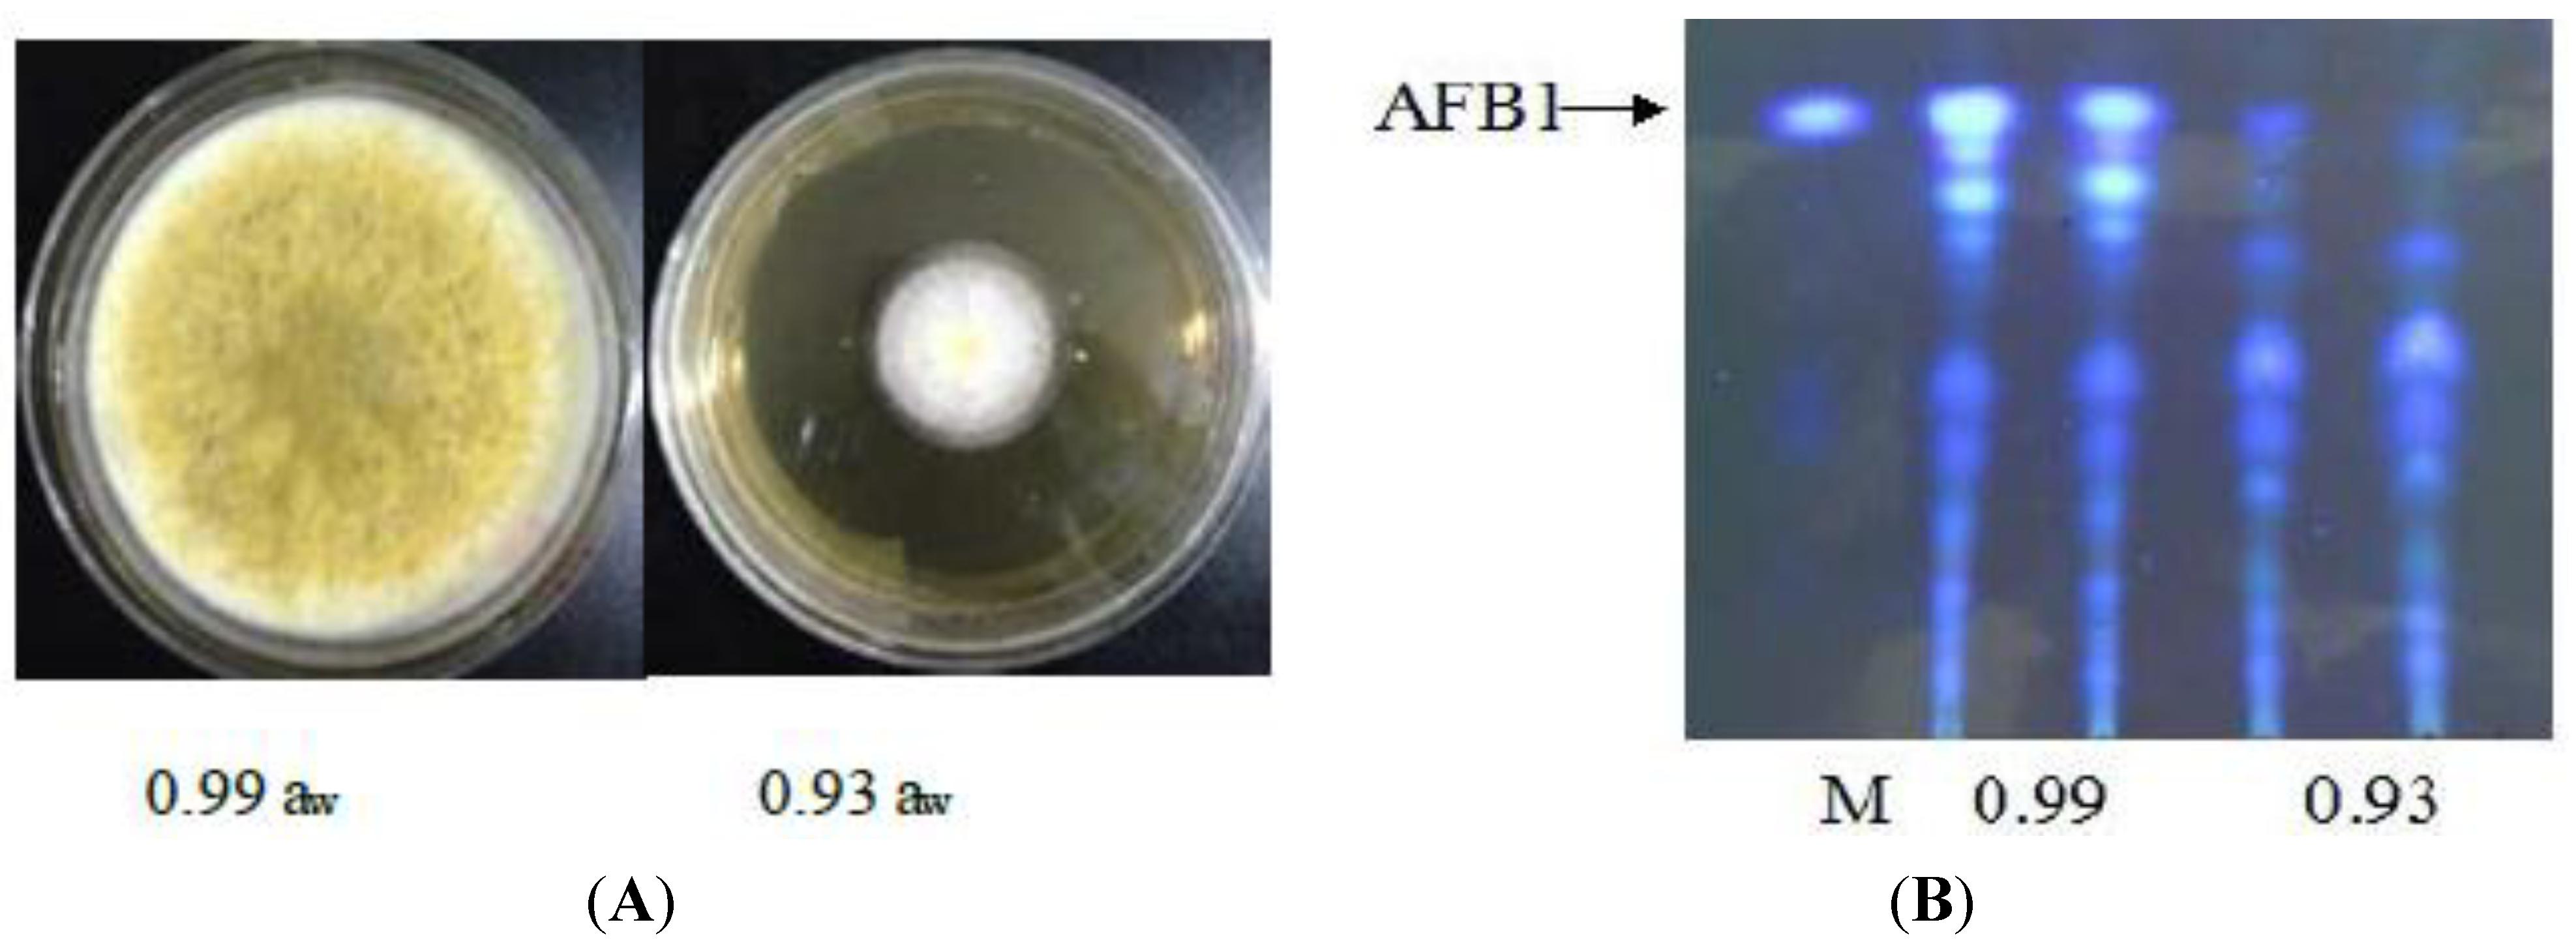
3.1. Effect of Water Activity on Growth and Aflatoxin Production of A. flavus

Growth and aflatoxin production by A. flavus at the phenotypic level was monitored in relation to changes in different treatments. As seen in Figure 1A, the colony diameter of strains at 0.93 aw was significantly smaller than that at 0.99 aw. When grown on YES plates at 37 °C, the strains under 0.93 aw exhibited decreased conidiation compared to that under 0.99 aw, and the strains under 0.93 aw displayed an approximately 16-fold conidia reduction compared with the strains under 0.99 aw (data not shown). As previously described, growth was highly influenced by water activity [24]. To identify the effect of different water activity on aflatoxin production, thin-layer chromatography analysis was performed with the standards of aflatoxin on the silica gel G plates, and the results are shown in Figure 1B. When aw was reduced, there was a sharply decrease in aflatoxin biosynthesis although the culture condition remained at 28 °C. Compared with that at 0.99 aw, aflatoxin production was very low, and only other extracted metabolites were observed at 0.93 aw. Our findings are consistent with a previous report that more aflatoxin was produced under 0.99 aw than under 0.93 aw [16]. The data indicates that aflatoxin production of A. flavus was obviously affected by water activity. This phenomenon may be due to complex regulation of the aflatoxin biosynthesis gene cluster of A. flavus in relation to various levels of water activity [17].
Figure 1. Effect of water activity on A. flavus growth and aflatoxin production. (A) Representative pictures of a colonial morphology from A. flavus at 0.99 aw (left) and at 0.93 aw (right). Strains were incubated at 37 °C for five days; (B) Extracts of the A. flavus grown for five days on YES medium. Extracts and aflatoxin standards were spotted onto silica gel TLC plates. The plates were visualized under 310-nm UV light.
Toxins 06 03187 g001

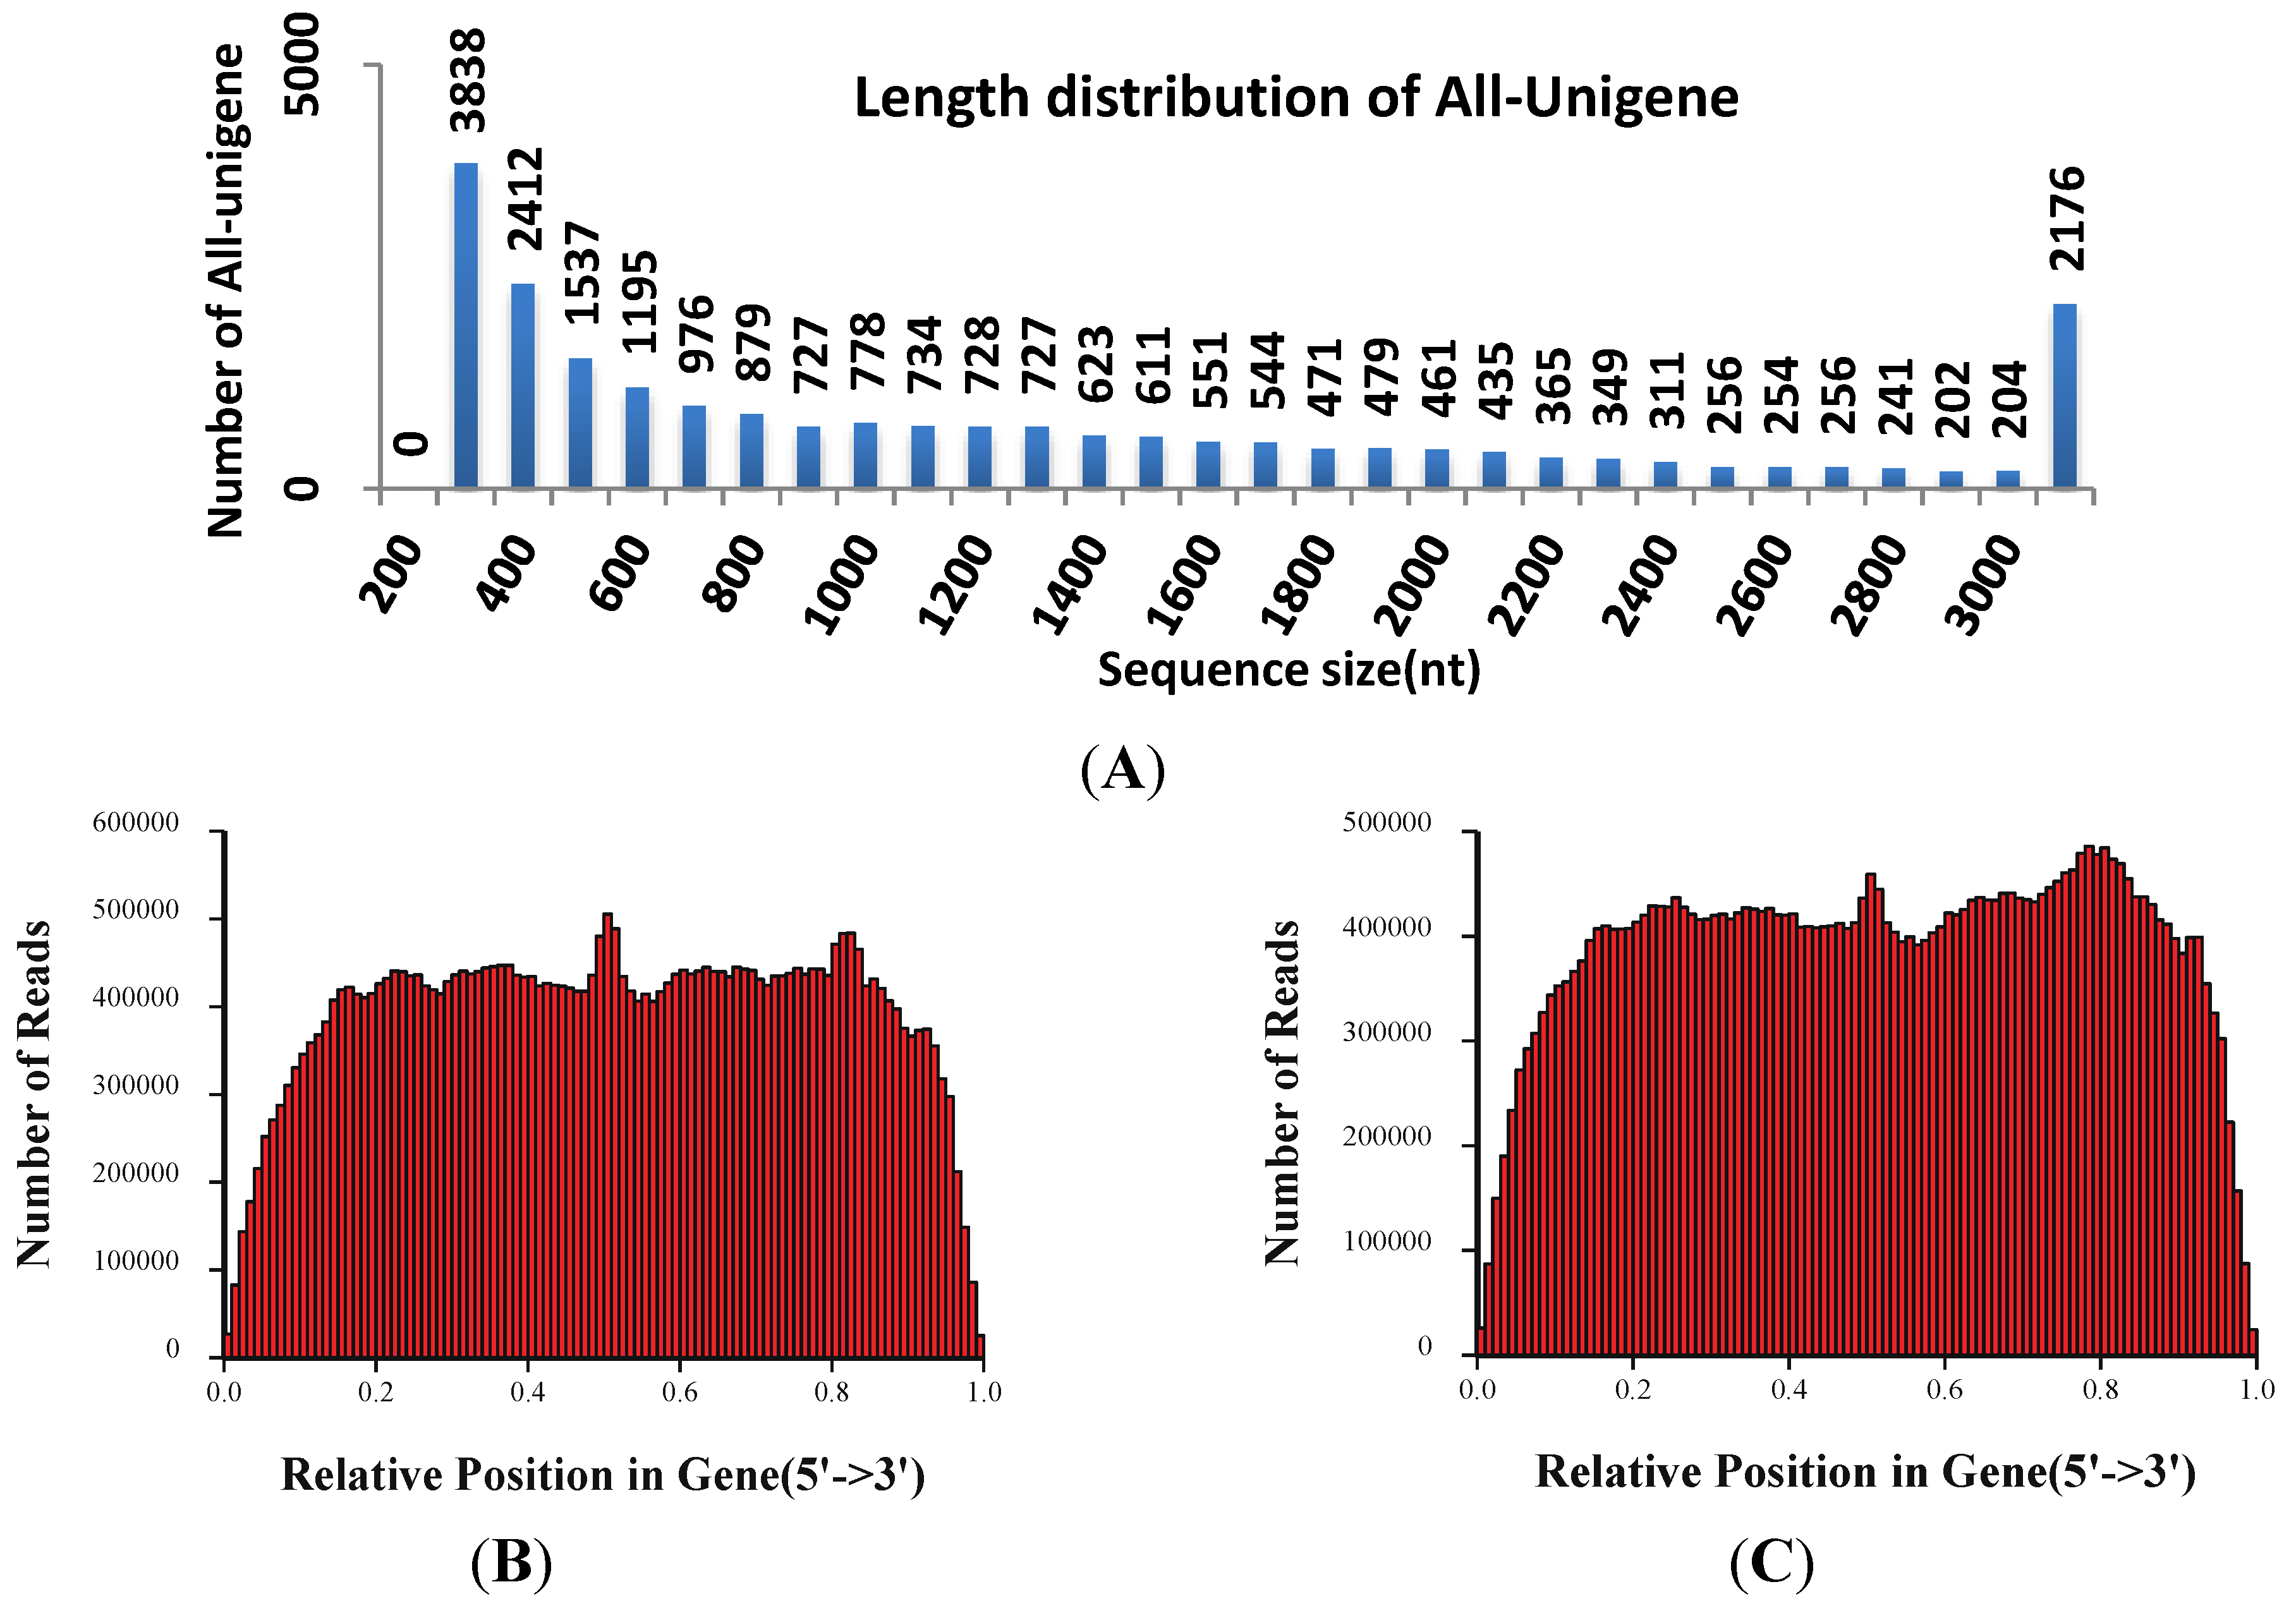
3.2. Illumina Sequencing and Reads Assembling

Two cDNA libraries were prepared at the fifth day and sequenced using the Illumina platform. Illumina sequencing generated a total of 41,004,372 reads (0.99 aw) and 40,712,492 reads (0.93 aw) that were 90 bp in length after stringent data cleaning and quality checks. The mean of Q20 percentage (proportion of nucleotides with quality value larger than 20 in reads), N percentage (proportion of unknown nucleotides in clean reads) and GC percentage are 96.54%, 0.00% and 52.96%, respectively. Trinity was used to assemble clean reads, producing a total of 60,039 contigs with a minor of N50 of 1623 nt (i.e., the median length of all unigenes) for A. flavus. After further processes of sequence splicing and redundancy removing, a total of 23,320 non-redundant unigenes were identified. Of these, 24,991 and 25,190 unigenes were generated from the 0.99 aw and 0.93 aw treatments, respectively (Table 1). The length distribution in Figure 2A indicated that 47.08% unigenes (total 10,978 unigenes) had a length > 1000 nt (mean 1297 nt).
To evaluate the quality of RNA-Seq data, several quality control analyses were performed. Firstly, the ratio of the gap length of assembled unigenes was assessed, and the results indicate that gap lengths were less than 5% of the total length. In addition, the total coverage of reads from the 5' to the 3' end of genes was examined, and it revealed that both the 0.99 aw and 0.93 aw RNA-Seq reads were evenly distributed with the exception of the very 5' and 3' ends (Figure 2B,C). Therefore, the assembled data are of high quality in current study. The Aspergillus genus are widely distributed molds in the environment, many of which are documented to cause human disease [25]. Some of the RNA-Seq data for Aspergillus has been published previously [26,27,28], and very recently, Chang et al. (2014) compared the different transcriptome profiles of A. flavus exposed and not exposed to decanal [29]. To our knowledge, this study was the first report on the complete transcriptome of Aspergillus in response to two different water activities using an Illumina paired-end sequencing strategy.
Table 1. Summary of RNA-Seq data sets.
CategoryTreatmentsTotal numberMean length (Nt)N50
Contigs0.93 aw29,4206631705
0.99 aw30,6196531623
Unigenes0.93 aw25,19010041740
0.99 aw24,99110731829

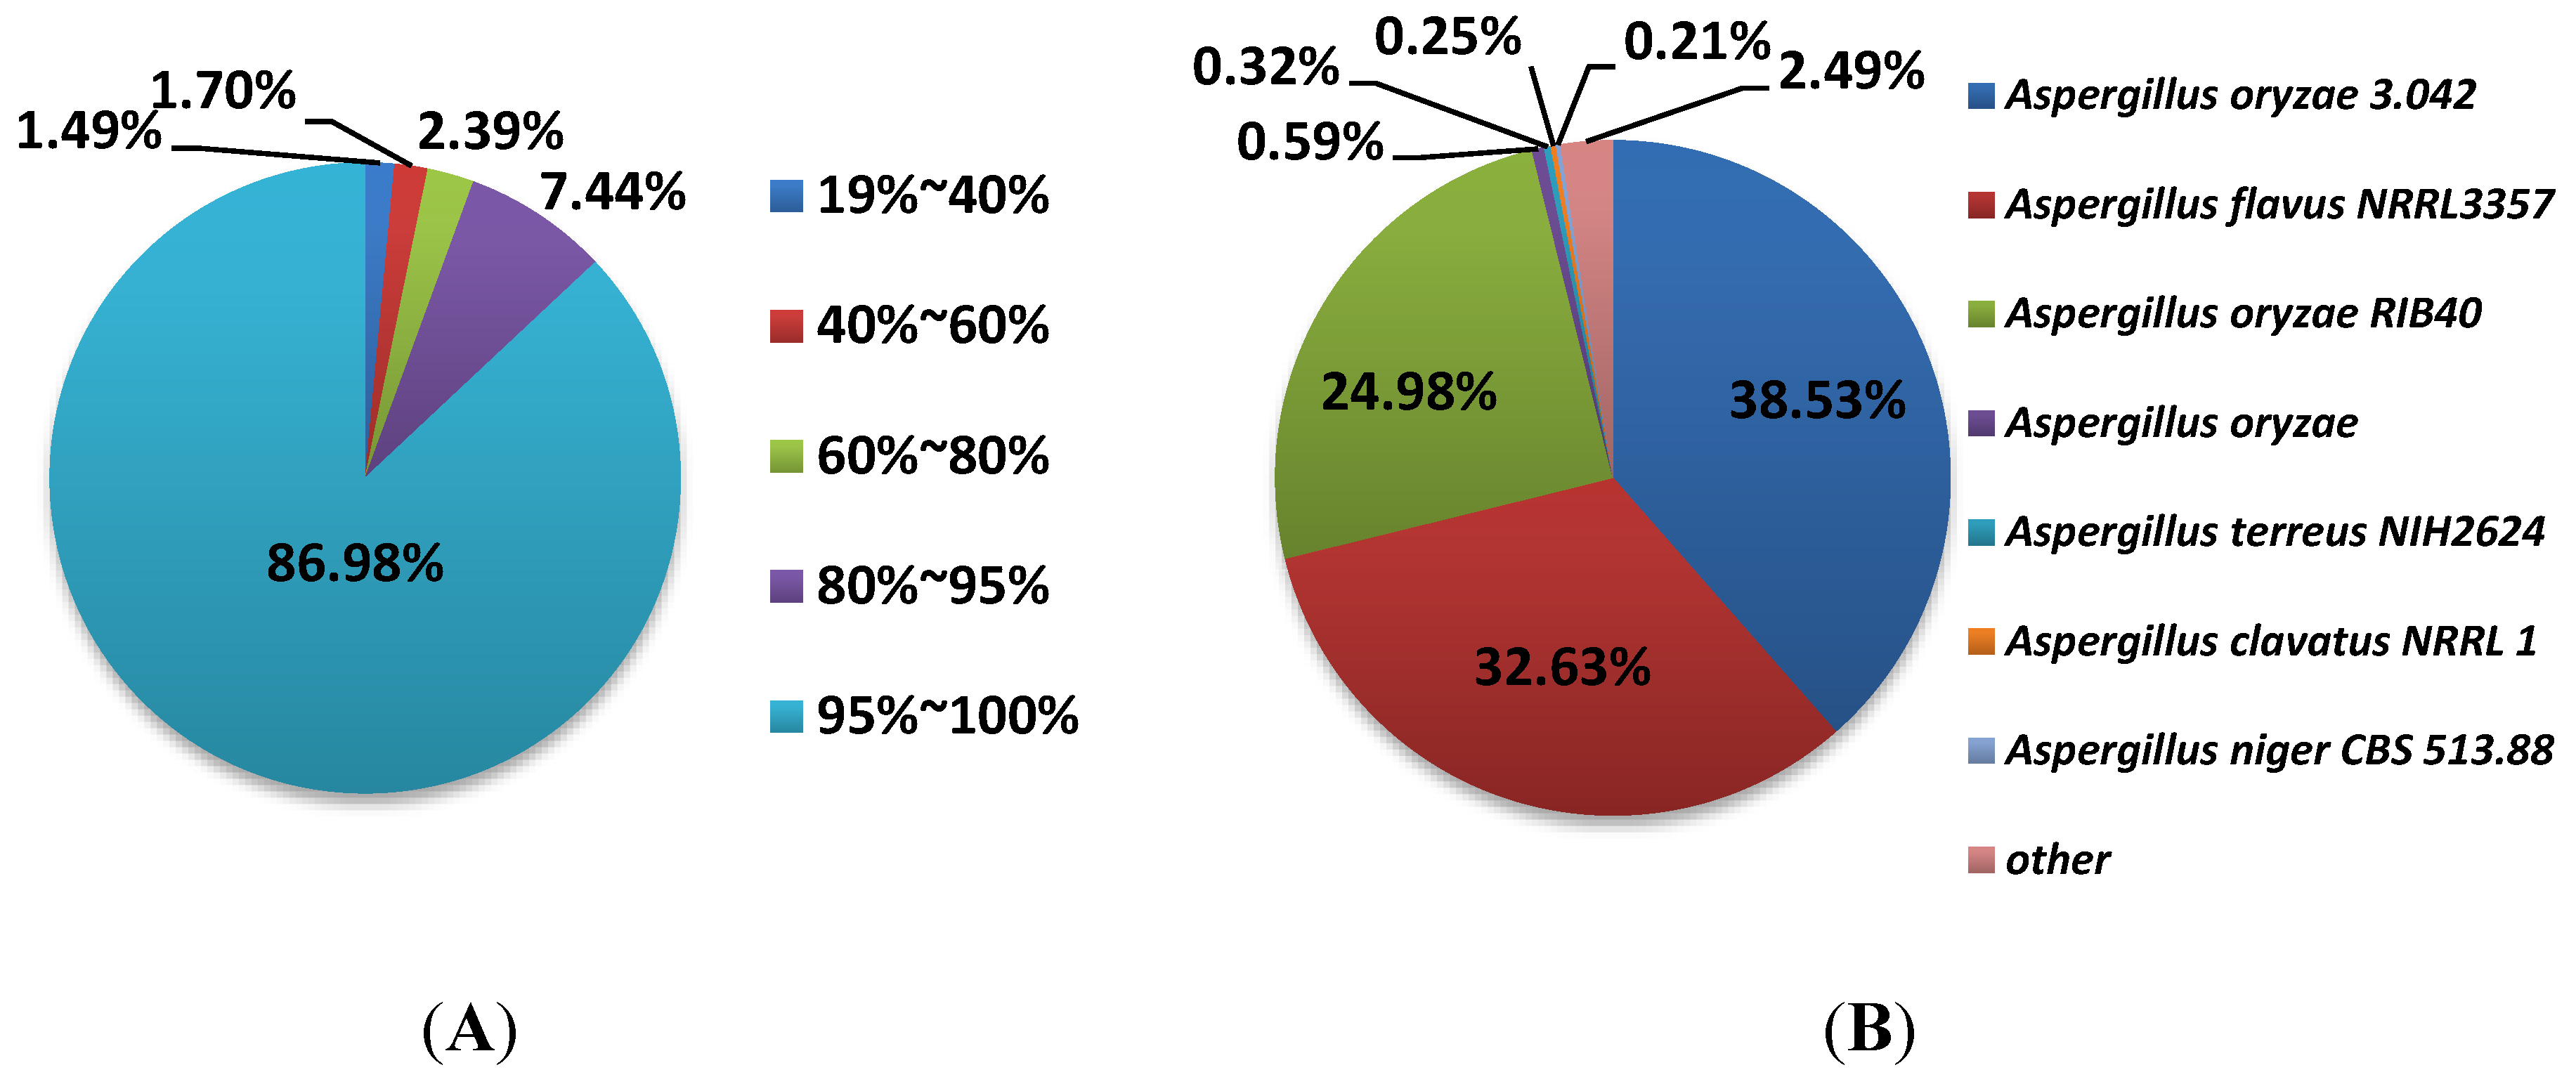
3.3. Annotation and Analysis of All-Unigenes

To understand the transcriptome of A. flavus, all unigenes were aligned against sequences from the NCBI non-redundant (nr) protein database by using the BLASTx algorithm with an e-value threshold of 10−5. BLASTx alignment analysis indicated that a total of 19,838 unigenes matched to known proteins in the Nr databases. Thus far, a total of 13,071 genes encoding proteins have already been annotated in the genome of A. flavus [30], whereas Lin et al. (2013) estimated that A. flavus has 14,510 genes by combining NCBI database with their RNA-Seq data [19]. However, the RNA-seq data presented in this work implies that more unigenes have the potential for translation into functional proteins, which serves to enrich the annotation of the A. flavus genome. A possible explanation for this phenomenon is posttranscriptional regulation, such as alternative splicing and RNA editing, enlarges their transcripts diversity [21]. Figure 3A,B show the similarity distribution of all unigenes in detail. The results indicate that 96.81% of all unigenes had an identification of more than 60% of the annotated genes. In a comparison with the nr database, we interestingly found that 38.5% of sequences matched to that of A. oryzae, but only 32.6% unigenes were well matched to that of A. flavus. However, Yu et al. (2008) found A. oryzae shared over 95% identity to A. flavus on the DNA level, and fewer than 300 genes were unique to each species [29].
Figure 2. Length distribution and quality-control analysis of RNA-Seq data. (A) Length distribution of assembled unigenes; The length of unigenes ranged from 100 bp to over 3000 bp. The total read coverage along the gene body from 5' to 3' end in 0.99 aw (B) and 0.93 aw (C).
Toxins 06 03187 g002

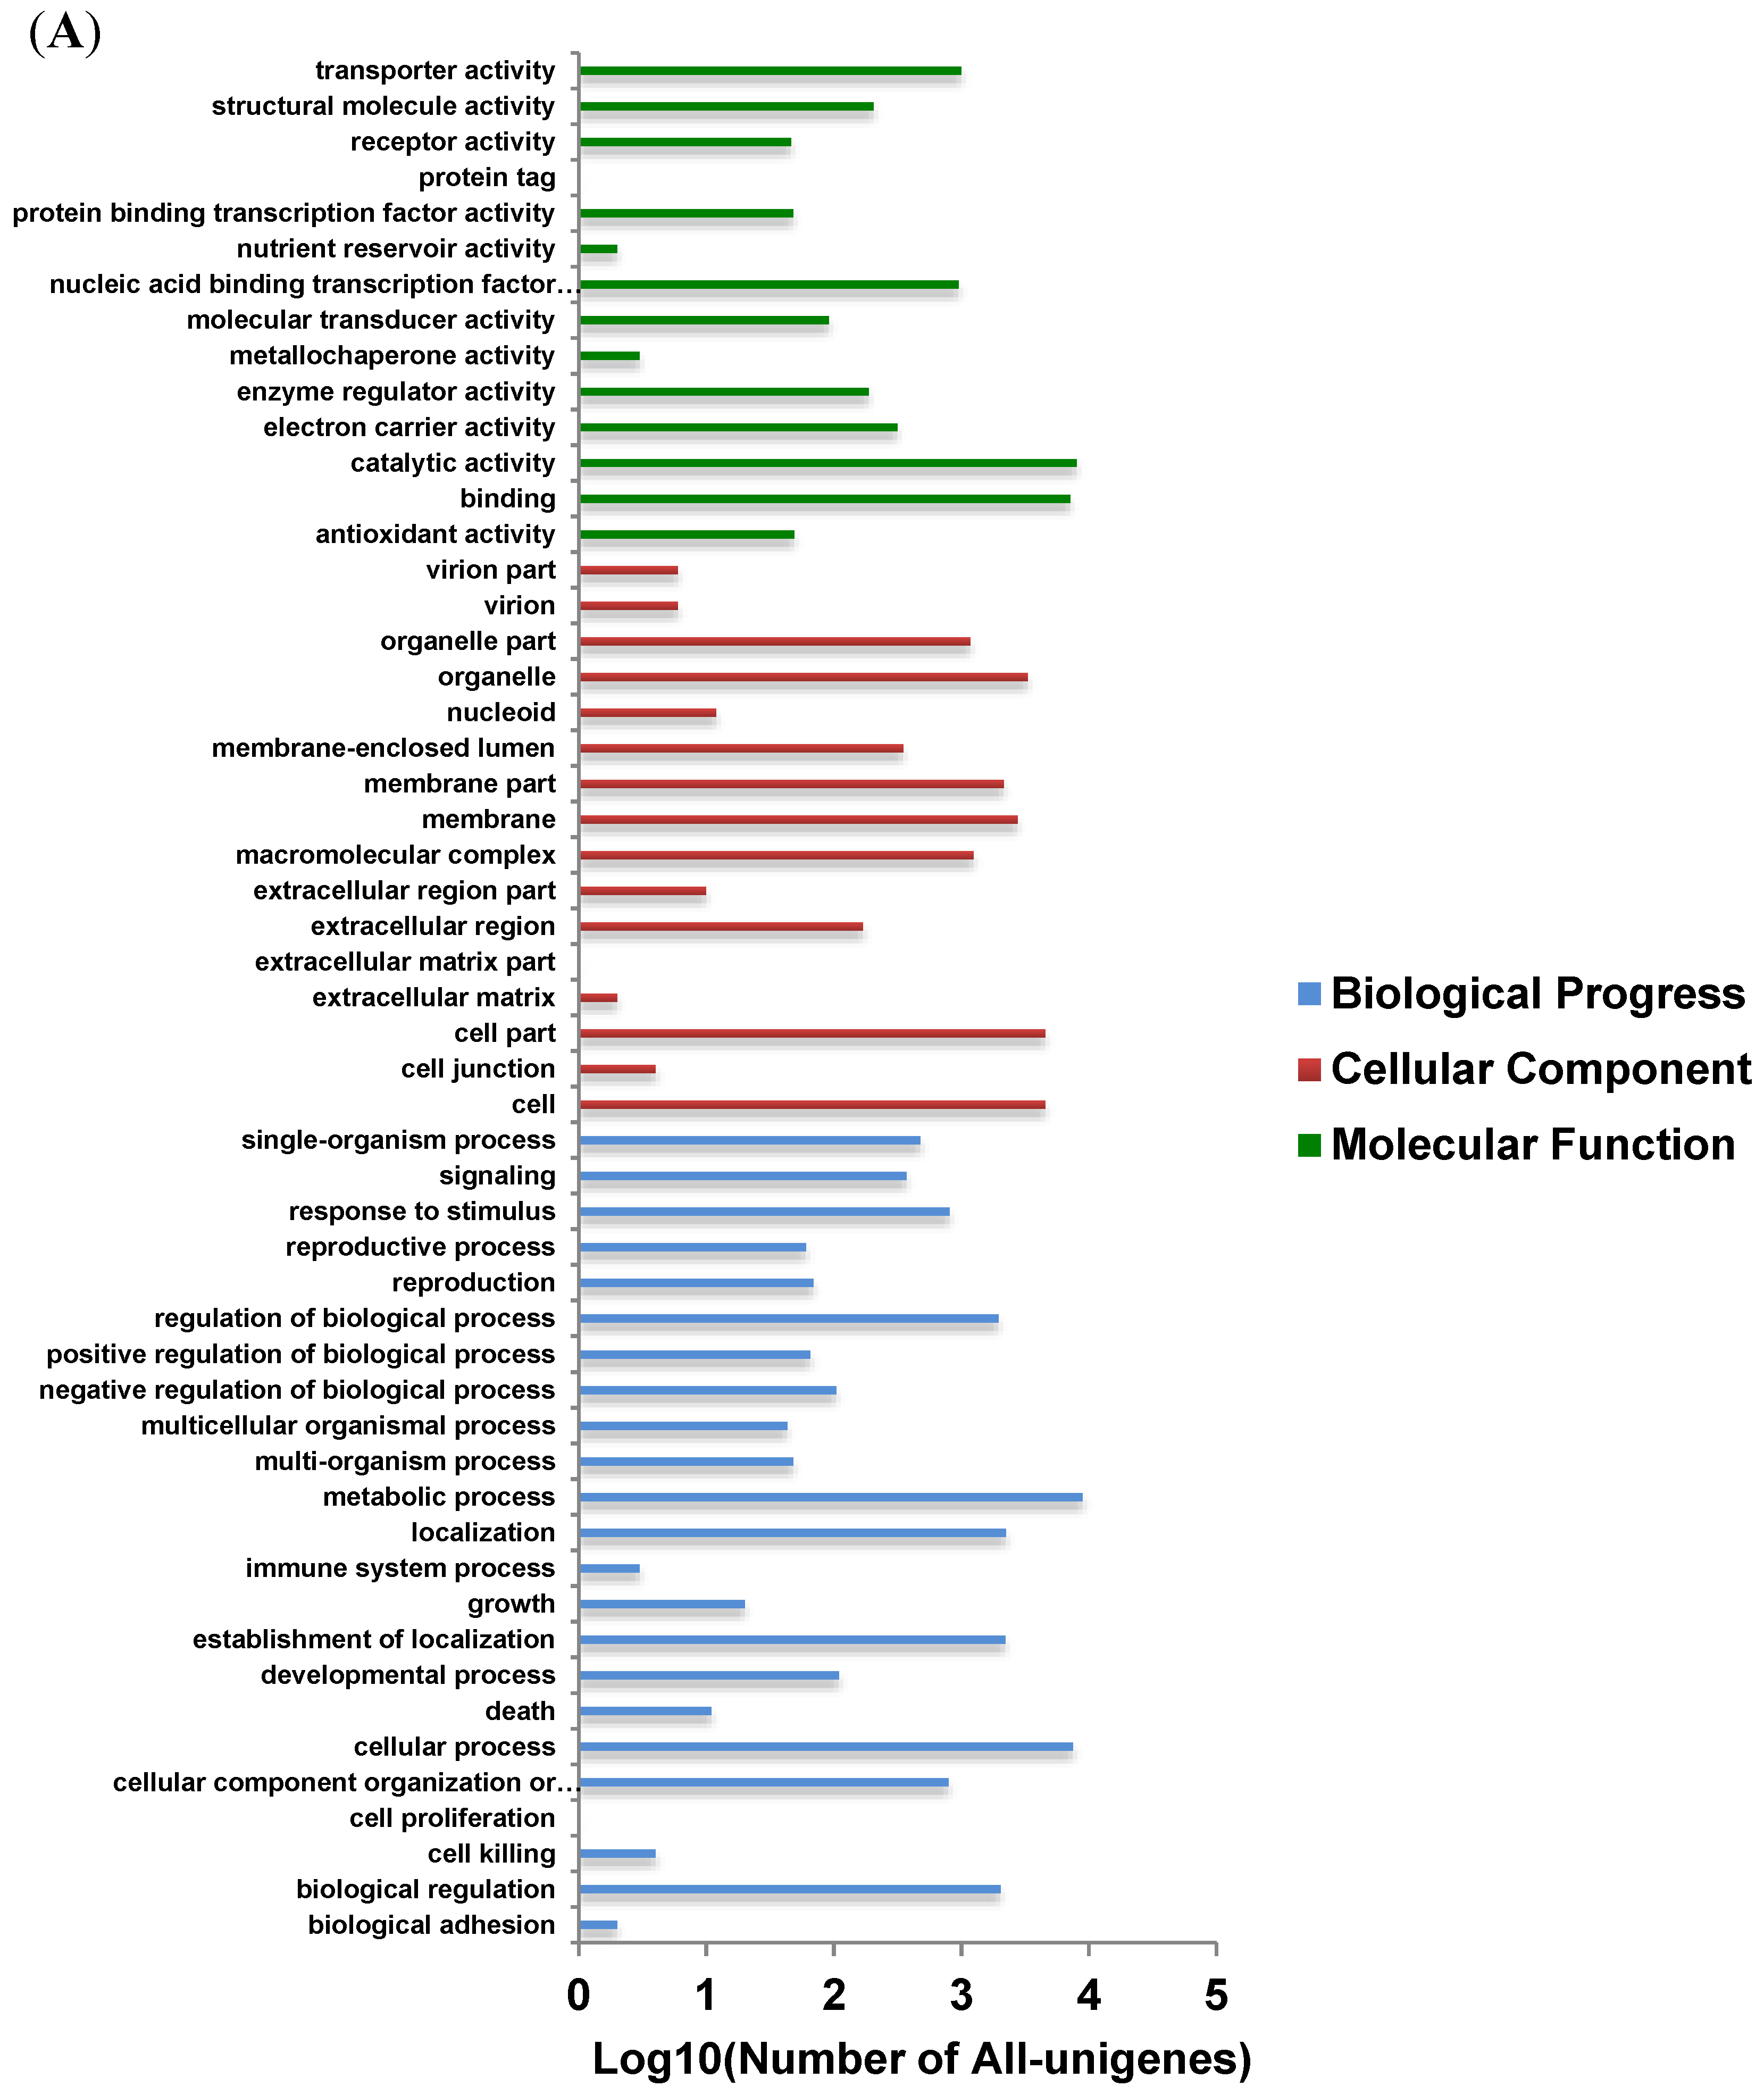
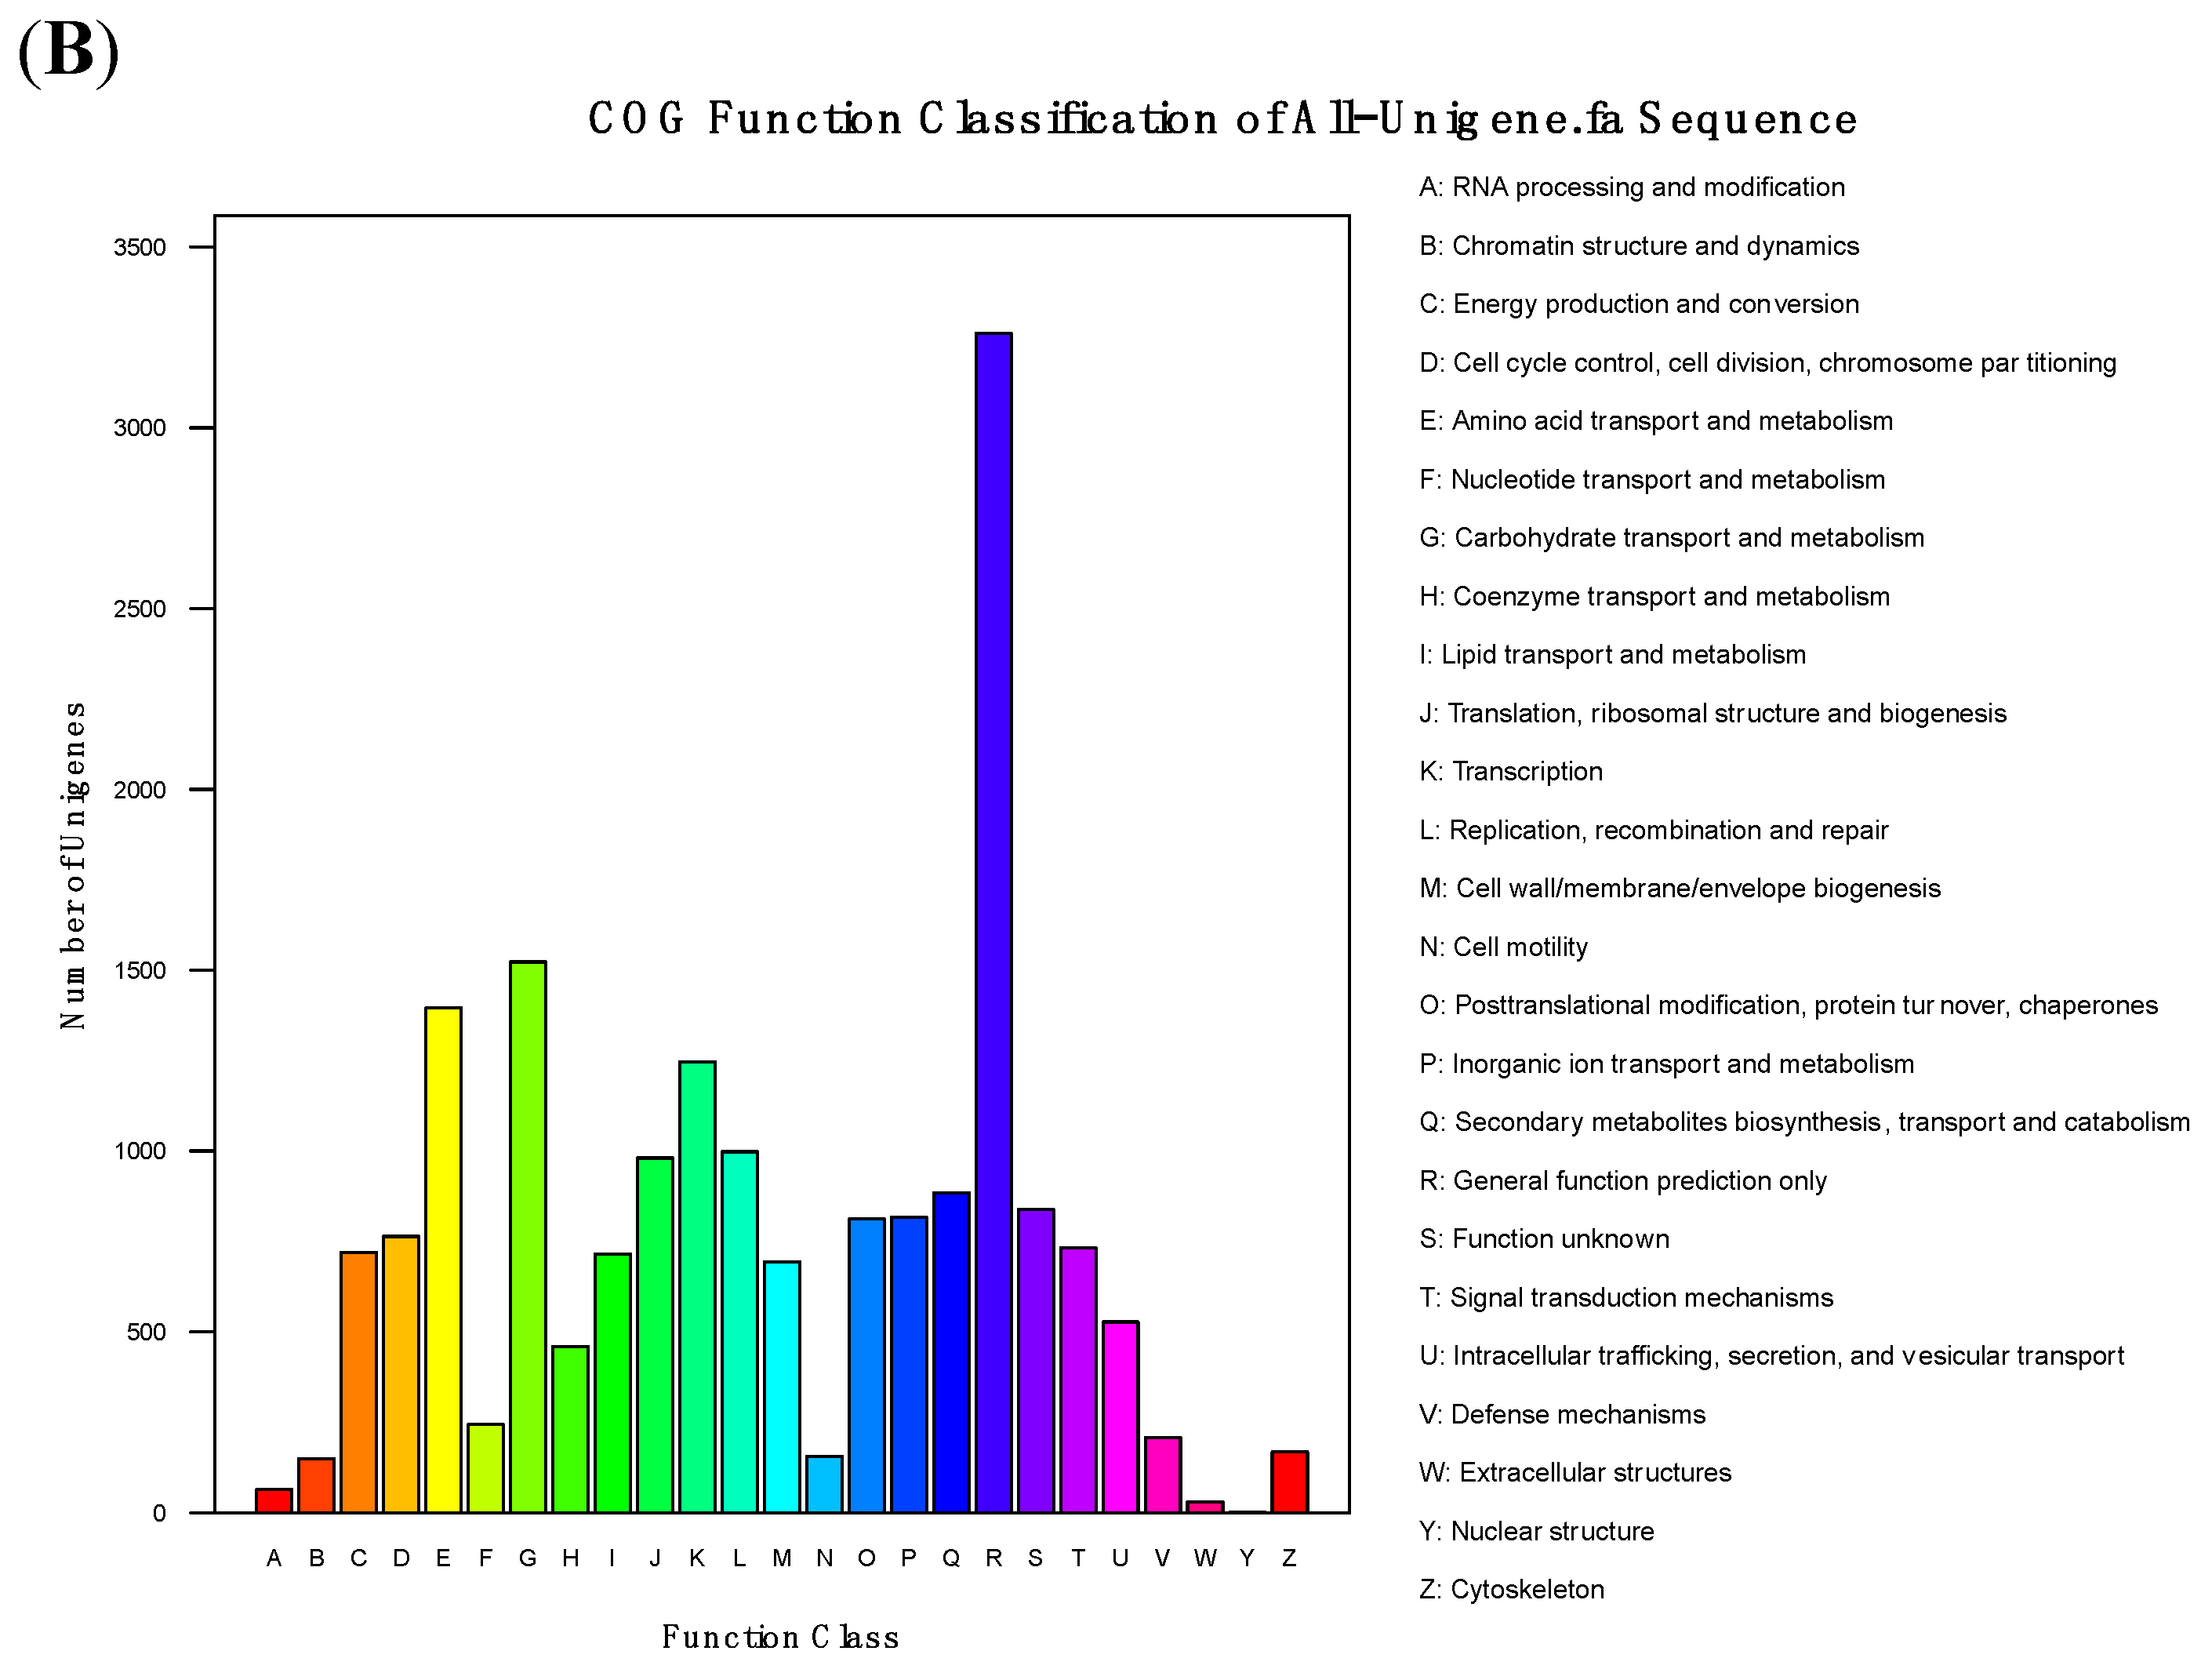
3.4. Functional Analysis and Classification of All-Unigenes

To deeply understand the transcriptome of A. flavus, GO (Gene Ontology) and COG (Clusters of Orthologous Groups of proteins) were applied to classify functions of the predicted all unigenes. A total of 13,342 unigenes were grouped to at least one GO term, and these unigenes were classified into three functional categories (Figure 4A). Sequences with GO terms corresponding to the “biological process” group were divided into 23 subcategories, “cellular component” into 16 subcategories and “molecular function” into 14 subcategories. As shown in Figure 4A, the largest subcategory found in the “biological process” group was “metabolic process” which comprised 32.1% of the unigenes in the subcategory. By applying COG platform, we obtained 18,394 sequences involved in COG classification, which were grouped into 25 categories (Figure 4B). Among the 25 COG categories, “general function prediction only” was the most populated group (17.72%) followed by “carbohydrate transport and metabolism” (8.27%) and “amino acid transport and metabolism” (7.59%).
Figure 3. Overview of all-unigene in the A. flavus transcriptome. (A) the similarity and (B) species distribution of all-unigene.
Toxins 06 03187 g003
Furthermore, the Kyoto Encyclopedia of Genes and Genomes (KEGG) database was used to identify the biological pathways in A. flavus. A total of 12,232 annotated unigenes were grouped to 108 KEGG pathways (Table S1). The pathways with the most representation among the unique sequences were involved in metabolic pathways (28.78%, 3520), biosynthesis of secondary metabolites (12.61%, 1543) and starch and sucrose metabolism (4.85%, 593). As expected, most unigenes belong to metabolic pathways because of their involvement in the maintenance of basic biological processes of A. flavus. The A. flavus genome sequence contains remarkable enzymatic genes associated with secondary metabolite synthesis [2,30], which intimates it has the capacity to express more unigenes for biosynthesis of secondary metabolites under specific conditions. It has been documented previously that A. flavus produces numerous hydrolyses [31], including α-amylase precursor, α-amylase A precursor, α-L-arabinofuranosidase precursor, β-galactosidase, catalase (A and B), glutaminase A and α-mannosidase, which are believed to be important for fungal utilization of starch-rich. These results are in full agreement with the KEGG annotations of the unigenes.

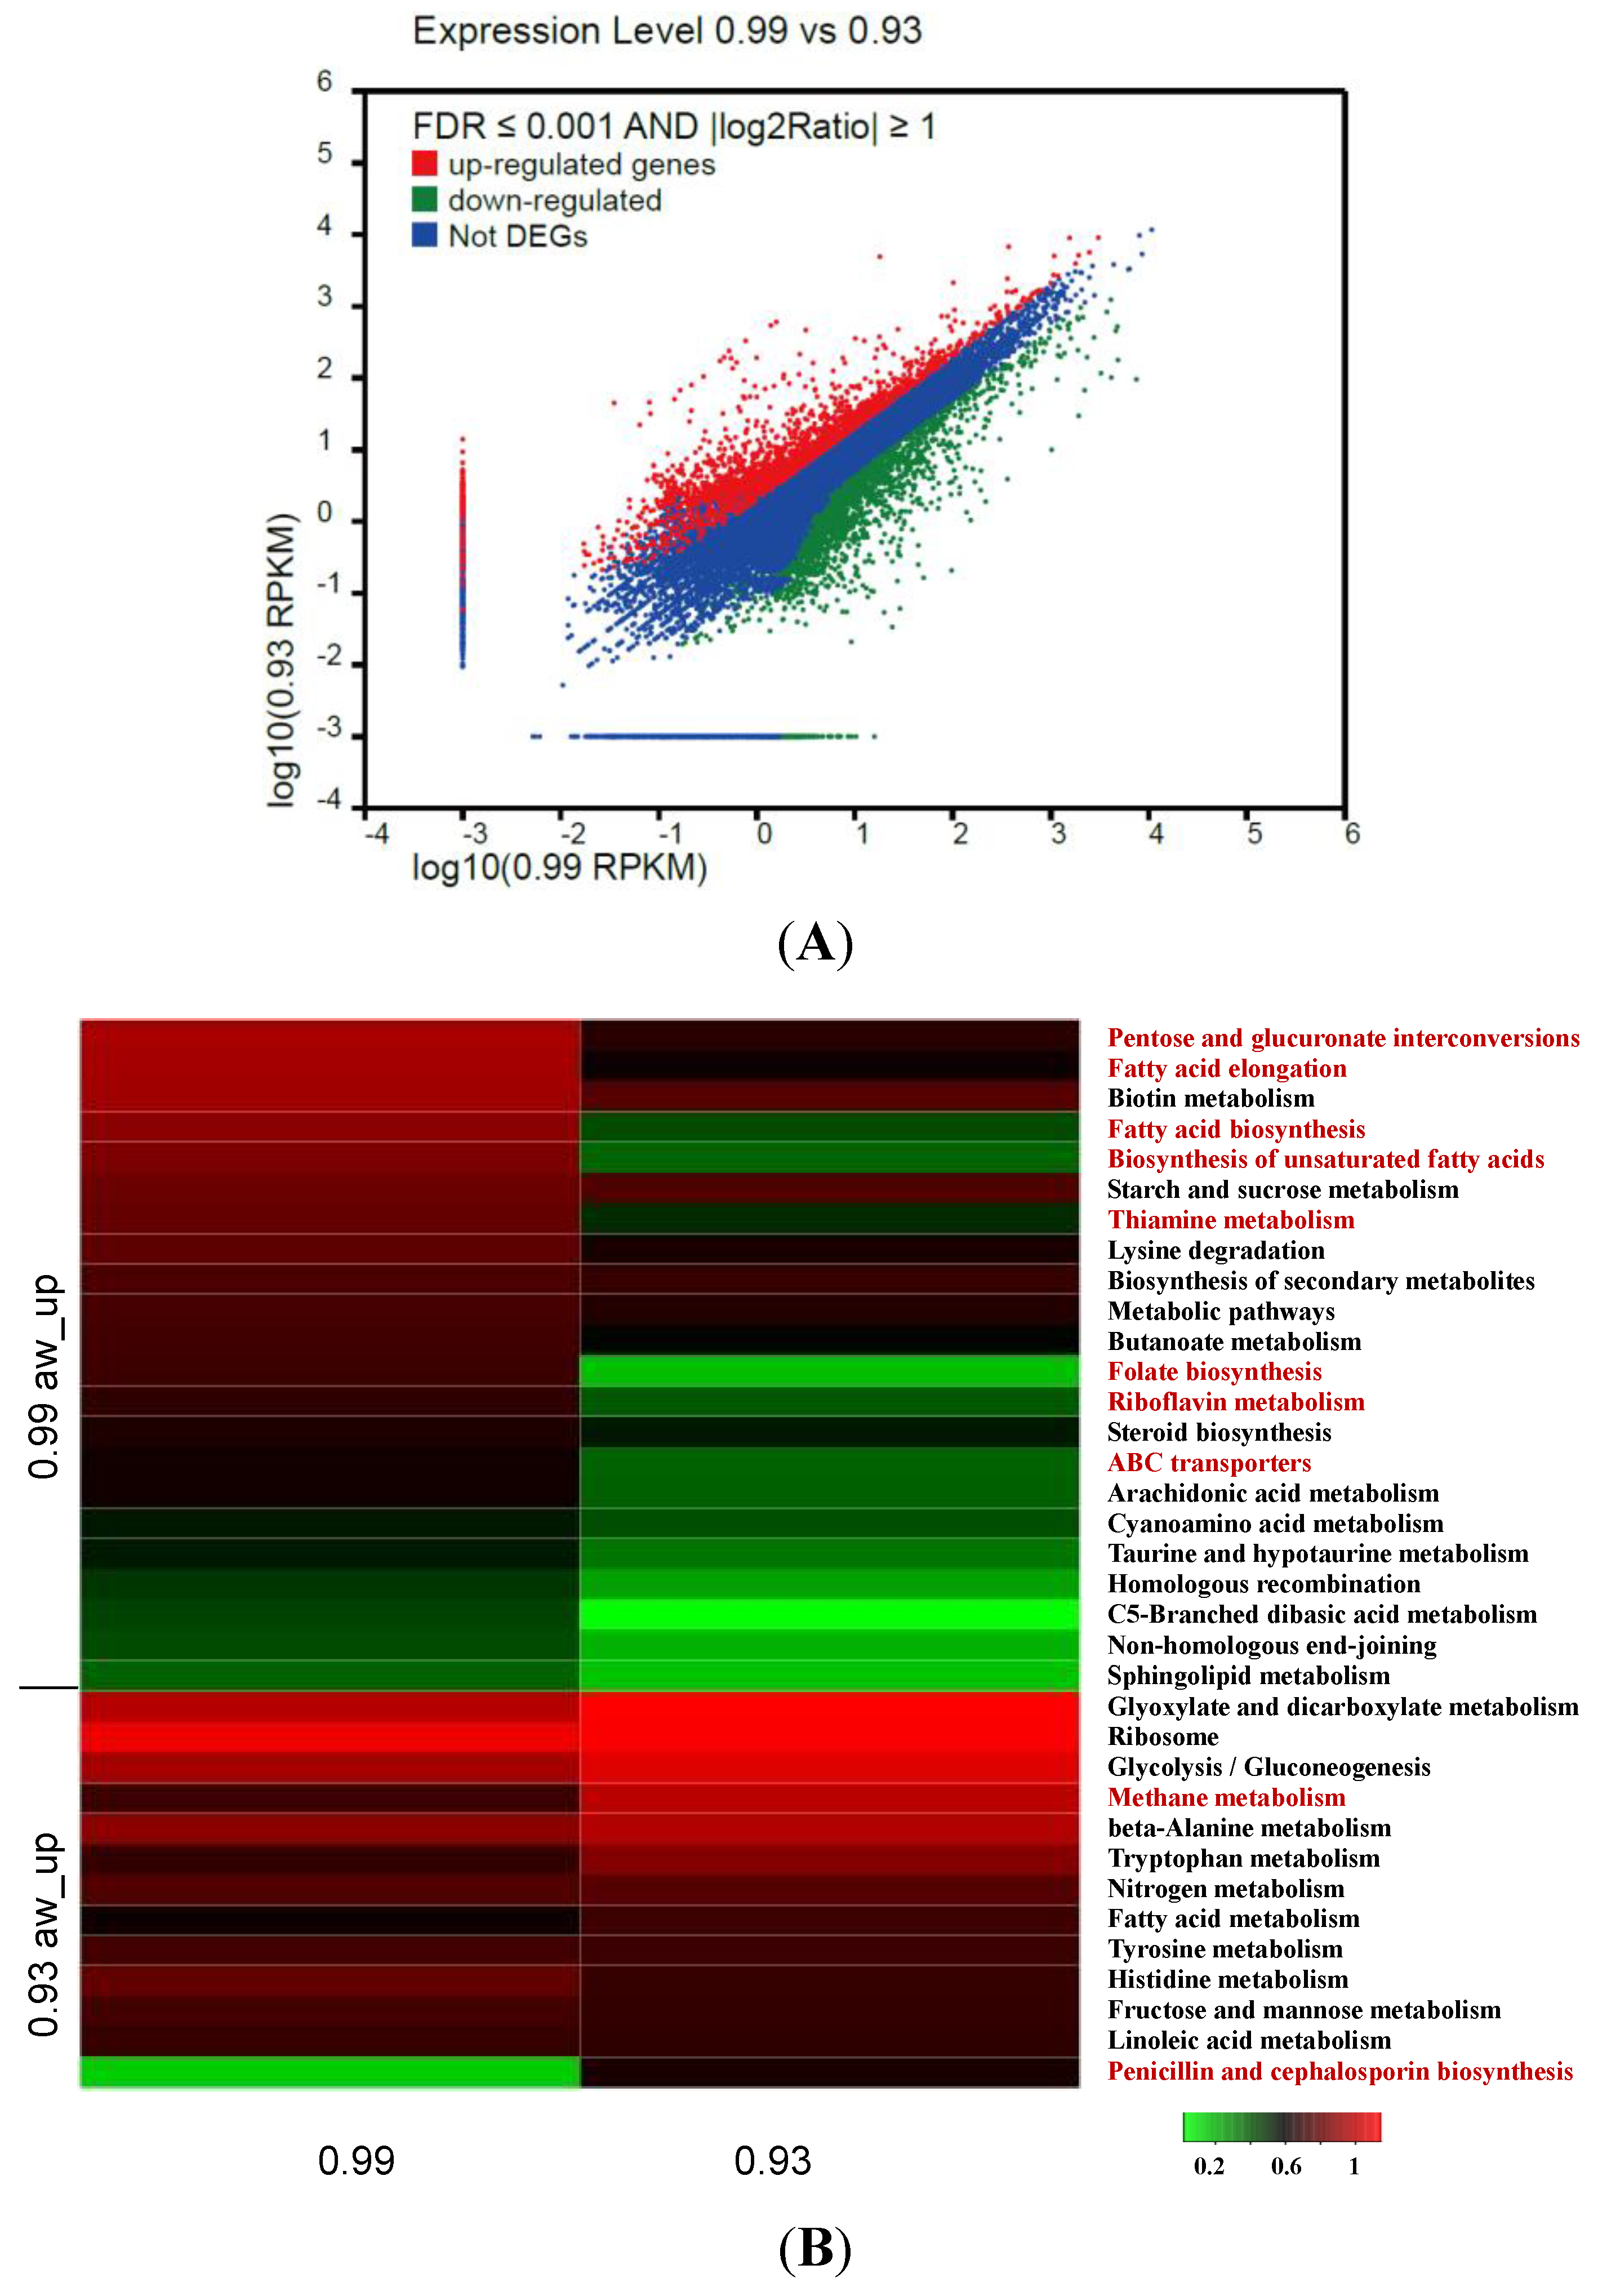
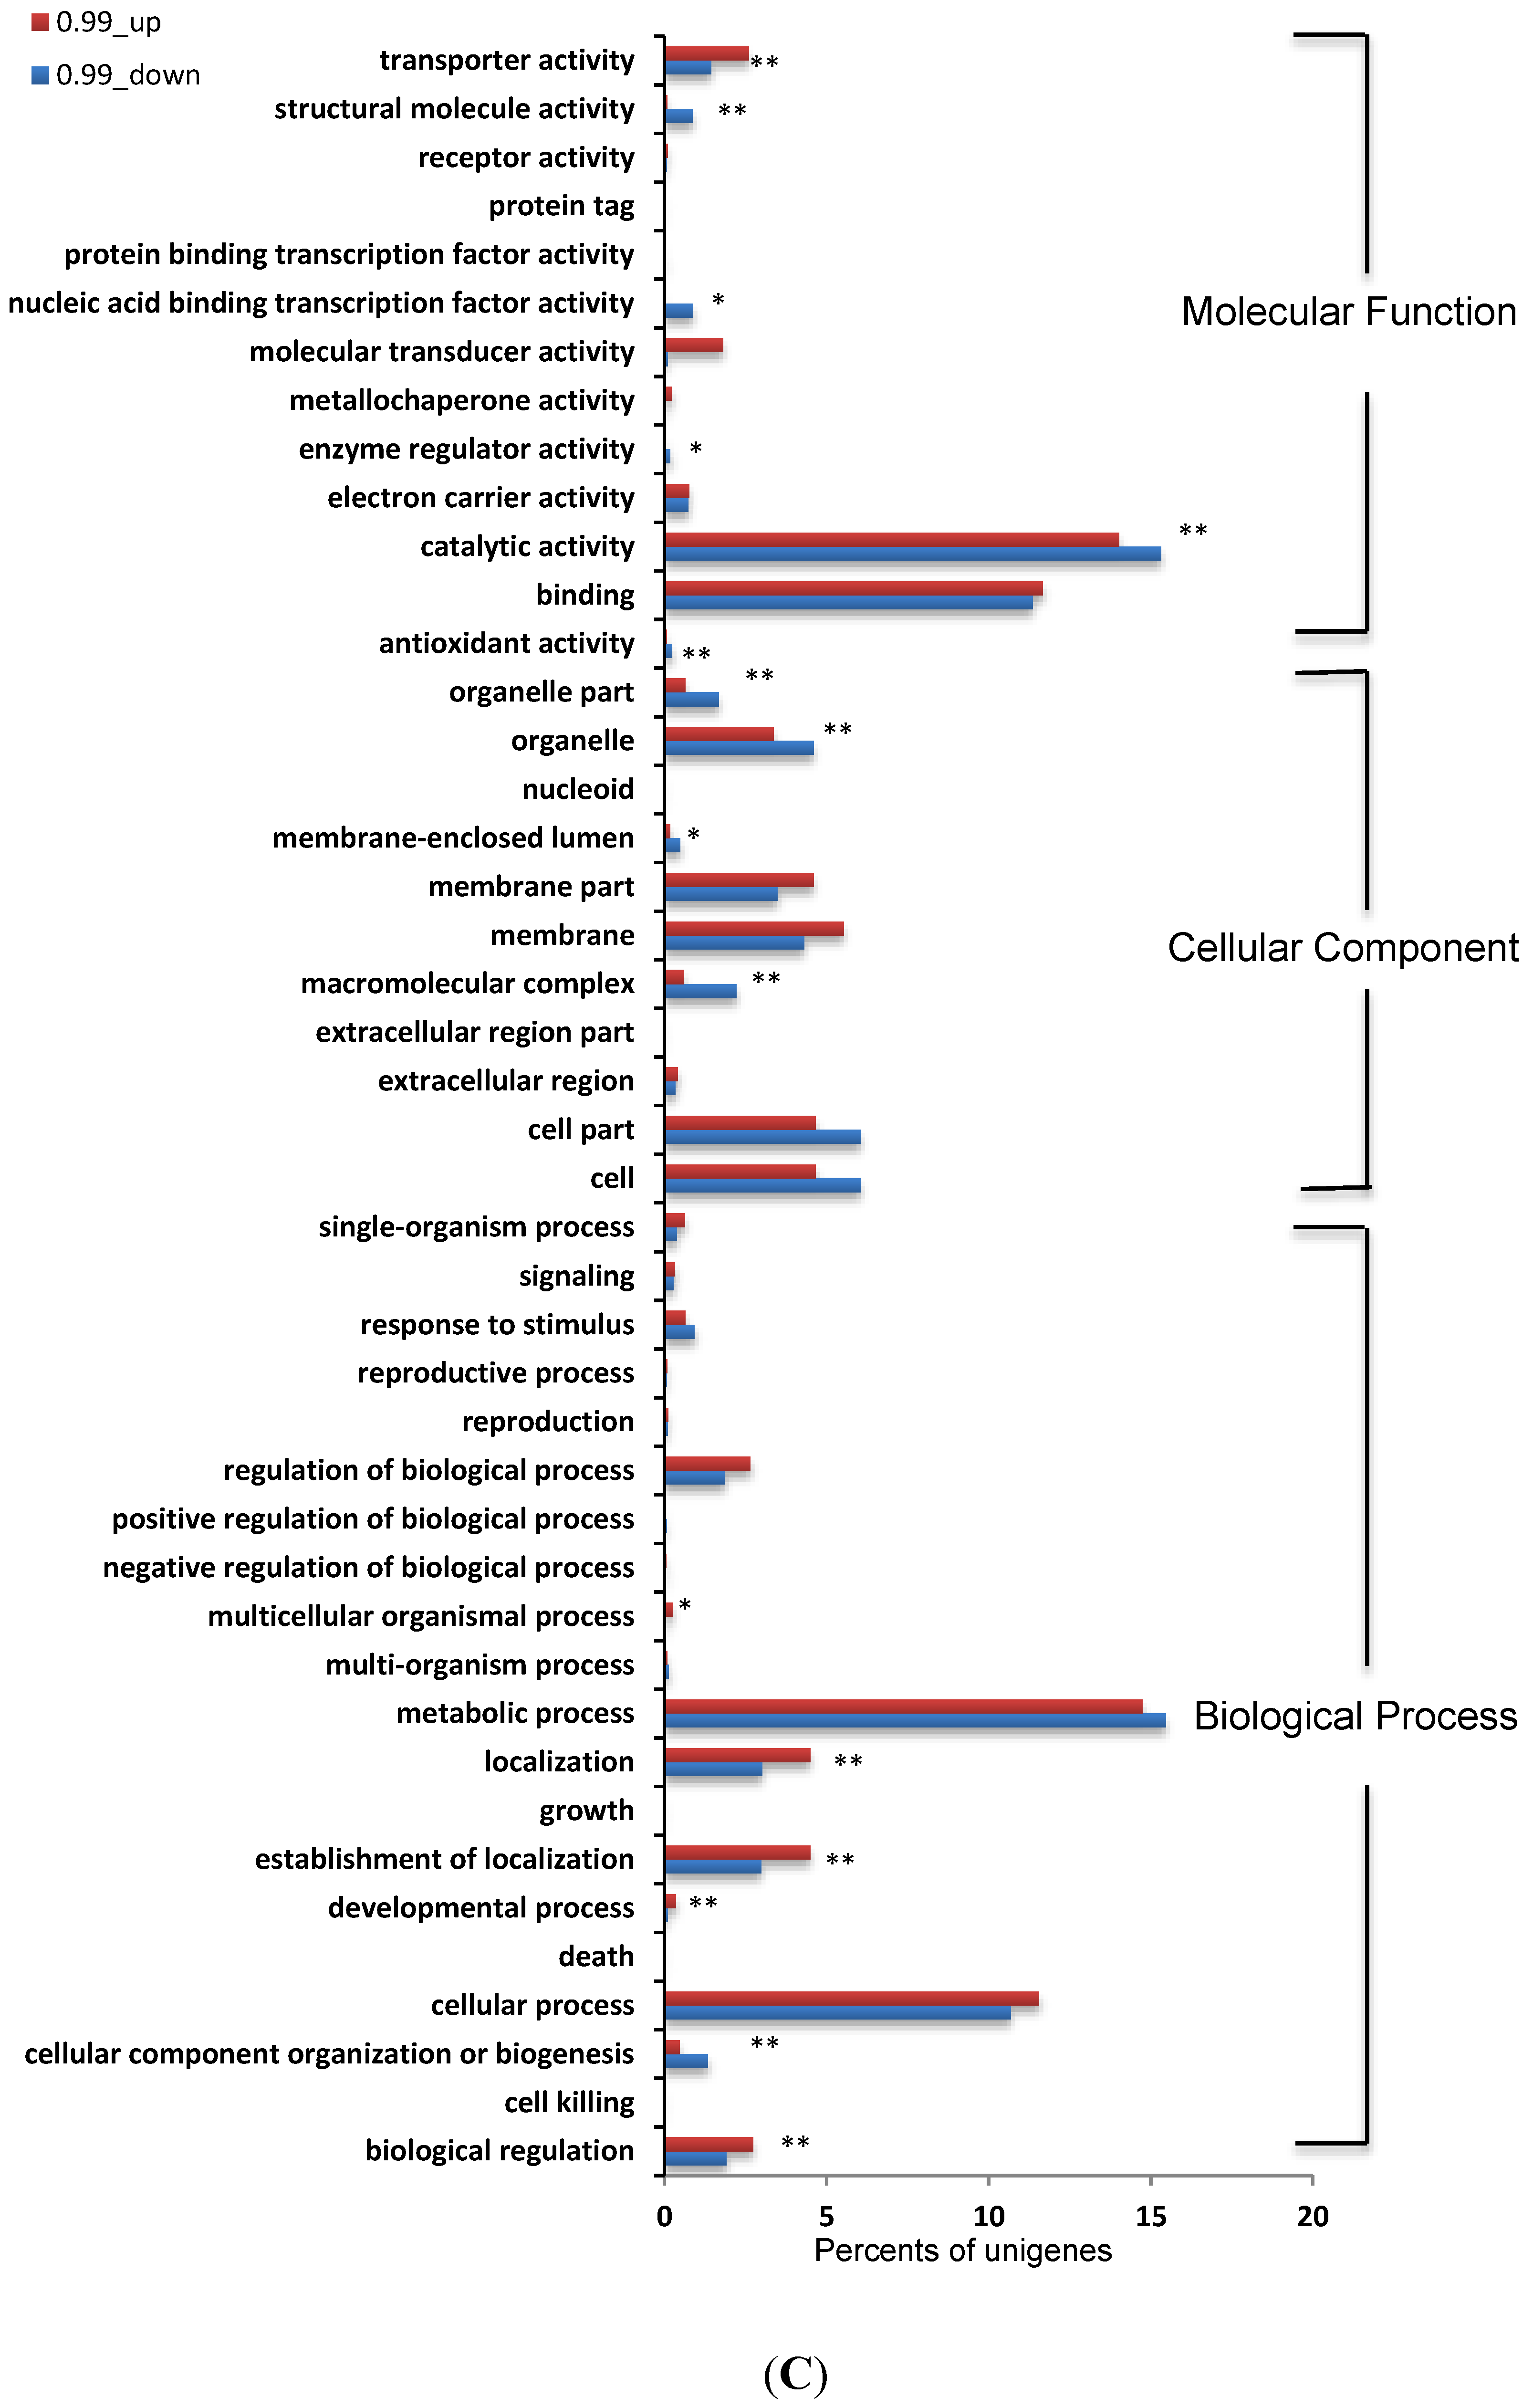
3.5. Identification and Analysis of DEGs

To identify the differences of molecular response between 0.99 aw and 0.93 aw treatments, gene expression levels were calculated using the RPKM method [22]. Based on RPKM values, out of 23,320 unigenes, 5362 differentially expressed unigenes (with p < 0.05, FDR ≤ 0.001, |log2Ratio| ≥ 1) were identified (Figure 5A). Among them, 3156 and 2206 genes displayed up-regulation under 0.99 aw and 0.93 aw treatments, respectively. All of the differentially expressed sequences were subjected to GO analysis, and the number of unigenes with GO annotations in 0.99 aw DEGs (1714) was more than that of 0.93 aw (1296). As shown in Figure 5C, the GO terms “transporter activity”, “localization”, “establishment of localization”, and “biological regulation” were significantly over-represented at the transcriptional level at 0.99 aw compared with the 0.93 aw. In contrast, the GO categories “structural molecule activity”, “catalytic activity”, “nucleic acid binding transcription factor activity”, “organelle part”, “organelle”, “membrane-enclosed lumen”, “macromolecuar complex”, and “cellular component organization or biogenesis” were expressed at high levels under 0.93 aw conditions, demonstrating that these factors play a pivotal role in adapting to water stress which is agreement with the results obtained by Abdel-Hadi et al. (2012) [16].
Figure 4. Annotation of all-unigene in the A. flavus transcriptome. (A) The gene ontology annotation of all-unigene; (B) Histogram presentations of clusters of orthologous groups (COG) classification.
Toxins 06 03187 g004aToxins 06 03187 g004b
To study the function of DEGs, KEGG metabolic pathways analysis was performed by initially aligning unigenes with sequences from GenBank. Among 2721 DEGs, 1516 annotated unigenes up-expressed in 0.99 aw conditions, and 1205 genes up-expressed in 0.93 aw conditions were grouped into 108 known metabolic or signaling pathway classes (Table S2). Although the pathway distributions of these up-expressed genes in both 0.99 aw and 0.99 aw were almost in accordance with each other, more genes displayed at least two-fold up-regulation in 0.99 aw conditions (Figure 5B). For example, more genes related to fatty acid metabolism such as “fatty acid biosynthesis”, “biosynthesis of unsaturated fatty acids” and “fatty acid elongation” displayed high transcriptional activity at 0.99 aw. Aflatoxins are known to begin with norsolorinic acid, which is synthesized in vivo by a specialized pair of fatty acid synthases (FAS-1 and FAS-2) and a separately transcribed polyketide synthase (PKS-A) [32].

3.6. Analysis of DEGs Involved in Aflatoxin Biosynthesis

To evaluate the effect of water activity on the regulation of aflatoxin biosynthesis, we used the sequence information of 33 candidate genes provided by NCBI to identify the putative aflatoxin biosynthesis genes in the A. flavus transcriptomes [15]. As shown in Table 2, a number of different expression genes related to aflatoxin biosynthesis in response to water stress were identified. Among the 33 candidate genes identified in the transcriptome of A. flavus, 16 genes were up-regulated more than twofold in 0.99 aw conditions compared with 0.93 aw conditions. Several genes coding for aflatoxin biosynthesis were significant differences between the two regimes. For example, aflF, aflU and aflG all have more than 10-fold transcriptional changes in 0.99 aw relative to 0.93 aw conditions. The gene aflF also named norB, shares 68% amino acid similarity to an aryl alcohol dehydrogenase encoded by an aflE (norA) gene, which is putatively involved in the conversion of NOR to AVN [33]. An additional gene, aflD (nor-1), was identified in the aflatoxin gene cluster encoding a ketoreductase that is capable of converting NOR to AVN [34]. Therefore, the presence of one of them was enough to catalyze NOR to AVN [35], which may help explain the phenomenon that only aflF up-regulated more than 2-folds. The gene aflU encodes a polypeptide of 498 amino acids, which has a typical heme-binding motif of cytochrome P450 monooxygenase [35]. Based on sequence analysis and the enzymatic requirement for G-group toxin biosynthesis, this gene is most likely involved in G-group toxin formation in aflatoxin biosynthesis [33]. A previous expression study revealed that its transcript was detected only under aflatoxin-conducive conditions and not on non-conducive conditions [35], which is in a good agreement with our findings. The gene aflG encodes a cytochrome P450 monooxygenase that converts AVN to HAVN [36]. A striking finding that aflG/aflL is contiguous only in the cluster of section Flavi species suggested aflG/aflL either was recruited from other genomic locations or reorganization of cluster genes from a sterigmatocystin ancestor [37]. The gene aflNa (hypD), first reported by expressed sequence tag data, has been predicted to encode a small integral membrane protein and suggested to affect both development and secondary metabolism of Aspergillus [38]. Interestingly, among the five most highly up-regulated genes, aflF, aflU and aflT genes are adjacent and located on the very end of the gene cluster, whereas aflG and aflNa are located next to each other in the middle of the gene cluster. Therefore, the gene aflF could be related to turning on/off aflatoxin pathway gene expression, and on chromosomal location these gene may be responsive to the environmental queue of water activity. The gene aflR is a Zn2Cys6-type transcription factor that is believed to be necessary for regulating most of the genes in the aflatoxin gene cluster in A. flavus [38], and they demonstrated that water activity had a significant effect on aflR transcription at lower aw (0.90) compared with higher aw (0.99) [39]. Curiously, the expression of this gene did not display somewhat difference even though strains were removed to a favor aflatoxin-producing regimes.

3.7. Analysis of DEGs Involved in Development

The control of secondary metabolism in fungi is often coordinated to fungal growth and development [40]. To further explore potential DEGs involved in aflatoxin biosynthesis in A. flavus, we analyzed 69 annotated sequences for the genes involved in development [41]. We found that the transcriptional patterns of most genes involved in development were down-regulated when A. flavus was treated with a lower water activity. For instance, flbC encoding C2H2 transcription factor, which is involved in asexual development, sexual development and germination, decreased its RPKM value from 135.08 to 5.67 (Table 3). In wild-type colonies, FlbC localizes in the nuclei of vegetative hyphae and in conidiophores, activates brlA, abaA, and vosA but not wetA [42]. Apart from flbC, four flb genes, flbA, flbB, flbD and flbE were taken into account in present study. FlbA encodes an RGS domain protein, which negatively regulates vegetative growth signaling [43]. FlbB encodes a fungal specific bZIP-type transcription factor, which is located within the cytoplasm at the hyphal apex during early vegetative growth and involved in asexual development [44]. FlbD, a c-Myb transcription factor, is uniquely involved in both asexual and sexual differentiation in A. nidulans [45]. FlbE localized at hyphal tips, which may protect FlbB from proteolytic degradation [46]. Although the flb genes are conserved in A. fumigatus, A. oryzae and A. nidulans [41], only flbC was un-regulated in the current study. This inconsistency may be explained by FlbC acting in a pathway parallel to that of other flb genes. Alternatively, the promoter-binding regions of FlbC and FlbB/FlbD may overlap [47].
Figure 5. The different expression level of unigenes under different treatments. (A) Scatter plot of total unigenes from the A. flavus transcriptome; (B) KEGG annotation of DEGs. The heatmap shows 35 of 100 annotated pathways of DEGs between 0.99 aw_up and 0.93 aw_up. Among the 35 pathways, 19 pathways were up-regulated in 0.99 aw treatment, and the rest of the pathways showed up-regulated expression in 0.93 aw treatment. Different colors represent different expression level of a particular metabolic pathway during the two treatments. Green color represents down-regulated expression and red color represents up-regulated expression. Each row represents a differentially expressed metabolic pathway. The data used to construct this heatmap was based on the log10 value of the RPKM values of all unigenes relating to a particular metabolic pathway in 0.99 aw or 0.93 aw treatment. The top ten hits were shown with red words; (C) The gene ontology annotation of DEGs. Asterisks indicate a significant overrepresentation of functional categories compared to the functional categories of 3010 present genes (* p < 0.05; ** p < 0.01).
Toxins 06 03187 g005aToxins 06 03187 g005b
Table 2. Expression profiling of A. flavus genes involved in aflatoxin biosynthesis.
Generef_IDFunction0.99_RPKM0.93_RPKMLog2 (0.99_RPKM/0.93_RPKM)Changes (*)
aflFXP_002379954Dehydrogenase5.20.16.3Up
aflUXP_002379953P450 monooxygenase16.31.13.9Up
aflGXP_002379937Cytochrome P450 monooxygenase50.64.23.6Up
aflNaXP_002379938Hypothetical protein121.417.52.8Up
aflTXP_002379952Transmembrane protein10.41.72.6Up
aflQXP_002379931Cytochrome P450 monooxigenase163.328.32.5Up
aflJXM_002379902Esterase6.11.32.2Up
aflIXP_002379934Cytochrome P450 monooxygenase1.10.31.7Up
aflMaXP_002379940Hypothetical protein11.94.11.5Up
aflYbXP_002379924Putative hexose transporter5.92.21.4Up
aflYdXP_002379922Sugar regulator2.81.11.4Up
aflXXP_002379927Monooxygenase oxidase6.42.41.4Up
aflBXP_002379947Fatty acid synthase beta subunit149.972.21.1Up
aflWXP_002379928Monooxygenase3.21.61.0Up
aflYXP_002379926Hypothetical protein4.42.21.0Up
aflLXP_002379936P450 monooxygenase4.62.40.9
aflNXP_002379939Monooxygenase3.11.70.9
aflVXP_002379929Cytochrome P450 monooxygenase2.11.20.8
aflEXP_002379942NOR reductase dehydrogenase6.54.10.7
aflMXP_002379941Ketoreductase14.010.80.4
aflYaXP_002379925NADH oxidase2.11.60.4
aflSXP_002379945Pathway regulator0.60.50.3
aflPXP_002379932O-methyltransferase A4.74.20.2
aflKXP_002379930VERB synthase11.511.20.0
aflRXM_002379905Transcription activator0.10.10.0
aflLaXP_002379935Hypothetical protein1.41.6−0.1
aflOXP_002379933O-methyltransferase B6.77.7−0.2
aflHXP_002379944Short chain alcohol dehydrogenase4.45.5−0.3
aflAXP_002379948Fatty acid synthase alpha subunit4.76.0−0.3
aflCaXP_002379950Hypothetical protein0.40.6−0.4
aflDXP_002379949Reductase0.40.6−0.4
aflYcXP_002379923Glucosidase19.926.2−0.4
aflCXP_002379951Polyketide synthase4.87.7−0.7
(*) Log2 (0.99_RPKM/0.93_RPKM) ≥1 indicate up-regulated expression while Log2 (0.99_RPKM/0.93_RPKM) ≤−1 indicate down-regulated expression.
Table 3. Expression profiling of A. flavus genes involved in development.
Generef_IDFunction0.99_RPKM0.93_RPKMLog2 (0.99_RPKM/0.93_RPKM)Changes (*)
rgsAgi|259484767|tpe|CBF81270.1|G protein regulatorNDND
nsdDgi|259485893|tpe|CBF83303.1|DNA binding proteinNDND
flbCgi|259487830|tpe|CBF86815.1|Putative zinc finger protein135.15.74.6Up
cryAgi|40747330|gb|EAA66486.1|Hypothetical protein0.203.2Up
MAT1-1gi|259486330|tpe|CBF84081.1|Mating type alpha box protein1.10.13.2Up
gprBgi|34482020|tpg|DAA01795.1|Pheromone receptor9.91.72.5Up
abr1gi|6090821|gb|AAF03353.1|Brown 12.80.71.9Up
brnAgi|134081843|emb|CAK42098.1|Unnamed protein product2.80.71.9Up
MAT1-2gi|259482427|tpe|CBF76901.1|Mating type HMG-box protein8.62.51.8Up
brlAgi|259488735|tpe|CBF88417.1|Regulatory protein7.72.31.8Up
lreAgi|259485576|tpe|CBF82714.1|GATA-factor6.62.91.2Up
stuAgi|259480005|tpe|CBF70741.1|Cell pattern formation-associated protein3.81.81.1Up
medAgi|259479562|tpe|CBF69898.1|Medusa6.131.1Up
tpsBgi|1488038|gb|AAB05869.1|Trehalose-6-phosphate synthase91.547.40.9
tpsAgi|3170246|gb|AAC18060.1|Trehalose-6-phosphate synthase subunit 191.547.40.9
steAgi|259487683|tpe|CBF86542.1|Transcription factor25150.8
gprAgi|34482022|tpg|DAA01796.1|Pheromone receptor4.42.80.7
gprDgi|259485627|tpe|CBF82810.1|Integral membrane protein11.370.7
lreBgi|259481867|tpe|CBF75789.1|GATA-factor76.351.60.6
rosAgi|259484624|tpe|CBF81007.1|Repressor of sexual development47.130.70.6
nosAgi|259487198|tpe|CBF85681.1|NosA protein47.130.70.6
wetAgi|259487296|tpe|CBF85858.1|Regulatory protein5.33.60.6
phnAgi|259489726|tpe|CBF90234.1|Phosducin-like protein33.121.70.6
arp2gi|6090729|gb|AAF03314.1|Tetrahydroxynaphthalene reductase1410.80.4
kapAgi|259487521|tpe|CBF86262.1|Karyopherin alpha281.4221.40.4
arp1gi|2555060|gb|AAC49843.1|Scytalone dehydratase6352.60.3
nsdCgi|259481122|tpe|CBF74364.1|NSDC86.50.3
schAgi|259481151|tpe|CBF74417.1|CAMP-dependent protein kinase-like2.92.40.3
abaAgi|167998|gb|AAA33286.1|AbaA protein65.70.1
pkaAgi|259479481|tpe|CBF69742.1|CAMP-dependent protein kinase23.321.10.1
mpkBgi|259481736|tpe|CBF75537.1|Mitogen-activated protein kinase26.425.20.1
flbBgi|259483861|tpe|CBF79600.1|bZIP-type transcription factor4843.40.1
fphAgi|259486541|tpe|CBF84471.1|Phytochrome10.190.1
steCgi|259487662|tpe|CBF86503.1|MAPKK kinase17.316.30.1
veAgi|259488644|tpe|CBF88249.1|Mutant VeA1 protein32.230.70.1
laeAgi|259488911|tpe|CBF88745.1|Methyltransferase19.317.50.1
flbEgi|259489004|tpe|CBF88918.1|Putative uncharacterized protein54.451.40.1
flbAgi|259479939|tpe|CBF70620.1|Developmental regulator18.418.40.0
gpgAgi|259486344|tpe|CBF84107.1|G protein gamma subunit248.62470.0
sfaDgi|259489728|tpe|CBF90238.1|G-protein beta subunit7877.20.0
abr2gi|6090815|gb|AAF03349.1|Brown 26.87.5−0.2
gpaAgi|27524346|emb|CAC81704.1|GMP binding protein alpha subunit43.847.3−0.2
gpaBgi|27524350|emb|CAC81805.1|GMP binding protein alpha subunit1.61.9−0.2
pkaBgi|67537094|ref|XP_662321.1|Hypothetical protein0.60.7−0.2
gaoCgi|83773752|dbj|BAE63877.1|Unnamed protein product43.847.3−0.2
yAgi|259480215|tpe|CBF71142.1|Laccase-1 Precursor6.87.5−0.2
ganBgi|259488687|tpe|CBF88328.1|G protein alpha subunit1.61.9−0.2
fadAgi|259489081|tpe|CBF89057.1|GMP binding protein subunit alpha43.847.3−0.2
velBgi|259489398|tpe|CBF89638.1|VelB15.116.6−0.2
flbDgi|259489501|tpe|CBF89824.1|Putative uncharacterized protein9.911.4−0.2
alb1gi|3136092|gb|AAC39471.1|Polyketide synthase13.917.4−0.3
chsCgi|4519181|dbj|BAA75501.1|Chitin synthase8.811−0.3
fwnAgi|134078436|emb|CAL00851.1|Unnamed protein product13.917.4−0.3
sfgAgi|259480894|tpe|CBF73944.1|SfgA0.80.9−0.3
treBgi|2827392|gb|AAB99831.1|Neutral trehalase43.262.1−0.5
pptAgi|134080185|emb|CAK46165.1|Unnamed protein product38.354.6−0.5
cyaAgi|259481514|tpe|CBF75105.1|Adenylate cyclase1.62.4−0.5
vosAgi|259487318|tpe|CBF85898.1|VosA4.36.2−0.5
ppoBgi|259479464|tpe|CBF69709.1|Fatty acid oxygenase15.427.7−0.7
ppoCgi|259482096|tpe|CBF76249.1|Fatty acid oxygenase15.427.7−0.7
ppoAgi|259487326|tpe|CBF85912.1|Fatty acid oxygenase15.427.7−0.7
rasAgi|259489610|tpe|CBF90024.1|Ras-like protein1.11.8−0.7
chsAgi|465390|dbj|BAA04806.1|Chitin synthase8.719.6−1.3Down
fluGgi|259482332|tpe|CBF76713.1|FluG11.834.5−1.7Down
chiBgi|259485098|tpe|CBF81882.1|Class V chitinase0.10.1−1.7Down
rolAgi|28875529|dbj|BAC65230.1|Hydrophobin putative1.56.9−2.3Down
rodBgi|70996676|ref|XP_753093.1|Conidial hydrophobin1.56.9−2.3Down
rodAgi|259482991|tpe|CBF77990.1|Rodlet protein1.56.9−2.3Down
ganAgi|259485962|tpe|CBF83426.1|G protein alpha subunit homologNDND
(*) Log2 (0.99_RPKM /0.93_RPKM) ≥1 indicate up-regulated expression while Log2 (0.99_RPKM/0.93_RPKM) ≤−1 indicate down-regulated expression. ND means no detection.

4. Conclusions

Aspergillus flavus is an imperfect filamentous fungal pathogen causing diseases of many agricultural crops, such as maize, cotton, and peanuts, as well as tree nuts [48]. In the current work, a transcriptome database of A. flavus was constructed. From the two different treatments (0.99 aw and 0.93 aw), we identified differentially expressed genes by transcriptome analysis and found that numerous metabolic pathways related to biosynthesis were significantly over-expressed when treated with 0.99 aw, especially in the biosynthesis of aflatoxin in A. flavus. During treatment with 0.99 aw, unigenes involved in development, such as flbC, were significantly up-regulated. The relationship between the aflatoxin biosynthesis pathway and development of A. flavus is complex and further analytical work is required. Moisture is an important regime factor for fungi growth and mycotoxin production, but little transcription level information is available at present; therefore, our transcriptome provides a resource for further studies examining water activity, and fungi growth and aflatoxin production. Collectively, this study opens the way to future studies analyzing the effect of water activity on other fungi physiology.

Supplementary Materials

Supplementary materials can be accessed at: https://www.mdpi.com/2072-6651/6/11/3187/s1.

Supplementary Files

Supplementary File 1

Acknowledgments

Funding was provided for this research from National 973 Program (No. 2013CB127802) of the Ministry of Science and Technology of China and from the grants (No. 31172297, No.31400100, and No. 31000961) of the National Natural Science Foundation of China (NSFC). We thank Youhuang Bai for help with part of the bioinformatics analyses.

Author Contributions

F.Z. and S.W. conceived and designed the experiments; Z.G., H.Z., and W.Y. performed the experiments; F.Z., Y.L, and S.W. analyzed the data; F.Z., S.W., and Z.G. wrote the paper.

Conflicts of Interest

The authors declare no conflict of interest.

References

  1. Gonçalves, S.S.; Cano, J.F.; Stchigel, A.M.; Melo, A.S.; Godoy-Martinez, P.C.; Correa, B.; Guarro, J. Molecular phylogeny and phenotypic variability of clinical and environmental strains of Aspergillus flavus. Fungal Biol. 2012, 116, 1146–1155. [Google Scholar] [CrossRef] [PubMed]
  2. Amaike, S.; Keller, N.P. Aspergillus flavus . Annu. Rev. Phytopathol. 2011, 49, 107–133. [Google Scholar] [CrossRef]
  3. Hua, S.S.T.; McAlpin, C.E.; Chang, P.-K.; Sarreal, S.B.L. Characterization of aflatoxigenic and non-aflatoxigenic Aspergillus flavus isolates from Pistachio. Mycotoxin Res. 2012, 28, 67–75. [Google Scholar] [CrossRef] [PubMed]
  4. Kensler, T.W.; Roebuck, B.D.; Wogan, G.N.; Groopman, J.D. Aflatoxin: A 50-year odyssey of mechanistic and translational toxicology. Toxicol. Sci. 2011, 120, S28–S48. [Google Scholar] [CrossRef] [PubMed]
  5. El Khoury, A.; Atoui, A.; Rizk, T.; Lteif, R.; Kallassy, M.; Lebrihi, A. Differentiation between Aspergillus flavus and Aspergillus parasiticus from pure culture and aflatoxin-contaminated grapes using PCR-RFLP analysis of aflR-aflJ intergenic spacer. J. Food Sci. 2011, 76, M247–M253. [Google Scholar]
  6. Leema, G.; Chou, D.-S.; Jesudasan, C.A.N.; Geraldine, P.; Thomas, P.A. Expression of genes of the aflatoxin biosynthetic pathway in Aspergillus flavus isolates from Keratitis. Mol. Vis. 2011, 17, 2889–2897. [Google Scholar] [PubMed]
  7. Adjovi, Y.C.; Bailly, S.; Gnonlonfin, B.J.; Tadrist, S.; Querin, A.; Sanni, A.; Oswald, I.P.; Puel, O.; Bailly, J.D. Analysis of the contrast between natural occurrence of toxigenic Aspergilli of the Flavi section and aflatoxin B1 in Cassava. Food Microbiol. 2014, 38, 151–159. [Google Scholar] [CrossRef] [PubMed]
  8. Jamali, M.; Karimipour, M.; Shams-Ghahfarokhi, M.; Amani, A.; Razzaghi-Abyaneh, M. Expression of aflatoxin genes aflO (omtB) and aflQ (ordA) differentiates levels of aflatoxin production by Aspergillus flavus strains from soils of Pistachio orchards. Res. Microbiol. 2013, 164, 293–299. [Google Scholar] [CrossRef] [PubMed]
  9. Bhatnagar, D.; Cary, J.W.; Ehrlich, K.; Yu, J.; Cleveland, T.E. Understanding the genetics of regulation of aflatoxin production and Aspergillus flavus development. Mycopathologia 2006, 162, 155–166. [Google Scholar] [PubMed]
  10. Schmidt-Heydt, M.; Rüfer, C.E.; Abdel-Hadi, A.; Magan, N.; Geisen, R. The production of aflatoxin B1 or G1 by Aspergillus parasiticus at various combinations of temperature and water activity is related to the ratio of aflS to aflR expression. Mycotoxin Res. 2010, 26, 241–246. [Google Scholar] [CrossRef] [PubMed] [Green Version]
  11. Georgianna, D.R.; Payne, G.A. Genetic regulation of aflatoxin biosynthesis: From gene to genome. Fungal Genet. Biol. 2009, 46, 113–125. [Google Scholar] [CrossRef] [PubMed]
  12. Schmidt-Heydt, M.; Magan, N.; Geisen, R. Stress induction of mycotoxin biosynthesis genes by abiotic factors. FEMS Microbiol. Lett. 2008, 284, 142–149. [Google Scholar] [CrossRef] [PubMed]
  13. Alborch, L.; Bragulat, M.; Abarca, M.; Cabañes, F. Effect of water activity, temperature and incubation time on growth and ochratoxin A production by Aspergillus niger and Aspergillus carbonarius on maize kernels. Int. J. Food Microbiol. 2011, 147, 53–57. [Google Scholar] [CrossRef] [PubMed]
  14. Mousa, W.; Ghazali, F.; Jinap, S.; Ghazali, H.; Radu, S. Modelling the effect of water activity and temperature on growth rate and aflatoxin production by two isolates of Aspergillus flavus on paddy. J. Appl. Microbiol. 2011, 111, 1262–1274. [Google Scholar] [CrossRef] [PubMed]
  15. Yu, J.; Fedorova, N.D.; Montalbano, B.G.; Bhatnagar, D.; Cleveland, T.E.; Bennett, J.W.; Nierman, W.C. Tight control of mycotoxin biosynthesis gene expression in Aspergillus flavus by temperature as revealed by RNA-Seq. FEMS Microbiol. Lett. 2011, 322, 145–149. [Google Scholar] [CrossRef] [PubMed]
  16. Abdel-Hadi, A.; Schmidt-Heydt, M.; Parra, R.; Geisen, R.; Magan, N. A systems approach to model the relationship between aflatoxin gene cluster expression, environmental factors, growth and toxin production by Aspergillus flavus. J. R. Soc. Interface. 2012, 9, 757–767. [Google Scholar] [CrossRef] [PubMed]
  17. Schmidt-Heydt, M.; Abdel-Hadi, A.; Magan, N.; Geisen, R. Complex regulation of the aflatoxin biosynthesis gene cluster of Aspergillus flavus in relation to various combinations of water activity and temperature. Int. J. Food Microbiol. 2009, 135, 231–237. [Google Scholar] [CrossRef] [PubMed] [Green Version]
  18. Giorni, P.; Camardo Leggieri, M.; Magan, N.; Battilani, P. Comparison of temperature and moisture requirements for sporulation of Aspergillus flavus sclerotia on natural and artificial substrates. Fungal Biol. 2012, 116, 637–642. [Google Scholar] [CrossRef]
  19. Lin, J.Q.; Zhao, X.X.; Zhi, Q.Q.; Zhao, M.; He, Z.M. Transcriptomic profiling of Aspergillus flavus in response to 5-azacytidine. Fungal Genet. Biol. 2013, 56, 78–86. [Google Scholar] [CrossRef] [PubMed]
  20. Chang, P.K.; Scharfenstein, L.L.; Mack, B.; Ehrlich, K.C. Deletion of the Aspergillus flavus orthologue of A. nidulans fluG reduces conidiation and promotes production of sclerotia but does not abolish aflatoxin biosynthesis. Appl. Environ. Microbiol. 2012, 78, 7557–7563. [Google Scholar] [CrossRef] [PubMed]
  21. Zhao, C.; Waalwijk, C.; de Wit, P.J.; Tang, D.; van der Lee, T. RNA-Seq analysis reveals new gene models and alternative splicing in the fungal pathogen Fusarium graminearum. BMC Genomics 2013, 14. [Google Scholar] [CrossRef] [PubMed]
  22. Deng, Y.; Yao, J.; Wang, X.; Guo, H.; Duan, D. Transcriptome sequencing and comparative analysis of Saccharina japonica (Laminariales, Phaeophyceae) under blue light induction. PLoS One 2012, 7. [Google Scholar] [CrossRef] [PubMed]
  23. Iseli, C.; Jongeneel, C.V.; Bucher, P. ESTScan: A program for detecting, evaluating, and reconstructing potential coding regions in EST sequences. Proc. Int. Conf. Intell. Syst. Mol. Biol. 1999, 138–148. [Google Scholar]
  24. Samapundo, S.; Devlieghere, F.; Geeraerd, A.; De Meulenaer, B.; Van Impe, J.; Debevere, J. Modelling of the individual and combined effects of water activity and temperature on the radial growth of Aspergillus flavus and A. parasiticus on corn. Food Microbiol. 2007, 24, 517–529. [Google Scholar] [CrossRef] [PubMed]
  25. Krishnan, S.; Manavathu, E.K.; Chandrasekar, P.H. Aspergillus flavus: An emerging non-fumigatus Aspergillus species of significance. Mycoses 2009, 52, 206–222. [Google Scholar] [PubMed]
  26. Frealle, E.; Aliouat-Denis, C.-M.; Delhaes, L.; Hot, D.; Dei-Cas, E. Transcriptomic insights into the oxidative response of stress-exposed Aspergillus fumigatus. Curr. Pharm. Des. 2013, 19, 3713–3737. [Google Scholar] [PubMed]
  27. Novodvorska, M.; Hayer, K.; Pullan, S.T.; Wilson, R.; Blythe, M.J.; Stam, H.; Stratford, M.; Archer, D.B. Transcriptional landscape of Aspergillus niger at breaking of conidial dormancy revealed by RNA-sequencing. BMC Genomics 2013, 14. [Google Scholar] [CrossRef] [PubMed]
  28. Szilágyi, M.; Miskei, M.; Karányi, Z.; Lenkey, B.; Pócsi, I.; Emri, T. Transcriptome changes initiated by carbon starvation in Aspergillus nidulans. Microbiology 2013, 159, 176–190. [Google Scholar] [CrossRef] [PubMed]
  29. Chang, P.-K.; Scharfenstein, L.L.; Mack, B.; Yu, J.; Ehrlich, K.C. Transcriptomic profiles of Aspergillus flavus CA42, a strain that produces small sclerotia, by decanal treatment and after recovery. Fungal Genet. Biol. 2014, 68, 39–47. [Google Scholar] [CrossRef] [PubMed]
  30. Yu, J.; Payne, G.A.; Nierman, W.C.; Machida, M.; Bennett, J.W.; Campbell, B.C.; Robens, J.F.; Bhatnagar, D.; Dean, R.A.; Cleveland, T.E. Aspergillus flavus genomics as a tool for studying the mechanism of aflatoxin formation. Food Addit. Contam. 2008, 25, 1152–1157. [Google Scholar] [CrossRef]
  31. Medina, M.L.; Kiernan, U.A.; Francisco, W.A. Proteomic analysis of rutin-induced secreted proteins from Aspergillus flavus. Fungal Genet. Biol. 2004, 41, 327–335. [Google Scholar] [CrossRef] [PubMed]
  32. Watanabe, C.M.; Wilson, D.; Linz, J.E.; Townsend, C.A. Demonstration of the catalytic roles and evidence for the physical association of type I fatty acid synthases and a polyketide synthase in the biosynthesis of aflatoxin B1. Chem. Biol. 1996, 3, 463–469. [Google Scholar] [CrossRef] [PubMed]
  33. Yu, J.; Bhatnagar, D.; Cleveland, T.E. Completed sequence of aflatoxin pathway gene cluster in Aspergillus parasiticus. FEBS Lett. 2004, 564, 126–130. [Google Scholar] [CrossRef] [PubMed]
  34. Chang, P.-K.; Skory, C.D.; Linz, J.E. Cloning of a gene associated with aflatoxin B1 biosynthesis in Aspergillus parasiticus. Curr. Genet. 1992, 21, 231–233. [Google Scholar] [CrossRef] [PubMed]
  35. Yu, J.; Chang, P.-K.; Ehrlich, K.C.; Cary, J.W.; Bhatnagar, D.; Cleveland, T.E.; Payne, G.A.; Linz, J.E.; Woloshuk, C.P.; Bennett, J.W. Clustered pathway genes in aflatoxin biosynthesis. Appl. Environ. Microbiol. 2004, 70, 1253–1262. [Google Scholar] [CrossRef] [PubMed]
  36. Yabe, K.; Nakajima, H. Enzyme reactions and genes in aflatoxin biosynthesis. Appl. Microbiol. Biotechnol. 2004, 64, 745–755. [Google Scholar] [CrossRef] [PubMed]
  37. Carbone, I.; Ramirez-Prado, J.H.; Jakobek, J.L.; Horn, B.W. Gene duplication, modularity and adaptation in the evolution of the aflatoxin gene cluster. BMC Evol. Biol. 2007, 7. [Google Scholar] [CrossRef] [PubMed]
  38. Ehrlich, K.C. Predicted roles of the uncharacterized clustered genes in aflatoxin biosynthesis. Toxins 2009, 1, 37–58. [Google Scholar] [CrossRef] [PubMed]
  39. Abdel-Hadi, A.; Carter, D.; Magan, N. Temporal monitoring of the nor-1 (aflD) gene of Aspergillus flavus in relation to aflatoxin B1 production during storage of peanuts under different water activity levels. J. Appl. Microbiol. 2010, 109, 1914–1922. [Google Scholar] [CrossRef] [PubMed] [Green Version]
  40. Bayram, Ö.; Braus, G.H. Coordination of secondary metabolism and development in fungi: The velvet family of regulatory proteins. FEMS Microbiol. Rev. 2012, 36, 1–24. [Google Scholar] [CrossRef] [PubMed]
  41. Krijgsheld, P.; Bleichrodt, R.; van Veluw, G.; Wang, F.; Müller, W.; Dijksterhuis, J.; Wösten, H. Development in Aspergillus. Stud. Mycol. 2013, 74, 1–29. [Google Scholar] [CrossRef] [PubMed]
  42. Kwon, N.J.; Garzia, A.; Espeso, E.A.; Ugalde, U.; Yu, J.H. FlbC is a putative nuclear C2H2 transcription factor regulating development in Aspergillus nidulans. Mol. Microbiol. 2010, 77, 1203–1219. [Google Scholar] [CrossRef] [PubMed]
  43. Yu, J.-H.; Rosén, S.; Adams, T.H. Extragenic suppressors of loss-of-function mutations in the Aspergillus FlbA regulator of G-protein signaling domain protein. Genetics 1999, 151, 97–105. [Google Scholar] [PubMed]
  44. Etxebeste, O.; Herrero-García, E.; Araújo-Bazán, L.; Rodríguez-Urra, A.B.; Garzia, A.; Ugalde, U.; Espeso, E.A. The bZIP-type transcription factor FlbB regulates distinct morphogenetic stages of colony formation in Aspergillus nidulans. Mol. Microbiol. 2009, 73, 775–789. [Google Scholar] [CrossRef] [PubMed]
  45. Arratia-Quijada, J.; Sánchez, O.; Scazzocchio, C.; Aguirre, J. FlbD, a Myb transcription factor of Aspergillus nidulans, is uniquely involved in both asexual and sexual differentiation. Eukaryot. Cell 2012, 11, 1132–1142. [Google Scholar] [CrossRef] [PubMed]
  46. Garzia, A.; Etxebeste, O.; Herrero-Garcia, E.; Fischer, R.; Espeso, E.A.; Ugalde, U. Aspergillus nidulans FlbE is an upstream developmental activator of conidiation functionally associated with the putative transcription factor FlbB. Mol. Microbiol. 2009, 71, 172–184. [Google Scholar] [CrossRef] [PubMed]
  47. Garzia, A.; Etxebeste, O.; Herrero-García, E.; Ugalde, U.; Espeso, E.A. The concerted action of bZip and cMyb transcription factors FlbB and FlbD induces brlA expression and asexual development in Aspergillus nidulans. Mol. Microbiol. 2010, 75, 1314–1324. [Google Scholar] [CrossRef] [PubMed]
  48. Yu, J. Aspergillus flavus genomics: Gateway to human and animal health, food safety, and crop resistance to diseases. Rev. Iberoam Micol. 2005, 22, 194–202. [Google Scholar] [CrossRef] [PubMed]

