
Cyclical Evolution of Emerging Technology Innovation Network from a Temporal Network Perspective

1
School of Economics, Wuhan Polytechnic University, Wuhan 430048, China
2
School of Economics, Wuhan University of Technology, Wuhan 430070, China
*
Author to whom correspondence should be addressed.
Systems 2023, 11(2), 82; https://doi.org/10.3390/systems11020082
Submission received: 20 December 2022
/
Revised: 18 January 2023
/
Accepted: 2 February 2023
/
Published: 5 February 2023
(This article belongs to the Section Systems Practice in Social Science)
Abstract
:With the cyclical development of emerging technologies, in reality, the evolution dynamics of their innovation networks will inevitably show obvious time attributes. Numerous network analyses of real complex systems usually focus on static networks; however, it is difficult to describe that most real networks undergo topological evolutions over time. Temporal networks, which incorporate time attributes into traditional static network models, can more accurately depict the temporal features of network evolution. Here, we introduced the time attribute of the life cycle of emerging technology into the evolution dynamics of its innovation network, constructed an emerging technology temporal innovation network from a temporal network perspective, and established its evolution model in combination with the life cycle and key attributes of emerging technology. Based on this model, we took 5G technology as an example to conduct network evolution simulation, verified the rationality of the above model building, and analyzed the cyclical evolution dynamics of this network in various topological structures. The results show that the life cycle of emerging technology, as well as multiple knowledge attributes based on the key attributes of emerging technology, are important factors that affect network evolution by acting on node behaviors. Within this study, we provide a more realistic framework to describe the internal mechanism of the cyclical evolution of emerging technology innovation network, which can extend the research on innovation network evolution from the single topological dynamics to the topological–temporal dynamics containing time attributes and enrich the research dimensions of innovation network evolution from the perspective of temporal evolution.
1. Introduction
The rapid changes in technology development in the context of a new technological revolution have brought much attention to the R&D innovation and strategic layout of a series of emerging technologies represented by 5G, big data, cloud computing, artificial intelligence, etc. Due to the high knowledge intensity of emerging technologies, their R&D innovation is a highly complex systemic process, and it is difficult for innovation subjects to meet their R&D innovation needs only through their knowledge reserves; thus, they usually absorb knowledge resources from other subjects to help their R&D innovation activities [1]. In this process, both active knowledge absorption and passive knowledge diffusion will promote knowledge interactions between innovation subjects, which, in turn, leads to the formation and evolution of innovation networks of multi-object collaborative interactions [2,3,4]. As an organic system and cultivation carrier for emerging technology innovations, innovation networks have received considerable attention from and been discussed by scholars in recent years. Some studies have modeled emerging technology innovation networks from different perspectives, such as new energy vehicle innovation networks [5,6], artificial intelligence innovation networks [7,8], AR and VR innovation networks [9], etc., and have carried out research on the evolution, evaluation, effects, and other issues relating to these networks.
Although emerging technology has become a hot topic in research, there is no unified standard for defining the concept of emerging technology. In this regard, Rotolo [10] clarified the core elements involved in the concept of emerging technology through a literature review, i.e., the key attributes which qualify a technology as emerging, including radical novelty, coherence, relatively fast growth, prominent impact, uncertainty, and ambiguity. This provides a comprehensive conceptual framework of emerging technology that has been recognized and applied by other scholars in related fields [11,12,13,14,15]. On this basis, this paper will also draw on some key attributes of emerging technology proposed by Rotolo for subsequent research. Considering that the acquisition of knowledge resources by individuals often depends on technology attributes [16], this paper argues that relevant innovation subjects will search and absorb knowledge resources according to the performance of key attributes of emerging technology at the knowledge level, thereby helping their R&D innovation activities of emerging technology. Among them, in addition to knowledge uncertainty, four other knowledge attributes, such as knowledge novelty, knowledge coherence, knowledge growth, and knowledge influence, may promote knowledge interactions among innovation subjects. Therefore, this study focuses on the first four key attributes of emerging technology, analyzes the impact of multiple knowledge attributes of innovation subjects on the establishment of network edges, and then explores the evolution mechanism of emerging technology innovation network.
In addition, the time attribute of technology development should be introduced when discussing the evolution dynamics of emerging technology innovation networks. Especially with the advancement of the new round of technological revolution, the innovation iterations of emerging technology are gradually accelerating. If enterprises and even countries want to occupy a dominant position in the scientific and technological competition, they must grasp the cyclical development law of emerging technology and seize the new opportunities brought by each technological iteration in order to stand out in the increasingly fierce competitive environment. In this context, scholars have made a series of assessments and predictions on development trends in emerging technology using the life cycle theory [17,18,19,20]. From the perspective of network analysis, because the life cycle of emerging technology covers the time attribute, traditional static network research has had difficulties in fully depicting the cyclical evolution dynamics of emerging technology innovation networks; however, the temporal network theory, which has emerged in recent years, provides a new perspective to solve this problem. The discussion on temporal networks mainly focuses on time-irreversible processes, such as relationship building and system evolution [21,22,23,24,25], which can further extend the research dimension on network evolution from a single topological dynamic to a topological–temporal dynamic containing time attributes.
Most research on temporal networks have been conducted at a theoretical level and concentrate on certain aspects, such as system modeling, topology structure, and the spreading dynamics of temporal networks. For example, Perra [26] proposed an activity-driven network model, which is the most well-studied temporal network model. Several studies have been carried out to extend the model and propose modified models of temporal networks, such as the activity–security–trust-driven model [27], the activity-driven model with memory [28], the competition-driven model [29], etc. Some scholars have discussed the topology structures of the temporal network and focused on key nodes [30,31], temporal motifs [32,33,34], community structure [35,36], and other topology structures, such as degree, correlation, path length, clustering coefficient, and entropy [37,38,39,40]. Other studies have explored spreading dynamics in the temporal network, such as information spreading [41,42], knowledge diffusion [43,44], and disease transmission [45,46]. In addition, some studies have applied temporal network analysis to various fields in real-life settings, specifically analyzing temporal networks in financial markets [47,48], the fiscal domain [49], air traffic [50], patent opposition and collaboration [33], etc. It can be seen that temporal networks have received extensive attention and research, providing a more applicable analysis tool for studying most real networks with time attributes.
Based on the above discussion, the study aims to introduce the time attribute of the life cycle of emerging technology into the evolution dynamics of its innovation network, construct an emerging technology temporal innovation network (hereafter, ET-TIN) from a temporal network perspective, and explore the evolution mechanism of ET-TIN and its cyclical evolution dynamics in combination with the life cycle and key attributes of emerging technology. This study makes a marginal contribution to the current literature from three perspectives. First, by introducing the life cycle and key attributes of emerging technology, we can truly reflect the behavior mechanism of emerging technology innovation subjects and the time attributes of their behaviors and then better describe the temporal feature and internal mechanism of innovation network evolution during the cyclical development of emerging technology. Second, we constructed the ET-TIN based on the temporal network model and researched its cyclical evolution mechanism and dynamics, which can extend the research dimension on innovation network evolution from the previous focus on single topological dynamics to the topological–temporal dynamics containing time attributes and enrich the research dimension of innovation network evolution from the perspective of temporal evolution. Third, by simulating the cyclical evolution dynamics of ET-TIN in the complete life cycle of emerging technology development, we can clarify the whole process of the network evolution and predict its future development trend, which is of great practical significance for policy formulation toward network structure optimization and emerging technology development.
The remainder of this paper is structured as follows. Section 2 introduces the construction of ET-TIN and its structure measurement. Section 3 analyzes the innovation subjects’ behaviors and the network evolution mechanism in combination with the life cycle and key attributes of emerging technology and proposes the system framework of ET-TIN evolution. Section 4 presents the simulation design of network evolution with 5G technology as an example. Section 5 describes the simulation results and discusses the cyclical evolution dynamics of the network in various topology characteristics. Finally, the main conclusions are given in Section 6.
2. ET-TIN Construction and Measurement
2.1. ET-TIN Construction
The high complexity and uncertainty of R&D innovation in emerging technology results in heterogeneous innovation subjects being closely related to each other, thus forming an organization structure of innovation network. As shown in Figure 1, in the internal composition of ET-TIN, the network nodes represent core innovation subjects, such as enterprises, universities, and research institutes. According to the innovation prospects at each stage of the life cycle of emerging technology, as well as multiple knowledge attributes based on the key attributes of emerging technology, these innovation subjects will selectively acquire knowledge resources and carry out R&D innovation through knowledge interaction activities, such as patent citation, thus promoting the formation of network edges and the evolution of network structure.
In many actual networks, the edges between nodes have obvious time attributes, such as user communication [51], social interaction [52], and knowledge transfer [53], and are dynamic processes rather than static. In the cyclical development of emerging technologies discussed in this paper, the knowledge interaction among innovation subjects also changes with time. The changes in behavior decisions, such as node joining, exiting, and preferential attachment in each instantaneous network, leads to the intermittent disconnection or reconnection of edges between nodes, making the network edges show discontinuous features in the time dimension. Therefore, during the life cycle of emerging technology, the instantaneous networks generated at each time will constitute the traditional temporal network [54], as shown in Figure 2a. The numbers on the edges of this figure represent the time of knowledge interactions between two nodes. Taking node A as an example, it absorbs the knowledge resources of node B and node D at time and then diffuses its knowledge resources to node B at time .
However, according to Perra’s classic study on the modeling of the temporal network [26], at each time, the instantaneous network is a simple random graph with low average connectivity. For this reason, the above model enables a simple analytical treatment, mainly using the union of all the instantaneous networks obtained at each previous time to effectively observe the topology structures of the temporal network. Therefore, further adjustments were made based on the traditional temporal network, and the instantaneous networks were merged at each time during the cyclical development of emerging technology to form a set of integrated networks, thus constituting the ET-TIN, as shown in Figure 2b. This figure reflects the snapshots of integrated networks at time , formed by merging the instantaneous networks obtained in each previous time.
Based on the above analysis, we can refer to the classic temporal network models [26,54] and define the ET-TIN as follows:
Definition 1:
The ET-TIN refers to a set of integrated networks formed by merging the instantaneous networks at each time in an orderly fashion during the cyclical development of emerging technology. The ET-TIN is recorded as ,, where represents the number of time windows divided according to the life cycle of emerging technology, andrepresent the instantaneous networks and integrated networks under each time window, is the set of instantaneous networks, is the set of network nodes, is the set of network edges, and the elements in the edge set can use a triad to represent the knowledge interaction between node and node at time .
2.2. ET-TIN Measurement
Based on the above concept of ET-TIN, the relevant measurement indicators of network structure can be used to quantitatively analyze the evolution dynamics of its topology. In this regard, this study mainly used the network graph, number of nodes and edges, degree distribution, small-world quotient, and timeliness and quality of the network to describe the evolution process of the scale, scale-free characteristic, small-world characteristic, and self-organizing characteristic of the ET-TIN.
2.2.1. Network Scale
On the one hand, network graphs can directly reflect the evolution dynamics of network scale. On the other hand, the number of nodes and edges are important indicators for the quantitative analysis of network scale, which can be measured by counting the number of innovation subjects involved in the integrated network at each time, such as enterprises, universities, and research institutions, as well as the number of connections between innovation subjects. With the increase in network scale, innovation subjects are more likely to acquire a large number of external knowledge resources to help with R&D innovation activities, which is conducive to the improvement of network innovation efficiency and further promotes the innovation development of emerging technology.
2.2.2. Scale-Free Characteristic of Network
The scale-free characteristic of a complex network is mainly characterized by the phenomenon that the node degree obeys the power law distribution, where the node degree, , refers to the number of edges directly owned by a node and the degree distribution, , describes the probability that a node is randomly selected in the network with degree . If the ET-TIN has the scale-free characteristic, it shows that only a few nodes in the network have larger degrees, hold rich knowledge resources, and are in the core position in the network, whereas most of the nodes have smaller degrees and are in the edge position in the network; thus, the whole network presents obvious non-equilibrium in topology structure.
2.2.3. Small-World Characteristic of Network
Small-world networks usually show characteristics of high aggregation and short path, which can be described by the clustering coefficient and average path length, respectively. However, because these two indicators are independent of each other, this study further applied the small-world quotient (recorded as SWQ) [55,56] which can combine these two indicators to quantitatively analyze the small-world characteristic of ET-TIN. The formula is:
Here, is the small-world quotient of ET-TIN, which is mainly composed of the small-world quotient, , of the integrated network at each time. When is satisfied, it indicates that the network at time is a small-world network with a large clustering coefficient and short average path length, and the larger the indicator value, the more significant the small-world characteristic of the network. and represent the clustering coefficient ratio, , and the average path length ratio, , of the integrated network to the random network with the same scale at time , respectively; for example, the clustering coefficient, , and the average path length, , of the integrated network at time can be expressed as:
Here, is the number of nodes in the network, and are the degree of node and the actual number of edges between its neighbors, and is the shortest path length from node to node .
2.2.4. Self-Organizing Characteristic of Network
As a complex adaptive system with a self-organizing characteristic, the evolution process of a complex network is essentially the formation process of the orderly structure of the network. In general, timeliness entropy and quality entropy can be used to measure the degree of uncertainty in the timeliness and accuracy of information flow in the system, to quantitatively describe the order degree of system structure. On this basis, this study further applied the two indicators of timeliness and quality [57,58] to directly measure the order degree of ET-TIN structure from two perspectives, timeliness and the accuracy of knowledge flow, and then examined the self-organizing characteristic of this network. The formula is:
Here, and are the timeliness and the quality of ET-TIN, respectively, composed of the timeliness, , and quality, , of the integrated network at each time. Higher or values indicate the higher-order degree of the network structure at time in terms of the timeliness or accuracy of knowledge flow, and the faster or more accurate transfer of knowledge resources among nodes. , , , and represent the total timeliness entropy, maximum timeliness entropy, total quality entropy, and maximum quality entropy of the integrated network at time , which can be expressed as follows (where , , and have the same meaning as above):
3. The Modeling of ET-TIN Evolution
An innovation network is a typical complex adaptive system, in which the adaptive behavior of micro-individuals under the stimulation of internal and external environment is the root of the emergence and evolution of system structural characteristics. Therefore, this study mainly analyzed the adaptive behaviors of network nodes, such as joining, retaining, exiting, and preferential attachments under the influence of the life cycle and key attributes of emerging technologies; proposed the evolution mechanism of nodes and edges; and constructed a system framework of network evolution to analyze the whole process of ET-TIN evolution in detail.
3.1. Network Nodes Evolution Mechanism
Nodes changes during the ET-TIN evolution mainly include the joining behavior of new nodes combined with the development prospect of emerging technologies and the retaining and exiting behavior of old nodes based on their knowledge state changes, as shown in Figure 3. Based on this, this paper mainly discusses the network nodes evolution mechanism from two aspects: nodes joining mechanism and nodes retaining and exiting mechanism.
3.1.1. Nodes Joining Mechanism
Nodes joining mechanism is the basic dynamic mechanism for ET-TIN evolution. To obtain knowledge resources of R&D innovation, innovation subjects of emerging technologies pour into the innovation network, which will constantly break the network boundary and its original structure and promote the continuous evolution of network topology. In this process, the number of new nodes added will be affected by the dynamic development prospects of emerging technologies and their market environment and will show a multi-stage, non-linear trend. The development process of emerging technology conforms to the logistic growth principle; therefore, it will experience multiple stages, such as technology germination, growth, maturity, and recession, showing an S-shaped growth trend; thus, the number of new nodes added will also experience low growth, accelerated growth, decelerated growth, and zero growth. Therefore, the number of new nodes added in the network evolution process should follow the cyclical development law of emerging technologies and also conform to the logistic growth model [59], namely:
where represents the cumulative number of new nodes added in the instantaneous network of each phase to the time ; then, the number of new nodes added in the instantaneous network of time is and , , and are the basic parameters in the logistic growth model and can be fitted according to actual data.
3.1.2. Nodes Retaining and Exiting Mechanism
When new nodes join the network to obtain knowledge resources for R&D innovation, the original nodes in the network also exchange and complement knowledge resources through knowledge absorption and diffusion, accordingly changing their knowledge states. Among them, the knowledge states of nodes that absorb enough knowledge inwards or diffuse enough knowledge outwards will grow rapidly, and they can better adapt to the competitive innovation environment with the advantages of knowledge resources, which can be retained in the network. However, the nodes that neither absorb enough knowledge inward nor diffuse enough knowledge outward will exit the network due to the slow growth of knowledge states, insufficient innovation development potential, and inability to overcome the competitive pressure of technology innovation.
On this basis, considering that the in-degree shows how many neighbors from which a node can absorb knowledge, the out-degree indicates how many agents can absorb knowledge from it [60,61]; thus, we used the in-degree and out-degree to represent the amount of knowledge that node absorbs inward and diffuses outward in the instantaneous network at time . The average in-degree and out-degree values of all nodes in the network can represent the average amount of knowledge that nodes absorb inward and diffuse outward; however, this cannot reflect whether the average amount of knowledge is sufficient to support them to adapt to the competitive environment of technological innovation and stay in the innovation network. Thus, this paper further introduced a threshold parameter, (the value of can be adjusted according to the actual data), for the average amount of knowledge absorbed or diffused by nodes to determine whether node has absorbed or diffused sufficient knowledge, based on which the critical knowledge state of its retention or withdrawal from the network can be quantitatively characterized. Therefore, when node in the instantaneous network at time satisfies the conditions shown in Formula (11) (where is the number of nodes in the instantaneous network at time ), it can be retained in the instantaneous network at time and participate in a new round of R&D innovation activities. In contrast, when the node satisfies the conditions shown in Formula (12), it will exit the network at the end of the current period.
3.2. Network Edges Evolution Mechanism
According to the performance of the four key attributes of emerging technology [10] at the knowledge level, edge changes during the ET-TIN evolution are mainly driven by the preferential attachment between nodes based on the novelty, coherence, growth, and influence of knowledge, as shown in Figure 4. Therefore, based on the above four preferential attachment mechanisms with a single knowledge attribute, this paper further proposes a preferential attachment mechanism with multiple knowledge attributes to analyze the edge evolution mechanism of ET-TIN.
3.2.1. Preferential Attachment Mechanism Based on Knowledge Novelty
To adapt to the novelty attribute of emerging technology and the increasingly updated knowledge environment, network nodes usually select other nodes with the high novelty of knowledge to establish an edge and help their R&D innovation by absorbing the novel knowledge from these nodes. For this reason, suppose that node first appears in the instantaneous network at time , if it absorbs knowledge resources inward in the current period (where the in-degree is greater than zero), and then generates new knowledge outcomes through R&D innovation; thus, its knowledge novelty in the current period is set as , otherwise , from which the indicator function , indicating the knowledge novelty of node at time . However, the knowledge novelty of each period will decrease with time; therefore, it is further assumed that the knowledge novelty of node at time will decline to by the time . Based on this, we can measure the average level of node ’s knowledge novelty from time to time by summing up the decay value of node ’s knowledge novelty from time to time , and then calculating the average value. Therefore, the probability, , of node being connected preferentially by other nodes at the beginning of the instantaneous network at time will be determined by its average level of knowledge novelty at the end of the instantaneous network at the previous time , namely:
3.2.2. Preferential Attachment Mechanism Based on Knowledge Coherence
Knowledge coherence is the internal condition for preferential attachment between nodes in the ET-TIN, as well as the leading factor for the convergence of previously separated research streams and convergence in technologies in the process of emerging technology development, thus producing the coherence attribute of emerging technology. During the evolution of this network, nodes with high knowledge coherence usually more easily overcome the resistance to knowledge absorption caused by knowledge exclusivity and understand the hidden knowledge contained therein based on similar knowledge structures and technical experiences, so that knowledge exchange and technology innovation can be carried out more effectively; thus, it is often easier to establish edges between such nodes. On this basis, the method proposed by Jaffe [62], which has been adopted in many studies [63,64,65], can be used to measure the level of knowledge coherence between the two nodes in terms of the included angle between their knowledge structure vectors. Therefore, the probability, , that node is preferentially connected by other nodes (node is taken as an example) at the beginning of the instantaneous network at time will be determined by the level of knowledge coherence between the two nodes at the end of the instantaneous network at the previous time , namely:
where and represent the knowledge structure vector formed by the innovation outputs of node and node in different knowledge domains up to time , respectively, since they joined the network; and denotes the innovation outputs of node in the th knowledge domain.
3.2.3. Preferential Attachment Mechanism Based on Knowledge Growth
Emerging technologies exhibit significant growth, which is reflected in the rapid growth of knowledge outputs, mainly driven by the active R&D innovation behavior of a large number of innovation subjects. In this process, as the key link of R&D innovation, knowledge absorption plays an important role in accelerating innovation outputs. In the ET-TIN, the stronger the knowledge absorption ability of nodes, the more external knowledge resources can be absorbed and utilized to make up for knowledge weaknesses and break through innovation bottlenecks, thus speeding up the R&D innovation and knowledge outputs. Such nodes are more likely to attract other nodes to connect with under more knowledge resources and innovation achievements accumulated through active knowledge absorption and technology innovation. Therefore, the node’s knowledge absorption ability is expressed with its in-degree, and if the in-degree of a node accounts for a higher proportion of the total in-degree of all nodes in the network, this indicates that the more knowledge resources the node absorb inward, the stronger its knowledge absorption ability is. Therefore, the probability, , of node being preferentially connected by other nodes at the beginning of the instantaneous network at time will be determined by the ratio of its in-degree to the total in-degree of all nodes at the end of the instantaneous network at the previous time , namely:
3.2.4. Preferential Attachment Mechanism Based on Knowledge Influence
Emerging technologies have a prominent influence on many aspects, among which the influence shown by emerging technologies through knowledge output requires extensive knowledge diffusion to be truly realized, and the formation of an innovation network provides an important carrier for the effective diffusion of knowledge achievements. However, the knowledge level of each node in the network is different, and the diffusion ability of its internal knowledge is also different. Generally, the stronger the knowledge diffusion ability of a node, the more knowledge resources it diffuses outward, which indicates that the greater the knowledge influence of the node in the network, the more attention its high-quality knowledge outputs receive from more nodes; thus, it is easier to attract other nodes to connect with it. Based on this, the node’s knowledge diffusion ability is expressed with its out-degree, and if the out-degree of a node accounts for a higher proportion of the total out-degree of all nodes in the network, it indicates that the more knowledge resources the node diffuse outward, the stronger its knowledge diffusion ability and the greater its knowledge influence. Therefore, the probability, , of node being connected preferentially by other nodes at the beginning of the instantaneous network at time will be determined by the ratio of its out-degree to the total out-degree of all nodes at the end of the instantaneous network at the previous time , namely:
3.2.5. Preferential Attachment Mechanism Based on Multiple Knowledge Attributes
Based on the above four preferential attachment mechanisms with a single knowledge attribute, we can further propose a preferential attachment mechanism based on multiple knowledge attributes to comprehensively describe the possibility of establishing the edge between two nodes during the process of network evolution. However, while focusing on the above four knowledge attributes, it is also necessary to further consider the possible impacts of the other attributes of nodes and their upper limit of edges on the establishment of edges among the nodes. On the one hand, to solve the problem of random interference caused by other intrinsic attributes of nodes except for knowledge attributes, we can use the fitness model for reference [66,67], apply fitness to describe other intrinsic attributes of nodes, and expand the single preferential attachment condition based on node degree in this model to four preferential attachment conditions based on node knowledge attributes. On the other hand, in the process of network evolution, nodes do not absorb knowledge resources infinitely inwards, but there are upper limits of knowledge absorption influenced by various aspects; therefore, it is necessary to further introduce the parameter representing the upper limit of the knowledge absorption of each node to determine the limit value of the number of edges that can be established by each node. In summary, in each instantaneous network, the probability, , of node being connected preferentially by node should satisfy the following formula:
Considering that Formula (17) is composed of the above four formulas and involves many notations; therefore, the notations involved in calculating this formula can be summarized and divided into three levels, as shown in Table 1.
3.3. System Framework of Network Evolution
The nodes and edges evolution mechanisms of ET-TIN have been detailed, based on which the system framework shown in Figure 5 can be further proposed to describe the dynamic evolution process of the network in detail. It can be seen from Figure 5 that the evolution process of ET-TIN can be broken down into four sub-processes: node evolution, edge evolution, instantaneous networks evolution, and integrated networks evolution. According to the life cycle of emerging technologies, time windows can be divided, and thus, the timeline of network evolution can be established. Based on this, we can further clarify the whole evolution process of ET-TIN by analyzing the integrated networks structures formed by the instantaneous networks composed of constantly changing nodes and edges in each time window.
A specific example of ET-TIN evolution is given in Figure 5, detailing the changes in nodes and edges under the first three-time windows, as well as the structure evolution of the corresponding instantaneous networks and integrated networks. When , given the initial network with a fixed distribution of nodes and edges, the current instantaneous network has the same structure as the integrated network. At the end of the instantaneous network at , the nodes that satisfy the conditions shown in Formula (11) can be retained in the instantaneous network at , while the nodes that satisfy the conditions shown in Formula (12) will exit the network. At the same time, according to Formula (10), a certain number of new nodes will join the network, which, together with the old retained nodes, will form the nodes of the instantaneous network at and new edges will be established through knowledge interactions.
With the addition, retention, and exit of nodes, the edges in the network will also be disconnected and reconnected. To observe the edge reconnection process under different time windows, we can refer to the temporal network evolution model proposed by Perra [26], where all network edges are deleted at the end of each phase of the instantaneous network; then the disconnected nodes will be reconnected based on the probability of Formula (17) in the next phase. In the meantime, the flow and transfer of knowledge resources among nodes changes the knowledge state of nodes, which leads to a new round of node changes. Of these, nodes with a rapidly growing knowledge states can remain in the instantaneous network at ; otherwise, they will exit the network. In addition, the reconnection of the edges between nodes in the instantaneous network at will change the knowledge attributes of nodes, which will affect the preferential attachment between nodes in the instantaneous network at and bring about a new round of changes in the network structure.
According to the above analysis, the changes in nodes’ knowledge states and knowledge attributes caused by edge reconnections in each phase will have an impact on the retention and exit of nodes, as well as the disconnection and reconnection of edges. Analogously, in each time window, the new nodes added and the old nodes retained from previous phase, as well as the edges reconnected between nodes based on the multiple knowledge attributes obtained in the previous phase, will jointly form an instantaneous network structure of the new phase, and the instantaneous network of each phase will be merged in turn to form the integrated network structure under different time windows. Thus, the complete evolution process of ET-TIN can be revealed by observing the integrated network structure under each successive time window based on the timeline of emerging technology cyclical development.
4. The Simulation Design of ET-TIN Evolution
4.1. Data Sources
Among many emerging technologies, 5G technology is expected to become the key element and important fulcrum to promote a new round of technological revolution with its epoch-making technical capabilities, broad application prospects, and driving role on other technologies and will effectively support the high-quality development of economy and society. In this context, this paper took 5G technology as an example, retrieved 5G patents using the Derwent Innovations Index, and constructed a 5G technology temporal innovation network (hereafter 5G-TIN) based on 5G patent data and their citation information as the sample network for this study.
In mobile communications, 5G technology is the concentrated embodiment of decades of innovation accumulation; therefore, it is necessary to increase the period when conducting 5G patent retrieval. Additionally, considering the time lag between patent application and approval, the retrieval period in this study was set to be before 31 December 2018. On this basis, 15,397 data were retrieved based on the 5G key technologies identified in the 5G Concept White Paper issued by the IMT-2020 (5G) Promotion Group, the multiple expressions of the term 5G, and the IPC classification number in the field of telecommunication technology, i.e., category H04. By deleting the patent data in which the patentees are natural persons and those that do not contain citation information, we finally obtained 9827 5G patent data from 1978 to 2018, and their corresponding patent citation relationships among 2226 innovation subjects.
Before the simulation of network evolution, it is necessary to predict the life cycle of 5G technology to determine the simulation time and then simulate the evolution dynamics of 5G-TIN during the full cycle. In this regard, the software LogletLab 4 could be used to fit the changing trends in the cumulative amount of 5G patent applications and, according to the fitting results, the life cycle of 5G technology can be divided into four stages, namely, the germination period, from 1978 to 2012 (Phases 1–35); the growth period, from 2013 to 2021 (Phases 36–44); the maturity period, from 2022 to 2029 (Phases 45–52); and the recession period, after 2030 (after Phase 53). Although 5G technology is projected to enter a recession period after the 53rd phase, in order to simulate the complete evolution dynamics of the network, this study set the simulation iterations as .
4.2. Simulation Steps
Based on the ET-TIN evolution model built above and the values of simulation parameters determined by the relevant statistics of the real network, the following specific simulation parameters and steps can be set in MATLAB to simulate the evolution process of ET-TIN; its simulation flow chart is shown in Figure 6.
Step 1 (setting basic parameters): Through numerical estimations based on actual data and multiple optimizations of simulation results, the basic parameters in the above formulas can be set as , , , and ; is contained in , i.e., a 2226 × 11 knowledge structure vector matrix, , obtained by counting the IPC distribution of 2226 innovation subjects’ patent applications; obeys the normal distribution ; and obeys the power law distribution .
Step 2 (setting the initial network): Taking the real network in 1978 as the initial instantaneous network, , at , which contained six nodes and four directed edges. Then, the cumulative number of new nodes in this instantaneous network can be regarded as , and the integrated network has the same structure as the instantaneous network, that is, . Based on the initial network, the iterative evolution is carried out with time .
Step 3 (nodes retaining and exiting): Calculating the in-degree, , and out-degree, , of each node in the instantaneous network, , and judging whether it can be retained for the next instantaneous network, , according to the conditions shown in Formulas (11) and (12). At the end of time , record the four knowledge attributes of the retained nodes in the current phase, and delete the edges between these nodes. At the next time step, , all nodes will establish new edges based on the preferential attachment mechanism.
Step 4 (new nodes joining): is calculated according to the Formula (10), then new nodes will be added to the instantaneous network at time and the knowledge structure vector of each new node is taken randomly from the knowledge structure vector matrix .
Step 5 (preferential attachment between nodes): The old nodes are retained and the new nodes are added together to form nodes in the instantaneous network, , and further calculate the probability, , of node being connected preferentially by node based on the Formula (17), thereby the nodes will establish new edges. Based on this, the instantaneous network, , is formed and the integrated network, , can be obtained accordingly. Save and output .
Step 6 (repeat steps): Let , return to Step 3, and the new iteration is restarted until the simulation iterations are reached.
5. Results and Discussion
Based on the above simulation steps, this study simulated the cyclical evolution dynamic of 5G-TIN, calculated the changing trend of various topology indicators of the simulation networks, and compared them with corresponding indicators of the real networks to verify the rationality of the ET-TIN evolution model built above.
5.1. Analysis of Network Scale
First, the 5G-TIN was sliced on an annual basis and simulation network snapshots under 80-time windows and real network snapshots under 41-time windows were obtained. It is difficult to display all network snapshots in a limited space; therefore, this study selected some slices of this network and used the network mapping function of the social network analysis software Gephi to draw the simulation network graphs of the 11th, 21st, 31st, and 41st phases, and the real network graphs of 1988, 1998, 2008, and 2018, as shown in Figure 7. Moreover, we also used the community division function in Gephi to identify different communities in the network with different colors, which can further reflect the community structure evolution of simulation networks and real networks.
As shown in Figure 7, the graph evolution trends of the simulation networks and the real networks are similar, with the network scale continuously expanding and the number of nodes and edges increasing. At the same time, both networks gradually exhibit obvious non-equilibrium in topology structure, and there is a significant core–periphery structure, which commonly exists in many innovation networks [68,69,70]. Moreover, Figure 7 shows that the community size and structure of the simulation networks and the real networks also show similar evolution trends. From the figure, it can be identified that both networks gradually form three major communities, namely, green–cyan–blue and red–yellow–orange, and the corresponding size and distribution of each community in both networks are basically the same.
In addition, to quantitatively analyze the evolution of network scale, the number of nodes and edges of the simulation network and the real network under each time window can be calculated, and their evolution trends can be drawn as shown in Figure 8. The simulation networks in periods 1–41 are highly consistent with the real networks in 1978–2018 in terms of the evolution trends of the above two indicators. On this basis, the complete evolution dynamics of the 5G-TIN scale can be revealed by analyzing the changing process of nodes and edges in the 80-phase simulation networks.
In Figure 8, the nodes and edges in the network show an S-shaped growth trend with the cyclical development of 5G technology; the S-shaped growth of other network scales was also observed by Hu and Wang [71], as well as Yang and Chen [72]. In the germination period of 5G technology, the unclear technology development prospect and the complexity and high cost of initial R&D restricted the participation of innovation subjects and the development of R&D activities; thus, the growth rates of both nodes and edges were slow. Since entering the 5G technology growth period, the positive technology development prospects and active R&D environments have attracted a large number of innovation subjects, significantly accelerating the knowledge flow and innovation output and accelerating the growth of nodes and edges. However, with the development of 5G technology entering the maturity period, the technological innovation market has gradually saturated; thus, the number of new nodes will decrease and the growth rate of nodes will slow down. However, due to the knowledge interactions and technology innovations between a large number of original nodes, the network edges will still show an accelerated growth trend. Until entering the 5G technology recession period, it would no longer be able to attract the participation of innovation subjects or the development of R&D activities, and the growth rate of network nodes and edges would gradually decline to zero.
5.2. Analysis of Scale-Free Characteristic of Network
To verify whether the simulation network has the same scale-free characteristic as the real network, i.e., whether its node degree obeys the power law distribution, the node degree data of the 41st simulation network and the real network in 2018 can be extracted to plot the degree distribution of both networks, as shown in Figure 9.
As shown in Figure 9, the degree distributions of the simulation network and the real network both conform to the power law distribution and the long tails of both networks roughly match, indicating that the simulation network can reflect the scale-free characteristic of the real network to a certain extent. From Figure 9, it can be seen that only a few hub nodes in the network have larger degrees, while most nodes have smaller degrees. This phenomenon is mainly because in the long-term network evolution process, a few nodes with outstanding performance in knowledge attributes attract the attention and attachment of a large number of nodes and obtain more resources; thus, their network status keeps rising under their cumulative advantages until they become hub nodes with lager degrees. However, most nodes do not have a significant cumulative advantage in this process, and thus, they have fewer edges and smaller degrees. It is the uneven distribution of the edges between nodes which increasingly intensifies the non-equilibrium in the network and finally evolves into a scale-free network structure where the degree distribution obeys the power law distribution, which is also a common topology structure in many real social networks, such as technology innovation networks [8,73], technology adoption networks [74], etc.
5.3. Analysis of Small-World Characteristic of Network
To observe the evolution dynamics of the small-world characteristic of 5G-TIN, the small-world quotient of the simulation network and the real network in each time window were calculated and their evolution trends were derived, as shown in Figure 10.
Figure 10 shows that the evolution trends in the small-world quotients of the simulation networks and the real networks in the first 41 phases are roughly the same. On this basis, we can further analyze the change process of the small-world quotients of the 80-phase simulation networks to reveal the complete evolution dynamics of the small-world characteristics of the real networks in the full cycle. First, the small-world quotient shows a significant upward trend before entering the 5G technology recession, which indicates that the small-world characteristic of the network is becoming more prominent. This is because, in the first three periods, the frequent knowledge interactions and active R&D activities between innovation subjects promote the nodes to be connected and clustered, which enlarges the clustering coefficient and shortens the average path length, constantly enhancing the network cohesion. However, when the 5G technology development enters a recession period, with the network scale no longer increasing, the scale of groups formed by nodes will also no longer expand; thus, the clustering coefficient will gradually become stable. However, the frequency of knowledge interactions between innovation subjects is significantly reduced, which increases the average path length of the network; therefore, the small-world quotient exhibits a downward trend. In general, the network always has a small-world quotient greater than 1 during its long-term evolution, which is consistent with the research results of Zhao et al. [75] and Fang et al. [76] on the small-world quotient of innovation networks, indicating that the network will always exhibit a significant small-world characteristic.
5.4. Analysis of Self-Organizing Characteristic of Network
Timeliness and quality are important indicators for measuring the order degree of the network structure and reflecting its self-organizing characteristic [77]. These two indicators of the simulation network and the real network in each time window can be calculated and their evolution trends can be drawn, as shown in Figure 11. Figure 11 indicates that the evolution trends of timeliness and quality of the simulation networks are consistent with those of the real networks in the first 41 phases. Thus, we can investigate the complete evolution of the self-organizing characteristic of the real networks by analyzing the change processes of the above two indicators in the 80-phase simulation networks.
From the simulation results of network timeliness, it can be seen that the indicator decreases rapidly in the early period of 5G technology development and then decreases at a slower rate until it gradually stabilizes after entering the recession period of 5G technology. This is due to the small number of nodes and edges in the initial network, which makes the average path length of the network shorter; thus, the knowledge resources can flow rapidly between nodes, resulting in high timeliness of the initial network. However, with the addition of new nodes and the development of R&D activities, the increases in nodes and edges in the network rapidly break the order state of the initial network, slow down the flow of knowledge resources, and rapidly decrease the timeliness of network structure in a short time. Since then, due to the continuous increases in nodes and edges, knowledge flow paths increase with a growth of the network’s hierarchy and the distances of knowledge interactions between nodes continue to lengthen, so that the network timeliness still exhibits a downward trend [78]; however, the rate of decline tends to slow down significantly. Until entering the 5G technology recession period, as the network scale gradually tends to zero growth, the timeliness of the network structure will also gradually become stable.
From the simulation results of network quality, it can be seen that the indicator increases rapidly in the early period of 5G technology germination and then slowly increases to a certain value. However, since the later period of 5G technology germination, it has shown a trend of fluctuating downward and it will gradually become stable until entering the recession period. This is because there are fewer hierarchies and larger spans involved in knowledge flows in the initial network, which result in low quality of the initial network. However, as network edges start to increase, informational divarication decreases with a growth of the network’s hierarchy and a drop of the network’s span, which significantly improves the accuracy of knowledge transfer, leading to the rapid increase in network quality in a short time and then maintaining a slowly rising trend [78]. However, by the later period of 5G technology germination, the growing network scale and increasingly complex network structure causes the knowledge flow to pass through more branches, which reduces the accuracy of knowledge transfer, but each node also continuously optimizes its knowledge acquisition path in this process; thus, the quality of network structure shows a trend of fluctuating downward. Until entering the 5G technology recession period, the network scale and structure will gradually stabilize and the knowledge flow path no longer changes, so the network quality, as well as the network timeliness, will gradually stabilize.
6. Conclusions
6.1. Summary
Numerous real-world systems, such as those in nature, society, and technology, can be modeled as networks [54,79]. To date, most network studies have concentrated on static networks, while ignoring that many real networks undergo topological evolutions over time [79,80]. In particular, the topological evolution of emerging technology innovation networks, in reality, has obvious time attributes and will display temporal features with the cyclical development of emerging technology. Driven by this observation, the ET-TIN was constructed from a temporal network perspective, its evolution model was built in combination with the life cycle and key attributes of emerging technology, and 5G technology was taken as an example to simulate the cyclical evolution dynamics of 5G-TIN. Based on the above results, we can draw the following conclusions.
By comparing and analyzing the similarities between the simulation network and the real network in terms of various topological evolution dynamics, we verified the rationality of the ET-TIN evolution model built in this study. This model reveals that the life cycle of emerging technology, as well as multiple knowledge attributes based on the key attributes of emerging technology, such as knowledge novelty, knowledge coherence, knowledge growth, and knowledge influence, are important factors that affect the evolution process of ET-TIN. These influencing factors will promote the macro-evolution of network topologies by acting on the micro-behaviors of network nodes, such as joining, retaining, exiting, and preferential attachment.
In addition, the ET-TIN evolution model proposed in this paper can effectively simulate the whole process of innovation network evolution during the complete life cycle of emerging technology. By simulating the cyclical evolution dynamics of 5G-TIN, we can see that the network nodes and edges show an S-shaped growth trend with the impact of the cyclical development of 5G technology. Moreover, the 5G-TIN exhibits significant scale-free and small-world characteristics, where the small-world characteristic of the network will be constantly highlighted before the 5G technology recession, indicating a gradual improvement in network cohesion. Additionally, during the self-organizing evolution of 5G-TIN, the timeliness and quality of the network structure show a monotonous downward trend and an upward–downward trend, respectively, indicating that the growing network scale and increasingly complex network structure will lead to a gradual decline in the timeliness and accuracy of knowledge transfer among network nodes.
In summary, this study has provided a more realistic framework to describe the internal mechanism and time attribute of the cyclical evolution of emerging technology innovation network in reality, which could extend the research dimension on innovation network evolution from the previous focus on single topological dynamics to the topological–temporal dynamics containing time attributes and contribute to the existing relevant literature from the perspective of temporal evolution. Moreover, on a practical level, this study clarifies the whole process of the network topology evolution by simulating the cyclical evolution dynamics of ET-TIN, based on which it can also provide theoretical references for optimizing the network evolution path, thus accelerating the innovation development of emerging technology.
6.2. Suggestions
Based on the cyclical evolution law of 5G-TIN summarized in this paper, we can further propose corresponding suggestions to optimize the network structure and promote the technology development.
First, before 5G technology enters the recession period, the network scale will continue to expand, which means that the innovation output of the network will remain at a high level. Therefore, in reality, the R&D activities and innovation output of enterprises, universities, and research institutions should continue to be guaranteed, so as to provide basic technical support for the commercial application and development of 5G technology.
Second, the network shows a significant small-world characteristic, indicating that the local agglomeration phenomenon in the network is becoming more and more obvious. Accordingly, in reality, we should also actively strengthen the endogenous power of innovation agglomeration among innovation subjects, strive to expand the innovation clusters already formed in the network, and vigorously exert their potential agglomeration effects and radiation effects, thus forming a 5G innovation development pattern from point to area.
Third, the scale-free characteristic of the network shows that the non-equilibrium within the network will gradually be highlighted and that there are a few core nodes and many peripheral nodes in the network. In this regard, we should give full play to the leading role of core innovation subjects and promote the establishment of knowledge interactions between them and peripheral innovation subjects, so as to further explore the unused innovation interaction space within the network.
Finally, considering that the timeliness and quality of the network structure will gradually show a downward trend, the dynamic tracking and timely interchange of knowledge resources should be realized through actively building resource-sharing platforms and information management systems, which can improve the efficiency and reduce the obstacles of knowledge transfer, thus improving the timeliness and accuracy of knowledge transfer within the network.
6.3. Limitations and Future Research Directions
However, this study also has some limitations that need to be improved in future research. First, the knowledge intensity and R&D complexity of emerging technology make knowledge interaction between innovation subjects a complex process, and by mainly focusing on the impact of multiple knowledge attributes based on the key attributes of emerging technology on knowledge interaction between nodes, we simplify other potential factors, such as knowledge stickiness, knowledge transfer willingness, and knowledge transfer channels. Therefore, further research is needed to construct the ET-TIN evolution model containing more key factors. Second, as a complex system in reality, emerging technology innovation is not only influenced by the endogenous mechanism discussed in this paper, such as the nodes and edges evolution mechanism but also may be affected by various external factors, such as R&D markets and government policies, which could be further discussed in the future. Finally, we only used 5G technology as an example to conduct network evolution simulation; future research on the evolution of ET-TIN could also be carried out on the basis of multi-case analysis, which will help us to further understand the cyclical evolution dynamics of innovation networks for different types of emerging technologies.
Author Contributions
Conceptualization, Y.L. and Q.Y.; methodology, Y.L. and Q.Y.; software, Y.L. and Y.C.; validation, Y.L., Q.H. and Q.Y.; formal analysis, Y.L.; investigation, Q.H.; resources, Y.L. and Q.Y.; data curation, Y.L.; writing—original draft preparation, Y.L.; writing—review and editing, Y.L., Y.C. and Q.H.; visualization, Y.L.; supervision, Q.Y.; project administration, Y.L.; funding acquisition, Q.Y. All authors have read and agreed to the published version of the manuscript.
Funding
This research was funded by the National Social Science Foundation of China, grant number 22AZD137, and the National Natural Science Foundation of China, grant number 72274147.
Data Availability Statement
The data presented in this study are available in the Derwent Innovations Index, https://www.webofscience.com/wos/diidw/basic-search accessed on 19 December 2022.
Conflicts of Interest
The authors declare no conflict of interest.
References
- van der Pol, J.; Rameshkoumar, J.P. The co-evolution of knowledge and collaboration networks: The role of the technology life-cycle. Scientometrics 2018, 114, 307–323. [Google Scholar] [CrossRef]
- Cabeza-Pulles, D.; Fernandez-Perez, V.; Isabel Roldan-Bravo, M. Internal networking and innovation ambidexterity: The mediating role of knowledge management processes in university research. Eur. Manag. J. 2020, 38, 450–461. [Google Scholar] [CrossRef]
- Benhayoun, L.; Le Dain, M.-A.; Dominguez-Pery, C.; Lyons, A.C. SMEs embedded in collaborative innovation networks: How to measure their absorptive capacity? Technol. Forecast. Soc. Change 2020, 159, 120196. [Google Scholar] [CrossRef]
- Qiao, T.; Shan, W.; Zhang, M.; Liu, C. How to facilitate knowledge diffusion in complex networks: The roles of network structure, knowledge role distribution and selection rule. Int. J. Inf. Manag. 2019, 47, 152–167. [Google Scholar] [CrossRef]
- Meng, X.; Liu, M.; Wang, J. Innovation network economic model of new energy automobile industry based on social network perspective. J. Therm. Anal. Calorim. 2021, 144, 1671–1680. [Google Scholar] [CrossRef]
- Han, J.; Guo, J.-E.; Cai, X.; Lv, C.; Lev, B. An analysis on strategy evolution of research & development in cooperative innovation network of new energy vehicle within policy transition period. Omega-Int. J. Manag. Sci. 2022, 112, 102686. [Google Scholar] [CrossRef]
- Wei, F.; Sheng, D.; Lili, W. Evolutionary Model and Simulation Research of Collaborative Innovation Network: A Case Study of Artificial Intelligence Industry. Discret. Dyn. Nat. Soc. 2018, 2018, 4371528. [Google Scholar] [CrossRef]
- Tu, M.; Dall’erba, S.; Ye, M.Q. Spatial and Temporal Evolution of the Chinese Artificial Intelligence Innovation Network. Sustainability 2022, 14, 5448. [Google Scholar] [CrossRef]
- Lyu, Y.; Zhu, Y.; Han, S.; He, B.; Bao, L. Open innovation and innovation “Radicalness”-the moderating effect of network embeddedness. Technol. Soc. 2020, 62, 101292. [Google Scholar] [CrossRef]
- Rotolo, D.; Hicks, D.; Martin, B.R. What is an emerging technology? Res. Policy 2015, 44, 1827–1843. [Google Scholar] [CrossRef] [Green Version]
- Kwon, S.; Liu, X.Y.; Porter, A.L.; Youtie, J. Research addressing emerging technological ideas has greater scientific impact. Res. Policy 2019, 48, 103834. [Google Scholar] [CrossRef]
- Xu, S.; Hao, L.Y.; Yang, G.C.; Lu, K.; An, X. A topic models based framework for detecting and forecasting emerging technologies. Technol. Forecast. Soc. Change 2021, 162, 120366. [Google Scholar] [CrossRef]
- Borge, L.; Wustmans, M.; Broring, S. Assessing Interdisciplinary Research Within an Emerging Technology Network: A Novel Approach Based on Patents in the Field of Bioplastics. IEEE Trans. Eng. Manag. 2022, 1–18. [Google Scholar] [CrossRef]
- Kim, Y. Exploring Emerging Technologies with Analysis of Bibliographic Data Focused on Plasma Surface Treatment. Coatings 2021, 11, 1291. [Google Scholar] [CrossRef]
- Haessler, P.; Giones, F.; Brem, A. The who and how of commercializing emerging technologies: A technology-focused review. Technovation 2022, 102637. [Google Scholar] [CrossRef]
- Steensma, H.K.; Corley, K.G. On the performance of technology-sourcing partnerships: The interaction between partner interdependence and technology attributes. Acad. Manag. J. 2000, 43, 1045–1067. [Google Scholar] [CrossRef]
- Yoon, J.; Jeong, B.; Lee, W.H.; Kim, J. Tracing the Evolving Trends in Electronic Skin (e-Skin) Technology Using Growth Curve and Technology Position-Based Patent Bibliometrics. IEEE Access 2018, 6, 26530–26542. [Google Scholar] [CrossRef]
- Bergerson, J.; Cucurachi, S.; Seager, T.P. Bringing a life cycle perspective to emerging technology development. J. Ind. Ecol. 2020, 24, 6–10. [Google Scholar] [CrossRef]
- Altuntas, S.; Erdogan, Z.; Dereli, T. A clustering-based approach for the evaluation of candidate emerging technologies. Scientometrics 2020, 124, 1157–1177. [Google Scholar] [CrossRef]
- Cauthen, K.; Rai, P.; Hale, N.; Freeman, L.; Ray, J. Detecting technological maturity from bibliometric patterns. Expert Syst. Appl. 2022, 201, 117177. [Google Scholar] [CrossRef]
- Li, A.; Zhou, L.; Su, Q.; Cornelius, S.P.; Liu, Y.Y.; Wang, L.; Levin, S.A. Evolution of cooperation on temporal networks. Nat. Commun. 2020, 11, y2259. [Google Scholar] [CrossRef] [PubMed]
- Tang, D.S.; Du, W.B.; Shekhtman, L.; Wang, Y.J.; Havlin, S.; Cao, X.B.; Yan, G. Predictability of real temporal networks. Natl. Sci. Rev. 2020, 7, 929–937. [Google Scholar] [CrossRef] [PubMed]
- Li, H.C.; Zhang, X.; Zhao, C.L. Explaining social events through community evolution on temporal networks. Appl. Math. Comput. 2021, 404, 126148. [Google Scholar] [CrossRef]
- Gelardi, V.; Le Bail, D.; Barrat, A.; Claidiere, N. From temporal network data to the dynamics of social relationships. Proc. R. Soc. B Biol. Sci. 2021, 288, 20211164. [Google Scholar] [CrossRef] [PubMed]
- Seabrook, I.E.; Barucca, P.; Caccioli, F. Evaluating structural edge importance in temporal networks. EPJ Data Sci. 2021, 10, 23. [Google Scholar] [CrossRef]
- Perra, N.; Goncalves, B.; Pastor-Satorras, R.; Vespignani, A. Activity driven modeling of time varying networks. Sci. Rep. 2012, 2, 469. [Google Scholar] [CrossRef]
- Wang, J.; Xu, J.K.; Liu, Y.H.; Deng, W.W. AST: Activity-Security-Trust driven modeling of time varying networks. Sci. Rep. 2016, 6, 21352. [Google Scholar] [CrossRef]
- Kim, H.; Ha, M.; Jeong, H. Dynamic topologies of activity-driven temporal networks with memory. Phys. Rev. E 2018, 97, 062148. [Google Scholar] [CrossRef]
- Zhu, K.J.; Fletcher, G.; Yakovets, N. Competition-driven modeling of temporal networks. EPJ Data Sci. 2021, 10, 30. [Google Scholar] [CrossRef]
- Qu, C.Q.; Zhan, X.X.; Wang, G.H.; Wu, J.L.; Zhang, Z.K. Temporal information gathering process for node ranking in time-varying networks. Chaos 2019, 29, 033116. [Google Scholar] [CrossRef]
- Yu, E.Y.; Fu, Y.; Chen, X.; Xie, M.; Chen, D.B. Identifying critical nodes in temporal networks by network embedding. Sci. Rep. 2020, 10, 12494. [Google Scholar] [CrossRef] [PubMed]
- Sun, X.L.; Tan, Y.S.; Wu, Q.B.; Chen, B.Z.; Shen, C.X. TM-Miner:TFS-Based Algorithm for Mining Temporal Motifs in Large Temporal Network. IEEE Access 2019, 7, 49778–49789. [Google Scholar] [CrossRef]
- Liu, P.H.; Masuda, N.; Kito, T.; Sariyuce, A.E. Temporal motifs in patent opposition and collaboration networks. Sci. Rep. 2022, 12, 1917. [Google Scholar] [CrossRef]
- Liu, P.; Guarrasi, V.; Sariyuce, A.E. Temporal Network Motifs: Models, Limitations, Evaluation. IEEE Trans. Knowl. Data Eng. 2023, 35, 945–957. [Google Scholar] [CrossRef]
- Qin, H.C.; Li, R.H.; Yuan, Y.; Wang, G.R.; Yang, W.H.; Qin, L. Periodic Communities Mining in Temporal Networks: Concepts and Algorithms. IEEE Trans. Knowl. Data Eng. 2020, 34, 3927–3945. [Google Scholar] [CrossRef]
- Pereira, L.R.; Lopes, R.J.; Louca, J. Community identity in a temporal network: A taxonomy proposal. Ecol. Complex. 2021, 45, 100904. [Google Scholar] [CrossRef]
- Pan, R.K.; Saramaki, J. Path lengths, correlations, and centrality in temporal networks. Phys. Rev. E 2011, 84, 016105. [Google Scholar] [CrossRef]
- Chen, D.B. Empirical study on structural properties in temporal networks under different time scales. Eur. Phys. J. B 2015, 88, 320. [Google Scholar] [CrossRef]
- Batagelj, V.; Praprotnik, S. An algebraic approach to temporal network analysis based on temporal quantities. Soc. Netw. Anal. Min. 2016, 6, 28. [Google Scholar] [CrossRef]
- Wang, D.J.; Yu, W.; Zou, X.F. Tensor-based mathematical framework and new centralities for temporal multilayer networks. Inf. Sci. 2020, 512, 563–580. [Google Scholar] [CrossRef]
- Zhan, X.X.; Hanjalic, A.; Wang, H.J. Information diffusion backbones in temporal networks. Sci. Rep. 2019, 9, 6798. [Google Scholar] [CrossRef]
- Zhong, L.F.; Bai, Y.; Liu, C.J.; Du, J.; Pan, W.J. Information Spreading on Memory Activity-Driven Temporal Networks. Complexity 2021, 2021, 8015191. [Google Scholar] [CrossRef]
- Zhu, H.; Ma, J. Knowledge diffusion in complex networks by considering time-varying information channels. Phys. A 2018, 494, 225–235. [Google Scholar] [CrossRef]
- Sun, Y.; Latora, V. The evolution of knowledge within and across fields in modern physics. Sci. Rep. 2020, 10, 12097. [Google Scholar] [CrossRef]
- Koher, A.; Lentz, H.H.K.; Gleeson, J.P.; Hovel, P. Contact-Based Model for Epidemic Spreading on Temporal Networks. Phys. Rev. X 2019, 9, 031017. [Google Scholar] [CrossRef]
- Masuda, N.; Miller, J.C.; Holme, P. Concurrency measures in the era of temporal network epidemiology: A review. J. R. Soc. Interface 2021, 18, 20210019. [Google Scholar] [CrossRef] [PubMed]
- Guleva, V.Y.; Bochenina, K.O.; Skvorcova, M.V.; Boukhanovsky, A.V. A Simulation Tool for Exploring the Evolution of Temporal Interbank Networks. JASSS J. Artif. Soc. Soc. Simul. 2017, 20, 15. [Google Scholar] [CrossRef]
- Zhao, L.F.; Wang, G.J.; Wang, M.G.; Bao, W.Q.; Li, W.; Stanley, H.E. Stock market as temporal network. Phys. A 2018, 506, 1104–1112. [Google Scholar] [CrossRef]
- Didimo, W.; Grilli, L.; Liotta, G.; Montecchiani, F.; Pagliuca, D. Visual querying and analysis of temporal fiscal networks. Inf. Sci. 2019, 505, 406–421. [Google Scholar] [CrossRef]
- Cai, Q.; Alam, S.; Duong, V.N. A Spatial-Temporal Network Perspective for the Propagation Dynamics of Air Traffic Delays. Engineering 2021, 7, 452–464. [Google Scholar] [CrossRef]
- Urena-Carrion, J.; Saramaki, J.; Kivela, M. Estimating tie strength in social networks using temporal communication data. EPJ Data Sci. 2020, 9, 37. [Google Scholar] [CrossRef]
- Shinkuma, R.; Sugimoto, Y.; Inagaki, Y. Weighted network graph for interpersonal communication with temporal regularity. Soft Comput. 2019, 23, 3037–3051. [Google Scholar] [CrossRef]
- Li, X.G.; Li, X.K. The Impact of Different Internet Application Contexts on Knowledge Transfer between Enterprises. Systems 2021, 9, 87. [Google Scholar] [CrossRef]
- Holme, P.; Saramaki, J. Temporal networks. Phys. Rep. Rev. Sect. Phys. Lett. 2012, 519, 97–125. [Google Scholar] [CrossRef]
- Uzzi, B.; Spiro, J. Collaboration and creativity: The small world problem. Am. J. Sociol. 2005, 111, 447–504. [Google Scholar] [CrossRef]
- Yan, Y.; Zhang, J.; Guan, J. Network Embeddedness and Innovation: Evidence from the Alternative Energy Field. IEEE Trans. Eng. Manag. 2020, 67, 769–782. [Google Scholar] [CrossRef]
- Wang, Z.-X.; He, L.-Y.; Li, D.-D. Assessment of the degree of order in the organisational structure of electricity regulatory institution in China based on shannon entropy. Energy Policy 2019, 132, 429–439. [Google Scholar] [CrossRef]
- Zhang, Z.; Liu, J.; Li, Y.; David, J. An Appraisal of Manufacturing Structures Using Timeliness-Quality Entropy and Order Index Methods. IEEE Access 2021, 9, 141589–141598. [Google Scholar] [CrossRef]
- Campani, M.; Vaglio, R. A simple interpretation of the growth of scientific/technological research impact leading to hype-type evolution curves. Scientometrics 2015, 103, 75–83. [Google Scholar] [CrossRef]
- Zhuang, E.; Chen, G.; Feng, G. A network model of knowledge accumulation through diffusion and upgrade. Phys. A 2011, 390, 2582–2592. [Google Scholar] [CrossRef]
- Lee, S.; Kim, W.; Lee, H.; Jeon, J. Identifying the structure of knowledge networks in the US mobile ecosystems: Patent citation analysis. Technol. Anal. Strateg. Manag. 2016, 28, 411–434. [Google Scholar] [CrossRef]
- Jaffe, A.B. Technological opportunity and spillovers of R&D: Evidence from firms’ patents, profits and market value. Am. Econ. Rev. 1986, 76, 984–1001. [Google Scholar] [CrossRef]
- Isaksson, O.H.D.; Simeth, M.; Seifert, R.W. Knowledge spillovers in the supply chain: Evidence from the high tech sectors. Res. Policy 2016, 45, 699–706. [Google Scholar] [CrossRef]
- Chen, H.; Xie, F. How technological proximity affect collaborative innovation? An empirical study of China’s Beijing-Tianjin-Hebei region. J. Manag. Anal. 2018, 5, 287–308. [Google Scholar] [CrossRef]
- Arvanitis, S.; Seliger, F.; Woerter, M. Knowledge Spillovers, Competition and Innovation Success. Oxf. Bull. Econ. Stat. 2020, 82, 1017–1041. [Google Scholar] [CrossRef]
- Bianconi, G.; Barabasi, A.L. Competition and multiscaling in evolving networks. Europhys. Lett. 2001, 54, 436–442. [Google Scholar] [CrossRef]
- Tsiotas, D. Detecting differences in the topology of scale-free networks grown under time-dynamic topological fitness. Sci. Rep. 2020, 10, 10630. [Google Scholar] [CrossRef] [PubMed]
- Xie, Q.; Su, J. The spatial-temporal complexity and dynamics of research collaboration: Evidence from 297 cities in China (1985–2016). Technol. Forecast. Soc. Chang. 2021, 162, 120390. [Google Scholar] [CrossRef]
- Li, Y.; Zhang, Y.; Lee, C.-C.; Li, J. Structural characteristics and determinants of an international green technological collaboration network. J. Clean. Prod. 2021, 324, 129258. [Google Scholar] [CrossRef]
- Li, Y.; Zhu, Z.; Guan, Y.; Kang, Y. Research on the structural features and influence mechanism of the green ICT transnational cooperation network. Econ. Anal. Policy 2022, 75, 734–749. [Google Scholar] [CrossRef]
- Hu, H.; Wang, X. Evolution of a large online social network. Phys. Lett. A 2009, 373, 1105–1110. [Google Scholar] [CrossRef]
- Yang, Y.; Chen, Q.; Liu, W. The structural evolution of an online discussion network. Phys. A 2010, 389, 5871–5877. [Google Scholar] [CrossRef]
- Yu, X.K.; Cui, Y.; Chen, Y.L.; Chang, I.S.; Wu, J. The drivers of collaborative innovation of the comprehensive utilization technologies of coal fly ash in China: A network analysis. Environ. Sci. Pollut. Res. 2022, 29, 56291–56308. [Google Scholar] [CrossRef] [PubMed]
- Dou, Y.D.; Bo, Q.W. Characteristics and Dynamics of BIM Adoption in China: Social Network Analysis. J. Constr. Eng. Manag. 2022, 148, 04022025. [Google Scholar] [CrossRef]
- Zhao, Q.J.; Guan, J.C. International collaboration of three ‘giants’ with the G7 countries in emerging nanobiopharmaceuticals. Scientometrics 2011, 87, 159–170. [Google Scholar] [CrossRef]
- Fang, W.; Xiao, L.M. Simulation of Knowledge Transfer Process Model Between Universities: A Perspective of Cluster Innovation Network. Complexity 2018, 2018, 5983531. [Google Scholar] [CrossRef]
- Yang, H.; Yang, C.; Zhang, X.; Yuan, X. Influences of Different Architectures on the Thermodynamic Performance and Network Structure of Aircraft Environmental Control System. Entropy 2021, 23, 855. [Google Scholar] [CrossRef]
- Zhang, Z.; David, J. Structural order measure of manufacturing systems based on an information-theoretic approach. Expert Syst. Appl. 2020, 158, 113636. [Google Scholar] [CrossRef]
- Dai, Z.X.; Chen, Y.; Li, J.H.; Fam, J.; Bezerianos, A.; Sun, Y. Temporal efficiency evaluation and small-worldness characterization in temporal networks. Sci. Rep. 2016, 6, 34291. [Google Scholar] [CrossRef]
- Waniek, M.; Holme, P.; Rahwan, T. Hiding in Temporal Networks. IEEE Trans. Netw. Sci. Eng. 2022, 9, 1645–1657. [Google Scholar] [CrossRef]
Figure 1.
The internal composition of ET-TIN.

Figure 2.
Diagram of instantaneous networks and integrated networks. Here, (a) reflects instantaneous networks, and the numbers on the edges represent the time of knowledge interactions between nodes A, B, C and D; (b) reflects the integrated networks at time .
Figure 2.
Diagram of instantaneous networks and integrated networks. Here, (a) reflects instantaneous networks, and the numbers on the edges represent the time of knowledge interactions between nodes A, B, C and D; (b) reflects the integrated networks at time .

Figure 3.
Diagram of network nodes evolution.

Figure 4.
Diagram of network edges evolution.

Figure 5.
System framework of ET-TIN evolution. Here, ➀ and ![Systems 11 00082 i001]() , ➁ and
, ➁ and ![Systems 11 00082 i002]() , and ➂ and
, and ➂ and ![Systems 11 00082 i003]() indicate that nodes join, retain, and exit the network according to Formula (10), Formula (11), and Formula (12), respectively; ➃ indicates that the new nodes added and the old nodes retained are connected preferentially according to Formula (17); ⊕ indicates that the instantaneous networks under each time window are merged to form the integrated networks structures.
indicate that nodes join, retain, and exit the network according to Formula (10), Formula (11), and Formula (12), respectively; ➃ indicates that the new nodes added and the old nodes retained are connected preferentially according to Formula (17); ⊕ indicates that the instantaneous networks under each time window are merged to form the integrated networks structures.
 , ➁ and
  , and ➂ and
  indicate that nodes join, retain, and exit the network according to Formula (10), Formula (11), and Formula (12), respectively; ➃ indicates that the new nodes added and the old nodes retained are connected preferentially according to Formula (17); ⊕ indicates that the instantaneous networks under each time window are merged to form the integrated networks structures.
Figure 5.
System framework of ET-TIN evolution. Here, ➀ and ![Systems 11 00082 i001]() , ➁ and
, ➁ and ![Systems 11 00082 i002]() , and ➂ and
, and ➂ and ![Systems 11 00082 i003]() indicate that nodes join, retain, and exit the network according to Formula (10), Formula (11), and Formula (12), respectively; ➃ indicates that the new nodes added and the old nodes retained are connected preferentially according to Formula (17); ⊕ indicates that the instantaneous networks under each time window are merged to form the integrated networks structures.
indicate that nodes join, retain, and exit the network according to Formula (10), Formula (11), and Formula (12), respectively; ➃ indicates that the new nodes added and the old nodes retained are connected preferentially according to Formula (17); ⊕ indicates that the instantaneous networks under each time window are merged to form the integrated networks structures.
, ➁ and , and ➂ and indicate that nodes join, retain, and exit the network according to Formula (10), Formula (11), and Formula (12), respectively; ➃ indicates that the new nodes added and the old nodes retained are connected preferentially according to Formula (17); ⊕ indicates that the instantaneous networks under each time window are merged to form the integrated networks structures.
Figure 6.
Simulation flow chart of ET-TIN evolution.

Figure 7.
Simulation and empirical results of network graph evolution. Here, the colors of nodes and edges represent the communities to which they belong and different colors represent different communities in the network.
Figure 7.
Simulation and empirical results of network graph evolution. Here, the colors of nodes and edges represent the communities to which they belong and different colors represent different communities in the network.


Figure 8.
Simulation and empirical results of nodes and edges evolution.

Figure 9.
Simulation and empirical results of degree distribution.

Figure 10.
Simulation and empirical results of small-world quotient evolution.

Figure 11.
Simulation and empirical results of network timeliness and quality evolution.


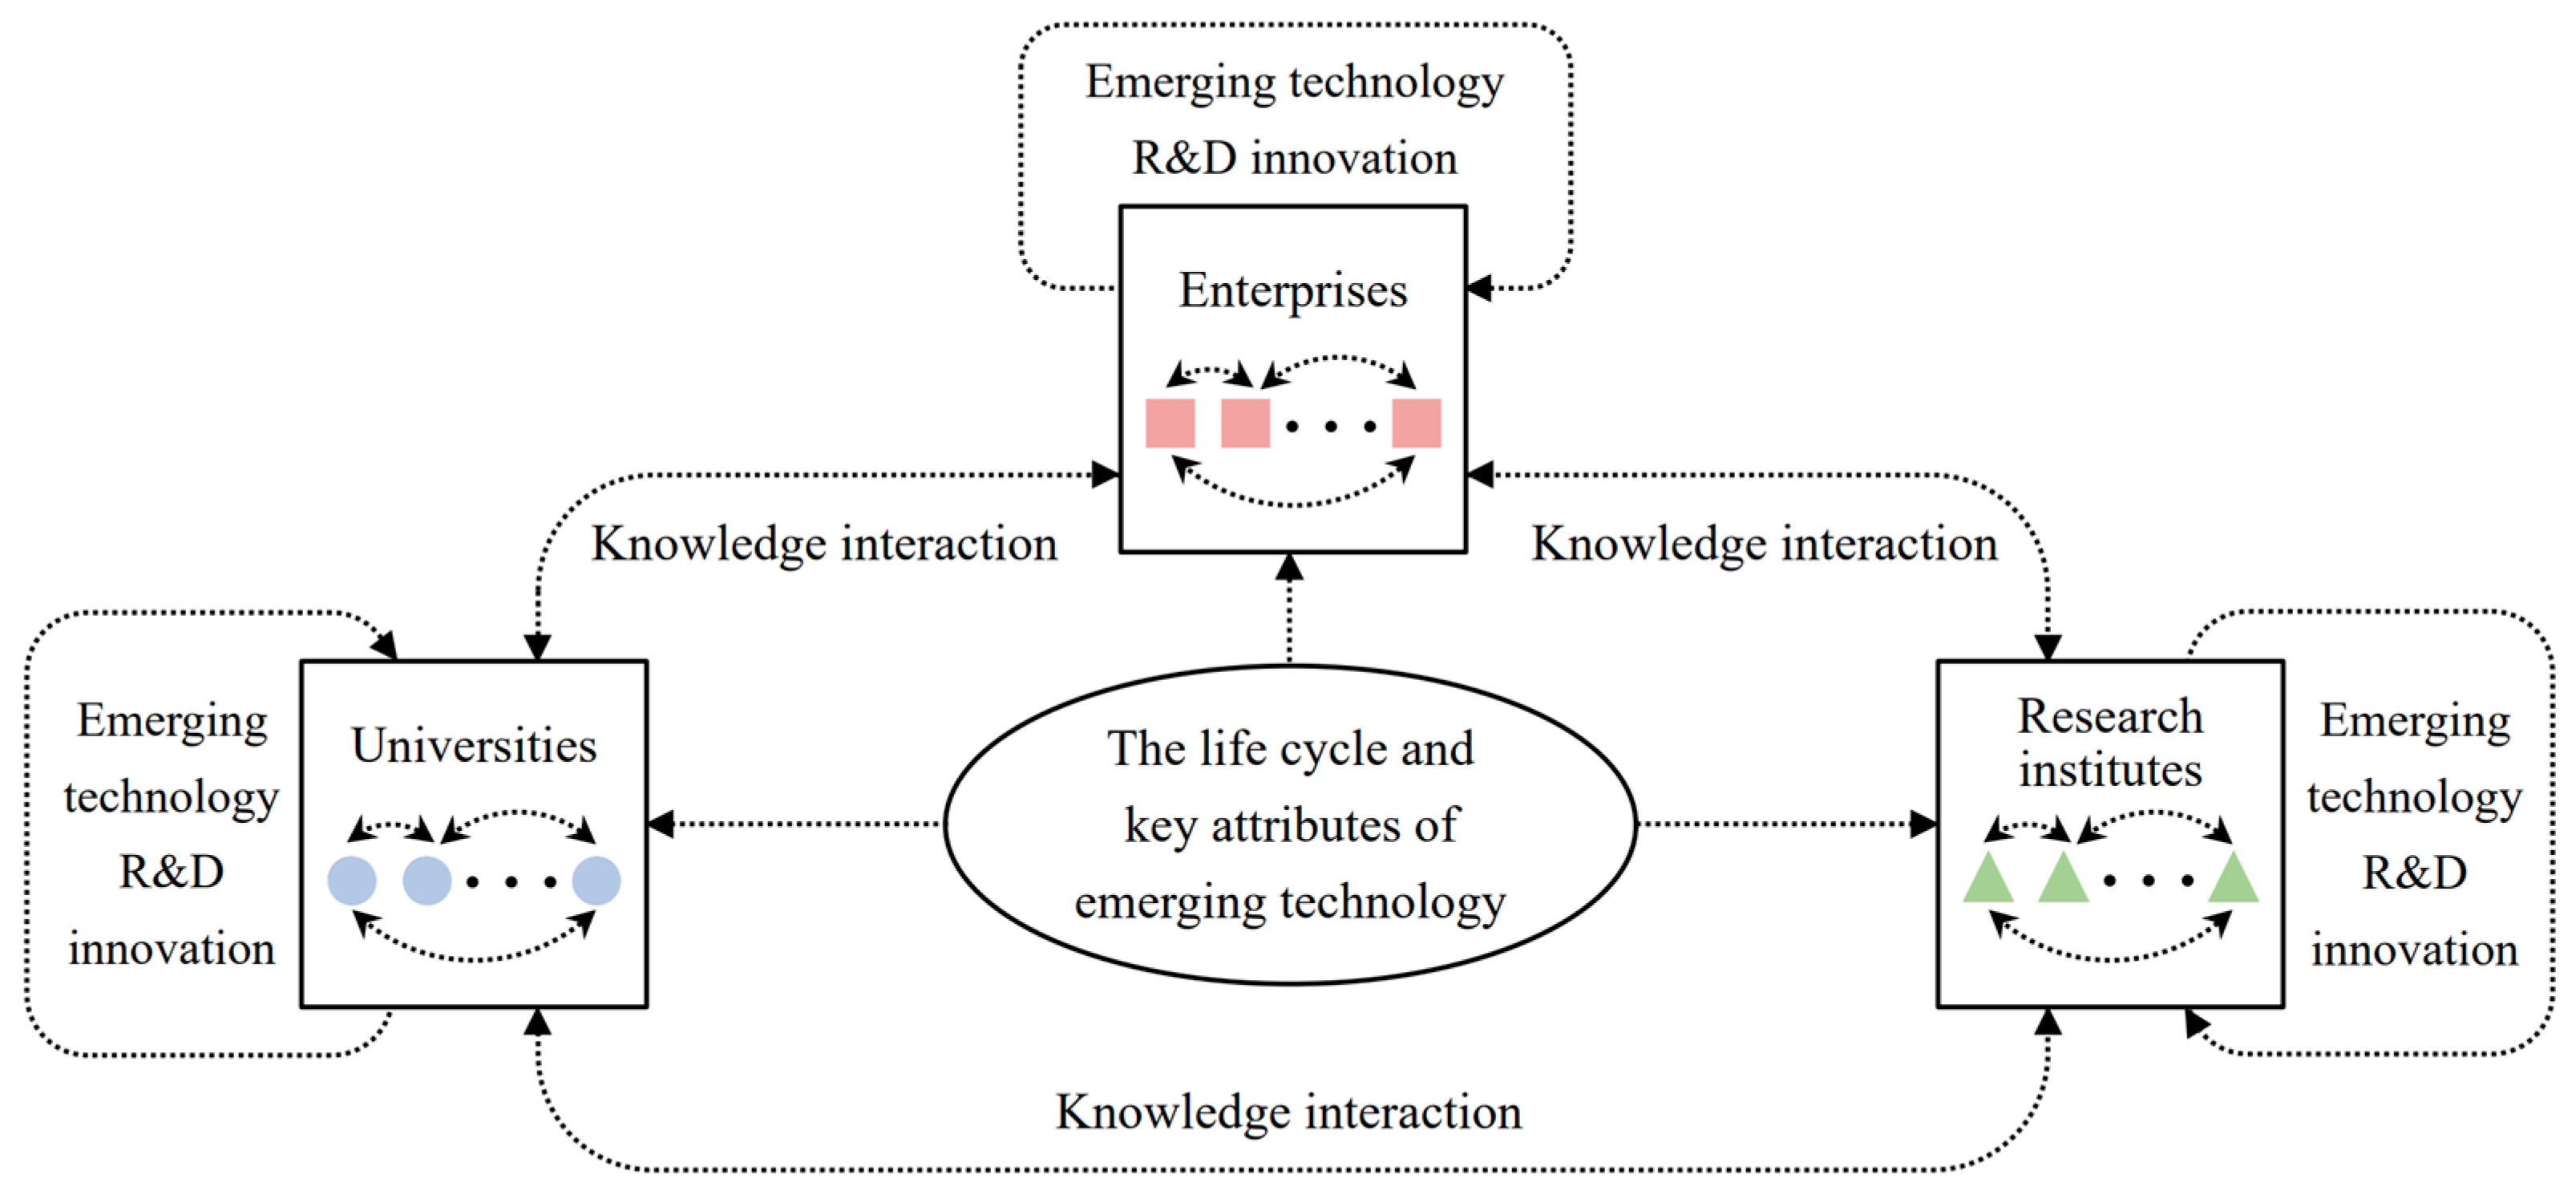
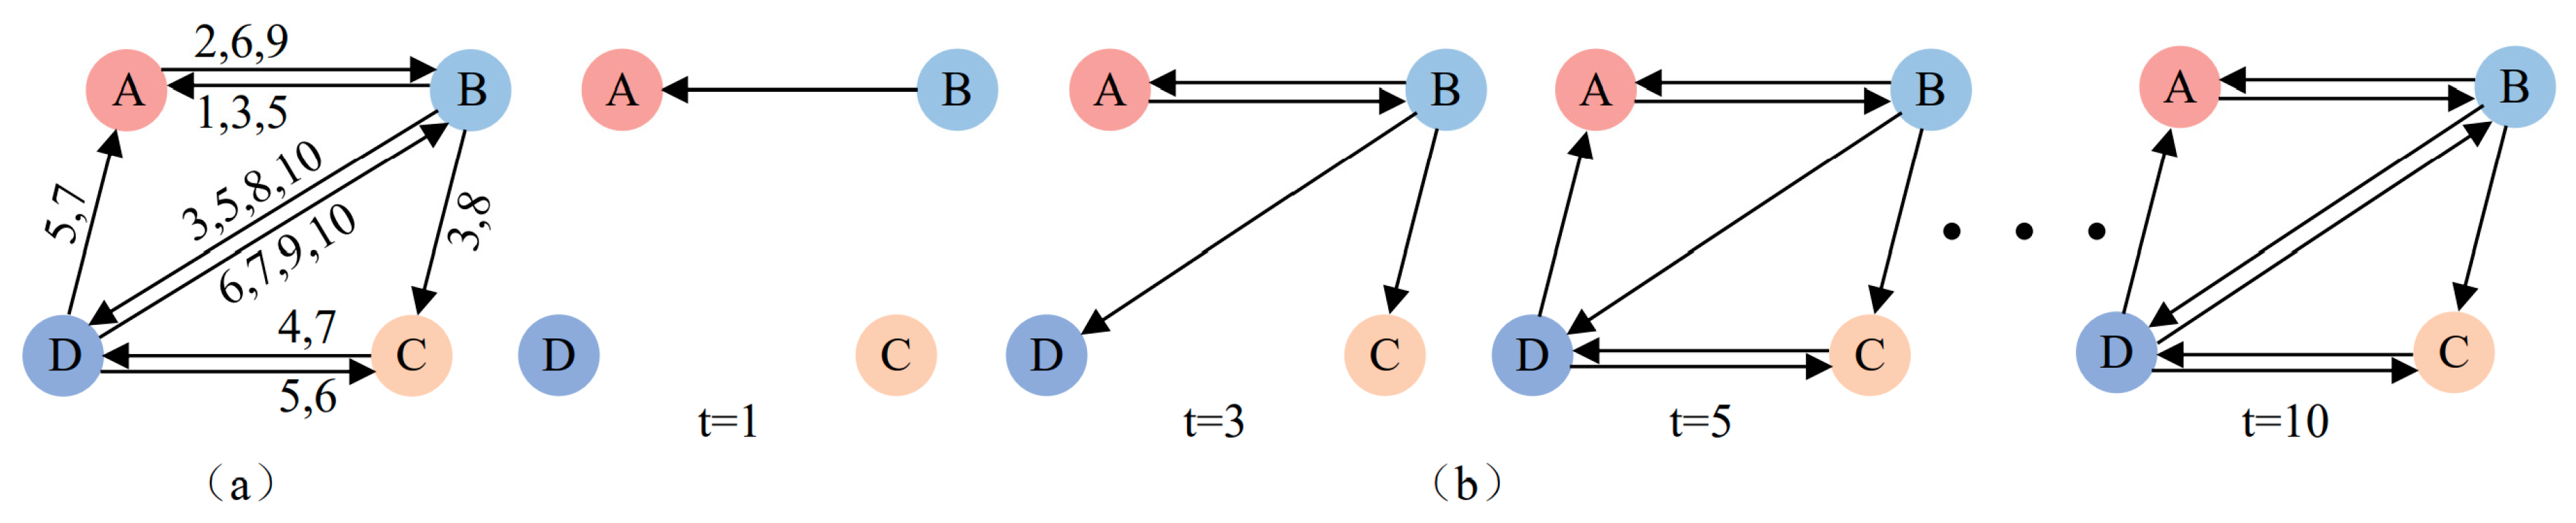
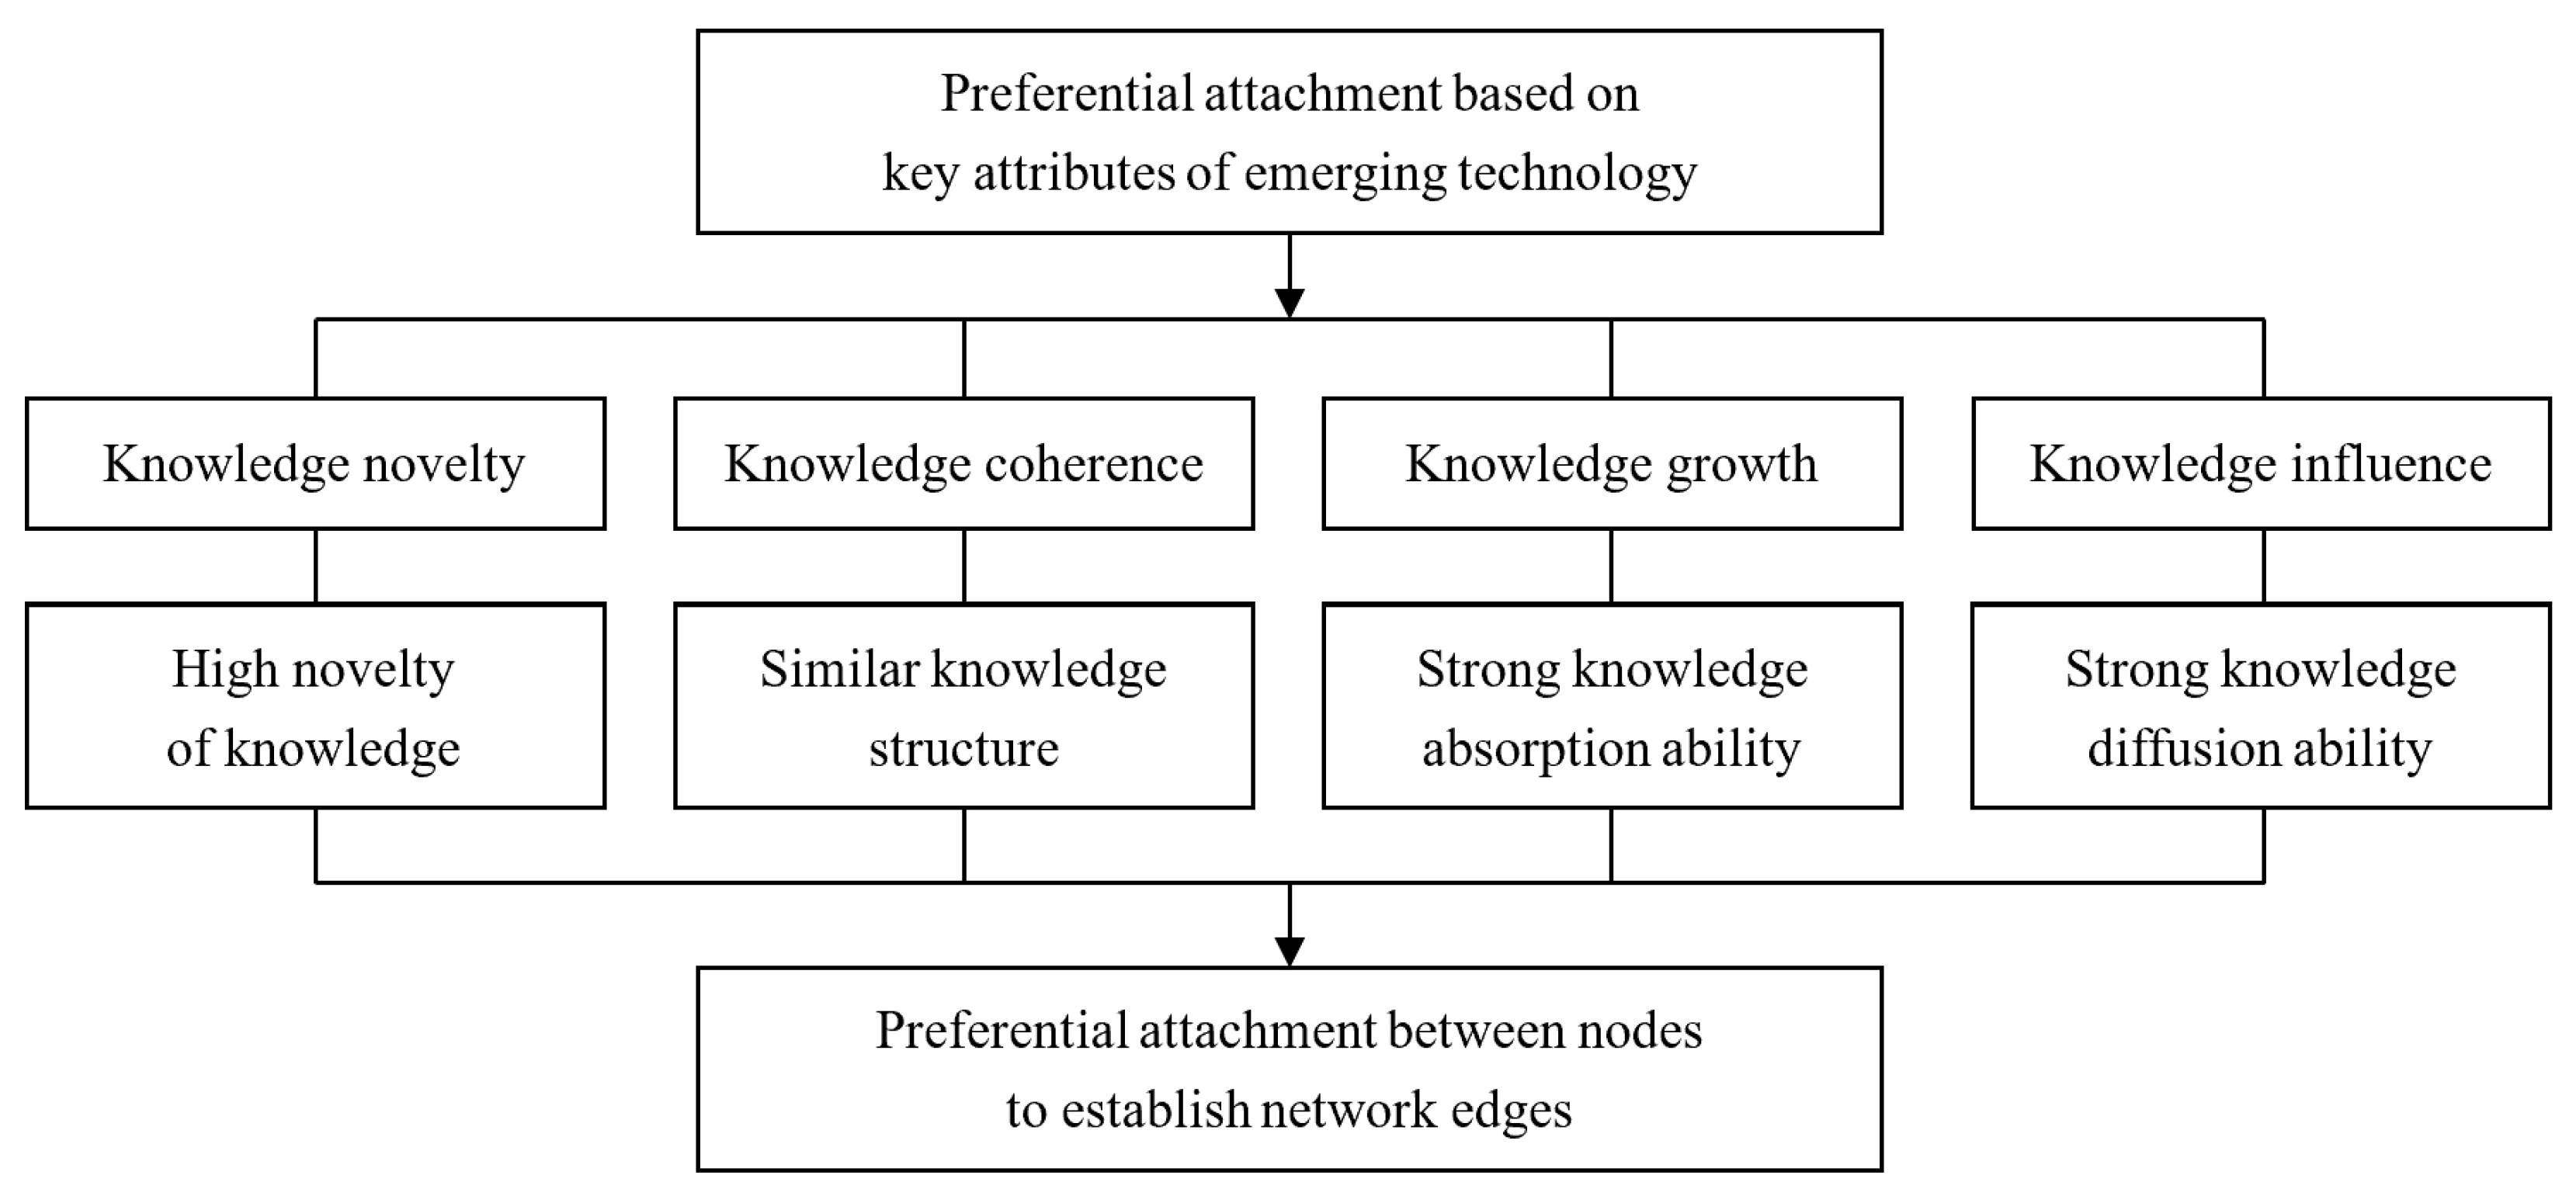
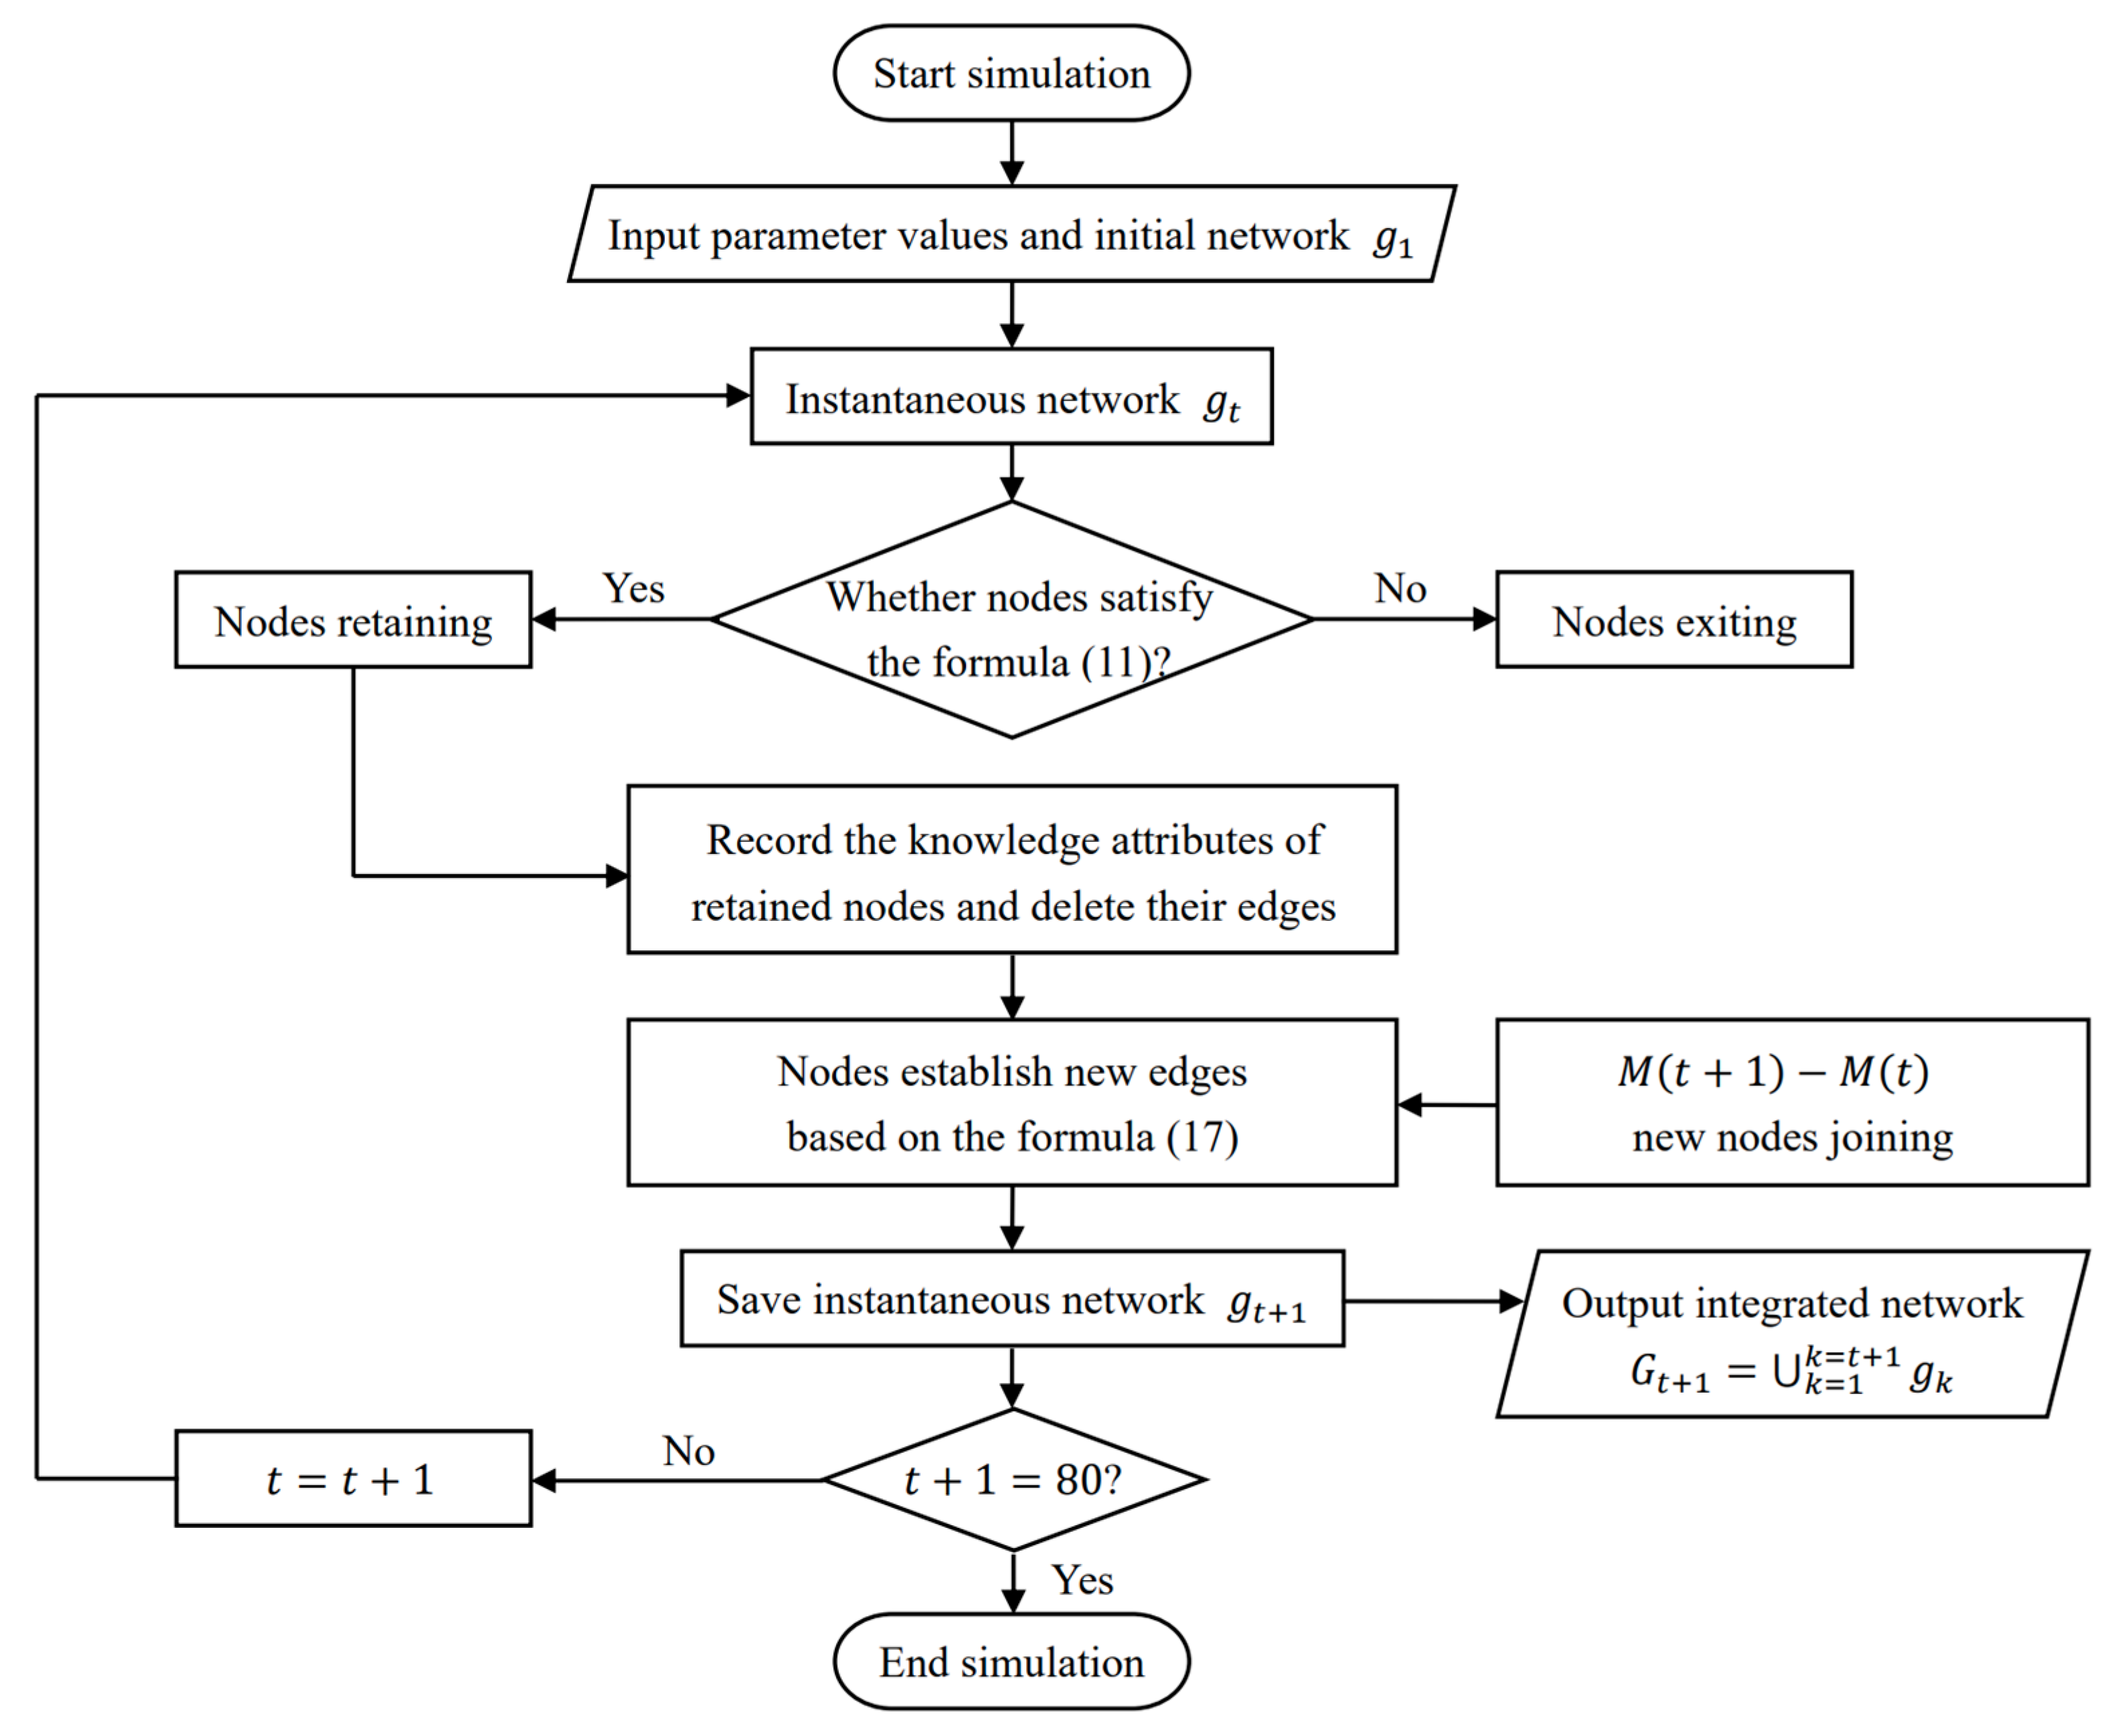
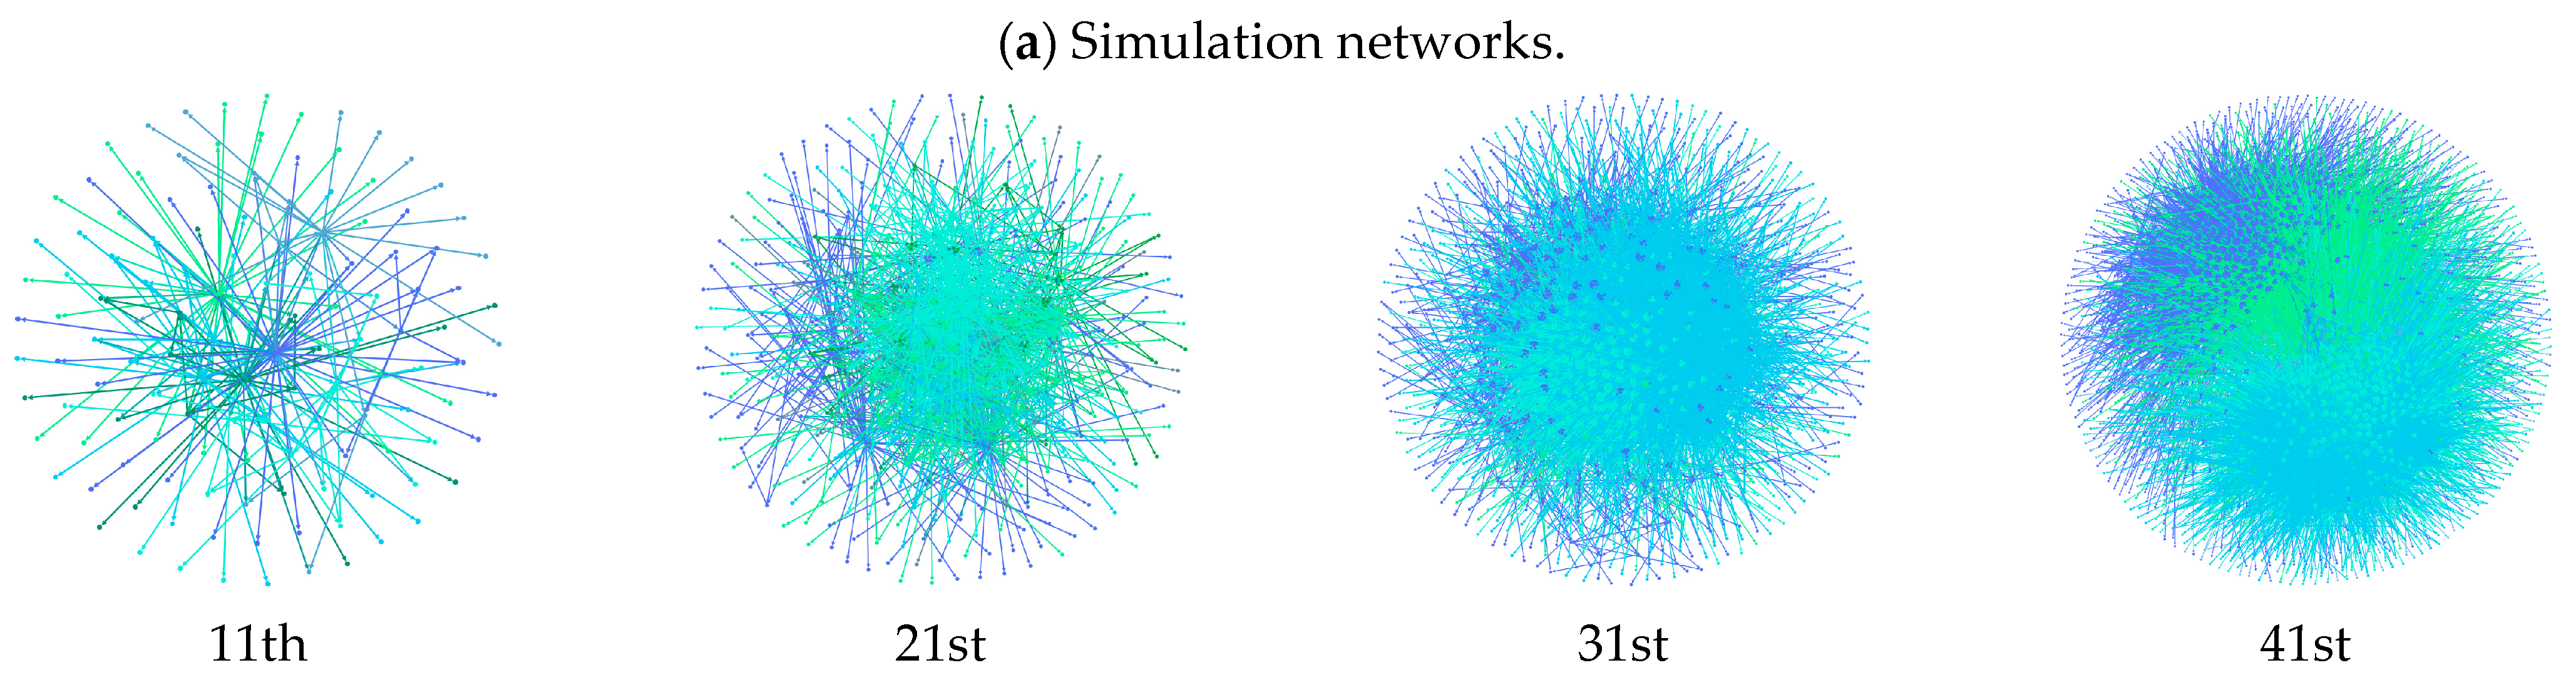
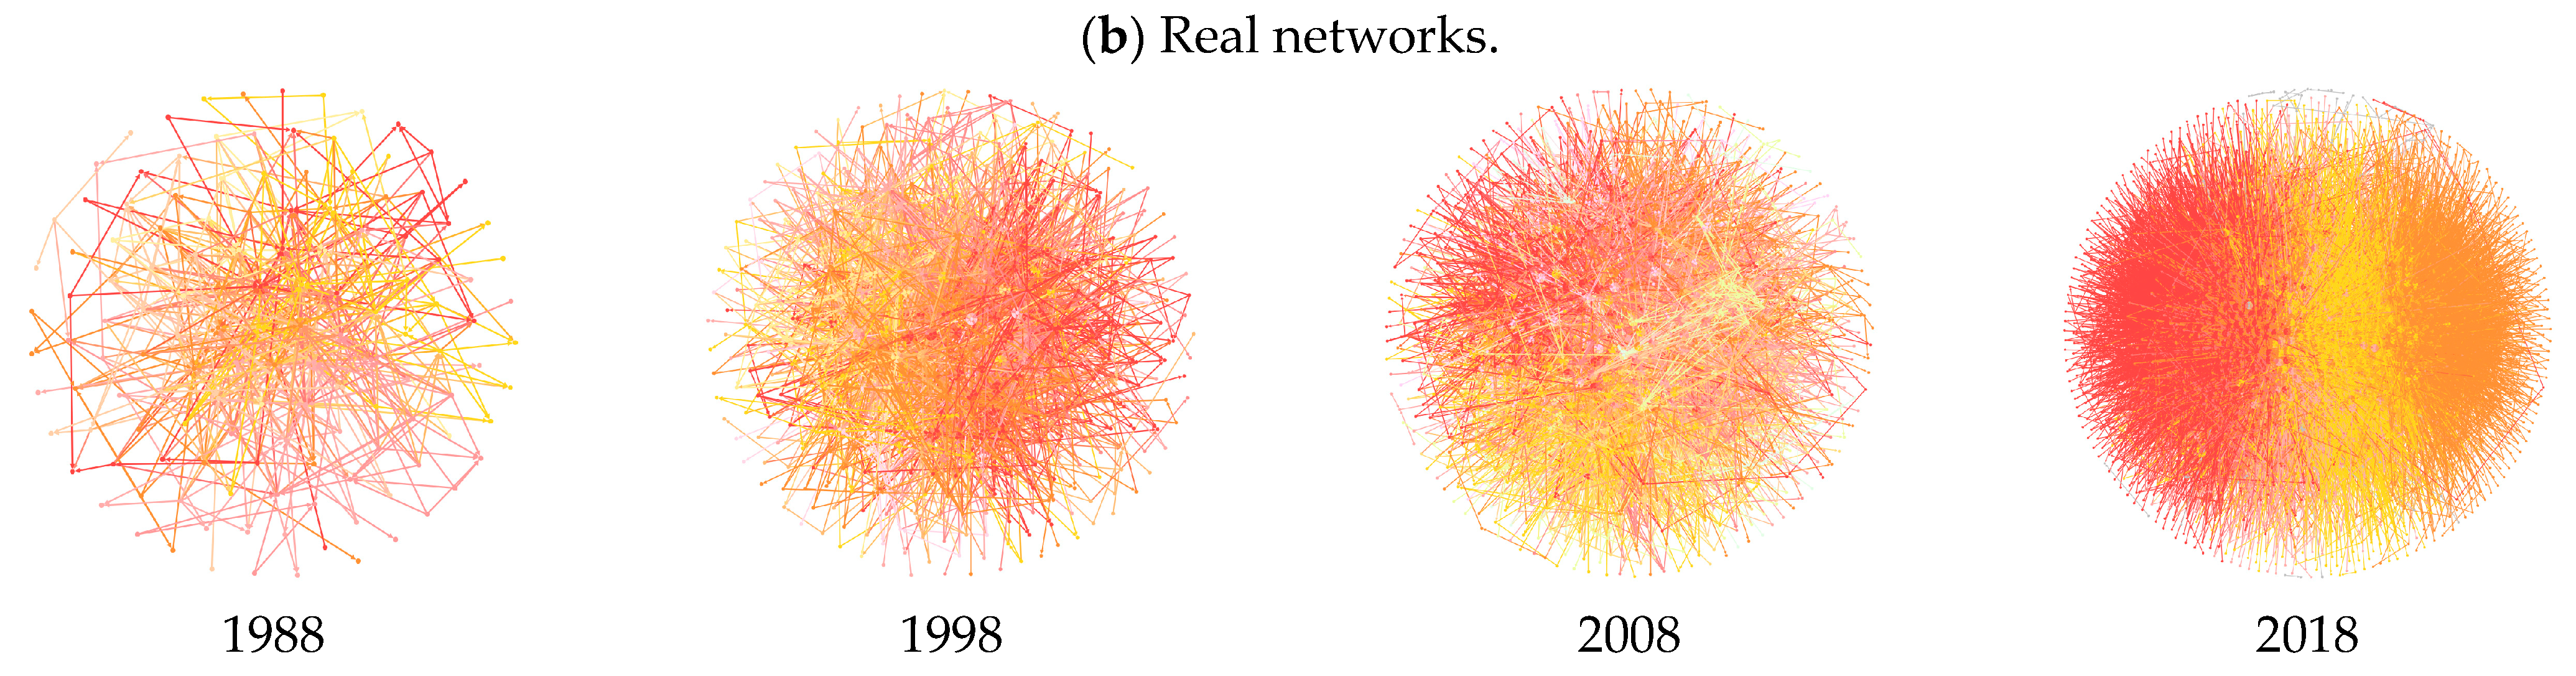
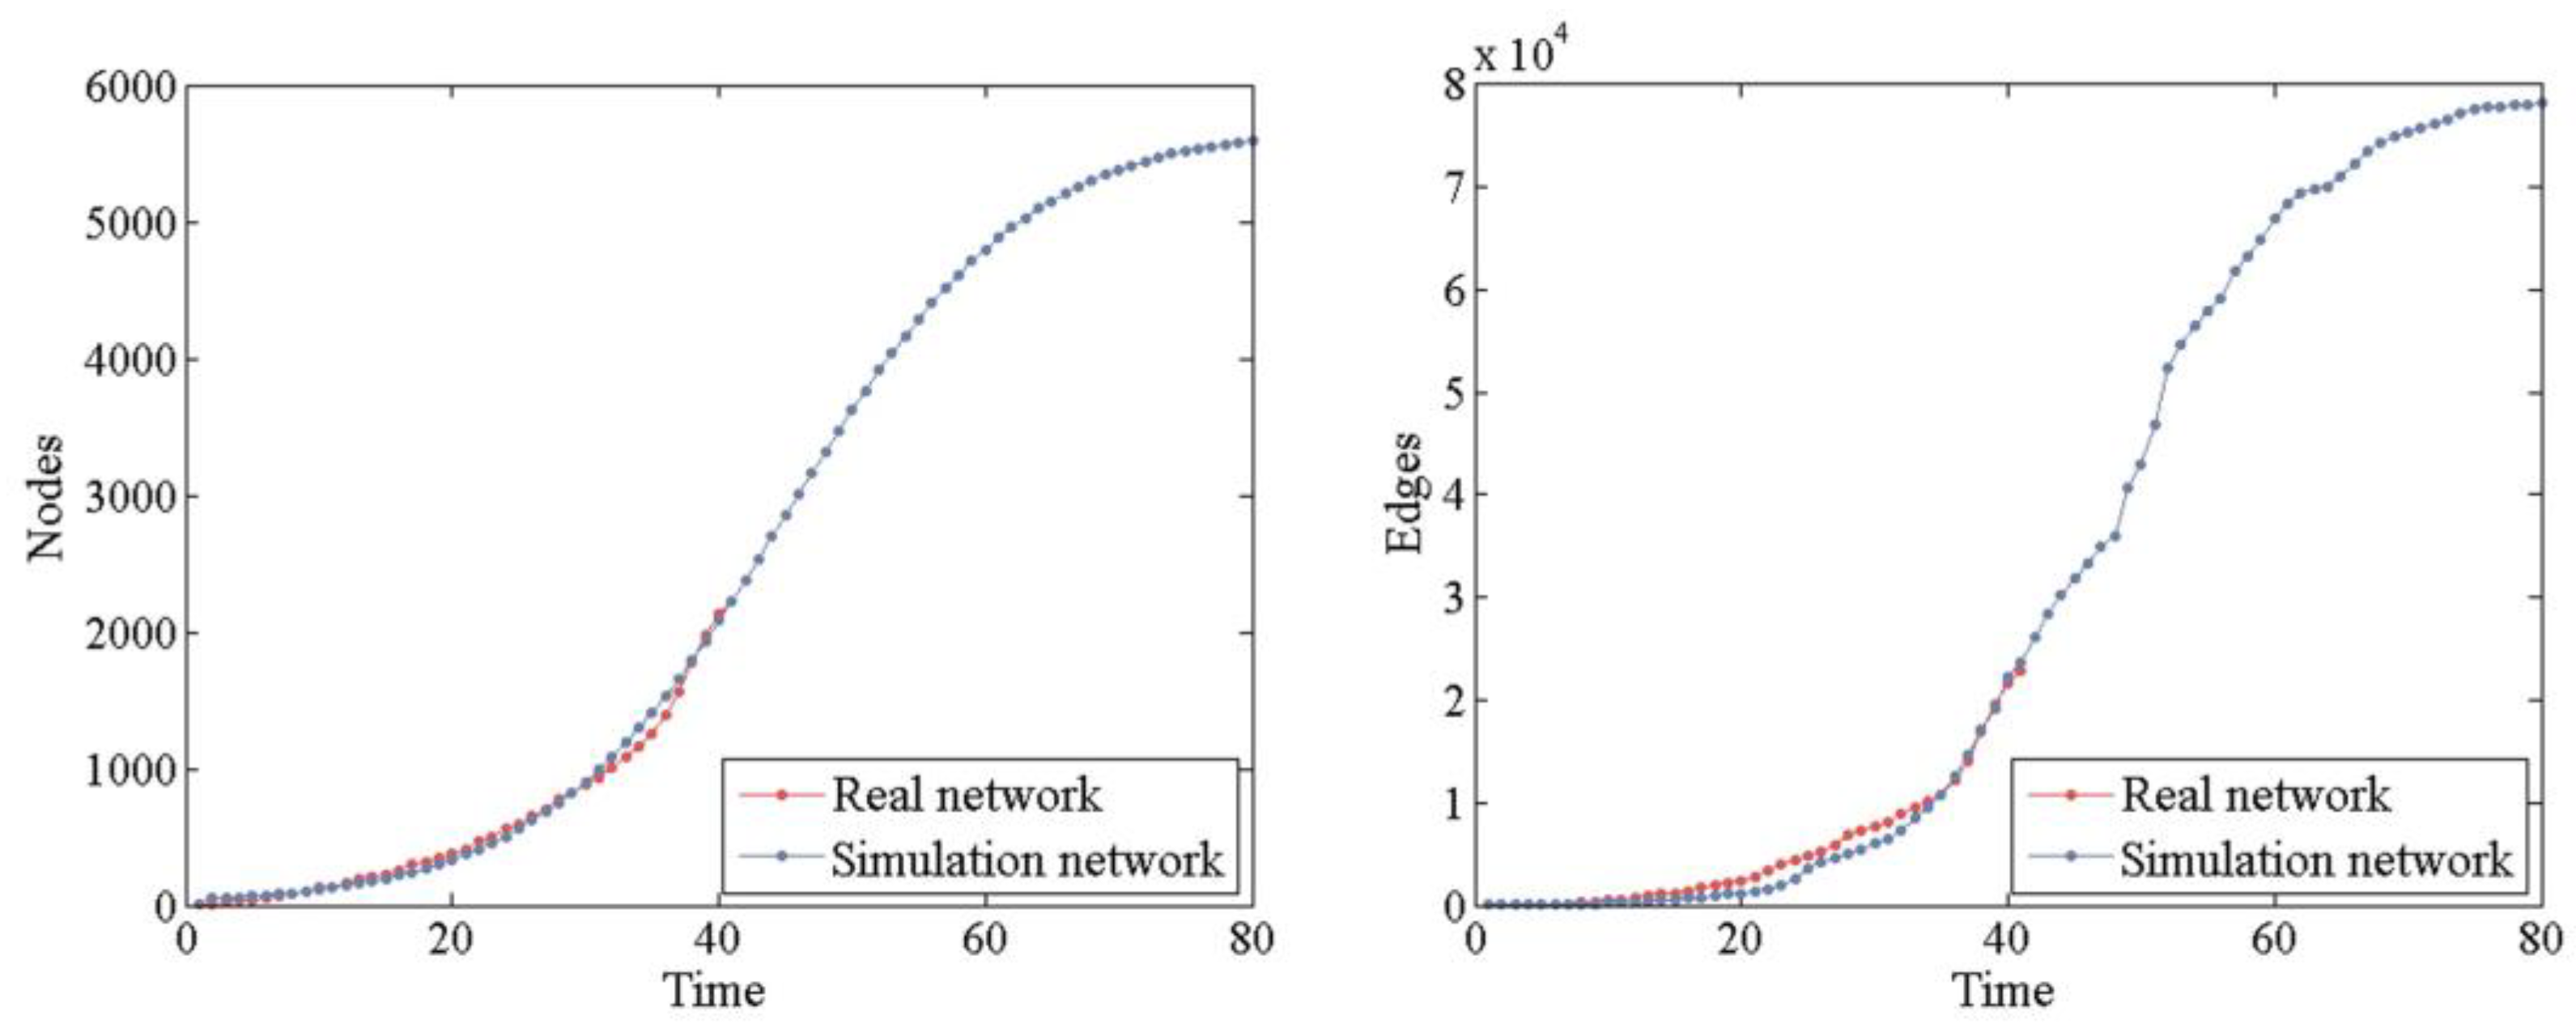
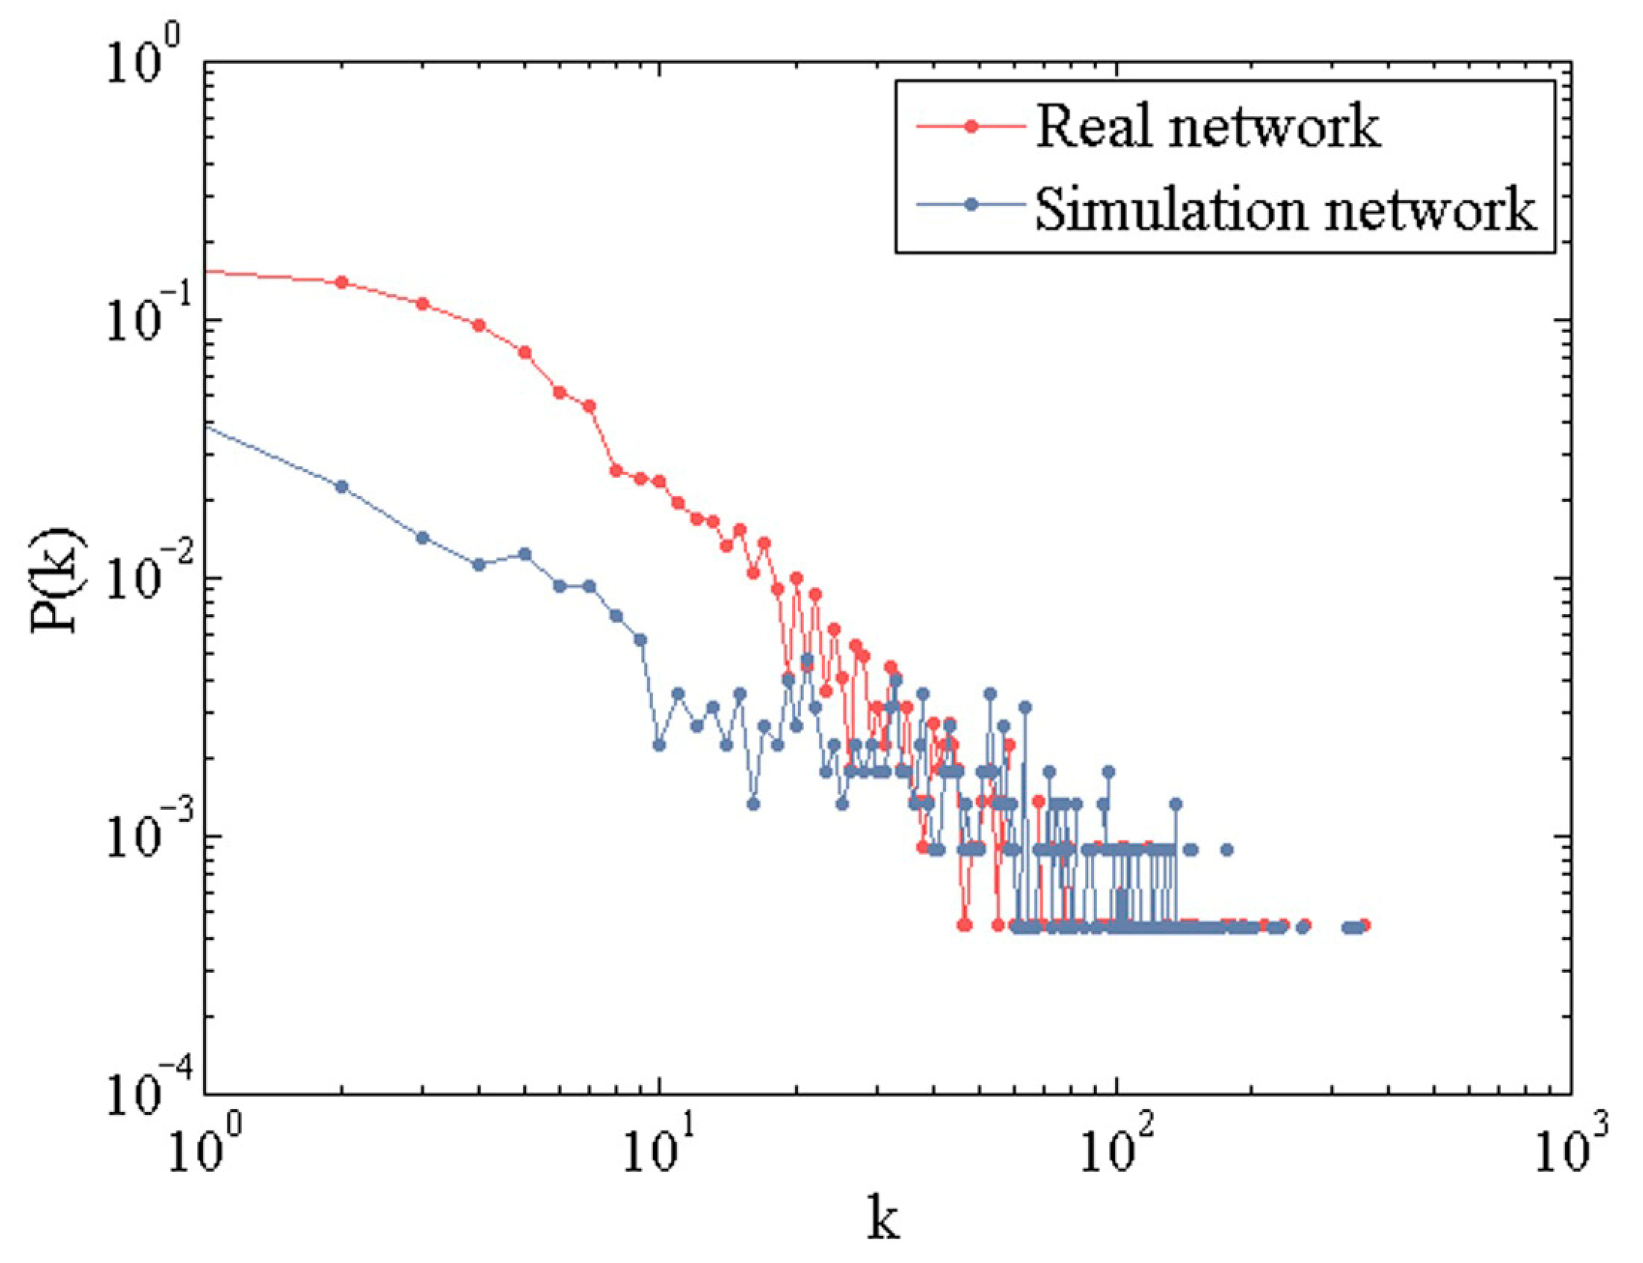
Table 1.
Notations table.
| Notations | Description |
|---|---|
| Level Ⅰ | |
| The probability of node being connected preferentially based on its multiple knowledge attributes. | |
| Level Ⅱ | |
| The probability of node being connected preferentially based on its knowledge novelty. | |
| The probability of node being connected preferentially based on its knowledge coherence. | |
| The probability of node being connected preferentially based on its knowledge growth. | |
| The probability of node being connected preferentially based on its knowledge influence. | |
| The fitness of node , and there is no unified standard for the probability distribution of node fitness, which should be determined according to the real network data. | |
| The upper limit of knowledge absorption of node , which can be set to obey the power law distribution according to the in-degree distribution of nodes in most real networks. | |
| Level Ⅲ | |
| The knowledge novelty of node at time , which is used to calculate . | |
| The knowledge structure vector formed by the innovation outputs of node in different knowledge domains up to time since they joined the network, which is used to calculate . | |
| The in-degree of node at time , which can reflect its knowledge absorption and be used to calculate . | |
| The out-degree of node at time , which can reflect its knowledge diffusion and be used to calculate . |
Disclaimer/Publisher’s Note: The statements, opinions and data contained in all publications are solely those of the individual author(s) and contributor(s) and not of MDPI and/or the editor(s). MDPI and/or the editor(s) disclaim responsibility for any injury to people or property resulting from any ideas, methods, instructions or products referred to in the content. |
© 2023 by the authors. Licensee MDPI, Basel, Switzerland. This article is an open access article distributed under the terms and conditions of the Creative Commons Attribution (CC BY) license (https://creativecommons.org/licenses/by/4.0/).
Share and Cite
MDPI and ACS Style
Liu, Y.; Chen, Y.; He, Q.; Yu, Q. Cyclical Evolution of Emerging Technology Innovation Network from a Temporal Network Perspective. Systems 2023, 11, 82. https://doi.org/10.3390/systems11020082
AMA Style
Liu Y, Chen Y, He Q, Yu Q. Cyclical Evolution of Emerging Technology Innovation Network from a Temporal Network Perspective. Systems. 2023; 11(2):82. https://doi.org/10.3390/systems11020082
Chicago/Turabian StyleLiu, Yaqin, Yunsi Chen, Qing He, and Qian Yu. 2023. "Cyclical Evolution of Emerging Technology Innovation Network from a Temporal Network Perspective" Systems 11, no. 2: 82. https://doi.org/10.3390/systems11020082
Note that from the first issue of 2016, this journal uses article numbers instead of page numbers. See further details here.