Article

The Precision of the Human Hand: Variability in Pinch Strength and Manual Dexterity

1
UMR 7194-HNHP, PaleoFED Team, Département Homme et Environnement, Musée de l’Homme, 17 Place du Trocadéro, 75016 Paris, France
2
Skeletal Biology Research Centre, School of Anthropology and Conservation, University of Kent, Canterbury CT2 7NR, UK
3
Department of Human Evolution, Max Planck Institute for Evolutionary Anthropology, D-04103 Leipzig, Germany
4
Department of Psychiatry, University of Oxford, Warneford Hospital, Oxford OX3 7JX, UK
5
Psychology, School of Social Sciences, University of Westminster, London W1W 6UW, UK
6
Department of Computer Science, Birkbeck, University of London, London WC1E 7HX, UK
7
Department of Psychology, City, University of London, London EC1V 0HB, UK
8
Department of Psychological Sciences, Birkbeck, University of London, Malet Street, London W1CE 7HX, UK
*
Author to whom correspondence should be addressed.
Symmetry 2022, 14(1), 71; https://doi.org/10.3390/sym14010071
Submission received: 22 November 2021 / Revised: 16 December 2021 / Accepted: 28 December 2021 / Published: 4 January 2022
(This article belongs to the Special Issue Symmetry and Asymmetry: From Evolution to Neuroscience)

Abstract

:
Changes in hand morphology throughout human evolution have facilitated the use of forceful pad-to-pad precision grips, contributing to the development of fine motor movement and dexterous manipulation typical of modern humans. Today, variation in human hand function may be affected by demographic and/or lifestyle factors, but these remain largely unexplored. We measured pinch grip strength and dexterity in a heterogeneous cross-sectional sample of human participants (n = 556) to test for the potential effects of sex, age, hand asymmetries, hand morphology, and frequently practiced manual activities across the lifespan. We found a significant effect of sex on pinch strength, dexterity, and different directional asymmetries, with the practice of manual musical instruments, significantly increasing female dexterity for both hands. Males and females with wider hands were also stronger, but not more precise, than those with longer hands, while the thumb-index ratio had no effect. Hand dominance asymmetry further had a significant effect on dexterity but not on pinch strength. These results indicate that different patterns of hand asymmetries and hand function are influenced in part by life experiences, improving our understanding of the link between hand form and function and offering a referential context for interpreting the evolution of human dexterity.

1. Introduction

The hominin fossil record demonstrates that the human hand has undergone morphological and functional changes that distinguish it from other non-human primates (e.g., [1,2,3,4]). Evolutionarily adaptive (or -exaptive) changes such as increased brain asymmetry [5] and a larger thumb-finger ratio are generally associated with enhancements in manual dexterity and fine motor movements, including forceful pad-to-pad precision grips, considered a unique human ability [1,6]. Forceful precision grips are thought to have played an integral role in hominin evolutionary success through the manufacture and use of complex tool technologies and more effective resource exploitation [1,7]. Today precision grips are critical to most daily activities [8,9,10]. Previous studies have documented variation in pinch grip (a form of precision grip) strength between males and females [11,12,13], but it is not known how differences in hand morphology or frequent engagement in activities that require (forceful) precision grips might also influence ones’ manual dexterity. A better understanding of the form-function relationship of the human hand may not only offer valuable clinical insights (e.g., early identification of hand disorders for preventive treatment) but can also inform our understanding of how enhanced dexterity of the human hand evolved.
A variety of methodological tools have been used to assess precision grip capabilities and manual dexterity in human samples, most often within a clinical context, including physiotherapy, gerontology, and even bionic applications (e.g., [12,14,15,16]). Pad-to-pad precision grips (i.e., pinch grip in which force is generated between the pad of the thumb and the pad of a finger, without contact with the palm) are of particular interest because they are often used for high-precision tasks in daily life [8,9,10,17]. Pinch grip strength reflects the gross power of the thumb and fingers, including the extrinsic muscles within the forearm, and has been found to be strongly associated with sex and age [11,12,13,18]. This research documents a common pattern in which the oldest age groups (i.e., 50+) show a decrease in pinch strength compared to the youngest participants (i.e., 20–40), and males demonstrate greater overall pinch strength, as well as power grip strength compared to females, in both the dominant and non-dominant hands [12,13]. The literature suggests that pinch strength is also influenced by anthropometric characteristics such as hand dimensions [19], hand asymmetries with hand dominance (i.e., the dominant hand significantly stronger and/or more dexterous than the non-dominant hand, with the direction right or left not taking into account) and hand directional asymmetry (DA) or handedness (i.e., one side right or left significantly stronger and/or more dexterous than the other) [19,20], and lifestyle influences such as occupational activities [21,22]. However, these studies only looked at specific factors (e.g., hand size), populations, and classes of age in small samples while it is important to test together with all possible factors that influence dexterity and pinch strength. Here, we build upon this work by exploring several potential influences on pinch grip strength, as well as manual dexterity, in a much larger and more diverse sample.
The most common manual dexterity test used in human research is the pegboard test (e.g., [12,23,24]). Despite it being one of the oldest measures for hand dexterity, the pegboard test has repeatedly been ranked as one of the most reliable and valid forms of dexterity assessments cross-culturally [25]. Investigations of inter-population differences in dexterity using the pegboard test [12,24] found that females often outperform males in this kind of dexterity-based task [24,26,27]. However, Peters et al. [23] suggested that these sex-related differences were diminished when the width of the thumb and index finger were controlled for. Although females generally performed better on pegboard tasks, males often exhibited finger-widths that were suboptimal, suggesting that finger-width was a confounding variable that should not be ignored [23]. Likewise, Sivagnansasunderam et al. [28] found that when large pegboards were utilized, sex differences disappeared. These results emphasize the need to consider finger size (width but also length) in dexterity tasks. However, the thumb-index finger length ratio has not been considered in manual dexterity studies despite a larger thumb-finger ratio generally being associated with enhancements in manual dexterity and fine motor movements in an evolutionary context [1,6].
Results from age-related research suggest that power and precision grip strength may be a strong predictor of dexterity [11]. Martin et al. [11] found a significant negative predictive relationship between general handgrip strength and manual dexterity scores that gradually decline with age. This age-related decline can be associated with various intrinsic and extrinsic factors, including genetics, metabolic conditions, nutrition, as well as common diseases that affect the hands such as osteoarthritis and rheumatoid arthritis [29,30]. Most research has suggested that power grip and pinch grip strength deterioration can be explained, at least in part, due to gradual degeneration in important muscles that stabilize the thumb after the age of 65 [14,31]. However, as highlighted in Martin et al. [11], most studies tend to look at grip strength and manual dexterity in isolation rather than together, ignoring their predictive relationship. Therefore, the relationship between precision grip strength, dexterity, and age is not fully understood.
Given the variation demonstrated in both manual dexterity and hand strength in previous studies, it is reasonable to assume that frequently practiced manual activities associated with, for example, particular occupations, sports activities, or the practice of musical instruments, may also account for this documented variation. Many specialized occupations, such as watchmakers, opticians, or surgeons, require fine unimanual and bimanual motor movements [32]. Moreover, specialized manual activities can vary in the required grip types that are consistently performed often over long periods of time. However, most of the research that has considered occupational influences on hand morphology has focused on the influence of physical load on hand strength or dexterity between manual laborers and non-manual laborers [21,22]. For example, Josty et al. [22] found that heavy manual workers had significantly higher power and precision grip strength compared to light manual workers. Similarly, Doğan [21] observed that in comparison to office workers, industrial workers had higher pinch grip strength, yet lower manual dexterity. However, Desai and Shah [33] found that the levels of manual dexterity and eye coordination in garment workers were not significantly greater than those of a standard population. Research into occupational influences has mostly been conducted on relatively small samples (e.g., n = 48–142 in the above four studies) but has not taken into consideration variation in anthropometric variables (e.g., hand size or shape), and even fewer research studies have looked at the influences of “hobbies” such as practicing sports and/or music.
Considering the few studies looking at the relationship between sports and manual function, Denat and Kuzgun [34] found that participating in sports did not cause any change in manual dexterity, while Soyupek et al. [35] found that aerobic exercise had a positive effect on dexterity and muscle strength (power grip). However, Denat and Kuzgun [34] in their study asked if the participant is practicing a sport (Yes or No) without asking which kind of sports, which makes it difficult for the comparison between both studies to provide a possible explanation for the differences. Mitchell et al. [36] found that rock climbers, both males, and females, showed a strong negative correlation between climbing time and pinch grip, indicating a link between performance and pinch grip strength. However, most studies have focused on the relationship between sports activities and power (e.g., [35,37]) rather than pinch grip strength, and few studies have tested the potential influence of hand size and shape.
Musical expertise requires highly refined motor abilities and hand function but most research on musicians has focused on neural plasticity rather than the form and function of the hand (e.g., [38,39]). The few studies investigating manual dexterity and hand strength in musicians have typically compared elite musicians to amateur or non-musicians (e.g., [40]). With motor control considered as a skill that can be developed over time, experienced musicians have been shown to improve their manual dexterity [41,42]. However, these findings do not automatically translate into increased hand strength. Sims et al. [38] found that musicians’ hands are generally more sensitive (i.e., as indicated by the skin being more finely innervated on their fingers) but on average weaker, for both pinch and power grips, than non-musicians. Overall, we now require a deeper understanding of how manual activities frequently practiced during particular occupations, sport, or the playing of musical instruments might influence hand function in larger, more diverse samples that also consider variation in age, sex, hand size, hand shape, and hand asymmetries.
Following our previous study on variation in power grip strength [43], the aim here is to improve our understanding of the link between hand form and function regarding precision grip strength and manual dexterity in both the dominant and non-dominant hands. We build upon previous work by assessing the influence of age (17–82 years), sex, hand dominance, hand shape, thumb-index finger ratio, and manual activities on asymmetry on both pinch grip strength and dexterity (assessed via a pegboard test) in a large, heterogeneous, cross-sectional sample (n = 556) of modern humans. Based on previous studies, we predicted that:
(1)
males will have significantly stronger pinch grip in both hands than females, but females will be more dexterous in both hands;
(2)
younger participants will be stronger and more dexterous than the older participants;
(3)
hand asymmetry will be found in both sexes, with the dominant hand being significantly stronger and more dexterous than the non-dominant hand (i.e., hand dominance), and right-handed will have stronger differences between the two hands compared to left-handed individuals;
(4)
frequently practiced manual activities will significantly increase either precision grip strength (i.e., for participants that engage in manual sports or occupations) or dexterity (i.e., for participants that play a musical instrument or engage in precision-based occupations) compared to those who do not frequently engage in these activities.
We further explored if variation in hand shape (i.e., the ratio of hand length/width) and thumb-index ratio influence both pinch grip strength and dexterity. In addition to elucidating the potential biological and behavioral factors that can influence precision strength and dexterity, a clearer understanding of the influence of hand shape and size may also provide an important referential context for a better understanding of the evolution of human dexterity [1,4].

2. Materials and Methods

2.1. Study Design and Participants

This study took place between July and September 2019 at the London Science Museum (part of the ‘Live Science’ initiative) and was part of the “Me, Human” project, a public engagement and citizen science collaboration project. Participants in the study were visitors to a closed-off section of the Wellcome Trust’s ‘Who Am I?’ gallery. There were no inclusion/exclusion criteria meaning that participants were not chosen based on meeting a specific criterion in age, sex, or any other variable observed in this study, and due to the Science Museum being a common tourist attraction in London, the dataset obtained includes a diverse international sample. Each participant gave their written informed consent and completed a demographic questionnaire (date of birth, sex, handedness for writing) before participating in the study. Each participant was assigned a unique non-identifiable code to use in each experiment allowing all data to be linked to a particular individual.
Participants in this study took part in two experiments, the ‘Get a grip’ experiment measuring hand strength and shape, and the ‘Manipulation station’ experiment measuring manual dexterity in both hands. Participants were asked if they had any visual impairment in seeing color before engaging in the ‘Manipulation station’ and if they answered ‘Yes’, they did not do the pegboard task involving pegs colors. This study included male and female adult participants ranging in age from 17 years, as the hand is fully developed by this age [44,45], to 82 years old. All participants with missing data were excluded from analysis (n = 24), as well as participants who had any hand or arm injuries in the past 12 months (n = 14), thus the sample size used in this study was n = 565, of which 89.7% (n = 507) self-reported as right-handed, 8.7% (n = 49) left-handed, and 1.6% (n = 9) as ambidextrous. Participants who self-reported as ambidextrous (n = 9) were excluded in the subsequent analyses because in this study we tested for hand asymmetry. Our final sample was n = 556 participants (Table 1), which was divided into three age categories: from 17 to 29 (younger), from 30 to 44 (middle), and 45+ (older).

2.2. Data Collection Procedure and Outcome Measurements

2.2.1. Questionnaire

The participants were asked several lifestyle-related, multiple-choice, binary questions with regards to their occupation, and whether they played manual sports or musical instruments. Three variables were created from the questionnaire: regular playing of a musical instrument using the hands (e.g., piano, violin, guitar, saxophone, flute, drums) (yes/no); regular engagement in sports activity(ies) using one or two hands (e.g., rock climbing, bouldering, acrobatics, racket sports, lifting, cricket, handball games, and bike riding) (yes/no); and occupation including (1) office job (e.g., typing, shop teller, stay-at-home parent), (2) precision manual work (e.g., jeweler, dressmaker, artist, lab technician) and (3) forceful manual work (e.g., builder, carpenter, farmer).

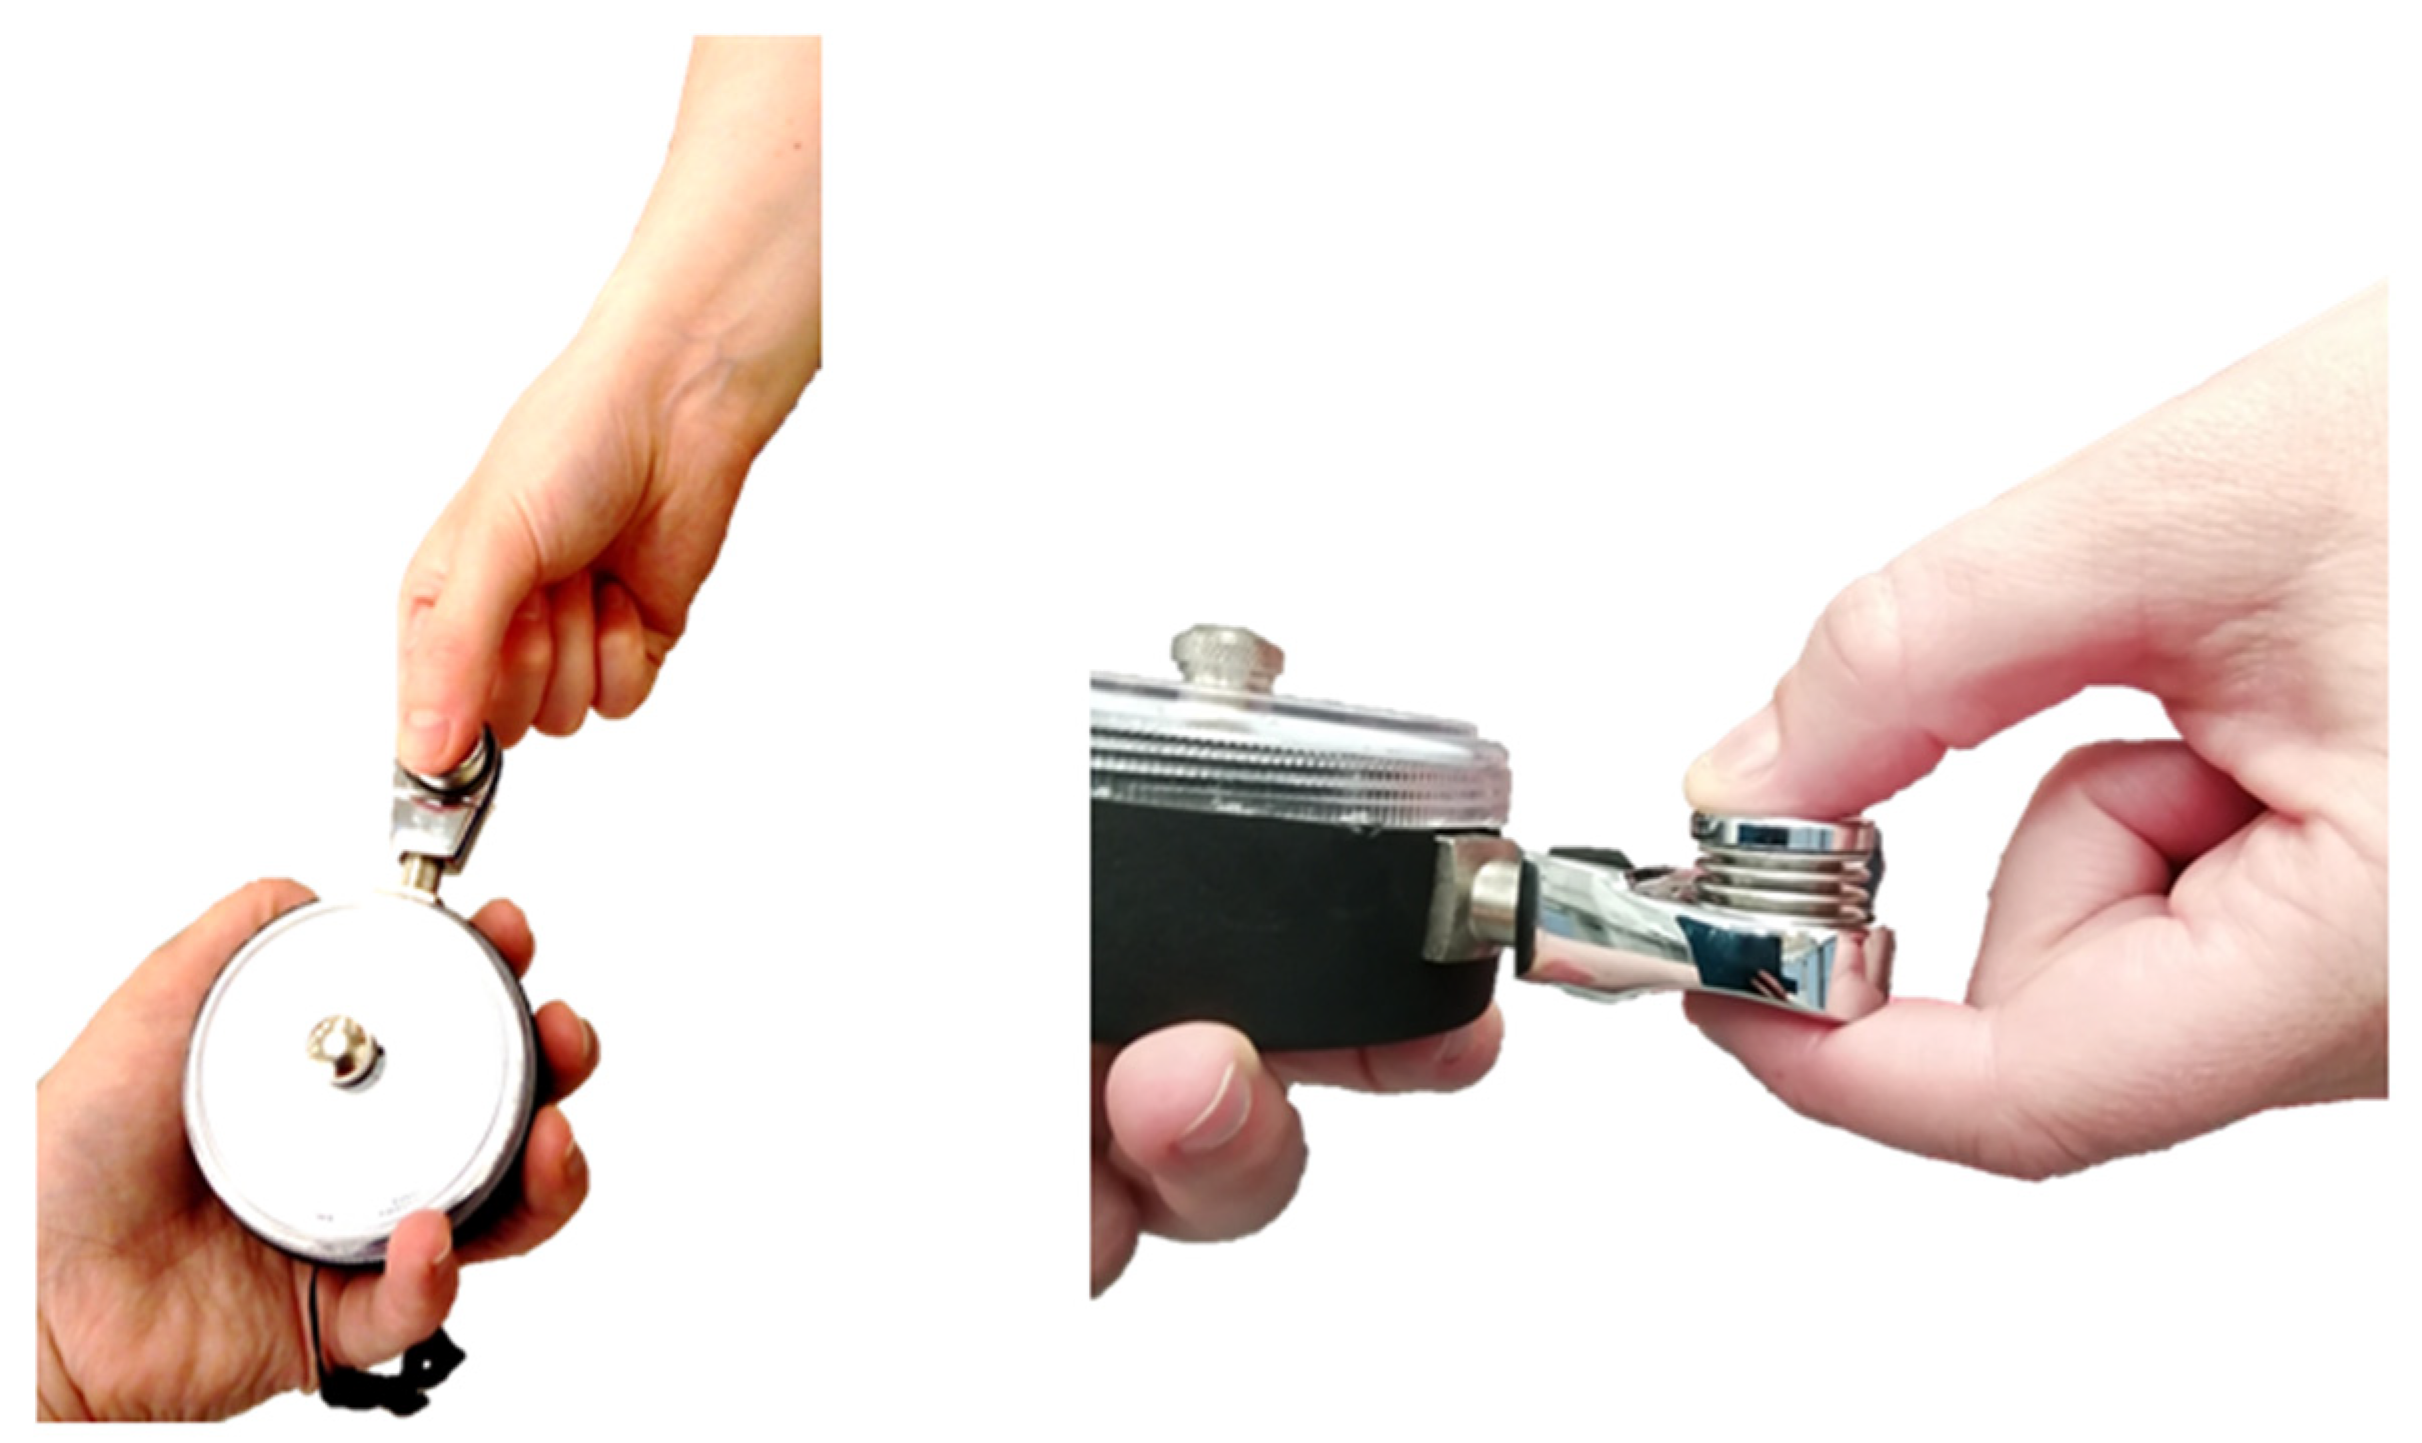
2.2.2. Pinch Strength

Pad-to-pad pinch strength was measured in pounds (lbs) with a Jamar hydraulic pinch gauge (Sammons Preston: Bolingbrook, IL, USA). Participants were asked to sit on a chair with their arm in supination (palm up), the upper arm in parallel with the torso, and the elbow bent at a 90-degree angle, such that the forearm was perpendicular to the torso. They were then asked to pinch the gauge between the pad of the thumb and pad of the index finger, as shown in Figure 1, following the procedures reported by [46]. The posture and the grip were demonstrated to each participant and a poster demonstrating the appropriate position was also visible for the participants. The participants were instructed to pinch to their maximum ability for two seconds. Two pinch grip measurements were taken for each hand, with questions interspersed in between each measure to avoid fatigue. The average value from both measures for each hand was used for analysis.

2.2.3. Hand Measurements

Both hands of each participant were digitized for measurements using a flatbed scanner (Epson Perfection V39) that included a 2-cm scale as outlined in [43]. Each participant was given a clear template to line up their fingers and thumb on each hand to ensure standardized hand position. Hand measurements were measured from each scan using freeware tpsDig2 software version 2.31 (The State University of New York at Stony Brook: Stony Brook, NY, USA) [47]. Hand width (W) and hand length (L) were defined as depicted in Figure 2 and the ratio of both measures (W/L) was used as an indicator of hand shape. Hands with a ratio >0.5 were considered as ‘wide’ hands, while hands with a ratio <0.5 were considered as ‘long’ hands [43]. Thumb and index finger length was measured from the proximal flexion crease to the fingertip in accordance with anthropomorphic hand standards [48,49] (Figure 2). The thumb-index ratio was calculated by dividing thumb length by index finger length [48]. A ratio of 1.0 indicated a similar length between the thumb and the index finger, and thus the lower the ratio (i.e., <0.5), the shorter the thumb and the longer the index finger, and the higher the ratio (i.e., >0.5), the longer the thumb and the shorter the index finger. All measurements were taken by one researcher (KT), and a second researcher (AB) measured 20% of both right and left hands (n = 224) to test for inter-observer error. The measurements of the hands were consistent between the two observers (Interclass correlation coefficients, ICC = 0.99, p < 0.001), and thus we only used the measurements from the first researcher for all subsequent analyses.

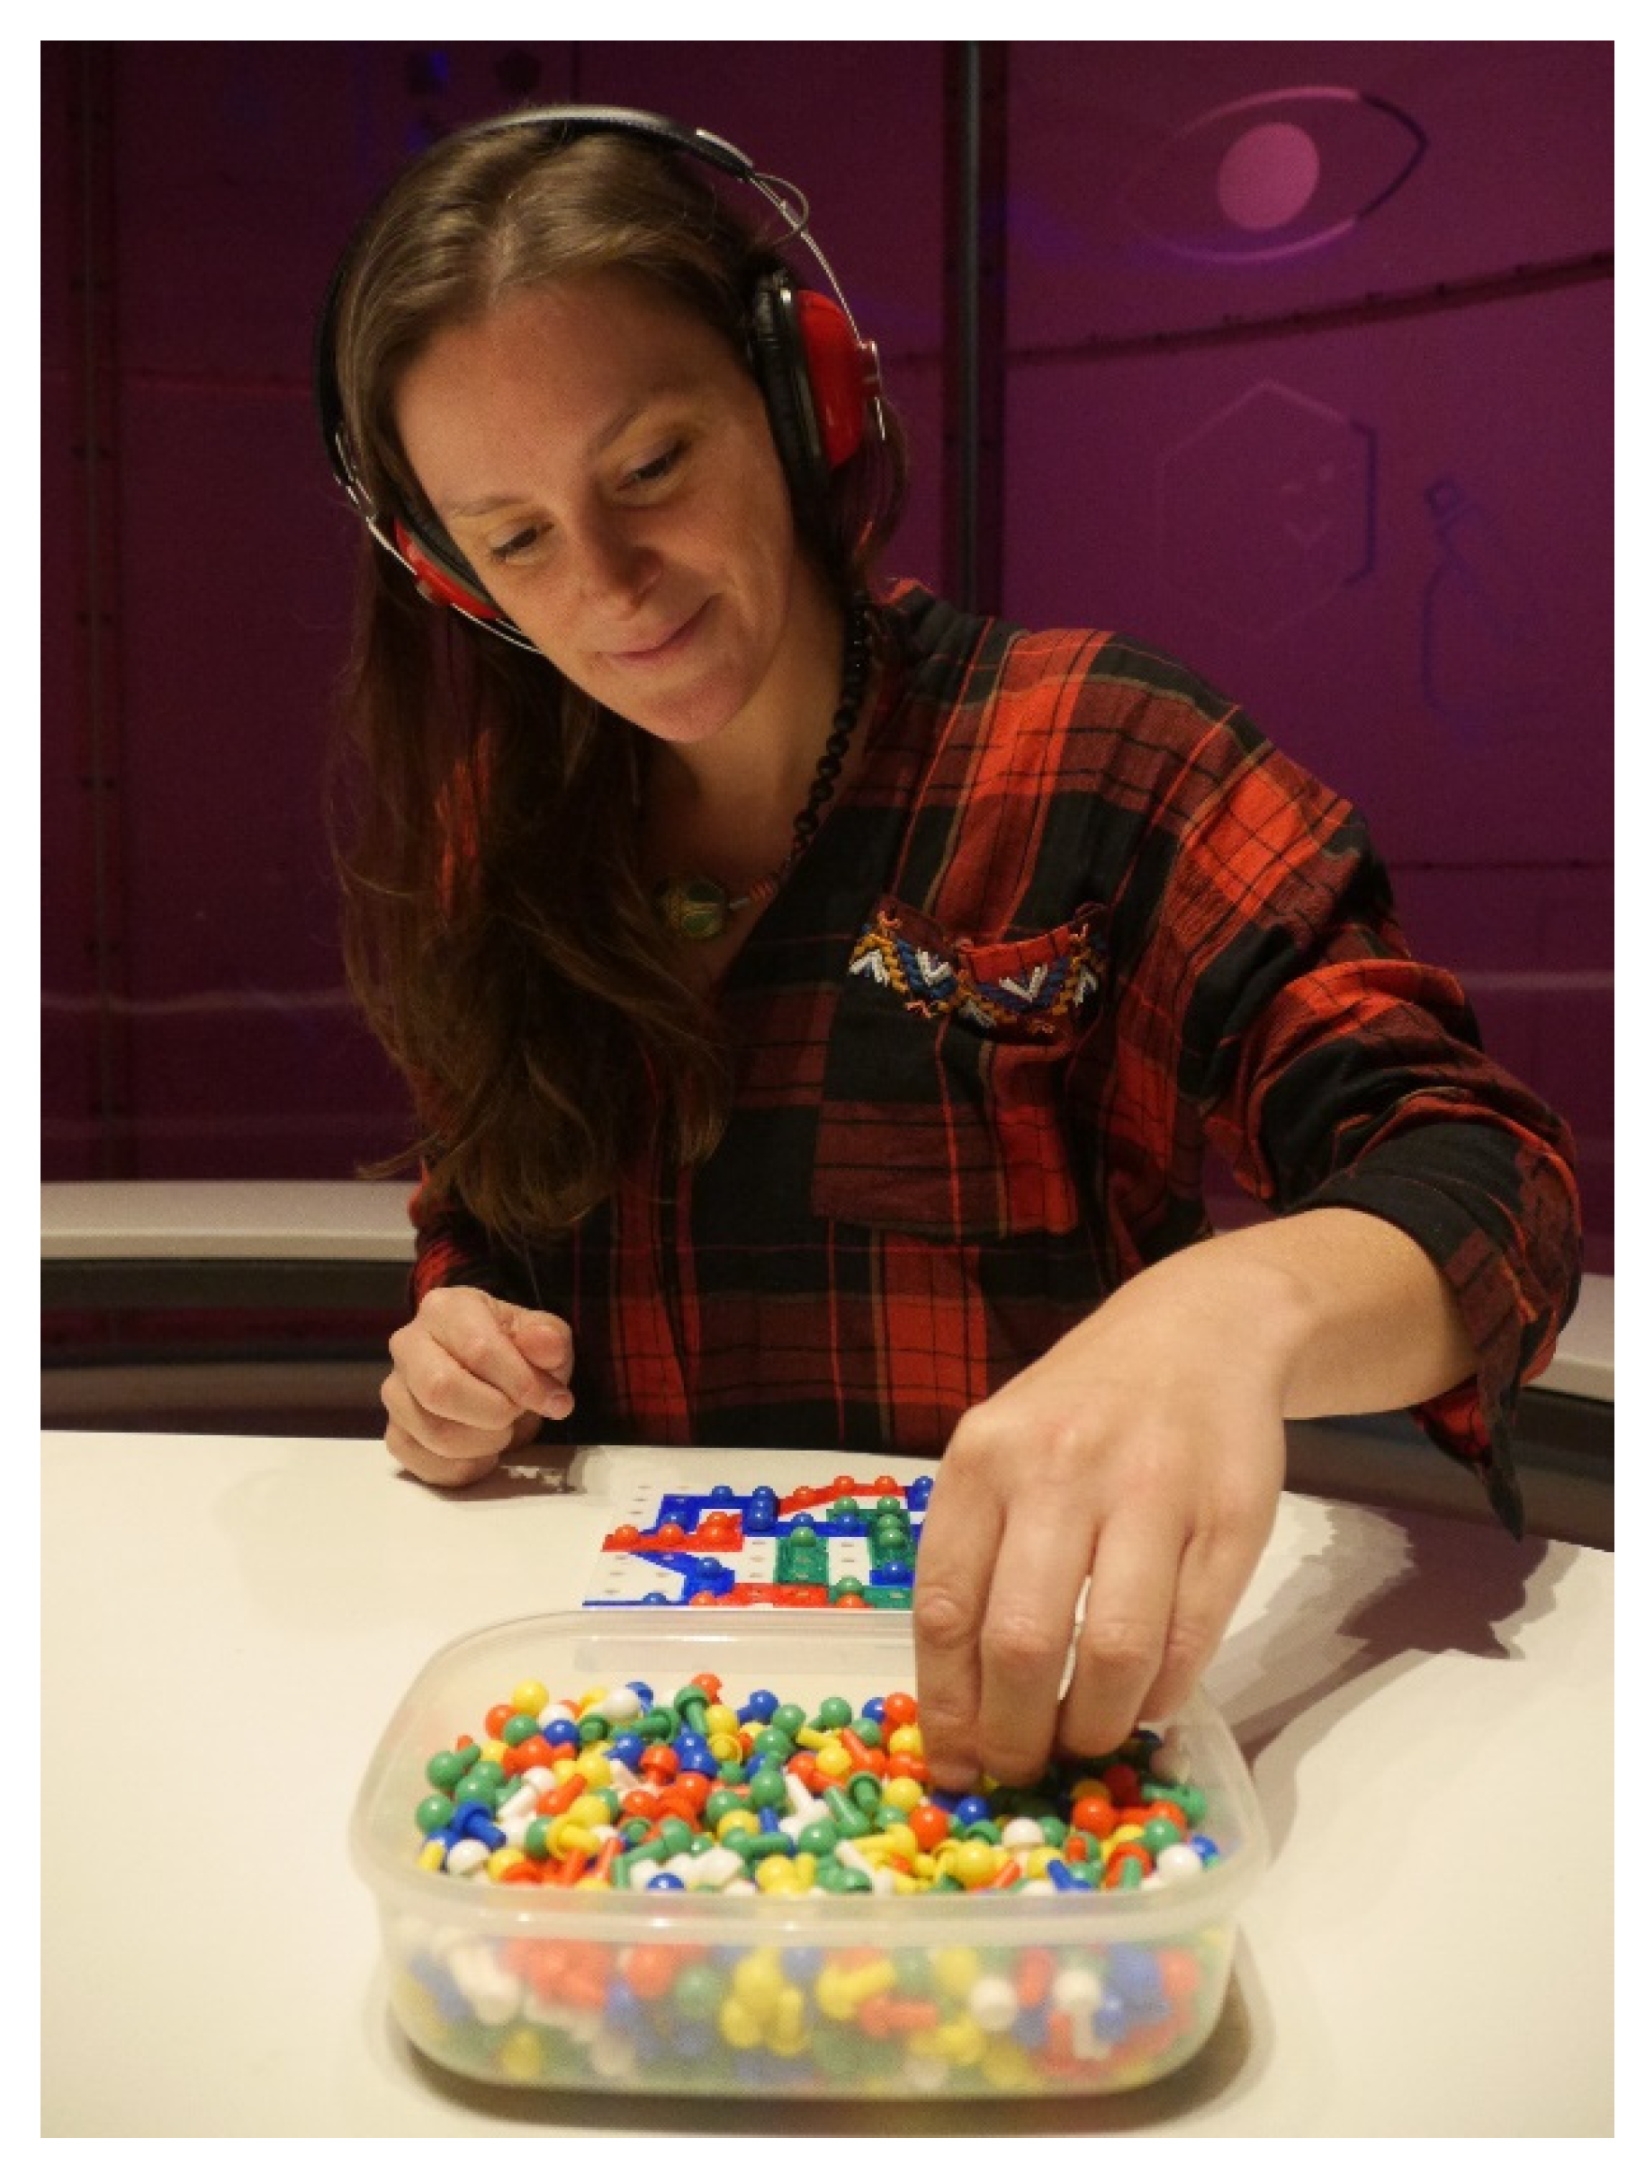
2.2.4. Pegboard Test

Pegboard tests are designed to examine fine motor dexterity and gross movements of the hands, fingers, and fingertips [50]. The pegboard test we used was modified from [51], including a 10 × 10 holes pegboard and a bowl of multi-colored pegs centrally placed behind the pegboard, as shown in Figure 3. The pegboard was colored in green, red, and blue and the bowl included the same-colored pegs, as well as white and yellow distracter pegs. Participants were instructed to pick up only one peg at a time with one hand and to place it in the associated section of the board. Participants were challenged to match as many as possible pegs in 60 s. This task was completed using only the left hand and only the right hand (the order was counterbalanced across participants). The outcome measurement was the number of pegs correctly placed by each hand.

2.3. Statistical Analyses

Levene’s tests were used to test the homogeneity of variance between males and females and between left and right hands. Shapiro–Wilk Normality tests revealed that some population data significantly deviated from a normal distribution (p < 0.05), so nonparametric tests were used. Using Spearman Rank Correlation tests, we tested for correlations between (1) pinch grip strength and thumb-index ratio, and hand shape; (2) dexterity and thumb-index ratio, and hand shape; and (3) pinch grip strength and dexterity. Wilcoxon rank-sum tests with continuity correction were used to test for significant differences between right- and left-handed individuals (using self-reported handedness) in (1) pinch grip strength and (2) dexterity. Wilcoxon rank-sum tests were also used to assess differences in pinch grip strength and dexterity results between participants that (1) regularly play a musical instrument or not, and (2) regularly play a manual sport or not. Kruskal–Wallis tests were used to test for significant differences in pinch grip strength and dexterity across (1) sex and hand dominance (with four groups: male hand dominant, male hand non-dominant, female hand dominant, female hand non-dominant); (2) occupation, (3) age categories, and (4) handedness, and lifestyle factors (occupation, playing a musical instrument, playing sport) between age categories. We conducted Kruskal–Wallis tests across sex and hand dominance first by testing differences in absolute values and, given the variation in hand size across the sample, we tested as well relative values in which pinch strength and dexterity (i.e., the number of pegs placed) were divided by hand area (i.e., L × W), used as a proxy for size. If all Kruskal–Wallis tests were significant, we used Dunn’s tests for multiple comparisons of independent samples, with Bonferroni correction. All the statistical analyses were performed with R 3.6.3 (R Foundation for Statistical Computing: Vienna, Austria) [52]. Supplementary Tables S1 and S2 present the summary statistics (mean and standard deviation of the mean) for pinch grip strength (Ibs) and pegboard test results of both hands by each age category and sex, for handedness and each lifestyle factor tested.

3. Results

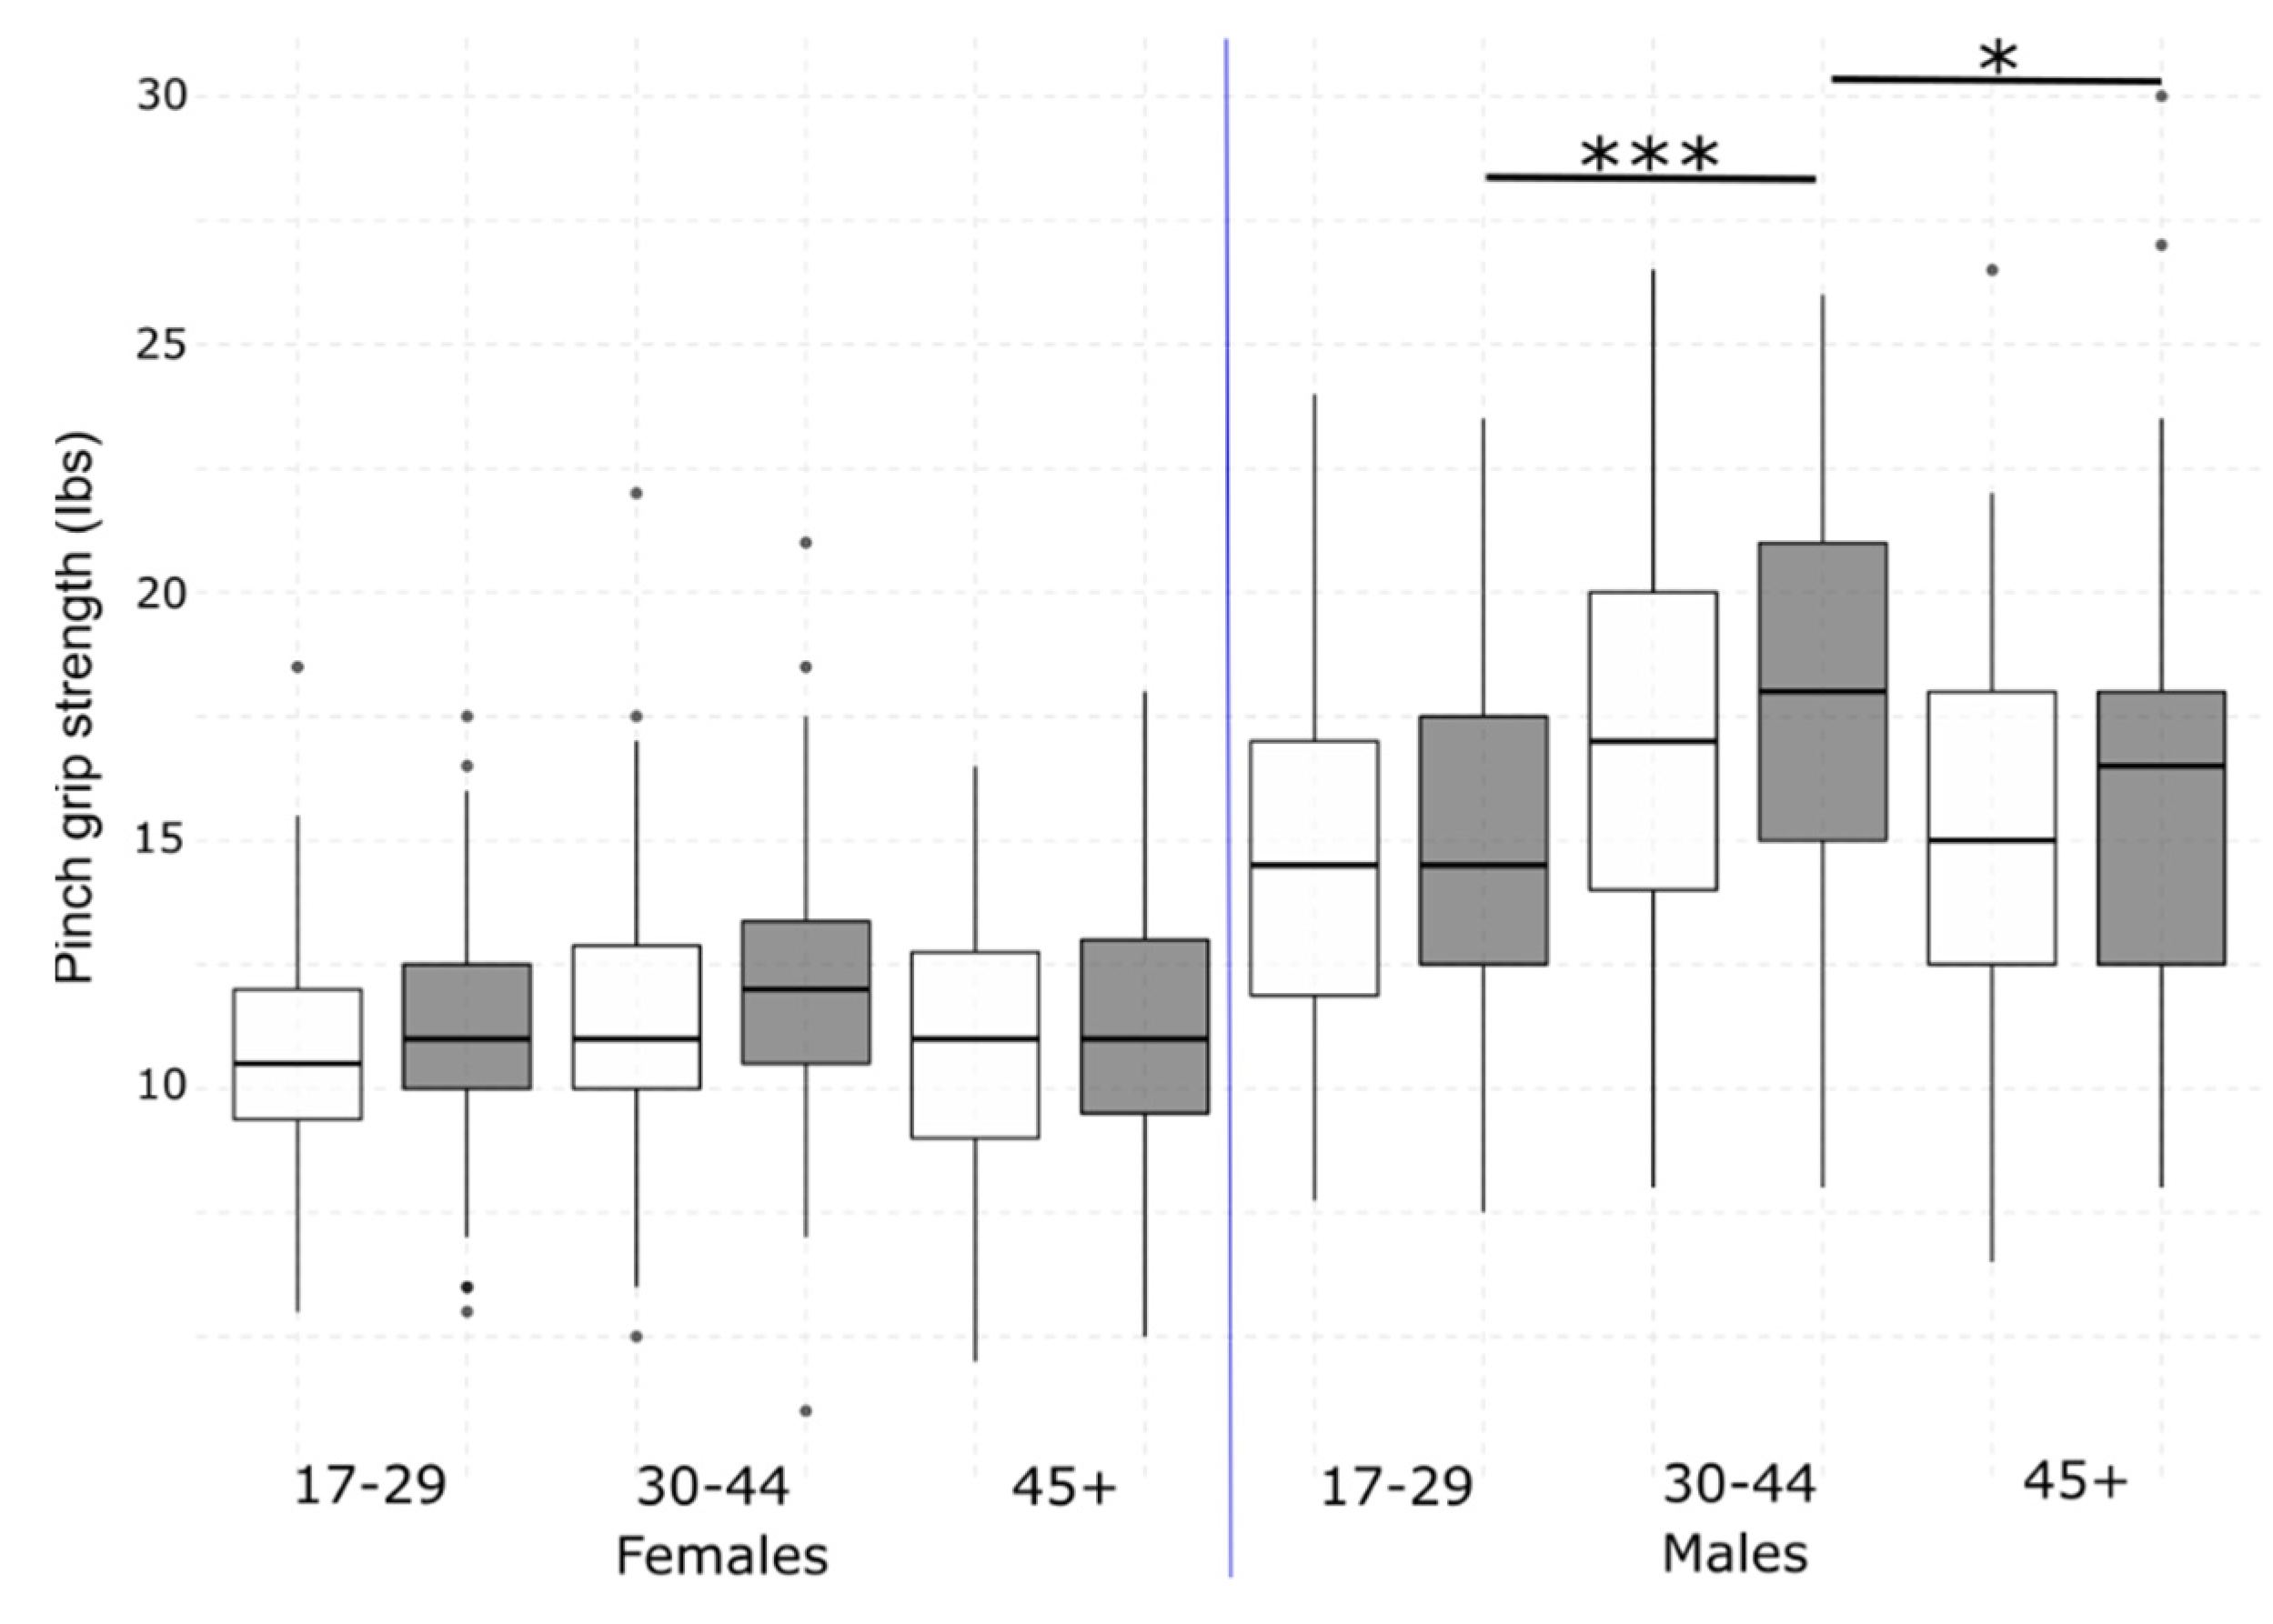
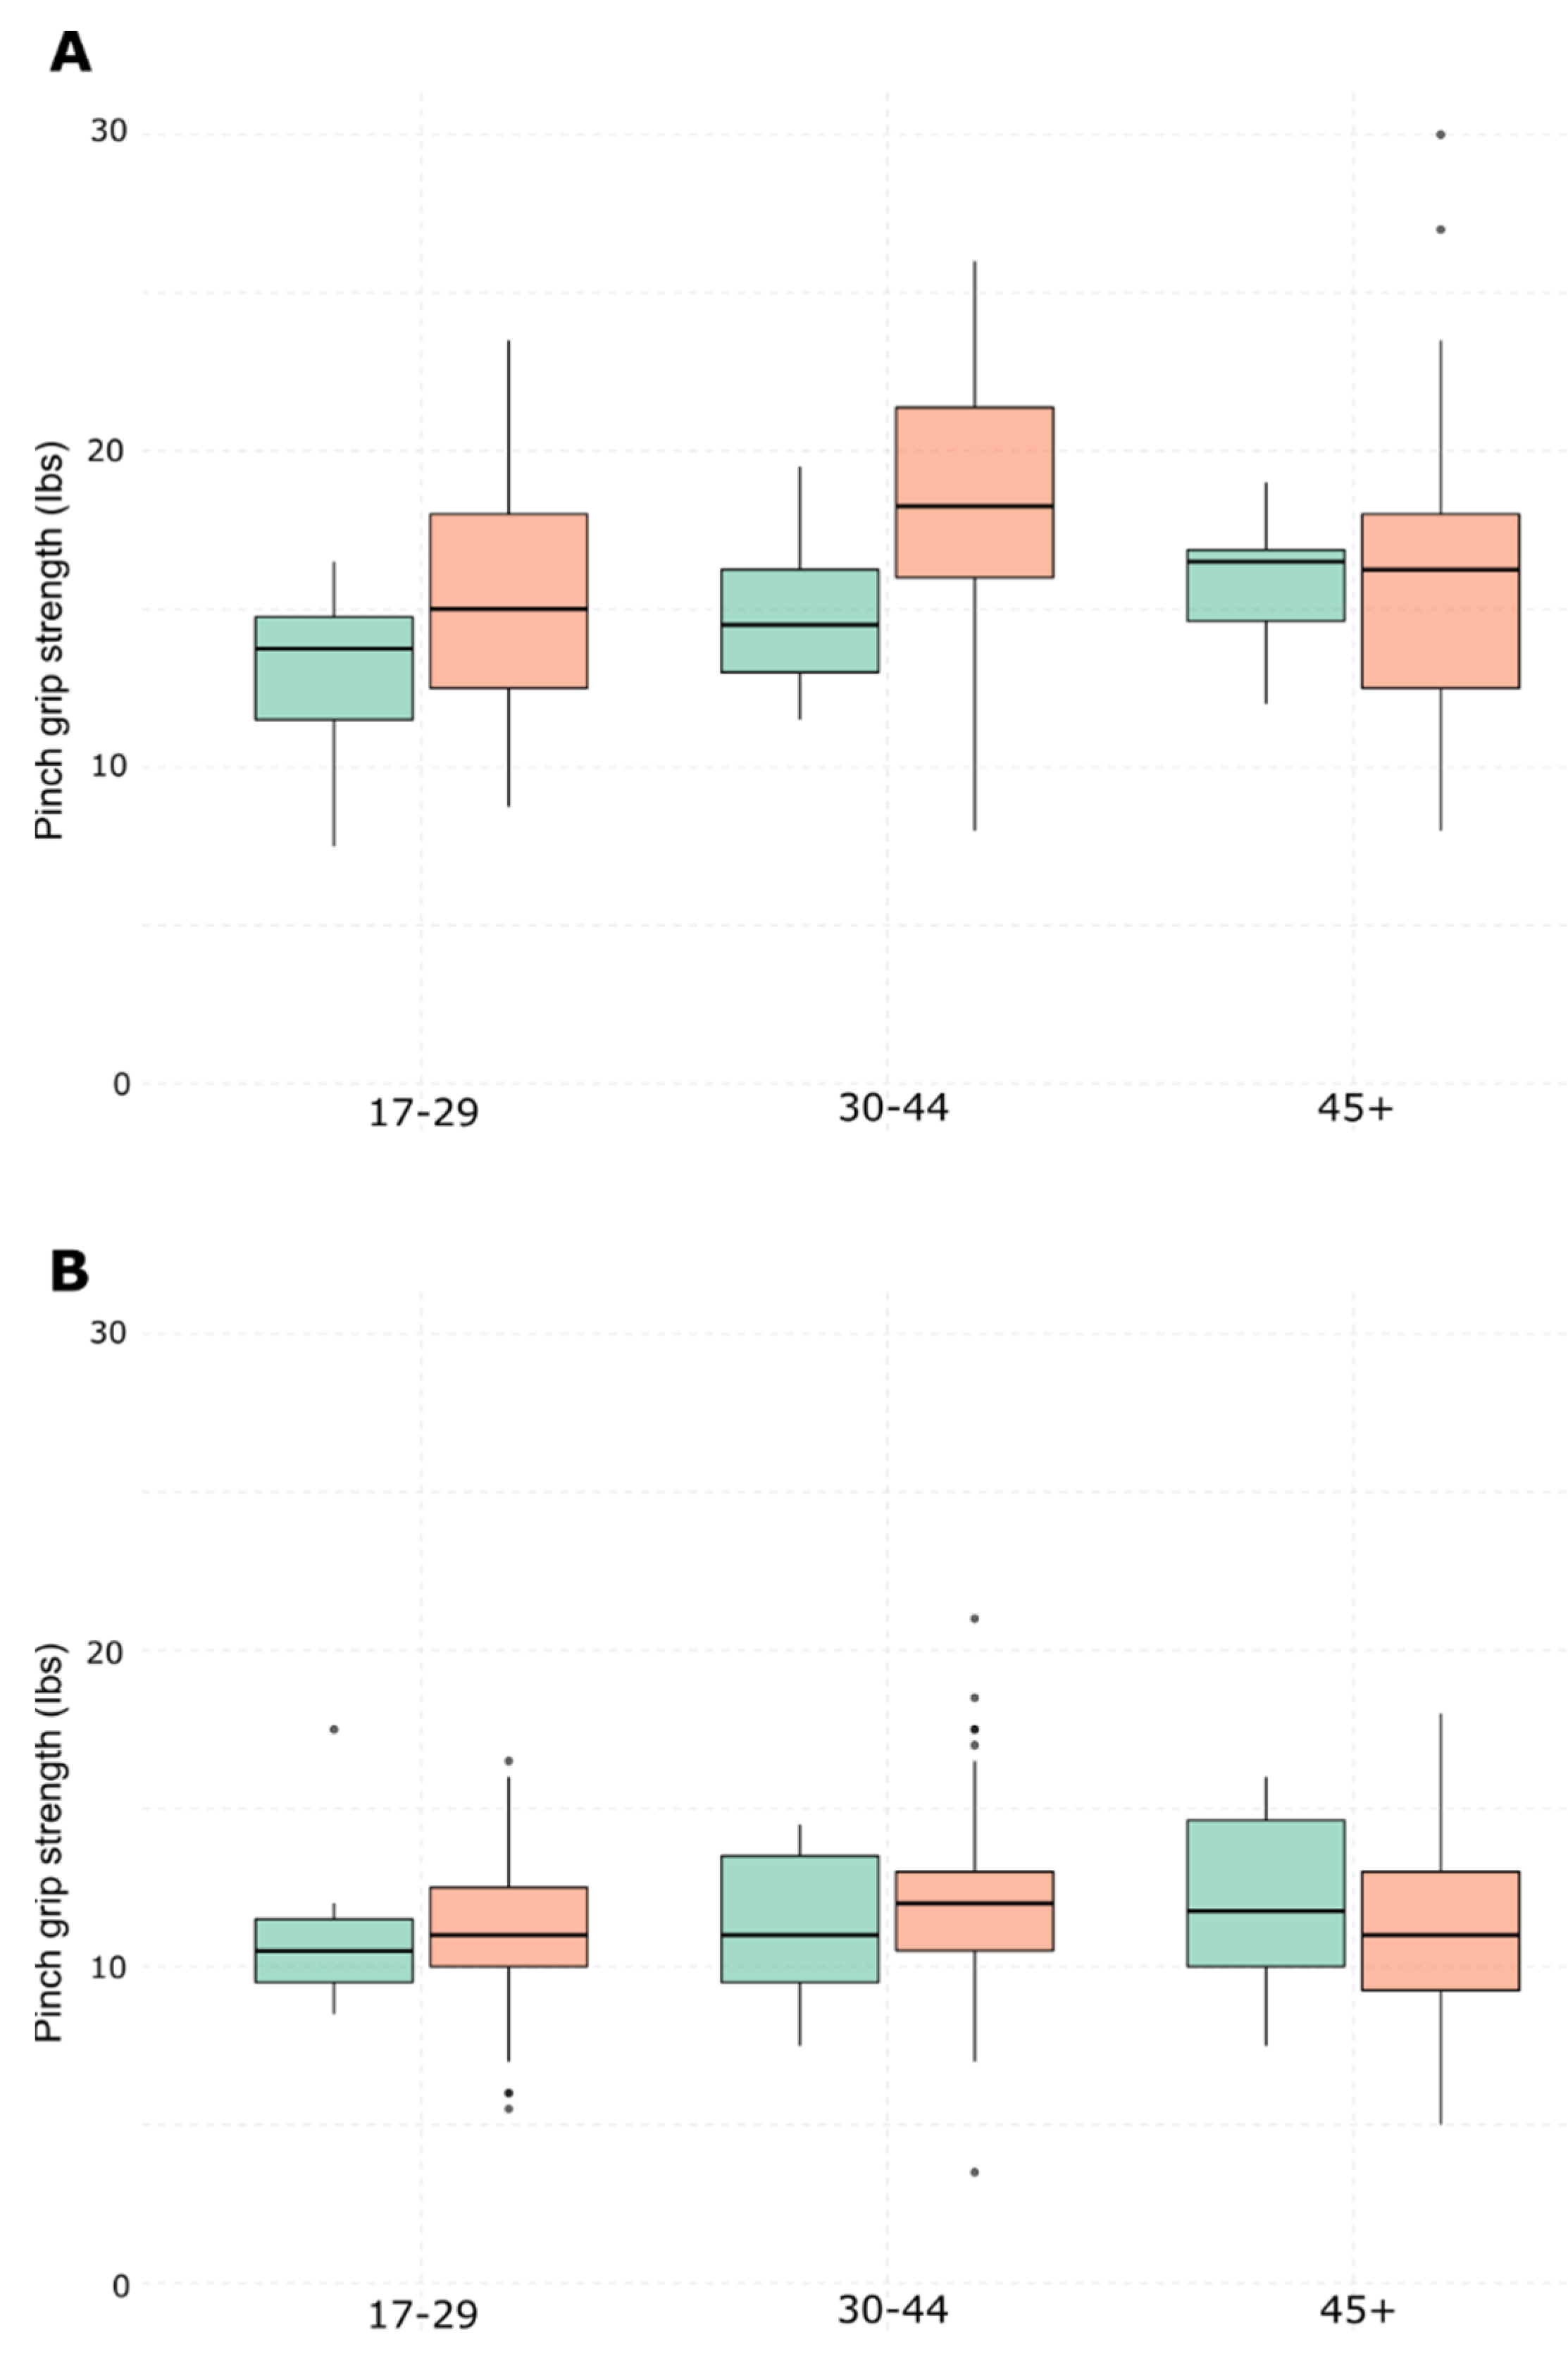
3.1. Pinch Grip Strength
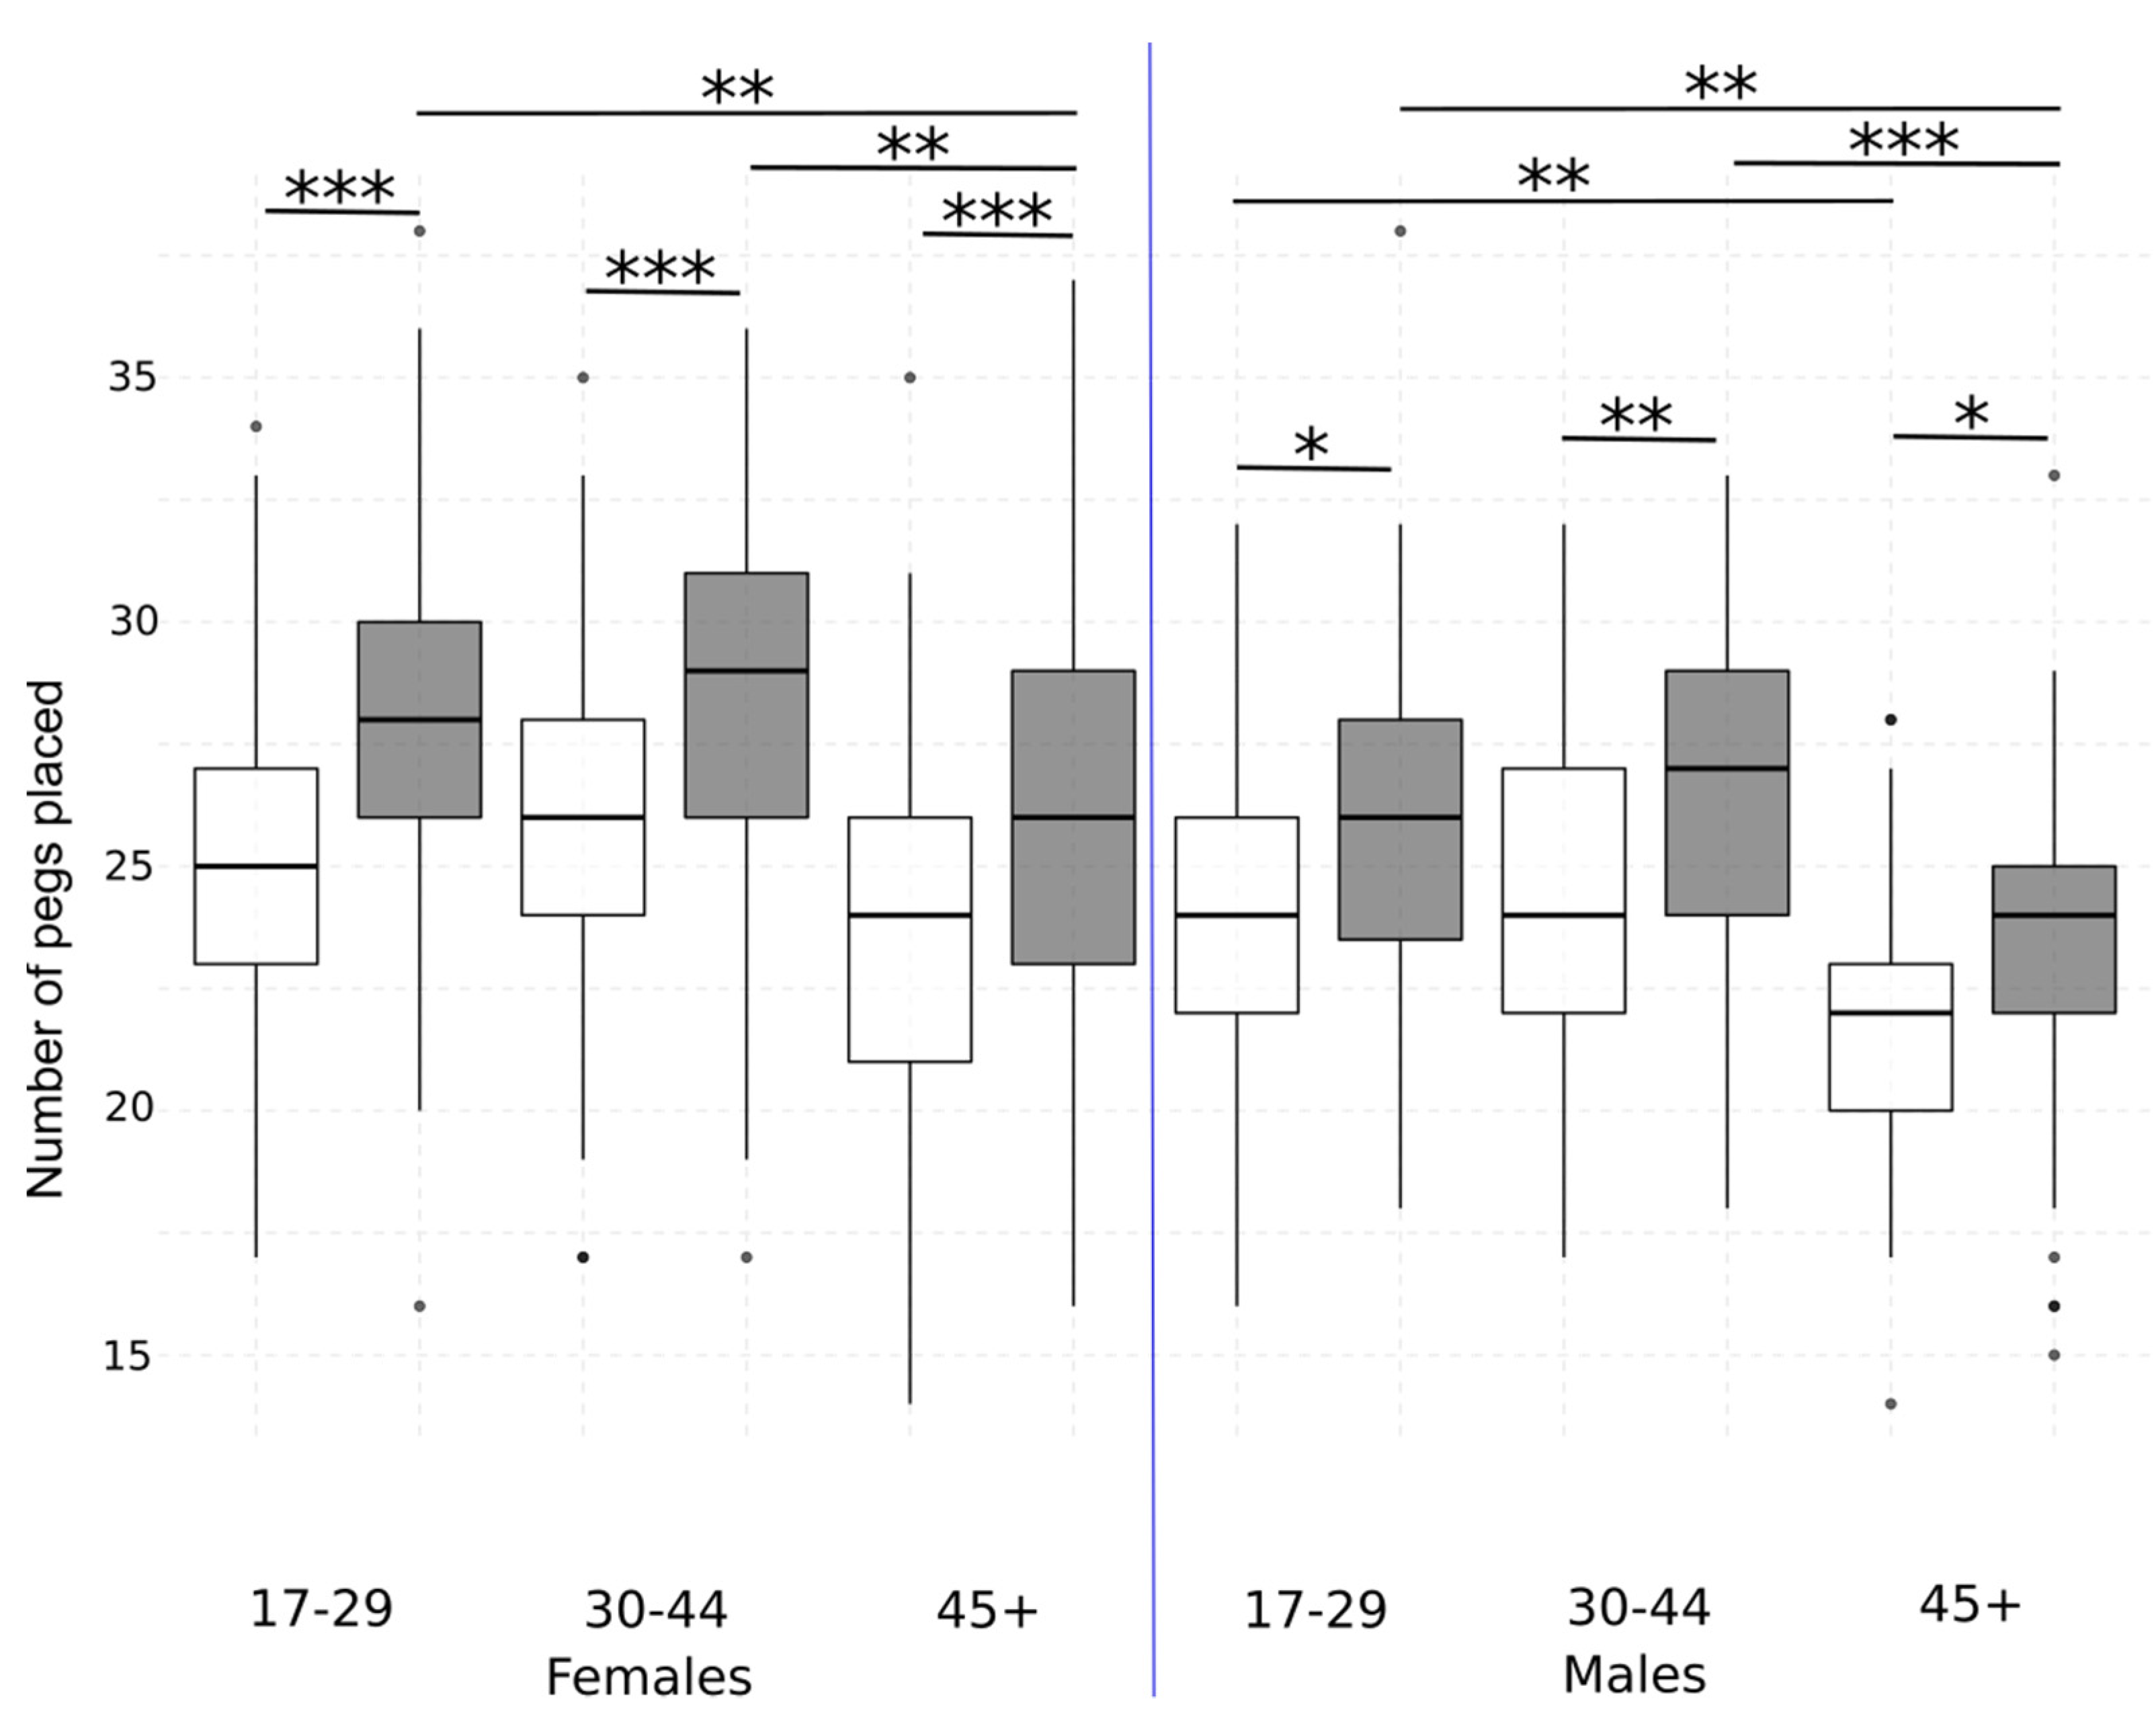
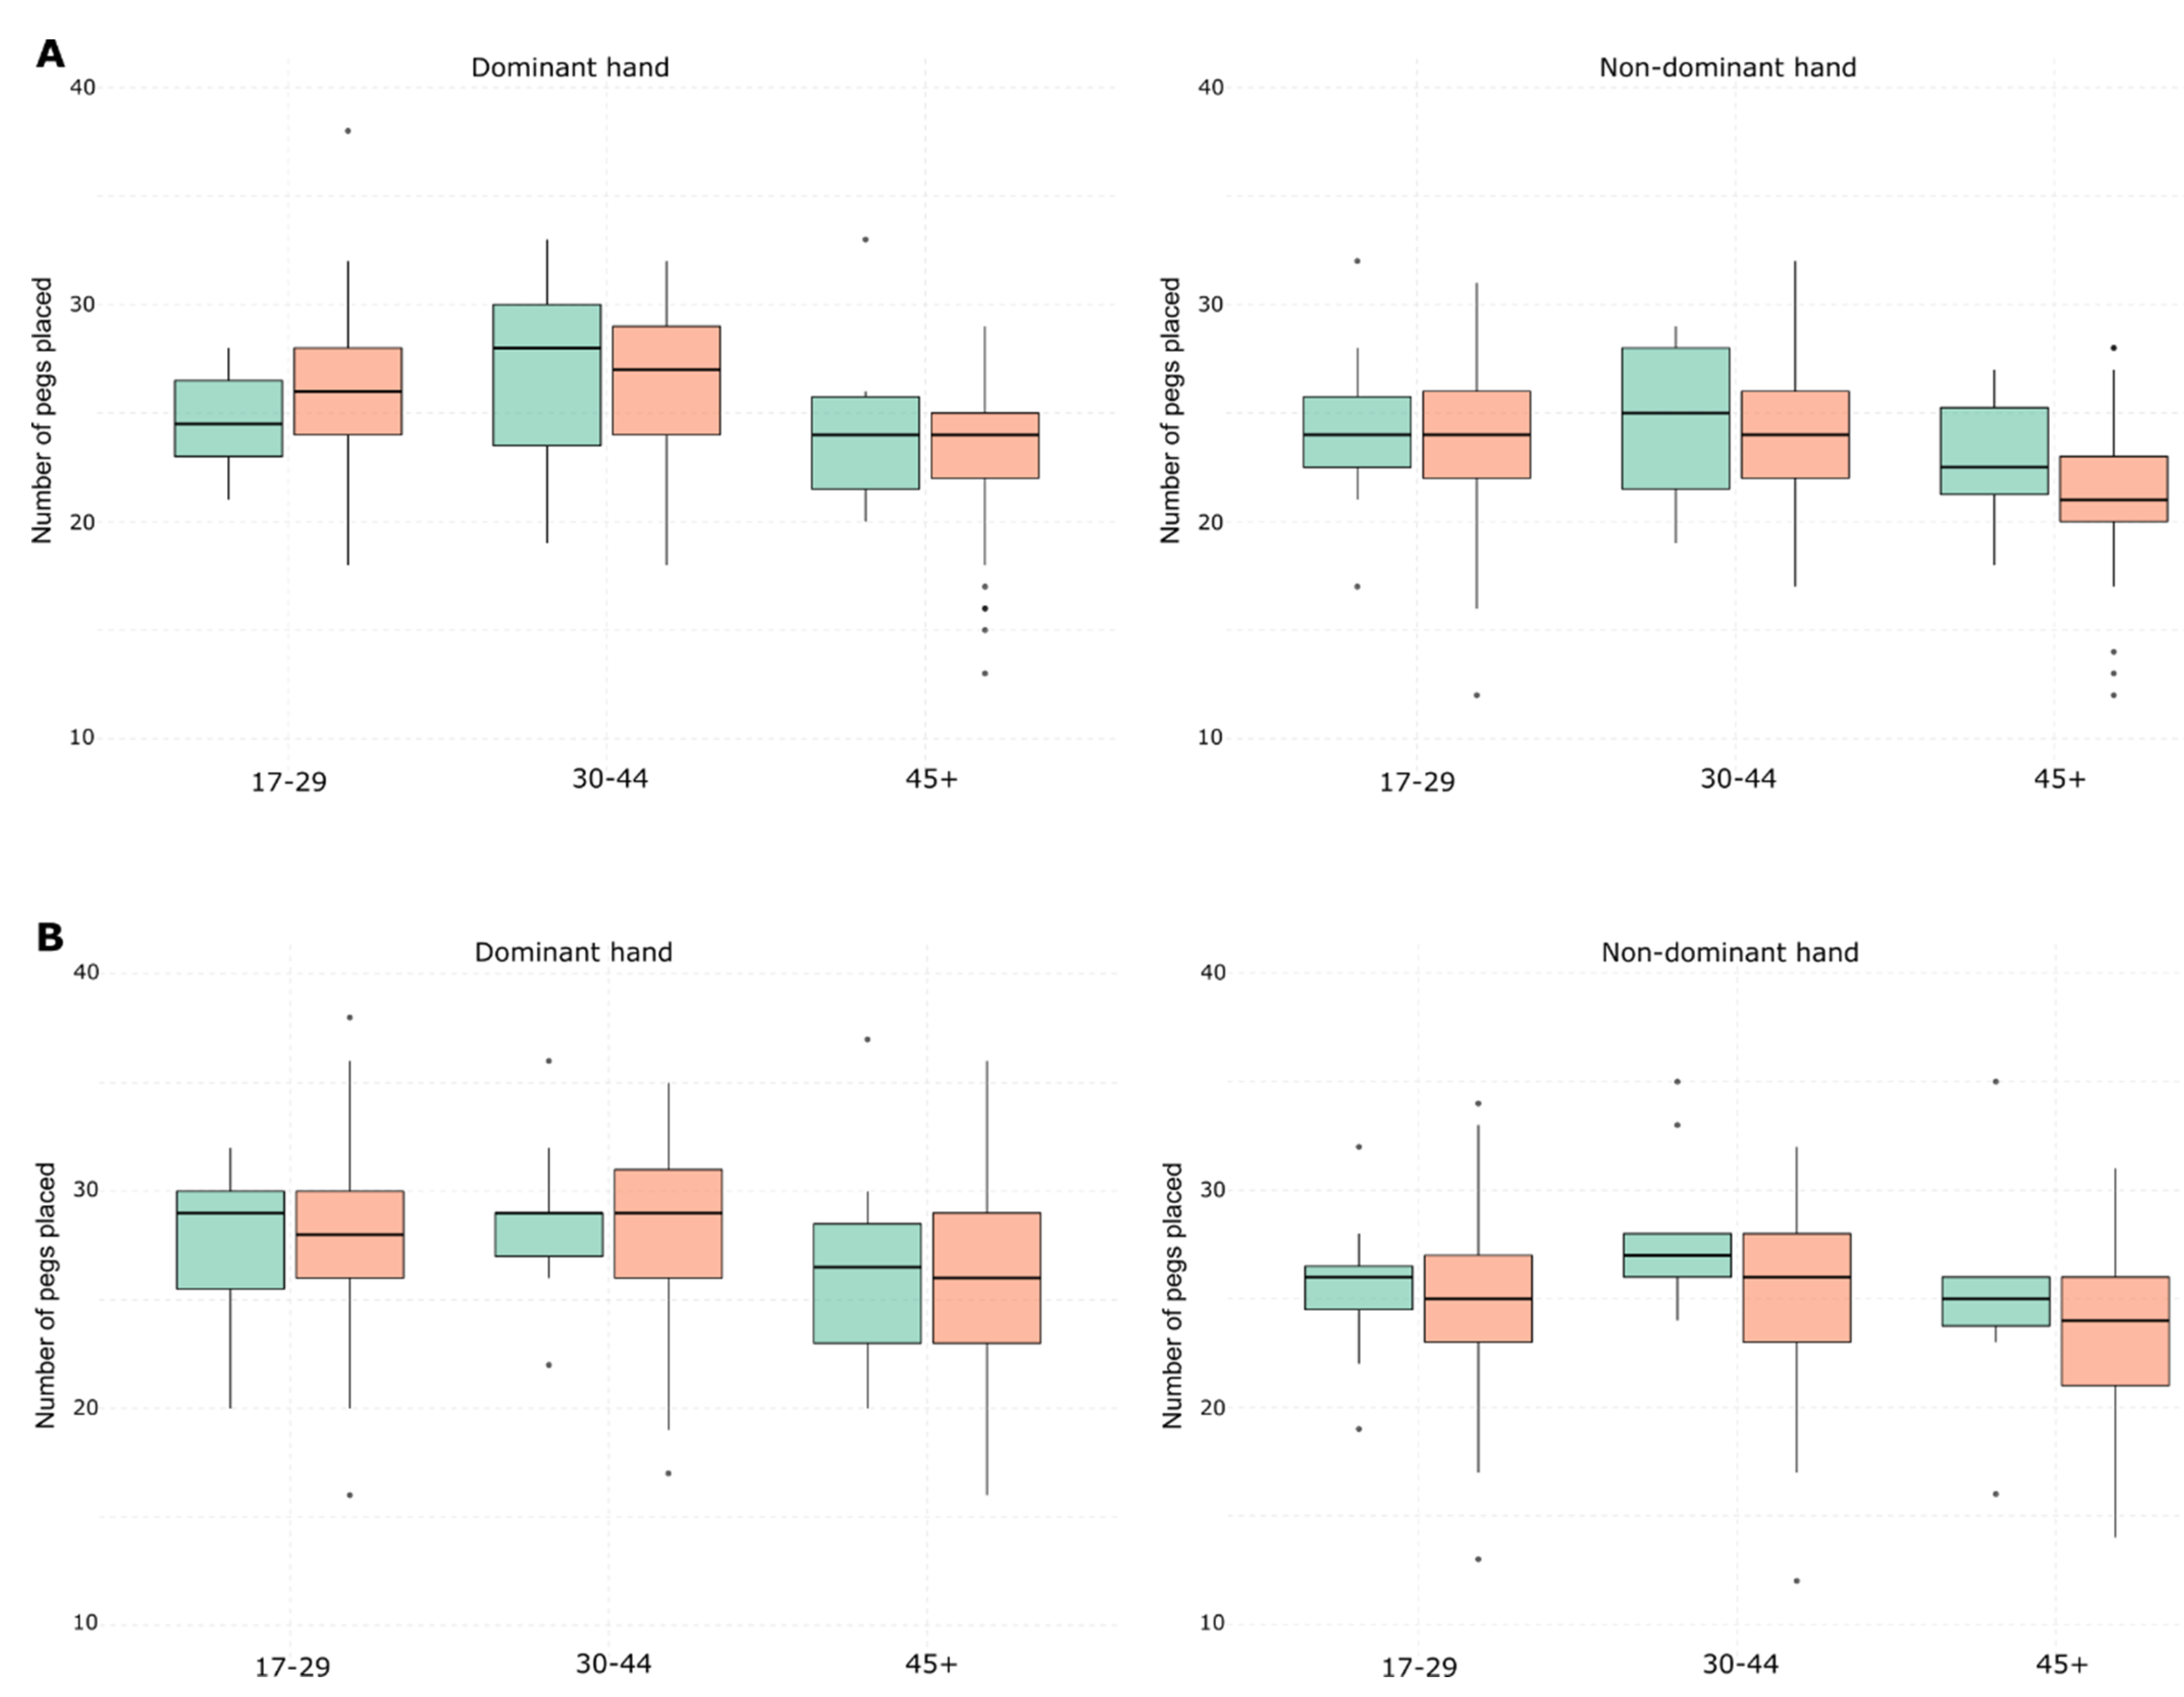
We first investigated the effect of sex and hand dominance on pinch strength, and relative pinch strength in which hand area was used as a proxy for size. Kruskal–Wallis tests showed significant differences in both the absolute pinch grip strength (χ2(3, n = 1112) = 382.88, p < 0.0001, ε2 = 0.34) and the relative pinch grip strength (χ2(3, n = 1112) = 109.79, p < 0.001, ε2 = 0.09) across sexes and hand dominance. Post-hoc tests using Dunn’s test showed that males were significantly stronger than females in both the dominant (absolute pinch grip strength, Z = 13.38, n = 556, p < 0.0001; relative pinch grip strength, Z = 6.87, n = 556, p < 0.0001) and non-dominant hand (absolute pinch grip strength, Z = 14.03, n = 556, p < 0.0001; relative pinch grip strength, Z = 7.42, n = 556, p < 0.0001). No significant differences were found between the dominant and the non-dominant hand within either sex (for both absolute and relative pinch grip, p > 0.05), indicating no hand dominance asymmetry in either females or males for pinch grip strength (Figure 4). Furthermore, post-hoc tests showed no significant differences in pinch grip strength between the hands within any age category or for either sex (p > 0.05) (Figure 4). Levene’s test revealed that males showed significantly more variation in pinch grip strength in both hands than females across all age categories (F(3, 1112) = 43.04, p < 0.0001, η2 = 0.1).
We then tested the effect of different variables on pinch grip strength for each sex for the dominant hand only, given that no hand dominance asymmetry was found in either females or males. These variables were age category, directional asymmetry (i.e., DA, handedness), anthropometric measurements (hand shape and thumb-index ratio) and, lifestyle factors (occupation, playing a musical instrument, playing sport). Kruskal–Wallis tests showed significant differences in pinch grip strength across age categories in males (χ2(2, n = 219) = 20.90, p < 0.0001, ε2 = 0.9), with middle age (30–44) males being stronger than the younger (17–29) (Z = 4.53, n = 156, p < 0.0001) and the older (45+) (Z = 4.53, n = 132, p < 0.05) age categories. No significant differences were found for females (Figure 4). Wilcoxon rank-sum tests with continuity correction showed that right-handed males were significantly stronger than left-handed males (W = 1490, p < 0.05) with no differences within any age category (p > 0.05), while no effect was found for females (p > 0.05) (Figure 5). No effect of lifestyle factors was found for either males or females (Kruskal–Wallis tests and Wilcoxon rank-sum tests with continuity correction, p > 0.05; Table S1). Spearman Rank Correlation tests showed a significant positive correlation between pinch grip strength and hand shape for both males (rs(219) = 0.224, p < 0.001) and females (rs(337) = 0.145, p < 0.01), indicating that participants with wider hands were significantly stronger than participants with longer hands (Figure 6). No effect of thumb-index ratio was found on pinch grip strength for males or females (p > 0.05), despite the large variability of the thumb-index ratio found within males (ranged from 0.79 to 1.07 for the dominant hand and from 0.77 to 1.03 for the non-dominant hand) and females (ranged from 0.78 to 1.13 for the dominant hand and from 0.78 to 1.07 for the non-dominant hand).

3.2. Pegboard Test

We first investigated the effect of sex and hand dominance on the number of pegs correctly placed by each hand, and relative number of pegs in which hand area was used as a proxy for size. Kruskal–Wallis tests showed significant differences in both the absolute number of pegs (χ2(3, n = 1112) = 181.64, p < 0.0001, ε2 = 0.16) and the relative number of pegs (χ2(3, n = 1112) = 425.12, p < 0.001, ε2 = 0.38) across sexes and hand dominance. A post-hoc Dunn’s test showed that females were more dexterous (placing more pegs) than males with both the dominant hand (absolute number of pegs placed, Z = 6.81, n = 556, p < 0.0001; relative number of pegs placed, Z = 14.65, n = 556, p < 0.0001) and the non-dominant hand (absolute number of pegs placed, Z = 4.44, n = 556, p < 0.0001; relative number of pegs placed, Z = 12.95, n = 556, p < 0.0001) (Figure 7). Both females (absolute number of pegs placed, Z = 9.41, n = 337, p < 0.0001; relative number of pegs placed, Z = 5.83, n = 337, p < 0.0001) and males (absolute number of pegs placed, Z = 12.95, n = 219, p < 0.0001; relative number of pegs placed, Z = 3.16, n = 219, p < 0.01) were more dexterous with their dominant hand compared to their non-dominant hand, indicating hand dominance asymmetry for the pegboard test. We tested for possible differences in the strength of hand dominance asymmetry across ages, and post-hoc Dunn’s test showed significant differences in pegboard test result between both hands for both females and males in all age categories (Figure 7). Levene’s test revealed no significant differences in variance between the sexes for both hands (F(3, 1112) = 0.638, p > 0.05, η2 = 0.001).
We then tested the effect of different variables on pegboard results for each sex and each hand, given that we found hand dominance asymmetry in both sexes. These variables were age category, directional asymmetry, anthropometric measurements (hand shape and thumb-index ratio), and lifestyle factors (occupation, playing music instrument, playing sport). Kruskal–Wallis tests showed significant differences in pegboard test results across age categories and for both hands in males (χ2(5, n = 438) = 76.92, p < 0.0001, ε2 = 0.17) and in females (χ2(5, n = 674) = 122.86, p < 0.0001, ε2 = 0.18). Post-hoc Dunn’s test showed significant differences between some age categories for both females and males; for the dominant hand, young (17–29) and middle (30–44) age categories were more dexterous than older (45+) participants, and middle-age participants were stronger than younger participants but for the non-dominant hand of males only (Figure 7). Wilcoxon rank-sum tests with continuity correction showed that left-handed females were significantly more dexterous than right-handed females for the non-dominant hand only (W = 5253.5, p = 0.05) but with no differences between age categories (p > 0.05), and no effect was found for males (Figure 8). No effect of occupation and playing sport were found for either males or females for both hands (Kruskal–Wallis tests and Wilcoxon rank-sum tests with continuity correction, p > 0.05; Table S2), while females playing a musical instrument were more dexterous for both hands than the females who did not play (dominant hand, W = 10,358, p < 0.05; non-dominant hand, W = 9928.5, p < 0.01), but with no significant differences between age categories (p > 0.05; Table S2). Spearman Rank Correlation tests showed no significant correlation between pegboard results and hand shape and thumb-index ratio in either males or females (p > 0.05).

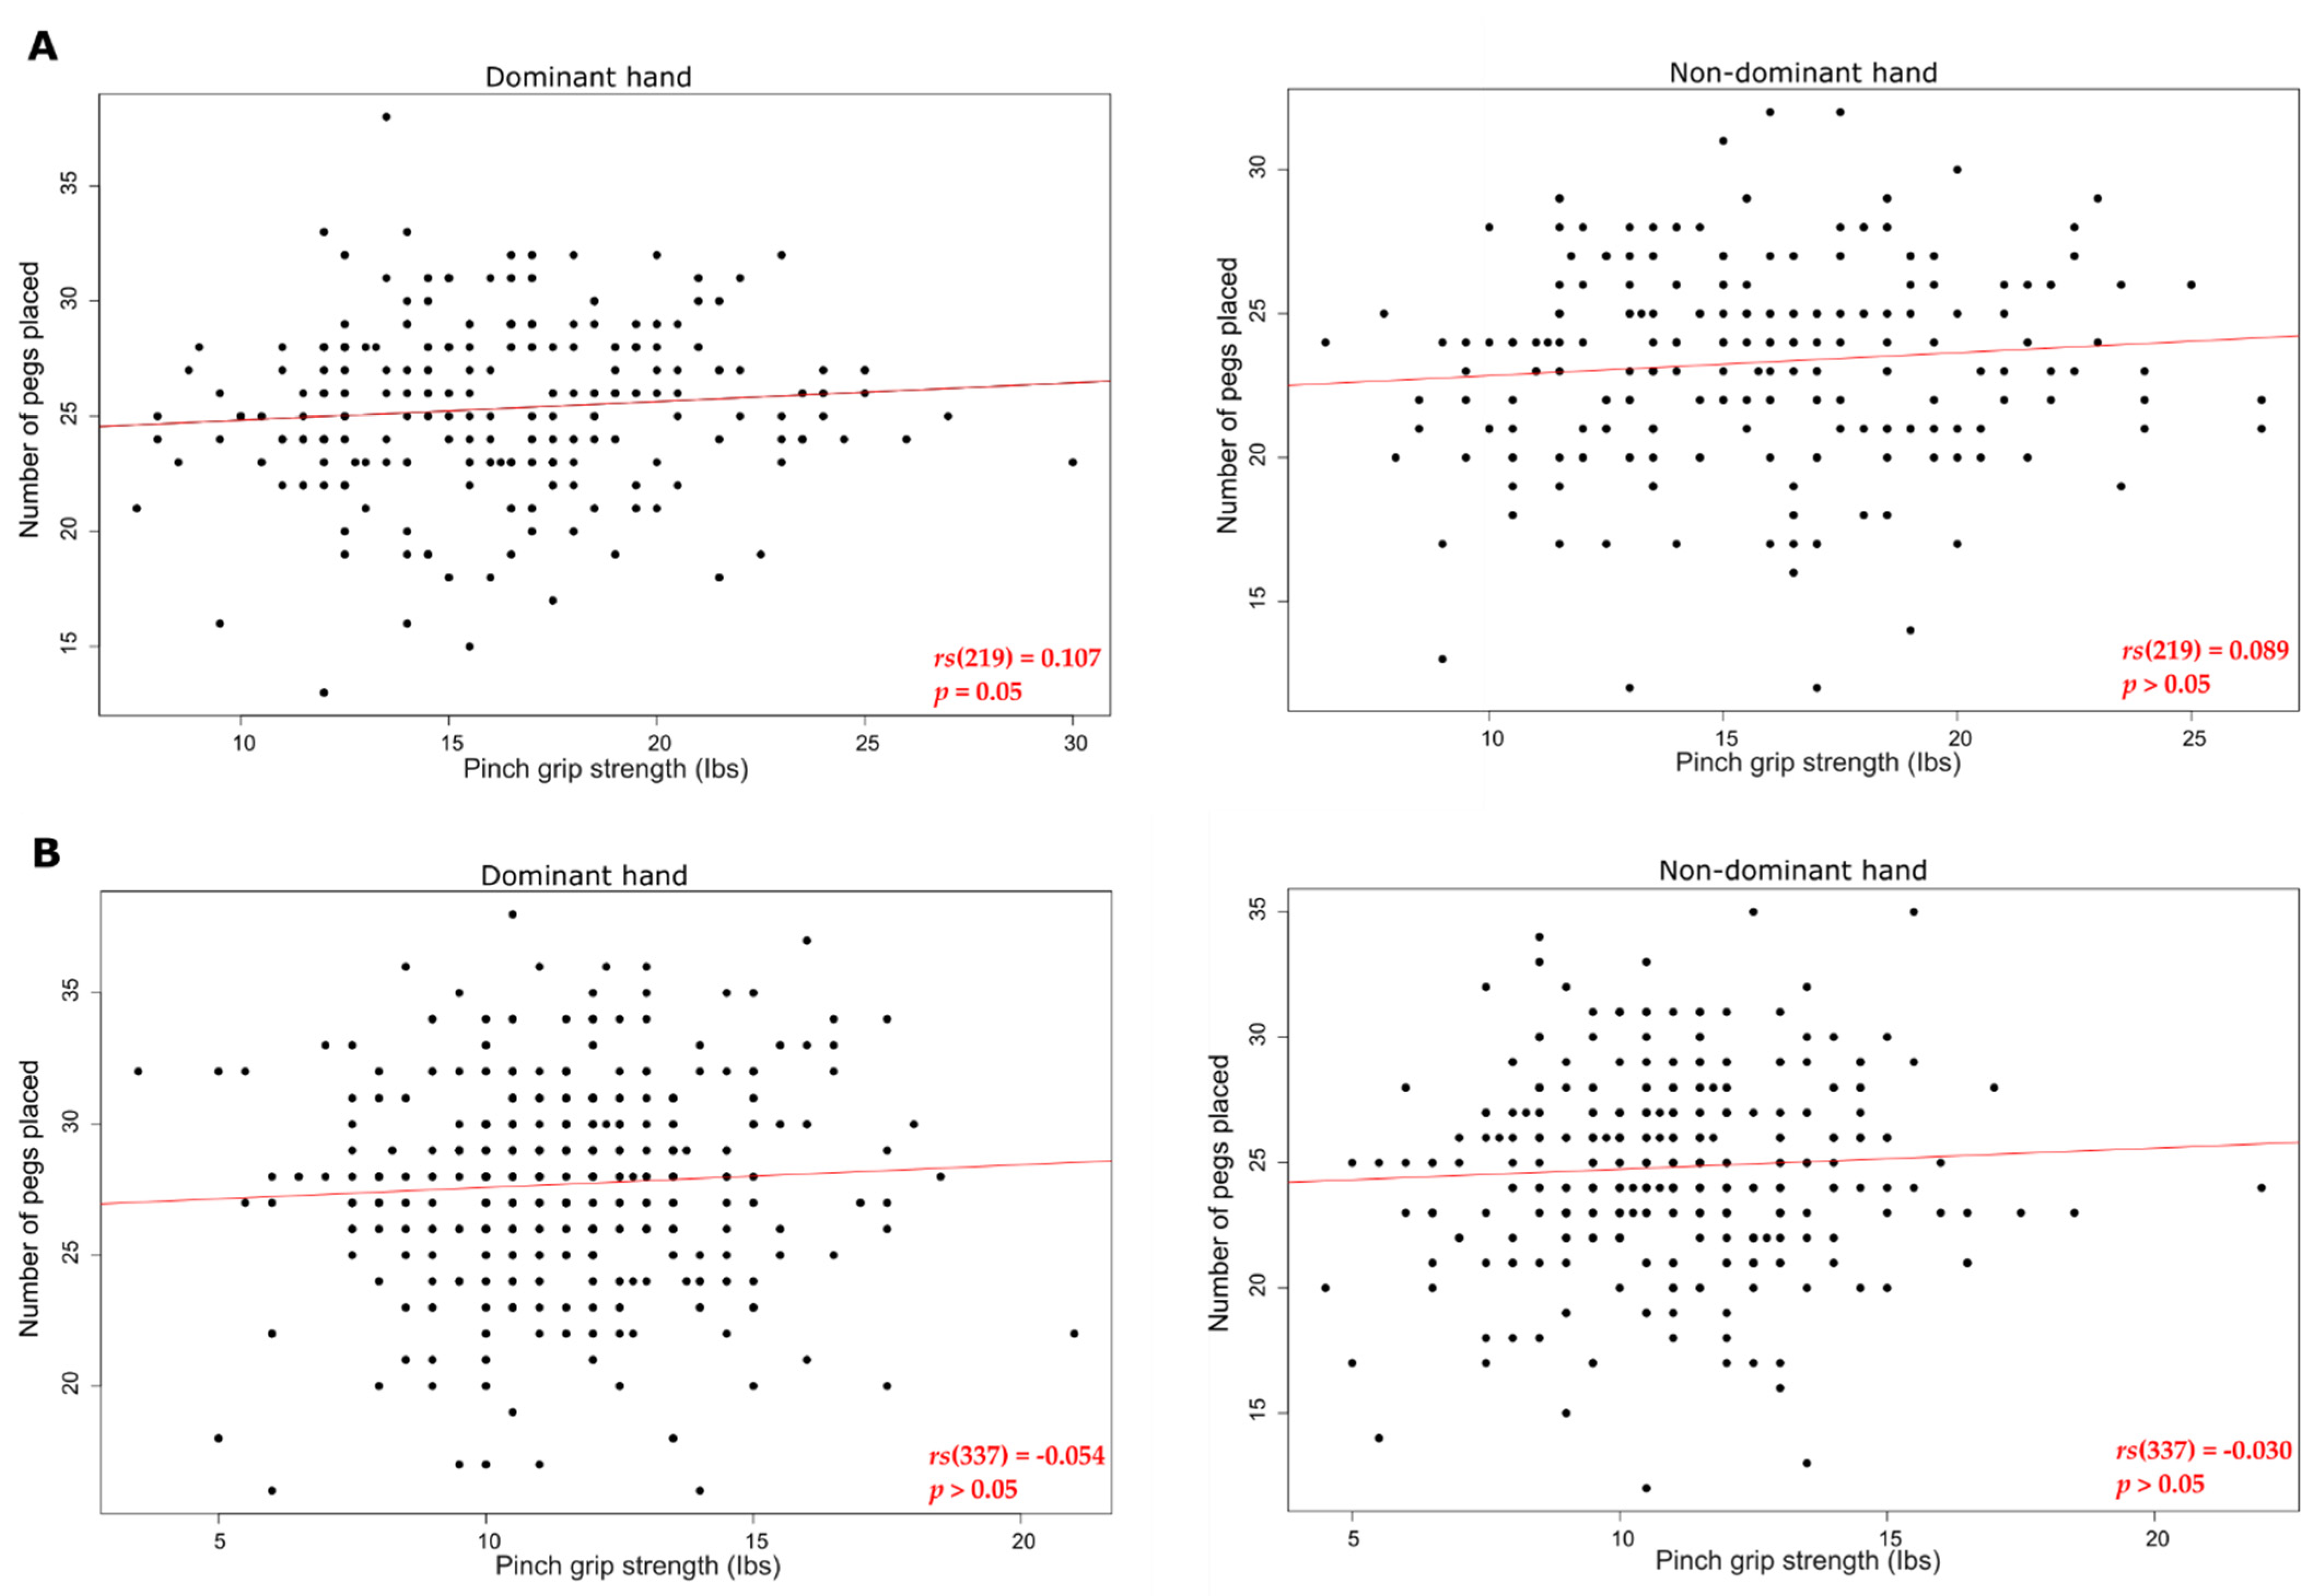
3.3. Correlation between Pinch Grip Strength and Pegboard Test

We investigated if the stronger participants were the more dexterous at the pegboard test for each sex and each hand using Spearman Rank Correlations. Only males were more dexterous with a stronger dominant hand (rs(219) = 0.107, p = 0.05) but not with their non-dominant hand (rs(219) = 0.089, p > 0.05), while females were not (both hands p > 0.05) (Figure 9).

4. Discussion

The present study was conducted to evaluate the link between form and function for both hands in modern humans and to provide a referential context to help better understand the evolution of human dexterity. We tested four predictions based on previous studies and further explored the influence of hand shape and thumb-index finger ratio on two measures of hand function: pinch grip strength and manual dexterity. Our results indicate that hand function is significantly influenced by different demographic and anthropometric characteristics as well as certain manual activities.
Our first prediction that males would have stronger pinch grip strength and females would be more dexterous compared to the opposite sex was supported, which is consistent with previous studies [12,24,26,27,53]. Sex differences have traditionally been thought to reflect gross power for grip strength [11,12,13]. However, it is reasonable to assume that overall grip strength or dexterity may also be influenced by differences in hand size and/or shape, which may explain previously documented sex differences [23,54]. Therefore, we tested for significant differences between sexes using both absolute values and relative values in which total hand area was used as a proxy for size. We found similar results for both absolute and relative values indicating that variation in hand size alone cannot explain the differences between males and females. In other words, even when accounting for variation in hand size, females were still significantly more dexterous than males, and males were still stronger than females. However, we did find that hand shape affected pinch grip strength in both hands for both sexes, with participants that had wider hands being stronger than those that had longer hands. This result is consistent with our previous study of power grip strength [43]. Hand shape did not significantly affect performance in the pegboard task in either sex, which is consistent with the results of Sivagnanasunderam et al. [28]. Overall, variation in modern human hand shape affected hand strength but not manual dexterity in our sample.
Interestingly, we found no effect of thumb-index finger ratio on either pinch grip strength or manual dexterity. This result was somewhat surprising given the importance of relative thumb length in evolutionary hypotheses about human dexterity (e.g., [1,4,6,10,55]). Previous studies of human participants report mixed results. For example, Su et al. [56] showed an effect of thumb and index finger length on pinch strength of the right hand in a sample of Taiwanese adults, while Maleki-Ghahfarokni et al. [19] found no correlation between pinch grip strength and finger length in a sample of Iranian adults. However, cross-study comparisons should be interpreted with caution because hand size is known to vary across populations [57,58,59] and our study tested a diverse, international sample across the lifespan. This is the first study to our knowledge that looked at the variability of the thumb-index ratio and its influence on dexterity. More studies on human hand morphology in international samples are needed to fully test the effect of human thumb-index ratio variability on both dexterity and grip strength.
We predicted that younger participants would be stronger and more dexterous than the older participants, which was only partially supported. We found that pinch grip strength was affected by age for males (dominant hand) but not for females. These results contrast with prior research indicating decreased grip strength in both males and females due to muscle degeneration during aging [14]. We found that middle-age (30–44) male participants were, on average, stronger than the older (45+) and younger (17–29) participants, which is consistent with our previous results for power grip strength on the same sample [43]. However, age did significantly influence the pegboard results for both sexes (dominant hand), supporting our prediction. We found that both male and female young- and middle-aged participants were more dexterous (dominant hand) than older participants. Our results are consistent with other studies showing that manual dexterity decreased with age (e.g., [24,60]) and with Dayanidhi and Valero-Cuevas [61] who found that dexterity decreased with age but was not correlated with the decline in pinch strength, similar to our results for females. This variation in age-related effects on pinch grip strength in females described above could potentially be explained, at least in part, by differences in sampling methodology. The location of our study within a public museum may elicit some sample bias, attracting older participants that are generally more active (i.e., practicing different manual activities such as sport or gardening) than previous studies sampling targeted populations (e.g., [24]). Additionally, we excluded individuals who may have age-related conditions affecting hand strength (e.g., arthritis), which would further bias the strength and dexterity measures in the older age categories. Moreover, our study sample included international participants. Cultural differences may have some influence over the results, as shown in research by Michimata et al. [18] who found decreases in hand function of the dominant hand in adults over 50 years of age in Japan while other studies, in non-specific populations, showed a decrease at 65 years of age [14].
We predicted hand dominance asymmetry in both sexes, with the dominant hand being significantly stronger and more dexterous relative to the non-dominant hand. This prediction was only partially supported. No hand dominance asymmetry was found for pinch grip strength in either sex or across age categories. This result contrasts with previous studies that reported greater pinch grip strength in the dominant hand compared with the non-dominant hand [19,24,53,62]. It is interesting to note that we previously found hand dominance asymmetry for power grip strength in the same sample [43]. Other studies have yielded mixed results: for example, Shim et al. [63] found no difference between the dominant and non-dominant hand for pinch grip strength in a sample of 336 males and females, while Gachette and Lauwers [12] found that only females (but not males) were stronger in their dominant hand than their non-dominant hand in a sample of 309. These varying results might be attributed to different methodologies across studies [64,65], challenges in measuring pinch grip consistently across studies [46,66], and/or within-participant factors, such as differences in body weight and height, or nutrition [67,68]. Our study used a larger and more heterogeneous sample than the majority of previous studies (including all of the studies cited above) and pinch grip was measured consistently using the same protocol, which may be an indicator of the robustness of our findings and could shed light on the mixed results of previous research.
We found hand dominance asymmetry for the pegboard test for both sexes, in which the dominant hand was significantly more dexterous than the non-dominant hand, as we predicted. This result is consistent with previous studies [18,69]. Moreover, our male and female samples consistently showed greater dexterity in their dominant hand, and within each age category. This could indicate no aging effect on hand dominance asymmetry for dexterity for both males and females.
We also predicted that we would find directional asymmetry (DA) in pinch grip strength and dexterity, with right-handed individuals showing the greater difference between the dominant and non-dominant hands than left-handed individuals. This prediction was, again, partially supported, with pinch grip strength being a good indicator of handedness for males but not for females. DA was found with right-handed males who were significantly stronger than left-handed males for both hands. Interestingly, we previously found no effect of DA in power grip strength in either sex in the same sample [43]. In contrast to our pinch grip results, we found DA for the pegboard task only in females (but not males) and only for their non-dominant hand, with left-handed females who were significantly more dexterous than right-handed females. This result could be explained by the fact that left-handed individuals must live in a world more adapted for right-handed individuals and that they may be expected to show more symmetry in dexterity between their hands. There are no comparable studies of which we are aware that have evaluated the effects of handedness on pinch grip strength and manual dexterity. Indeed, most previous studies have focused more on right-handed individuals given the much lower proportion of left-handed individuals across human populations [70,71,72,73]. Left-handed individuals comprised 8.7% of our total sample, which, although comparable to the proportion of left-handed individuals across all humans (8–10% [70]; but [74] with 26.9% of left-handed among the Eipo in Papua New Guinea), is still a relatively small sample. Therefore, our results for left-handed individuals should be considered with caution.
Finally, we predicted that individuals that frequently practiced manual activities would have significantly higher pinch grip strength (i.e., manual sports activities or manual labor) or greater dexterity (i.e., playing a musical instrument or precision-based occupations) than those that do not frequently engage in these activities. This prediction was only partially supported. Regarding musical activities, female participants who reportedly played a musical instrument involving the hands had significantly higher manual dexterity than females who do not play an instrument, while no effect was found for males. It is important to acknowledge that the lack of effect in males may be due to a smaller sample size (n = 74) than that of females (n = 103) playing a musical instrument, although they were roughly equally distributed across different age categories for both females and males. This sex difference may also be a result of variation in the frequency of playing or the practice of different types of musical instruments. Wagner [41] and Parlitz et al. [42] found that pianists have significantly higher dexterity ability than non-pianists. However, there are no studies on other musical instruments of which we are aware have investigated the potential effect on manual dexterity. A limitation of our study is that we were not able to collect details on the musical instrument played.
We found no effect of playing an instrument on pinch grip strength, contrary to our prediction. This result also runs counter to Sims et al. [38], who found that musicians’ hands are generally more sensitive but weaker in all instrument divisions (no tests were run across the different subgroups of musicians) in comparison to non-musicians. However, most previous research has focused on expert musicians (e.g., [40]), while the findings of our study potentially better represent the general population. Future analyses of the influence of playing a musical instrument on pinch grip strength and dexterity should investigate the frequency and years of practice, as well as at which age individuals started to play, to assess the level of experience more accurately. Indeed, we can suppose different degrees of experience across our sample, and in this case, with females who may have a higher level (i.e., more years of practice) than males.
We found no significant influence of manual occupations on either pinch grip strength or dexterity, which was contrary to our prediction. Our results are also in contrast with the few studies investigating the effects of occupation on hand function. Josty et al. [22] found that heavy manual workers had increased pinch strength in both hands compared to office workers. Doğan [21] found that industrial workers had greater power and pinch strength but lower manual dexterity, while office workers showed the opposite pattern. However, it is important to note that in our study forceful manual laborers and precision laborers only made up 16% of the total sample (Table 1) as we did not target individuals in specific occupations as previous studies did [21,22]. We also found no effect of practicing manual sports on either pinch grip strength or manual dexterity in both sexes, which is not consistent with our prediction. We found no studies looking at the effect of practicing the sport on both manual dexterity and pinch grip strength which prevents us to compare and discuss our results. Soyupek et al. [35] found that aerobic exercise had a positive effect on dexterity and muscle strength, but they tested power grip but not pinch grip strength. We suggest that practicing manual sports activities typically involve the use of the entire hand, and not just the thumb and index finger, which is supported by a significant effect of playing manual sports on power grip strength [43].
We found a significant relationship between dexterity and pinch grip strength only for males and for their dominant hand. Marmon et al. [60] and Martin et al. [11] found a strong predictive relationship between grip strength (pinch and power grip) and dexterity in all age ranges for both sexes. Specifically, they observed that individuals with weaker power grip strength typically scored lower during dexterity-based tasks (including a Grooved Pegboard test), which is consistent with our results for males. In contrast to this previous work, the females in our sample did not show a predictive relationship between pegboard scores and precision grip strength. However, this difference may reflect the fact that we tested this relationship in both hands while Martin et al. [11] tested only the dominant hand and Marmon et al. [60] tested both but did not analyze the hand dominance effect on the relationship between pinch grip strength and dexterity. We also analyzed a larger sample than either Martin et al. [11] (n = 107) or Marmon et al. [60] (n = 75), which may be an indicator of the robustness of our findings and could shed light on the mixed results of previous research.
In an evolutionary context, the results of this study can be used to better understand modern-day influences on human hand function. Two of the most important findings of our study from an evolutionary perspective were (1) the lack of a significant influence of thumb-index finger ratio and (2) the significant influence of hand shape on hand function. Regarding the thumb-index ratio, variability in this measure across a large, heterogeneous sample of humans has, to our knowledge, not previously been quantified. We found a large variability of thumb-index ratio and hand shape for both males and females, which will be a focus of future studies. This variability in living humans is important given that the thumb-index finger ratio is often used to model dexterity or pinch grip capabilities in humans (e.g., [75,76,77]) and to infer dexterity in fossil hominins and non-human apes [10,78,79]. We found that a higher thumb-index finger ratio within our sample was not associated with increased pinch grip strength or manual dexterity. It is important to acknowledge, however, that among a living human sample, the neurological processes that control hand function are well-established and thus variation in morphology may have a limited impact on strength or dexterity. In fossil hominins, although we are limited in what we can infer about brain function from the fossil record, it is safe to assume that at least early hominin species lacked human-like fine motor control of the human hand and that there may have been a stronger selective pressure on variation in hand morphology to enhance dexterity. Based on hand bone length only (i.e., without soft tissues), the associated hand skeletons of fossil hominin Australopithecus sediba (1.98 Ma; [80]) present an estimated thumb-index finger ratio higher than the median or mean of the Homo sapiens ratio [81,82], indicating a longer thumb for A. sediba than in humans. If we assume thumb-index ratios in fossil taxa would remain the same if we were able to estimate soft tissues, then A. sediba would have a relatively longer thumb compared with modern humans, which may suggest changes in relative hand proportions provided greater dexterity in the absence of human-like fine motor control. However, the high variability in living humans found in our sample could imply that there is a limit to what we can infer about dexterity from the thumb-index finger ratio alone in fossil hominins. Moreover, among non-human primates, research on great apes has shown that they frequently use precision grips, including pad-to-pad precision grips, despite having a short thumb relative to their index finger (e.g., [83,84,85,86,87]). Therefore, the thumb-index finger ratio alone cannot account for the large variation we see in precision grip use among living primates and may have more limited functional importance regarding dexterity in fossil hominins than traditionally thought.
In contrast to the thumb-index ratio, we found that individuals with wider, rather than longer, hands had significantly stronger pinch grip strength and, on the same sample in a previous study, stronger power grip strength [43]. However, hand width is rarely considered as a morphometric factor when inferring manual dexterity in fossil hominins. This is in part because accurately quantifying hand width requires complete preservation of the metacarpus, which is rare in the hominin fossil record, and hand width measures also incorporate soft tissues that do not preserve in the fossil record. Future studies of humans and extant apes that can quantify the correlation between metacarpus width and soft tissues of the palm would provide a crucial first step in inferring hand width from fossil remains. Moreover, understanding how modern-day influences affect hand form and function may be an important comparative tool for evolutionary inferences. Although our study did not find a significant influence of manual activities on hand function (apart from playing a musical instrument in females), future targeted studies that can better quantify the frequency and duration of different manual activities and their potential influence on hand function would offer a useful context in which to infer how precision- or power grip-related behaviors (e.g., tool manufacture and use) influenced the evolution of the human hand. More specifically, recognizing the relationship between form and functional change in the modern human population could enable a more comprehensive understanding of how and why the hand has changed over the last few million years.
There are some limitations of this study worth acknowledging. Investigating multiple variables and their associations in a single dataset makes it increasingly difficult to draw causal conclusions from the research. Moreover, previous studies have suggested that the pegboard test is not an accurate measure of ‘full’ manual dexterity, and we should not underestimate the range of movement coordination needed to be measured by dexterity-based tasks [88]. Dexterity is not solely based on the coordination between the thumb and the index finger but instead incorporates various grips and postures involving interactions with the other digits and palm. Analyzing the relation between form and function of the hand should realistically value the hand as a whole and not isolate dexterous movement to a select number of digits or features. A final limitation may be the use of a cross-sectional sample, rather than longitudinal data tracking the potential influence of hand use behaviors on hand function. Frederiksen et al. [89] investigated power grip strength in a large sample of 8342 individuals over four years demonstrating a decline in grip strength due to age. Therefore, it is possible that the results of this study do not reflect age-related changes in females’ pinch strength that would otherwise be established in the same participants with a different design.

Supplementary Materials

The following are available online at https://www.mdpi.com/article/10.3390/sym14010071/s1, Table S1: Summary statistics for pinch grip strength (Ibs) of both hands by age categories and each sex, for handedness and for each lifestyle factor (occupation, playing a musical instrument, playing sport) tested; Table S2: Summary statistics for pegboard task results (number of pegs correctly placed) of both hands by age categories and each sex, for handedness and for each lifestyle factor (occupation, playing a musical instrument, playing sport) tested.

Author Contributions

Conception and Design of the research, G.S.F., G.D., T.E., T.L.K., A.B., H.B., C.S.; Data Acquisition, G.S.F., G.D., T.E., T.L.K., A.B., H.B., C.S., K.T.; Analysis, A.B., K.T.; Writing—Original Draft Preparation, A.B.; Writing—Review and Editing, A.B., T.L.K., G.S.F., G.D., T.E., H.B.; Project Administration, G.S.F.; Funding Acquisition, G.S.F. All authors have read and agreed to the published version of the manuscript.

Funding

This research was funded by The Waterloo Foundation, grant number 917-3756, and The Wellcome Trust, grant number 101311-33.

Institutional Review Board Statement

The study was conducted according to the guidelines of the Declaration of Helsinki, and approved by the Department of Psychological Sciences Ethics Committee at Birkbeck (ref: 181996, 14 May 2019), University of London.

Informed Consent Statement

Informed consent was obtained from all subjects involved in the study.

Acknowledgments

We thank the London Science Museum and the Live Science scheme for allowing us to conduct this study and the visitors who agreed to be part of the citizen science collaboration project called “Me, Human”. We also thank the volunteers and research assistants: M. Ali, M. Diletta, R. Filippi, L. Fish, E. Forrester, S. Forrester, A. Ghanemi, C. Grevel, J. Hall, E. Jackson, C. Marsh, B. Meyer, S. Pem, E. Periche, E. Ranzato, Y. Slaveva, B. Stewart, and B. Todd for their help in collecting participant data. Finally, we thank the two anonymous reviewers for providing helpful comments and suggestions that improved our manuscript.

Conflicts of Interest

The authors declare no conflict of interest.

References

  1. Marzke, M.W. Precision grips, hand morphology, and tools. Am. J. Phys. Anthropol. 1997, 102, 91–110. [Google Scholar] [CrossRef]
  2. Marzke, M.W. Tool making, hand morphology and fossil hominins. Philos. Trans. R. Soc. Lond. B Biol. Sci. 2013, 368, 20120414. [Google Scholar] [CrossRef] [PubMed] [Green Version]
  3. Almécija, S.; Smaers, J.B.; Jungers, W.L. The evolution of human and ape hand proportions. Nat. Comm. 2015, 6, 1–11. [Google Scholar] [CrossRef] [PubMed] [Green Version]
  4. Kivell, T.L. Evidence in hand: Recent discoveries and the early evolution of human manual manipulation. Philos. Trans. R. Soc. Lond. B Biol. Sci. 2015, 370, 20150105. [Google Scholar] [CrossRef]
  5. Greenfield, P.M. Language, tools and brain: The ontogeny and phylogeny of hierarchically organized sequential behavior. Behav. Brain Sci. 1991, 14, 531–595. [Google Scholar] [CrossRef] [Green Version]
  6. Napier, J.R. Evolution of the human hand. Proc. R. Instn. 1965, 40, 544–557. [Google Scholar]
  7. Marzke, M.W.; Wullstein, K.L.; Viegas, S.F. Evolution of the power (squeeze) grip and its morphological correlates in hominids. Am. J. Phys. Anthropol. 1992, 89, 283–298. [Google Scholar] [CrossRef] [PubMed]
  8. Bullock, I.M.; Zheng, J.Z.; De La Rosa, S.; Guertler, C.; Dollar, A.M. Grasp frequency and usage in daily household and machine shop tasks. IEEE Trans. Haptics 2013, 6, 296–308. [Google Scholar] [CrossRef]
  9. Vergara, M.; Sancho-Bru, J.L.; Gracia-Ibáñez, V.; Pérez-González, A. An introductory study of common grasps used by adults during performance of activities of daily living. J. Hand Ther. 2014, 27, 225–234. [Google Scholar] [CrossRef] [Green Version]
  10. Feix, T.; Romero, J.; Schmiedmayer, H.B.; Dollar, A.M.; Kragic, D. The grasp taxonomy of human grasp types. IEEE Trans. Hum. Mach. Syst. 2015, 46, 66–77. [Google Scholar] [CrossRef]
  11. Martin, J.A.; Ramsay, J.; Hughes, C.; Peters, D.M.; Edwards, M.G. Age and grip strength predict hand dexterity in adults. PLoS ONE 2015, 10, e0117598. [Google Scholar] [CrossRef] [PubMed] [Green Version]
  12. Gachette, R.E.; Lauwers, T. Grip & Pinch Strength in Relation to Anthropometric Data in Adults. J. Orthop. Res. Physiother. 2018, 4, 039. [Google Scholar]
  13. Mathiowetz, V.; Kashman, N. Grip and Pinch Strength: Normative data for adults. Arch. Phys. Med. Rehabil. 1985, 66, 69–74. [Google Scholar]
  14. Carmeli, E.; Patish, H.; Coleman, R. The Aging Hand. J. Gerontol. A Biol. Sci. Med. Sci. 2003, 58, 146–152. [Google Scholar] [CrossRef] [PubMed] [Green Version]
  15. Kornatz, K.W.; Christou, E.A.; Enoka, R.M. Practice reduces motor unit discharge variability in a hand muscle and improves manual dexterity in old adults. J. Appl. Physiol. 2005, 98, 2072–2080. [Google Scholar] [CrossRef]
  16. Zuo, K.J.; Olson, J.L. The evolution of functional hand replacement: From iron prostheses to hand transplantation. Plast. Surgery 2014, 22, 44–51. [Google Scholar] [CrossRef] [Green Version]
  17. Ng, P.K.; Saptari, A. A review of shape and size considerations in pinch grips. Theor. Issues Ergon. Sci. 2014, 15, 305–317. [Google Scholar] [CrossRef]
  18. Michimata, A.; Kondo, T.; Suzukamo, Y.; Chiba, M.; Izumi, S.-I. The Manual Function Test: Norms for 20- to 90-Year-Olds and Effects of Age, Gender, and Hand Dominance on Dexterity. Tohoku J. Exp. Med. 2008, 214, 257–267. [Google Scholar] [CrossRef] [Green Version]
  19. Maleki-Ghahfarokhi, A.; Dianat, I.; Feizi, H.; Asghari-Jafarabadi, M. Influences of gender, hand dominance, and anthropometric characteristics on different types of pinch strength: A partial least squares (PLS) approach. Appl. Ergon. 2019, 79, 9–16. [Google Scholar] [CrossRef] [PubMed]
  20. Michael, A.I.; Iyun, A.O.; Olawoye, O.A.; Ademola, S.A.; Nnabuko, R.E.; Oluwatosin, O.M. Normal values of key pinch strength in a healthy Nigerian population. Ann. Ib. Postgrad. 2015, 13, 84–88. [Google Scholar]
  21. Doğan, N. Hand Function According to Professions Evaluation. Master’s Thesis, Istanbul Science University, Health Sciences Institute, Istanbul, Turkey, 2012; 78p. [Google Scholar]
  22. Josty, I.C.; Tyler, M.P.H.; Shewell, P.C.; Roberts, A.H.N. Grip and pinch strength variations in different types of workers. J. Hand Surg. 1997, 22, 266–269. [Google Scholar] [CrossRef]
  23. Peters, M.; Servos, P.; Day, R. Marked sex differences on a fine motor skill task disappear when finger size is used as covariate. J. Appl. Soc. Psychol. 1990, 75, 87. [Google Scholar] [CrossRef] [PubMed]
  24. Mathiowetz, V.; Weber, K.; Kashman, N.; Volland, G. Adult Norms for the Nine Hole Peg Test of Finger Dexterity. Occup. Ther. J. Res. 1985, 5, 24–38. [Google Scholar] [CrossRef]
  25. Lindstrom-Hazel, D.K.; VanderVlies Veenstra, N. Examining the Purdue pegboard test for occupational therapy practice. Open J. Occup. Ther. 2015, 3, 5. [Google Scholar] [CrossRef] [Green Version]
  26. Tiffin, J. Purdue Pegboard: Examiner Manual; London House: Rosemont, IL, USA, 1968. [Google Scholar]
  27. Yeudall, L.T.; Fromm, D.; Reddon, J.R.; Stefanyk, W.O. Normative data stratified by age and sex for 12 neuropsychological tests. J. Clin. Psychol. 1986, 42, 918–946. [Google Scholar] [CrossRef]
  28. Sivagnanasunderam, M.; Gonzalez, D.A.; Bryden, P.J.; Young, G.; Forsyth, A.; Roy, E.A. Handedness throughout the lifespan: Cross-sectional view on sex differences as asymmetries change. Front. Psychol. 2015, 5, 1556. [Google Scholar] [CrossRef] [Green Version]
  29. Ding, H.; Solovieva, S.; Vehmas, T.; Takala, E.-P.; Leino-Arjas, P. Hand osteoarthritis and pinch grip strength among middle-aged female dentists and teachers. Scand. J. Rheumatol. 2010, 39, 84–87. [Google Scholar] [CrossRef] [PubMed]
  30. Dedeoglu, M.; Gafuroglu, U.; Yilmaz, O.; Bodur, H. The relationship between hand grip and pinch strengths and disease activity, articular damage, pain, and disability in patients with rheumatoid arthritis. Turk. J. Rheumatol. 2013, 28, 69–78. [Google Scholar] [CrossRef] [Green Version]
  31. Marzke, M.W.; Marzke, R.F. Evolution of the human hand: Approaches to acquiring, analysing and interpreting the anatomical evidence. J. Anat. 2000, 197, 121–140. [Google Scholar] [CrossRef]
  32. Vieluf, S.; Mahmoodi, J.; Godde, B.; Reuter, E.M.; Voelcker-Rehage, C. The influence of age and work-related expertise on fine motor control. GeroPsych J. Gerontopsychol. Geriatr. Psychiatry 2012, 25, 199. [Google Scholar] [CrossRef]
  33. Desai, M.; Shah, S. Evaluation of Dexterity and Eye Hand Co-ordination in Garment Industry Workers. J. Exerc. Sci. Physiother. 2020, 16, 40–46. [Google Scholar] [CrossRef]
  34. Denat, Y.; Kuzgun, H. The Manual Dexterity of Nurses and Factors that Affect It. Athens J. Health Med. Sci. 2020, 7, 145–156. [Google Scholar] [CrossRef]
  35. Soyupek, F.; Bolukbafil, N.; Yorganciolu, Z.; Gokolu, F. The effect of aerobic exercise on hand strength and dexterity of patients with coronary artery disease. Turk. J. Phys. Med. Rehabil. 2006, 52, 72–75. [Google Scholar]
  36. Mitchell, A.C.; Bowhay, A.; Pitts, J. Relationship between anthropometric characteristics of indoor rock climbers and top roped climbing performance. J. Strength Cond. Res. 2011, 25, S94–S95. [Google Scholar] [CrossRef]
  37. Zaggelidis, G. Maximal isometric handgrip strength (HGS) in Greek elite male judo and karate athletes. Sport Sci. Rev. 2016, 25, 320. [Google Scholar] [CrossRef] [Green Version]
  38. Sims, S.E.; Engel, L.; Hammert, W.C.; Elfar, J.C. Hand sensibility, strength, and laxity of high-level musicians compared to nonmusicians. J. Hand Surg. Am. 2015, 40, 1996–2002. [Google Scholar] [CrossRef] [PubMed] [Green Version]
  39. Sobierajewicz, J.; Naskręcki, R.; Jaśkowski, W.; Van der Lubbe, R.H. Do musicians learn a fine sequential hand motor skill differently than non-musicians? PLoS ONE 2018, 13, e0207449. [Google Scholar] [CrossRef]
  40. Watson, A.H.D. What can studying musicians tell us about motor control of the hand? J. Anat. 2006, 208, 527–542. [Google Scholar] [CrossRef] [PubMed]
  41. Wagner, C.H. The pianist’s hand: Anthropometry and biomechanics. Ergonomics 1988, 31, 97–131. [Google Scholar] [CrossRef]
  42. Parlitz, D.; Peschel, T.; Altenmüller, E. Assessment of dynamic finger forces in pianists: Effects of training and expertise. J. Biomech. 1998, 31, 1063–1067. [Google Scholar] [CrossRef]
  43. Bardo, A.; Kivell, T.L.; Town, K.; Donati, G.; Ballieux, H.; Stamate, C.; Edginton, T.; Forrester, G.S. Get a grip: Variation in human hand grip strength and implications for human evolution. Symmetry 2021, 13, 1142. [Google Scholar] [CrossRef]
  44. Cardoso, H.F.V.; Severino, R.S.S. The chronology of epiphyseal union in the hand and foot from dry bone observations. Int. J. Osteoarchaeol. 2010, 20, 737–746. [Google Scholar] [CrossRef]
  45. Cunningham, C.; Scheuer, L.; Black, S. Developmental Juvenile Osteology, 2nd ed.; Academic Press: Cambridge, MA, USA, 2016. [Google Scholar]
  46. Jansen, C.W.S.; Simper, V.K.; Stuart Jr, H.G.; Pinkerton, H.M. Measurement of maximum voluntary pinch strength: Effects of forearm position and outcome score. J. Hand Ther. 2003, 16, 326–336. [Google Scholar] [CrossRef] [Green Version]
  47. Rohlf, F.J. tpsDig2 Software Version 2.31. The State University of New York at Stony Brook, USA. 2017. Available online: http://www.sbmorphometrics.org/soft-dataacq.html (accessed on 10 February 2021).
  48. Chen, X.; Li, Z.; Wang, Y.; Liu, J. Effect of fruit and hand characteristics on thumb–index finger power-grasp stability during manual fruit sorting. Comput. Electron. Agric. 2019, 157, 479–487. [Google Scholar] [CrossRef]
  49. Ishak, N.-I.; Hemy, N.; Franklin, D. Estimation of sex from hand and handprint dimensions in a Western Australian population. Forensic Sci. Int. 2012, 221, 154.e1–154.e6. [Google Scholar] [CrossRef] [PubMed]
  50. Guralnik, J.M.; Fried, L.P.; Simonsick, E.M.; Lafferty, M.E.; Kasper, J.D. The Women’s Health and Aging Study: Health and Social Characteristics of Older Women with Disability; National Institutes of Health, National Institute on Aging: Bethesda, MD, USA, 1995; 206p. [Google Scholar]
  51. Forrester, G.S.; Davis, R.; Malatesta, G.; Todd, B.K. Evolutionary motor biases and cognition in children with and without autism. Sci. Rep. 2020, 10, 1–10. [Google Scholar] [CrossRef]
  52. R Core Team. R: A Language and Environment for Statistical Computing; R Foundation for Statistical Computing: Vienna, Austria, 2020; Available online: https://www.R-project.org/ (accessed on 14 July 2021).
  53. Puh, U. Age-related and sex-related differences in hand and pinch grip strength in adults. Int. J. Rehabil. Res. 2010, 33, 4–11. [Google Scholar] [CrossRef]
  54. Imrhan, S.N. Trends in finger pinch strength in children, adults, and the elderly. Hum. Factors 1989, 31, 689–701. [Google Scholar] [CrossRef]
  55. Alba, D.M.; Moyà-Solà, S.; Köhler, M. Morphological affinities of the Australopithecus afarensis hand on the basis of manual proportions and relative thumb length. J. Hum. Evol. 2003, 44, 225–254. [Google Scholar] [CrossRef]
  56. Su, C.Y.; Chien, T.H.; Cheng, K.F.; Su, C.J. A study of pinch strength in normal Taiwanese adults. Kaohsiung J. Med. Sci. 1995, 11, 69–78. [Google Scholar]
  57. Courtney, A.J. Hand anthropometry of Hong Kong Chinese females compared to other ethnic groups. Ergonomics 1984, 27, 1169–1180. [Google Scholar] [CrossRef] [PubMed]
  58. Lazenby, R.; Smashnuk, A. Osteometric variation in the Inuit second metacarpal: A test of Allen’s Rule. Int. J. Osteoarchaeol. 1999, 9, 182–188. [Google Scholar] [CrossRef]
  59. Betti, L.; Lycett, S.J.; von Cramon-Taubadel, N.; Pearson, O.M. Are human hands and feet affected by climate? A test of A llen’s rule. Am. J. Phys. Anthropol. 2015, 158, 132–140. [Google Scholar] [CrossRef] [PubMed]
  60. Marmon, A.R.; Pascoe, M.A.; Schwartz, R.S.; Enoka, R.M. Associations among strength, steadiness, and hand function across the adult life span. Med. Sci. Sports Exerc. 2011, 43, 560–567. [Google Scholar] [CrossRef] [PubMed]
  61. Dayanidhi, S.; Valero-Cuevas, F.J. Dexterous manipulation is poorer at older ages and is dissociated from decline of hand strength. J. Gerontol. A Biol. Med. Sci. 2014, 69, 1139–1145. [Google Scholar] [CrossRef] [PubMed] [Green Version]
  62. Kawabata, H.; Demura, S.; Kitabayashi, T. Superior pinch strength in the dominant versus nondominant hand. Sport Sci. Health 2013, 9, 7–11. [Google Scholar] [CrossRef]
  63. Shim, J.H.; Roh, S.Y.; Kim, J.S.; Lee, D.C.; Ki, S.H.; Yang, J.W.; Jeon, M.K.; Lee, S.M. Normative measurements of grip and pinch strengths of 21st century Korean population. Arch. Plast. Surg. 2013, 40, 52. [Google Scholar] [CrossRef] [PubMed] [Green Version]
  64. Mathiowetz, V. Reliability and validity of grip and pinch strength measurements. Crit. Rev. Phys. Rehabil. Med. 1991, 2, 201–212. [Google Scholar]
  65. Härkönen, R.; Harju, R.; Alaranta, H. Accuracy of the Jamar dynamometer. J. Hand Ther. 1993, 6, 259–262. [Google Scholar] [CrossRef]
  66. Halpern, C.A.; Fernandez, J.E. The effect of wrist and arm postures on peak pinch strength. J. Hum. Ergol. 1996, 25, 115–130. [Google Scholar]
  67. Innes, E.V. Handgrip strength testing: A review of the literature. Aust. Occup. Ther. J. 1999, 46, 120–140. [Google Scholar] [CrossRef]
  68. Chilima, D.M.; Ismail, S.J. Nutrition and handgrip strength of older adults in rural Malawi. Public Health Nutr. 2001, 4, 11–17. [Google Scholar] [CrossRef] [Green Version]
  69. Hodges, L.; Adams, J. Grip strength and dexterity: A study of variance between right-and left-handed healthy individuals. Br. J. Hand Ther. 2007, 12, 15–21. [Google Scholar] [CrossRef]
  70. Annett, M. Left, Right, Hand and Brain: The Right Shift Theory; LEA Publishers: London, UK, 1985; 416p. [Google Scholar]
  71. Porac, C.; Coren, S. Lateral Preferences and Human Behavior; Springer: New York, NY, USA, 1981; 283p. [Google Scholar]
  72. McManus, I.C. The history and geography of human handedness. In Language Lateralization and Psychosis; Sommer, I.E.C., Kahn, R.S., Eds.; Cambridge University Press: Cambridge, UK, 2009; pp. 37–57. [Google Scholar]
  73. Llaurens, V.; Raymond, M.; Faurie, C. Why are some people left-handed? An evolutionary perspective Philos. Trans. R. Soc. Lond. B Biol. Sci. 2009, 364, 881–894. [Google Scholar] [CrossRef] [PubMed]
  74. Faurie, C.; Schiefenhövel, W.; le Bomin, S.; Billiard, S.; Raymond, M. Variation in the frequency of left-handedness in traditional societies. Curr. Anthropol. 2005, 46, 142–147. [Google Scholar] [CrossRef] [Green Version]
  75. Vigouroux, L.; Domalain, M.; Berton, E. Effect of object width on muscle and joint forces during thumb–index finger grasping. J. Appl. Biomech. 2011, 27, 173–180. [Google Scholar] [CrossRef] [PubMed] [Green Version]
  76. Barry, A.J.; Murray, W.M.; Kamper, D.G. Development of a dynamic index finger and thumb model to study impairment. J. Biomech. 2018, 77, 206–210. [Google Scholar] [CrossRef] [PubMed]
  77. Chen, X.; Li, Z.; Wang, Y.; Liu, J.; Zhao, D. Investigation on the cooperative grasping capabilities of human thumb and index finger. Front. Neurorobot. 2019, 13, 92. [Google Scholar] [CrossRef] [PubMed]
  78. Karakostis, F.A.; Haeufle, D.; Anastopoulou, I.; Moraitis, K.; Hotz, G.; Tourloukis, V.; Harvati, K. Biomechanics of the human thumb and the evolution of dexterity. Curr. Biol. 2021, 31, 1317–1325. [Google Scholar] [CrossRef]
  79. Niewoehner, W.A.; Bergstrom, A.; Eichele, D.; Zuroff, M.; Clark, J.T. Manual dexterity in Neanderthals. Nature 2003, 422, 395. [Google Scholar] [CrossRef] [PubMed]
  80. Pickering, R.; Dirks, P.H.; Jinnah, Z.; De Ruiter, D.J.; Churchill, S.E.; Herries, A.I.; Berger, L.R. Australopithecus sediba at 1.977 Ma and implications for the origins of the genus Homo. Science 2011, 333, 1421–1423. [Google Scholar] [CrossRef] [PubMed] [Green Version]
  81. Feix, T.; Kivell, T.L.; Pouydebat, E.; Dollar, A.M. Estimating thumb–index finger precision grip and manipulation potential in extant and fossil primates. J. R. Soc. Interface. 2015, 12, 20150176. [Google Scholar] [CrossRef] [PubMed] [Green Version]
  82. Kivell, T.L.; Kibii, J.M.; Churchill, S.E.; Schmid, P.; Berger, L.R. Australopithecus sediba hand demonstrates mosaic evolution of locomotor and manipulative abilities. Science 2011, 333, 1411–1417. [Google Scholar] [CrossRef] [PubMed] [Green Version]
  83. Neufuss, J.; Robbins, M.M.; Baeumer, J.; Humle, T.; Kivell, T.L. Manual skills for food processing by mountain gorillas (Gorilla beringei beringei) in Bwindi Impenetrable National Park, Uganda. Biol. J. Linn. Soc. 2019, 127, 543–562. [Google Scholar] [CrossRef]
  84. Bardo, A.; Borel, A.; Meunier, H.; Guéry, J.P.; Pouydebat, E. Behavioral and functional strategies during tool use tasks in bonobos. Am. J. Phys. Anthropol. 2016, 161, 125–140. [Google Scholar] [CrossRef] [PubMed]
  85. Pouydebat, E.; Reghem, E.; Borel, A.; Gorce, P. Diversity of grip in adults and young humans and chimpanzees (Pan troglodytes). Behav. Brain Res. 2011, 218, 21–28. [Google Scholar] [CrossRef]
  86. Christel, M. Hands of Primates; Springer: Vienna, Austria, 1993; pp. 91–108. [Google Scholar]
  87. Fragaszy, D.M.; Crast, J. The Evolution of the Primate Hand; Springer: New York, NY, USA, 2016; pp. 313–344. [Google Scholar]
  88. Gonzalez Sanchez, V. Development of a Dexterity Assessment Method. Doctoral Dissertation, University of Sheffield, Sheffield, UK, 2016; 172p. [Google Scholar]
  89. Frederiksen, H.; Hjelmborg, J.; Mortensen, J.; Mcgue, M.; Vaupel, J.W.; Christensen, K. Age trajectories of grip strength: Cross-sectional and longitudinal data among 8342 Danes aged 46 to 102. Ann. Epidemiol. 2006, 16, 554–562. [Google Scholar] [CrossRef] [PubMed]
Figure 1. Pad-to-pad pinch strength was evaluated in the study.
Symmetry 14 00071 g001
Figure 2. Hand measurements were taken on the hand scans. W = hand width, L = hand length, T = thumb length, I = index length. A 2 cm scale was included to facilitate the accurate measurement of hand size from the scans.
Symmetry 14 00071 g002
Figure 3. Pegboard test was used in this study to examine dexterity.
Symmetry 14 00071 g003
Figure 4. Box-and-whisker plot of pinch grip strength for females (left half of the figure) and males (right half of the figure) across age categories for the dominant hand (grey) and non-dominant hand (white). Post-hoc tests showed no significant differences for pinch grip strength between the hands within any age category and either sex (p > 0.05). An effect of age was found on the pinch grip strength in the dominant hand for males, with middle age (30–44) participants being stronger than the younger (17–29) and older (45+) age categories (*** p < 0.001; * p < 0.05). Each box plot shows the median value (bold line) and interquartile ranges of pinch grip strength, and vertical lines indicate variability outside the upper and lower quartiles, except for “outliers” (dots).
Symmetry 14 00071 g004
Figure 5. Box-and-whisker plot of pinch grip strength of the dominant hand for males (A) and females (B) grouped by directional asymmetry (left-handed in green; right-handed in orange) and by age category. Right-handed males were significantly stronger than left-handed males (p < 0.05) with no significant differences within any age category (post-hoc Dunn’s test, p > 0.05), and no effect was found for females (p > 0.05). Each box plot shows the median value (bold line) and interquartile ranges of pinch grip strength, and the vertical lines indicate variability outside the upper and lower quartiles, except for “outliers” (dots).
Symmetry 14 00071 g005
Figure 6. Scatter plot of the significant correlations between pinch grip strength and hand shape for the dominant hand for males (A) and females (B), indicating that participants with wider hands (ratio > 0.5) were significantly stronger than participants with longer hands (ratio < 0.5).
Symmetry 14 00071 g006
Figure 7. Manual dexterity box-and-whisker plot of pegs placed for females (left half of the figure) and males (right half of the figure) across age categories, for the dominant hand (grey) and non-dominant hand (white). Post-hoc tests showed significant differences between the hands for the number of pegs placed within all age categories and for both sexes (* p < 0.05; ** p < 0.01; *** p < 0.001). Post-hoc tests showed significant differences between some age categories for both females and males, with for the dominant hand of younger (17–29) and middle (30–44) age categories being more dexterous than older (45+) participants, and for the non-dominant hand for males, with middle age category being more dexterous than the younger participants (** p < 0.01; *** p < 0.001). Each box plot shows the median value (bold lines) and interquartile ranges of the number of pegs placed, and the vertical lines indicate variability outside the upper and lower quartiles, except for ‘‘outliers’’ (dots).
Symmetry 14 00071 g007
Figure 8. Box-and-whisker plot of pegboard test results for males (A) and females (B) for both hands and grouped by directional asymmetry (left-handed in green; right-handed in orange) and by age category. Left-handed females were significantly more dexterous than right-handed females for the non-dominant hand only (p < 0.05), with no significant differences within any age category (post-hoc Dunn’s test, p > 0.05), and with no differences for males (p > 0.05). Each box plot shows the median value (bold line) and interquartile ranges of the number of pegs placed, and the vertical lines indicate variability outside the upper and lower quartiles, except for “outliers” (dots).
Symmetry 14 00071 g008
Figure 9. Scatter plot of the correlations between pinch grip strength and pegboard results for both hands for males (A) and females (B). Only males were more dexterous with a stronger dominant hand (p = 0.05) (top left graphic).
Symmetry 14 00071 g009
Table 1. Demographic details on the modern human sample used in this study.
Age (Years)Self-Reported HandednessTotal ParticipantsOffice WorkPrecision Manual WorkForceful Manual WorkPlaying a Musical InstrumentPracticing Sport
MFMFMFMFMFMF
17–29R7911365946118828446766
L8116921015546
30–44R62101488631211323304548
L796701112033
45+R579548836103212223651
L686800004232
Total 2193371792871735231574103158176
Publisher’s Note: MDPI stays neutral with regard to jurisdictional claims in published maps and institutional affiliations.

