Motion Symmetry Evaluation Using Accelerometers and Energy Distribution


1
Department of Computing and Control Engineering, University of Chemistry and Technology in Prague, 166 28 Prague 6, Czech Republic
2
Czech Institute of Informatics, Robotics and Cybernetics, Czech Technical University in Prague, 160 00 Prague 6, Czech Republic
3
Department of Neurology, University Hospital Hradec Králové, Faculty of Medicine in Hradec Králové, Charles University in Prague, 500 05 Hradec Králové, Czech Republic
4
Faculty of Applied Informatics, Tomas Bata University in Zlín, 760 01 Zlín, Czech Republic
*
Author to whom correspondence should be addressed.
Symmetry 2019, 11(7), 871; https://doi.org/10.3390/sym11070871
Submission received: 15 June 2019
/
Revised: 29 June 2019
/
Accepted: 1 July 2019
/
Published: 3 July 2019
Abstract
:Analysis of motion symmetry constitutes an important area with many applications in engineering, robotics, neurology and biomedicine. This paper presents the use of microelectromechanical sensors (MEMS), including accelerometers and gyrometers, to acquire data via mobile devices so as to monitor physical activities and their irregularities. Special attention is devoted to the analysis of the symmetry of the motion of the body when the same exercises are performed by the right and the left limb. The analyzed data include the motion of the legs on a home exercise bike under different levels of load. The method is based on signal analysis using the discrete wavelet transform and the evaluation of signal segment features such as the relative energy at selected decomposition levels. The subsequent classification of the evaluated features is performed by k-nearest neighbours, a Bayesian approach, a support vector machine, and neural networks. The highest average classification accuracy attained is 91.0% and the lowest mean cross-validation error is 0.091, resulting from the use of a neural network. This paper presents the advantages of the use of simple sensors, their combination and intelligent data processing for the numerical evaluation of motion features in the rehabilitation and monitoring of physical activities.
1. Introduction
The analysis of motion symmetry has a wide range of applications in rehabilitation, physical therapy, biomedicine and neurology allowing us to detect natural differences between the movement of the left and right limbs during walking, running or cycling [1,2,3], to study the dependence of motion symmetry on mental and environmental conditions and to enable early diagnostics of possible neurological disorders. This multidisciplinary area combines the knowledge and use of different sensor systems, wireless communication links and computational intelligence methods to detect appropriate features and process signals recorded by selected multichannel systems.
The signals recorded by microelectromechanical sensors (MEMS) and handheld devices [4,5,6] including accelerometers and gyrometers [7,8] form one of information sources for the detection of motion features that can be combined with further signals and images recorded by different specific sensors, video systems, and depth cameras [9]. The selection and time synchronization of sensors suitable for specific goals is the basic initial problem in this area dependent on the desired application.
Specific research is devoted to neuromuscular system disorders and soft neurological signs [10] including the symmetry of pronation and supination. The gait symmetry [11,12] and motion analysis form further areas in which features of the left and the right limbs are compared. Associated methods of symmetry analysis combined with motion tracking systems using inertial measurement units [13] have a wide range of applications in neurology. Sensor systems and computational methods are used in these areas for early detection and classification of possible neurological disorders of individuals of the different age or for monitoring of the quality of the rehabilitation process.
Algorithms used for the multichannel processing of data recorded by these sensors include general multimedia signal processing and noise rejection methods [14,15] followed by specific intelligent data processing tools. A specific problem related to symmetry analysis is in the selection of appropriate features allowing to detect motion abnormalities and differences. While spatial domain features based on video camera observations are often used, frequency domain features can be very efficient as well. One of differences is in the sampling period which is usually much higher for MEMS systems and related signals can detect more detail motion differences. Asymmetry in both kinetic and potential energy [16] can be observed in a cyclical movement that involves the coordination of both left and right limbs.
The present paper is devoted to the analysis of motion features [17] based upon the analysis of the signals recorded by accelerometers and gyrometers [18] located inside wearable devices, such as mobile phones [19,20] and tablets. These sensors are often used for gait analysis [21,22,23] or for monitoring physical activities [24,25,26,27].
Gait identification based on phones accelerometers and gyrometers was suggested in [21]. The reliability of smartphone-based gait measurements for quantification of physical activity was tested in [26] for different mobile sensors. In [20], the authors present the results of a systematic performance analysis of motion-sensor behaviour for human activity recognition via mobile phones. The study [19] proved the possibility to use mobile phones for analyzing gait patterns and various gait disorders. The pathological gait patterns are reflected by a certain amount of gait asymmetry which is frequently assessed and described in the pre- and postoperative clinical evaluation of patients, as well as in general rehabilitation. Gyrometers of the mobile devices and estimating knee angles [22] can be used in this way for monitoring of gait deviations. The study [23] was focused on testing of 3D-accelerometer and 3D-gyrometer parameters that have the potential to differentiate between normal gait and pathological gait by patients knee osteoarthritis.
The goal of the present paper is to compare differences in the motion of the limbs on the left side and those on the right side during rehabilitation. As an example, a home exercise bike was selected. A more detailed analysis of motion is often performed by video and depth cameras [28] or by thermal cameras [29] in some cases as well.
The proposed method used for selection of features includes the use of the discrete wavelet transform [30,31] to evaluate the components of the energy at specific decomposition levels. The extracted features are then used for the classification of the individual records using different classification methods. In the case of more complicated systems, further (convolutional) layers can be added to form a deep neural network system [32,33] for effective decision making and with sufficient generalization abilities.
Further studies are often devoted to the correlation with additional biomedical and neurological signals [34,35] as well. Present research includes also methodology of efficient extraction of the most important signal properties to enable a reliable and sufficiently fast processing of very extensive data sets. The use of deep learning methods [36,37,38] for more sophisticated classification of signal segments forms another research topic related to this area, too.
In the present paper, the information content of a signal is used to classify features of the motion on a home exercise bike under different levels of load. Special attention is devoted to the analysis of the symmetry of the motion for the same exercises performed by the right and the left limb. The goal of the paper is in the study of the effect of the load to motion features, motion symmetry and classification accuracy.
2. Methods
2.1. Data Acquisition
New microelectromechanical inertial sensors (MEMS) including 3D accelerometers and 3D gyrometers are often installed in mobile devices to obtain position and orientation information [39] at a high sampling rate. Even though in many applications these devices are sufficiently accurate on a short time scale, they usually suffer from drift over long periods of time, and specific signal processing tools must be used to analyze the data they provide.
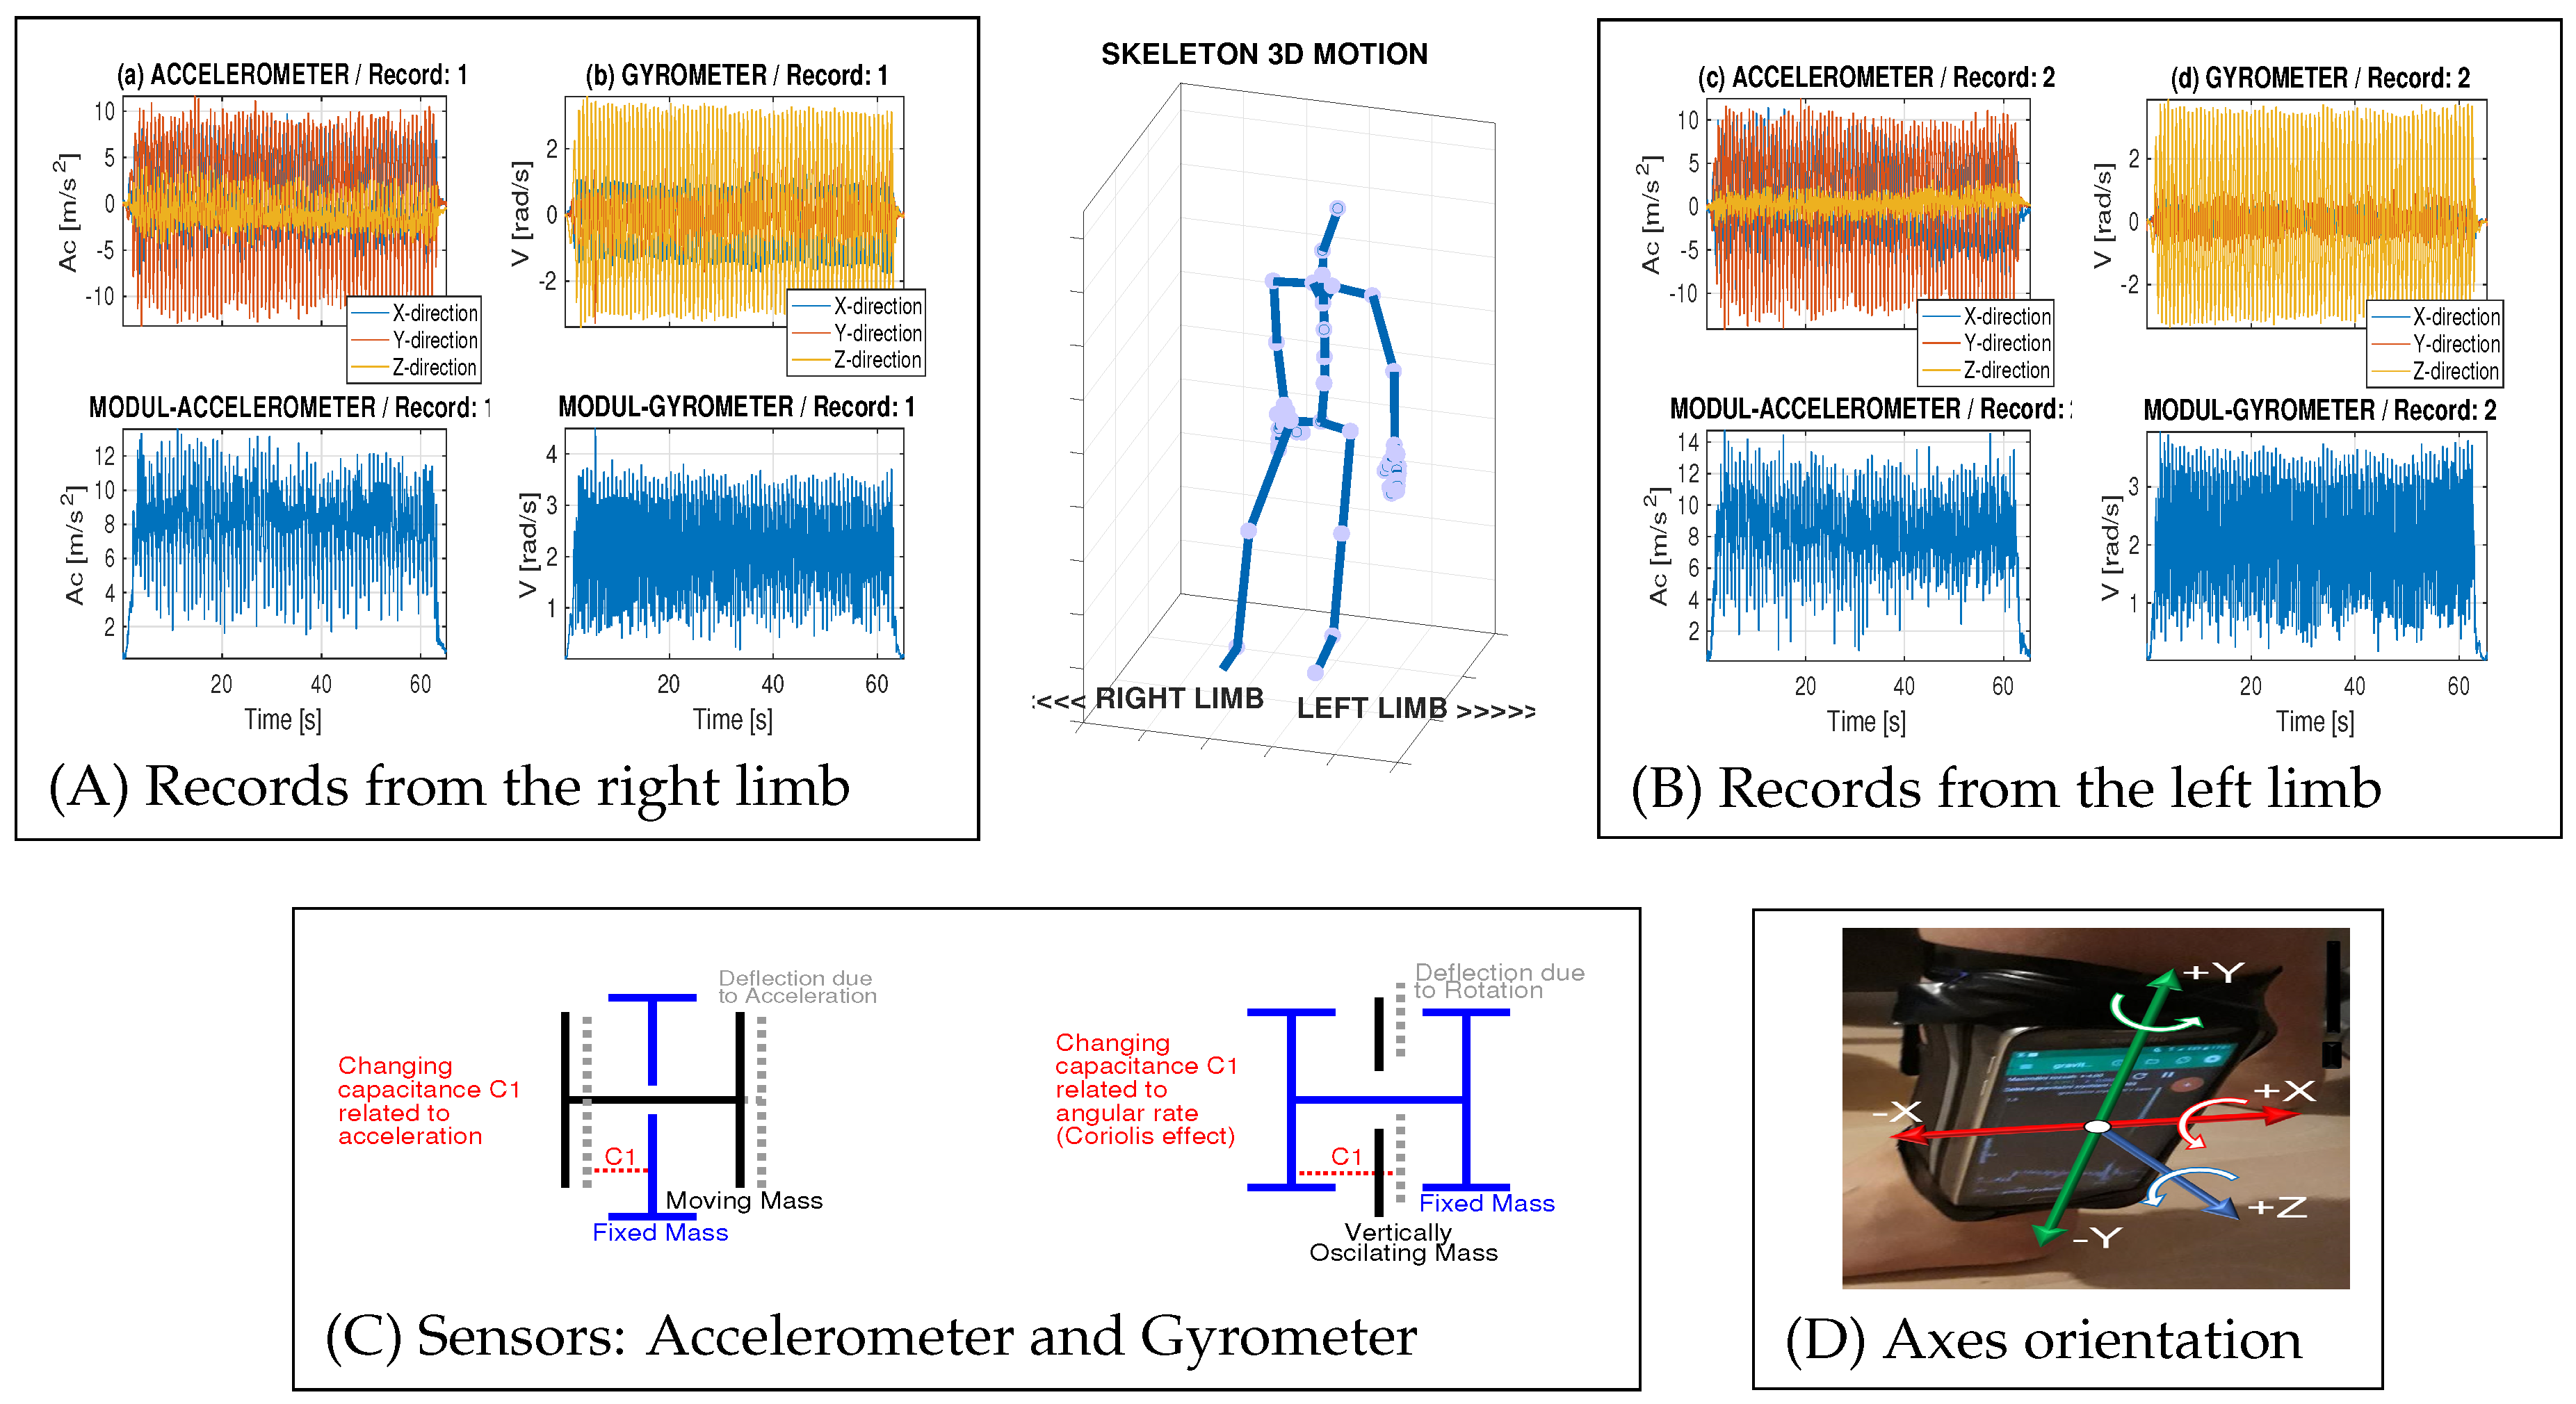
The present paper uses data recorded by the accelerometer and gyrometer inside a mobile phone attached to the right and the left leg with sample records in Figure 1A and Figure 1B, respectively. The three-axes sensors with the coordinate system presented in Figure 1D recorded data in three directions (as presented in upper parts of Figure 1a,b,c,d) but their module (presented in lower parts of Figure 1a,b,c,d) was used for the following processing only.
The experiments were based upon the signals observed on a home exercise bike with sensors on the left and the right leg during rehabilitation exercises of 60 s each, under different loads. The sampling frequency was 100 Hz and was dependent on the technology and speed of the mobile device used for the data acquisition. No ethical approval was required for this study.
The physics behind the construction of accelerometers and gyrometers (schematically presented in Figure 1C) used during these experiments is based on changes in the capacitance during the motion [40,41]. The mobile device with the single-chip MPU-6500 was used for all experiments. It included the integrated three-axis accelerometer (with the resolution of 0.001197 m/s) and 3-axis gyrometer (with the resolution of 0.001065 rad/s). The MPU-6500’s three-axis accelerometer used separate test masses for each axis. The acceleration along a particular axis induces a displacement on the corresponding test mass, detected by capacitive sensors. The MPU-6500’s architecture reduces the accelerometers’ susceptibility to fabrication variations and thermal drift. The gyrometers use a similar principle, but due to harmonic oscillations, they can record the angular velocity [42] of the rotation around the X-, Y-, and Z-axes. During the rotation, the Coriolis effect causes a vibration that can be detected by a capacitative pickoff, with the resulting signal being proportional to the angular rate.
Detail specifications of the MPU-6500 motion tracking device are available on its datasheet. The accelerometer has a user-programmable full-scale range between ±2 g and ±16 g. The gyrometer has a programmable full-scale range between ±250 and ±2000 degrees/s. In the studied case the MPU-6500 device was calibrated through the Physics Tbx Suite Pro and its settings were sufficient for the given physical activity monitoring. Resetting the device to factory setting can recalibrate all the sensors automatically in most cases as well.
2.2. Data Processing
Digital filters were used in the initial stage of the data processing to remove the power frequency from the observed signal and to reduce its undesirable frequency components. The signal characteristics could then be evaluated either in the time or transform (frequency) domains using different methods of data analysis.
In the present study, the signal features were estimated as the power of the signal frequency components evaluated in selected frequency bands. This procedure was based upon Parseval’s theorem, which links the time and transform domains. The choice of wavelet transform as an alternative to the discrete Fourier transform for feature extraction was determined by their property of global and local signal analysis appropriate for biomedical data processing [43]. Specific decomposition levels were selected according to possible frequency components during the motion.
Wavelet transforms are very efficient functional transforms used as general mathematical tools for signal processing with many applications in data analysis [44,45,46,47,48]. Their basic use includes time-scale signal analysis, signal decomposition, de-noising, and signal compression.
The set of wavelet functions [49,50] is usually derived from an initial (mother) wavelet , which is then dilated by the values , translated by the constants , and normalized so that
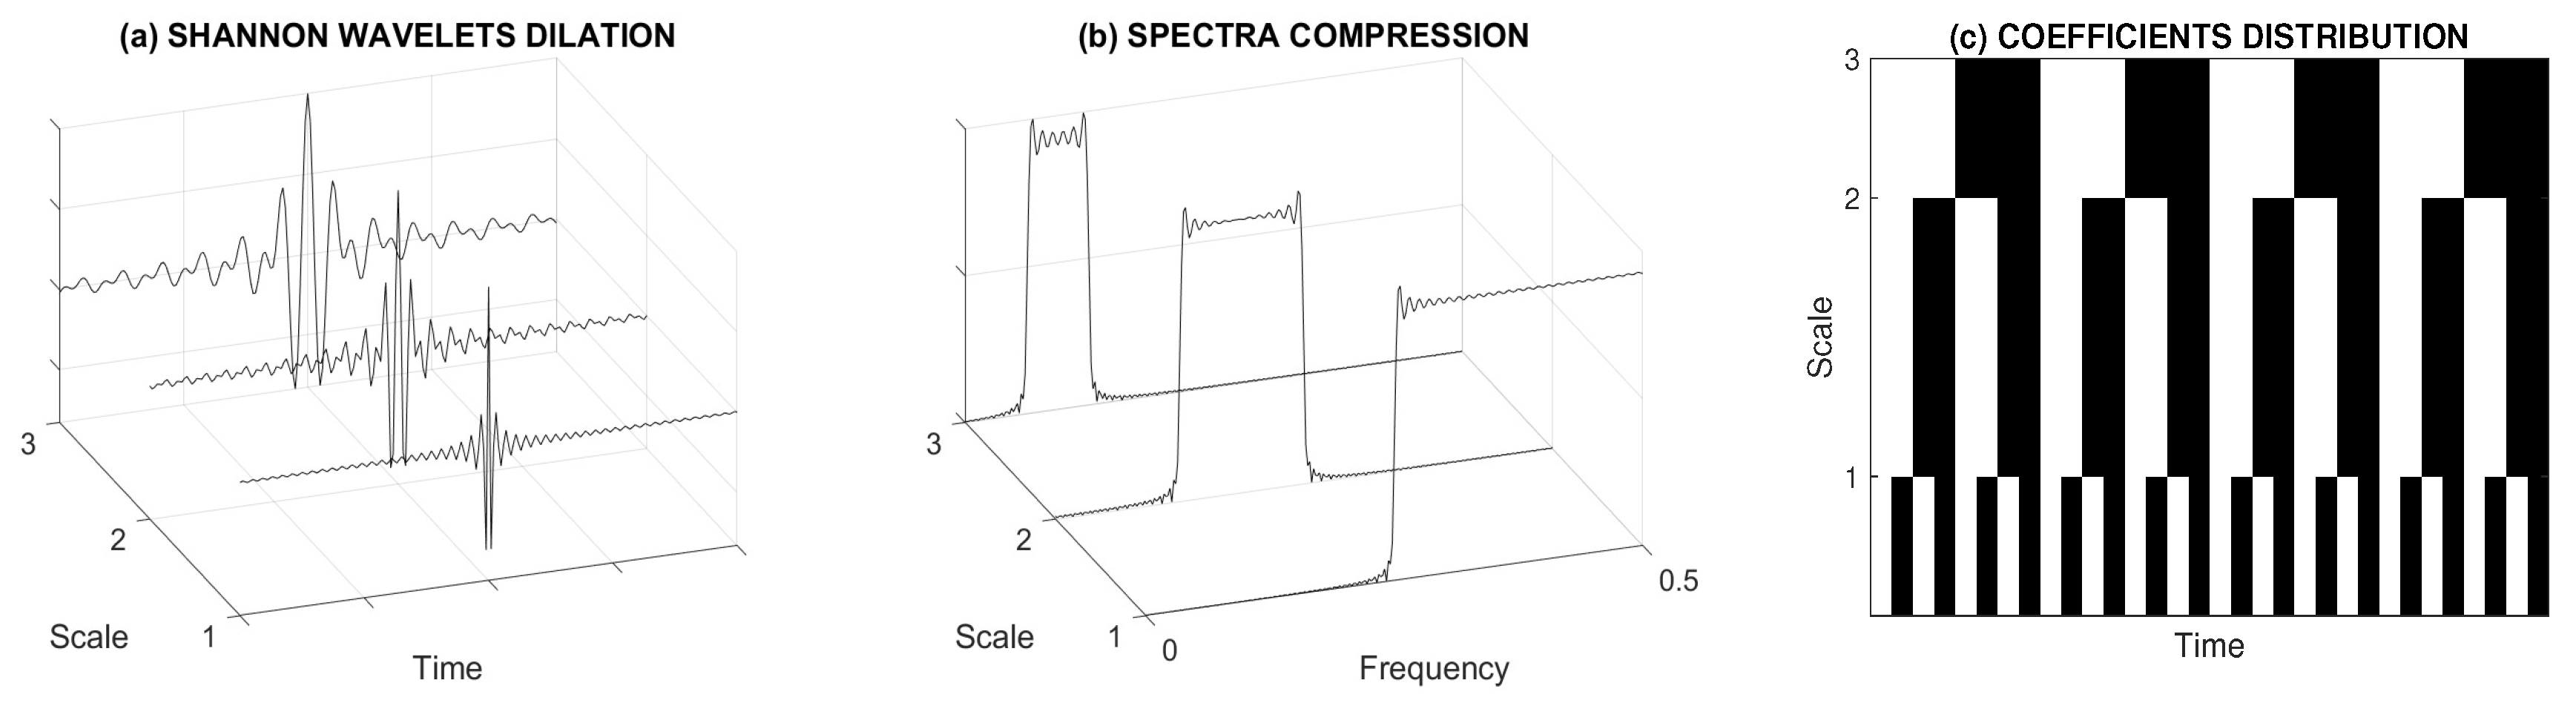
for integer values of m, k. Multi-resolution time-scale abilities of the discrete wavelet transform are presented in Figure 2 for the Shannon wavelet function and its dilation up to the third level. Both continuous or discrete signals can be then approximated in the way similar to the discrete Fourier transform. In the case of an observed sequence having values, it is possible to find its expansion
The coefficients of the wavelet transform can be organized in a matrix with its nonzero elements forming a triangle structure
with each row corresponding to a distinct dilation level m. The set of N decomposition coefficients of the wavelet transform is defined in a way formally close to the Fourier transform but owing to the general definition of wavelet functions they can carry different information. When using an orthogonal set of wavelet functions, these coefficients are moreover closely related to the energy of the signal carried by the decomposition level m. According to Parseval’s theorem, the relative energy at each level can be evaluated by
for , where is the set of wavelet coefficients at level m. Owing to the properties of the wavelet transform, these values can correspond with the relative energy in different frequency bands of the observed sequence and can be used for its characteristics.
The pattern matrix used for the classification of motion features associated with Q signal segments were formed by Q column vectors of R elements each including
- relative energy components at selected wavelet decomposition levels for signals recorded by an accelerometer,
- relative energy components at selected wavelet decomposition levels for signals recorded by a gyrometer,
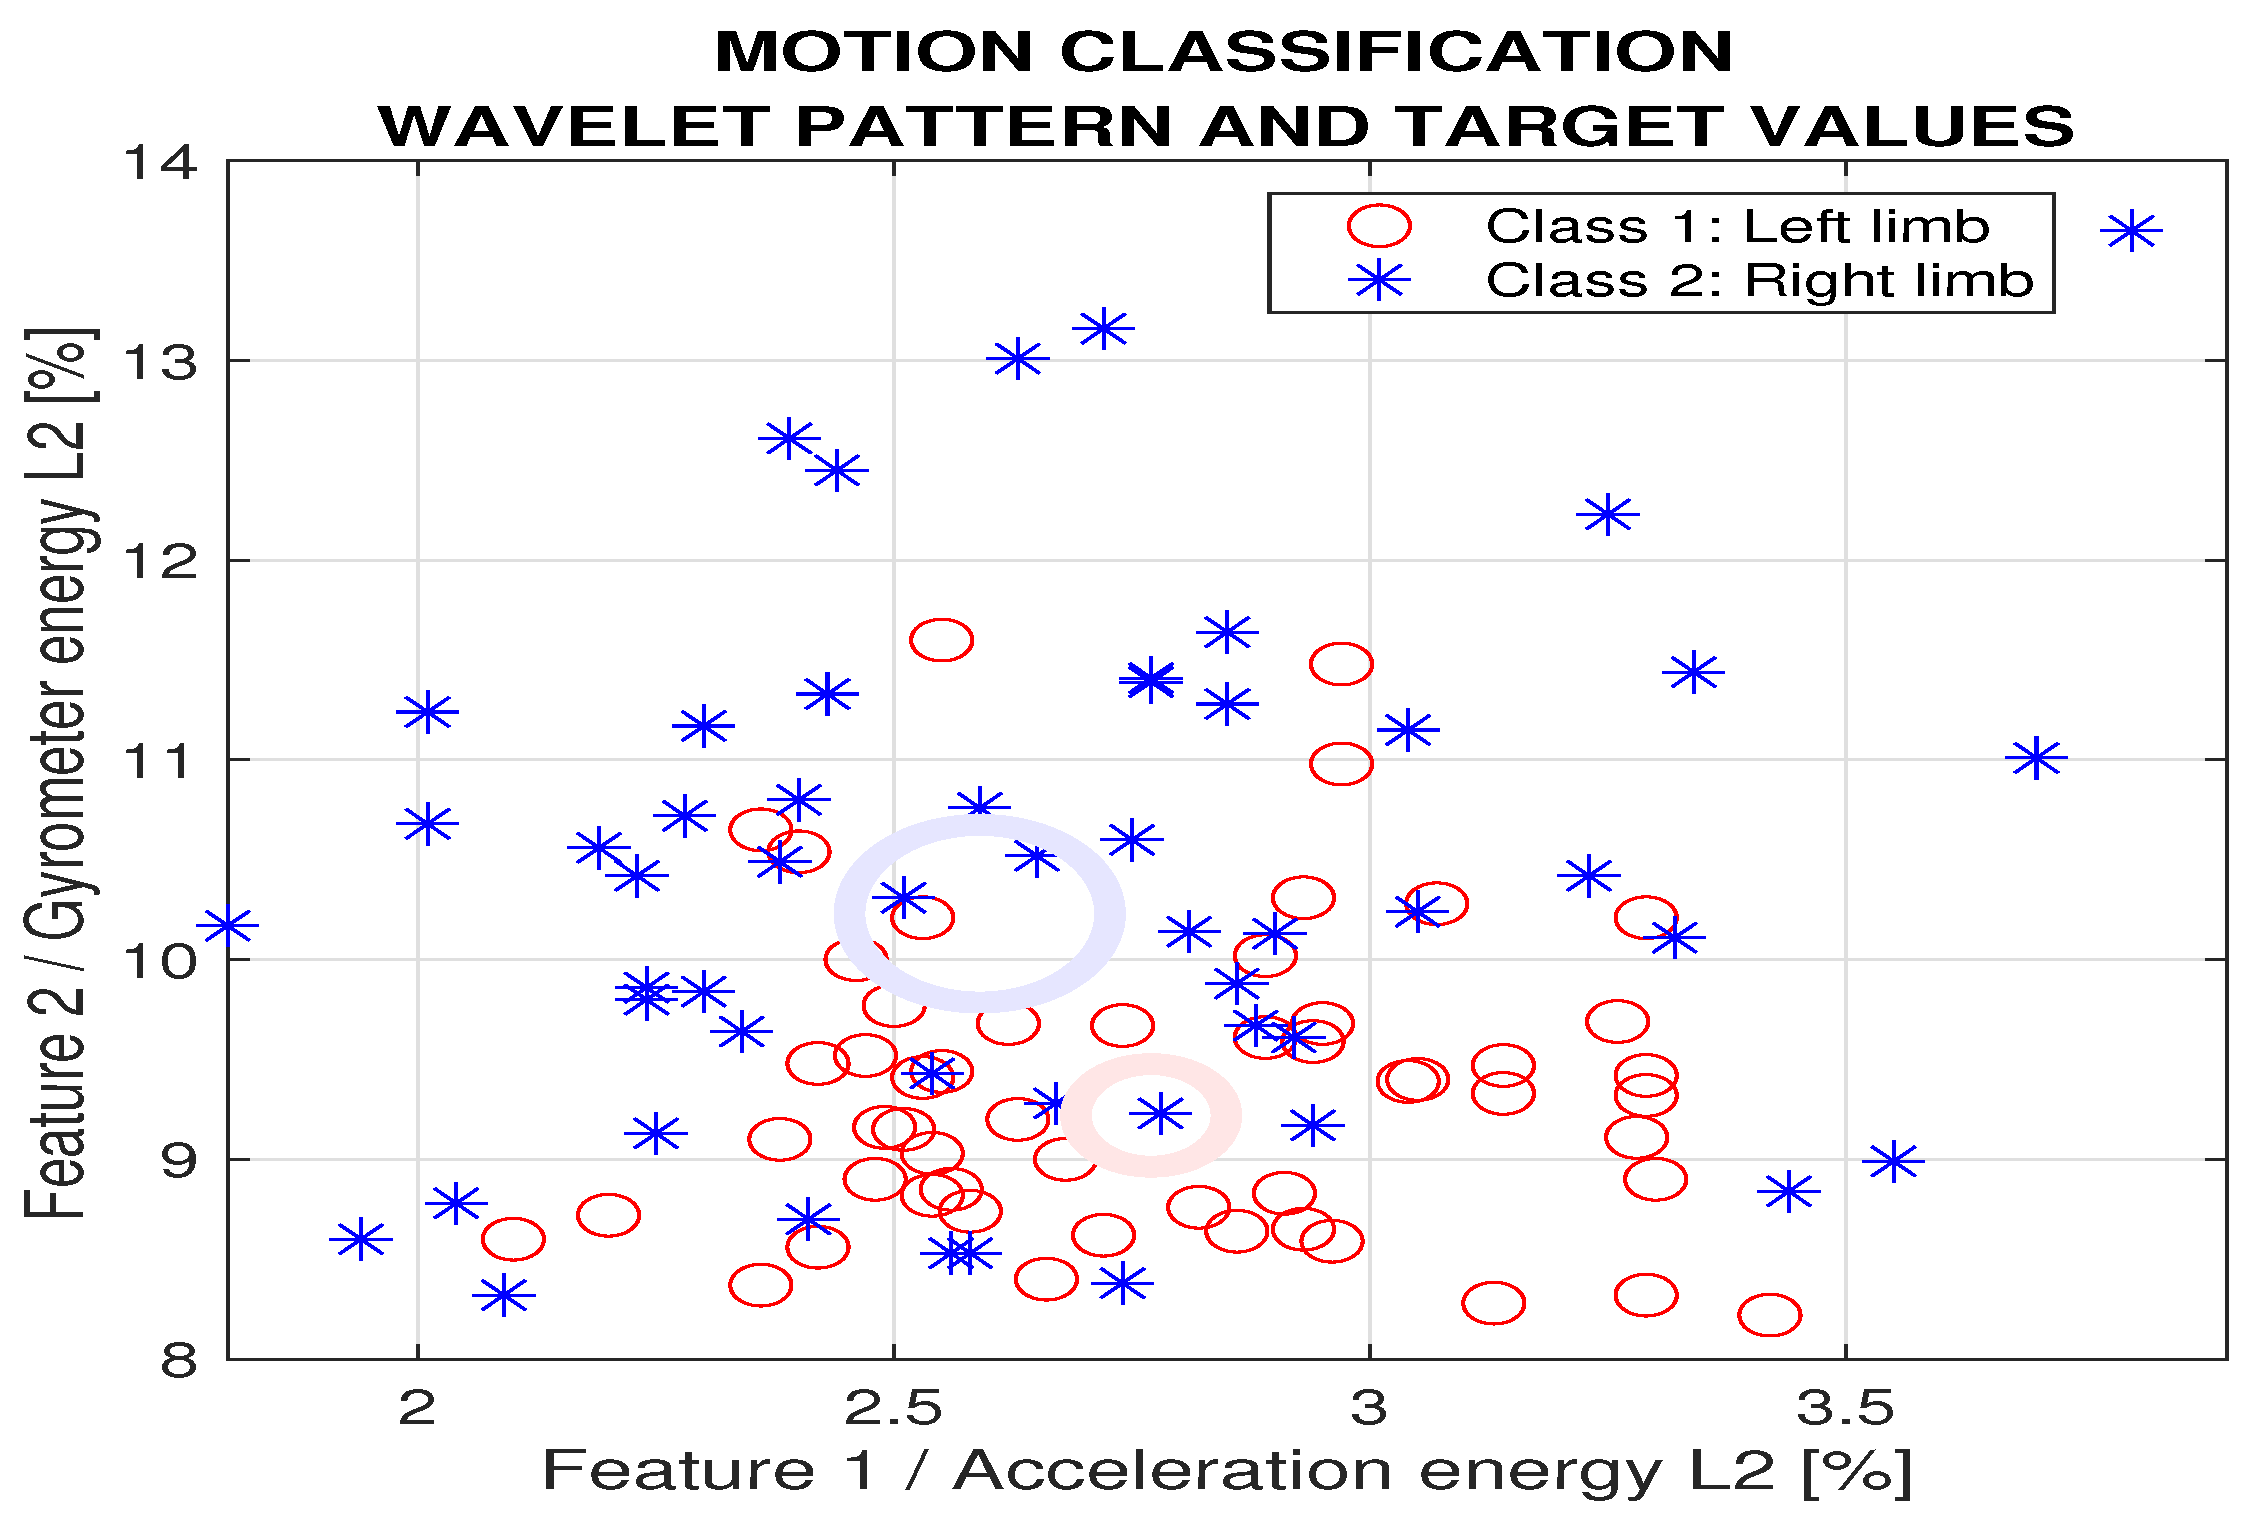
as presented in Figure 3 for the left and the right legs using the energy in the second decomposition level. The moduli of the variables acquired by the accelerometer and gyrometer were used to avoid problems with the changing directions of the coordinate system during the motion. An associated matrix of target values with rows defined class 1 (the left limb) or class 2 (the right limb) in the learning stage.
The classification models used included the decision tree, the k-nearest neighbour method, Bayesan classification, a support vector machine method, and neural networks. For more sophisticated methods further features can be incorporated in the mathematical model including coefficients of further wavelet layers and different transfer functions. To completely avoid the problem of feature selection, deep learning methods with different layers can be moreover applied.
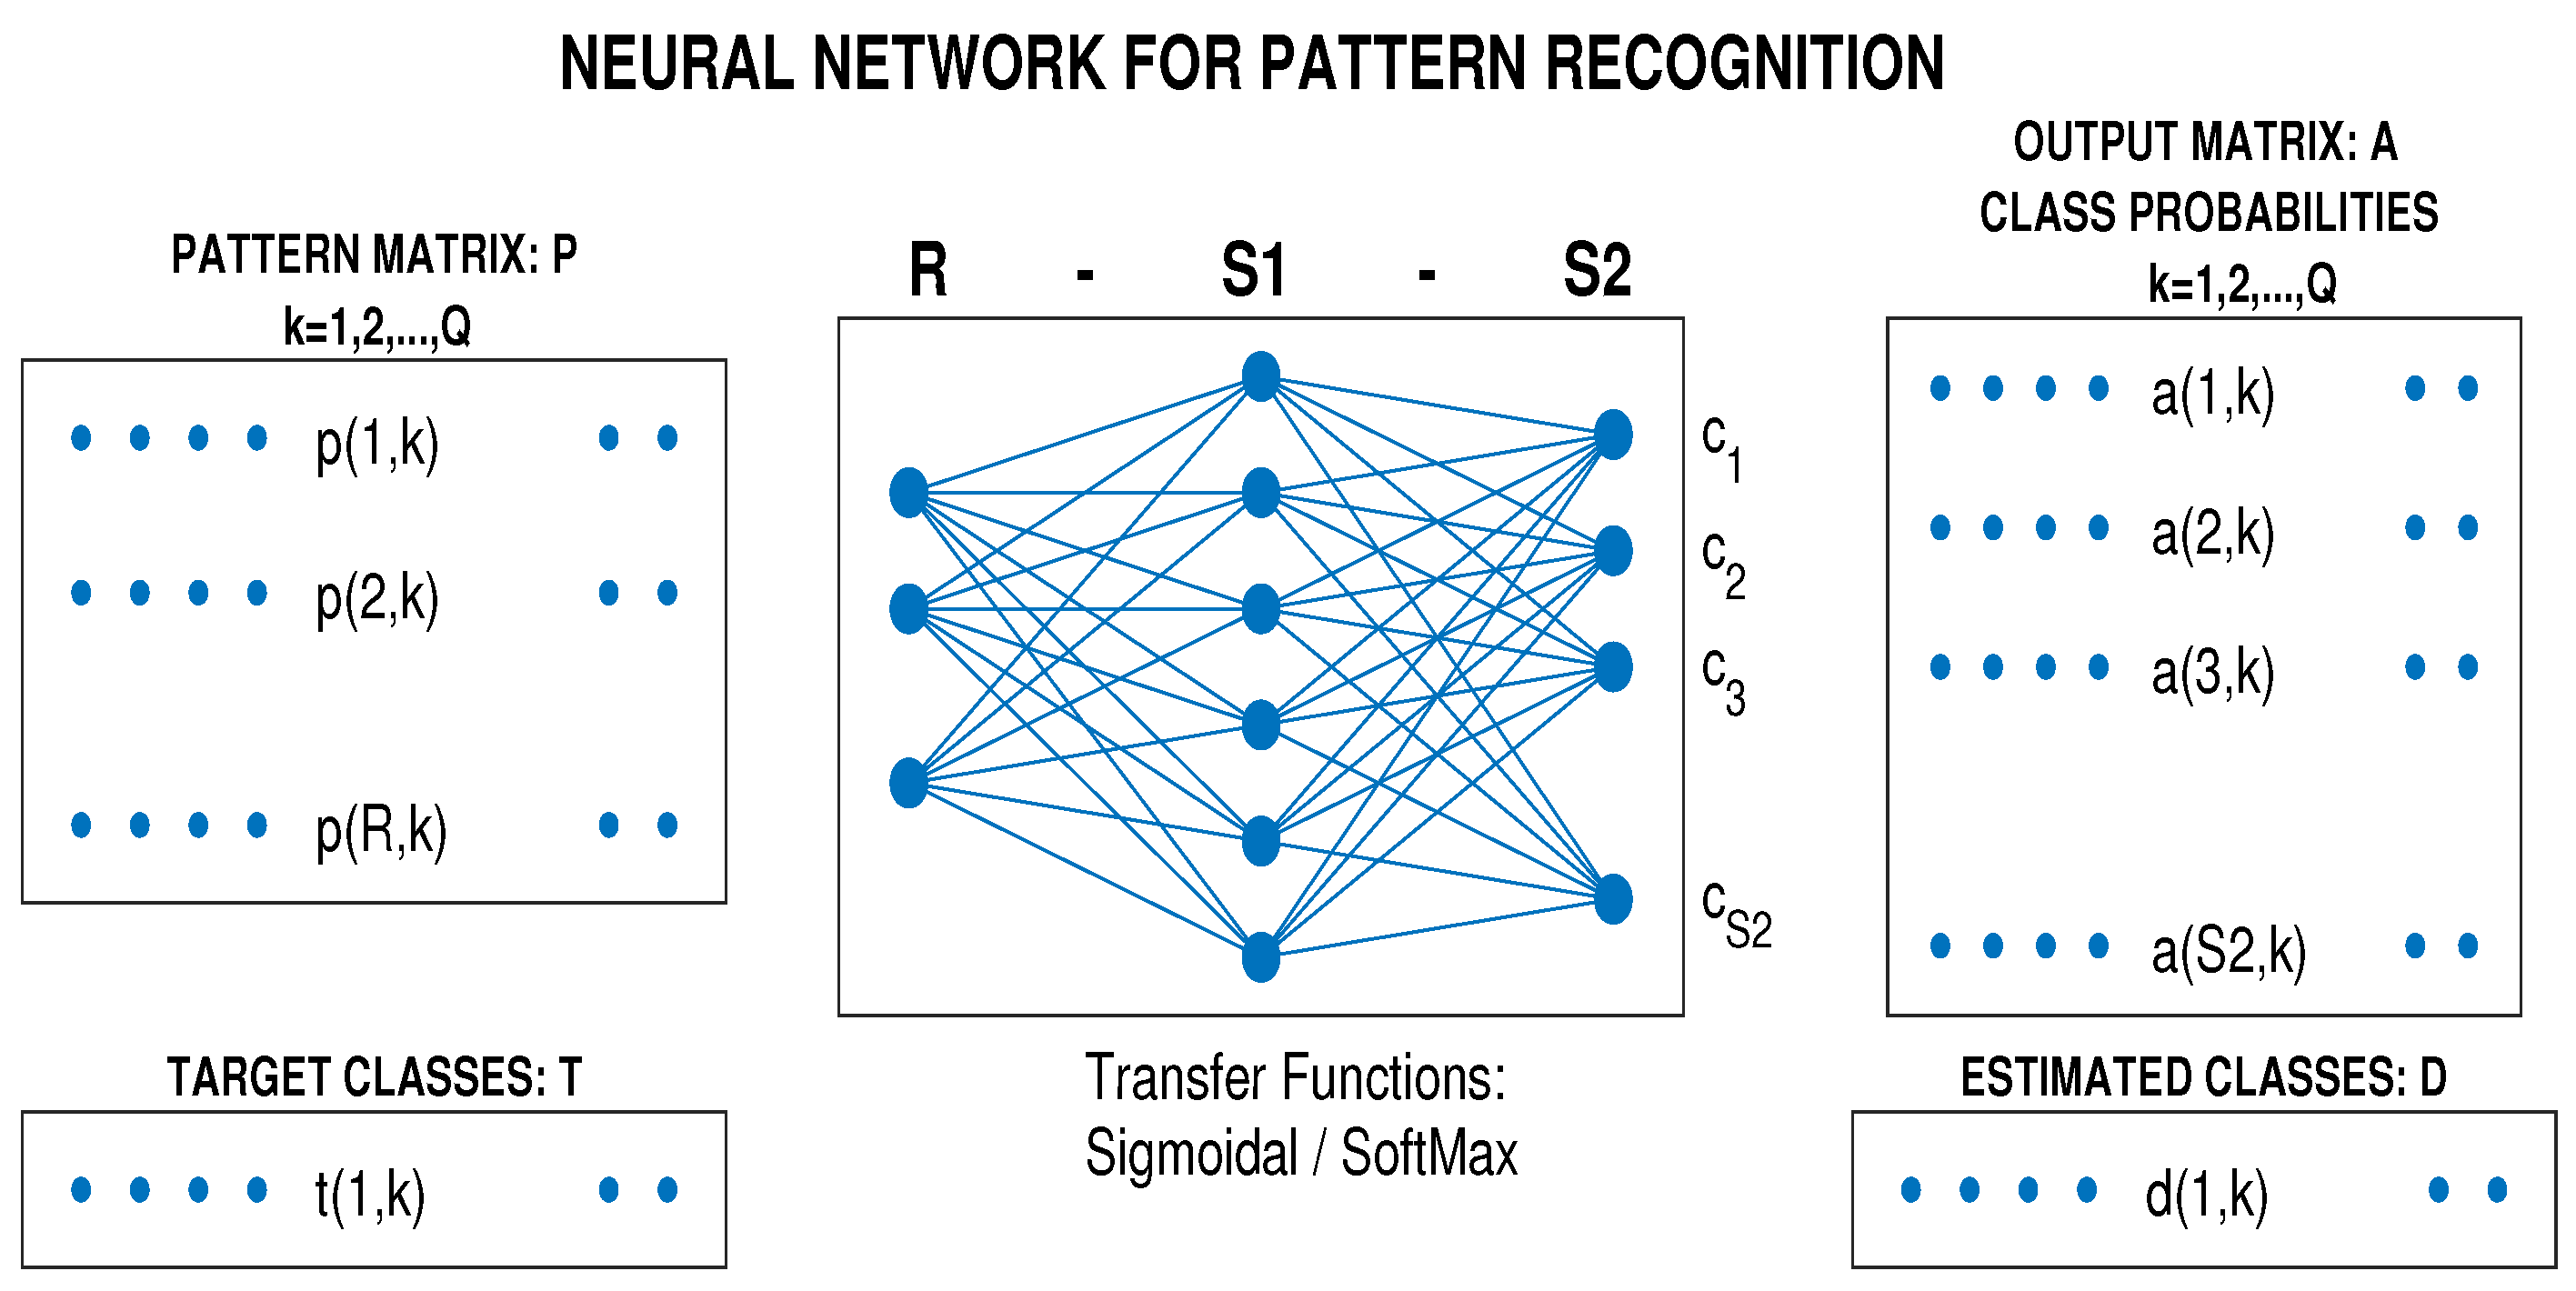
Machine learning [32,51,52] based on the optimization of the coefficients of an artificial neural network presented in Figure 4 used the pattern matrix as the inputs for the two-layer neural network with outputs of its separate layers
The network coefficients included the elements of the matrices , and the associated vectors , . The proposed neural network with the selected number of units in the first layer used the sigmoidal transfer function in the first layer and the probabilistic softmax transfer function in the second layer. The values of the output layer, based on the Bayes theorem [28], using the function
provided the probabilities of each class.
The coefficients of the mathematical model were then evaluated so as to minimize the cross-entropy errors [29,53,54,55], which heavily penalized extremely inaccurate outputs during the learning process. The efficiency of the classification was then evaluated by its accuracy and the cross-validation errors by the leave-one-out method.
3. Results
The distribution of features evaluated as the relative energy for the second decomposition level (using Daubechies wavelet functions) of the signals recorded by the accelerometers and gyrometers on the left and the right legs for a selected experiment is presented in Figure 3. To visualize the classification results, the number of features was reduced to only. The signal features were evaluated as the mean energy for the second decomposition level (using the Daubechies orthogonal wavelet with two coefficients) of the associated data values.
The proposed algorithm to process the data acquired by the selected sensors includes the following steps:
- acquiring signals recorded by the accelerometer and gyrometer during selected physical activities using handheld devices,
- transferring signals by wired or wireless communication links to a mathematical environment (of MATLAB 2018b in this case),
- mathematical data analysis including their resampling and digital filtering,
- applying the wavelet transform and evaluating the relative signal energy at selected decomposition levels,
- defining a pattern matrix with Q column vectors for each signal segment and associated vector of target values,
- optimizing and then verifying the classification model.
Table 1 presents the parameters of the cluster centers of the left and the right leg for feature 1 () and feature 2 () evaluated as the mean acceleration energy and the mean gyrometer energy, respectively, at the second wavelet decomposition level, for different loads and selected wavelet functions. It can be seen that the cluster centers are closer for higher loads during the given experiment.
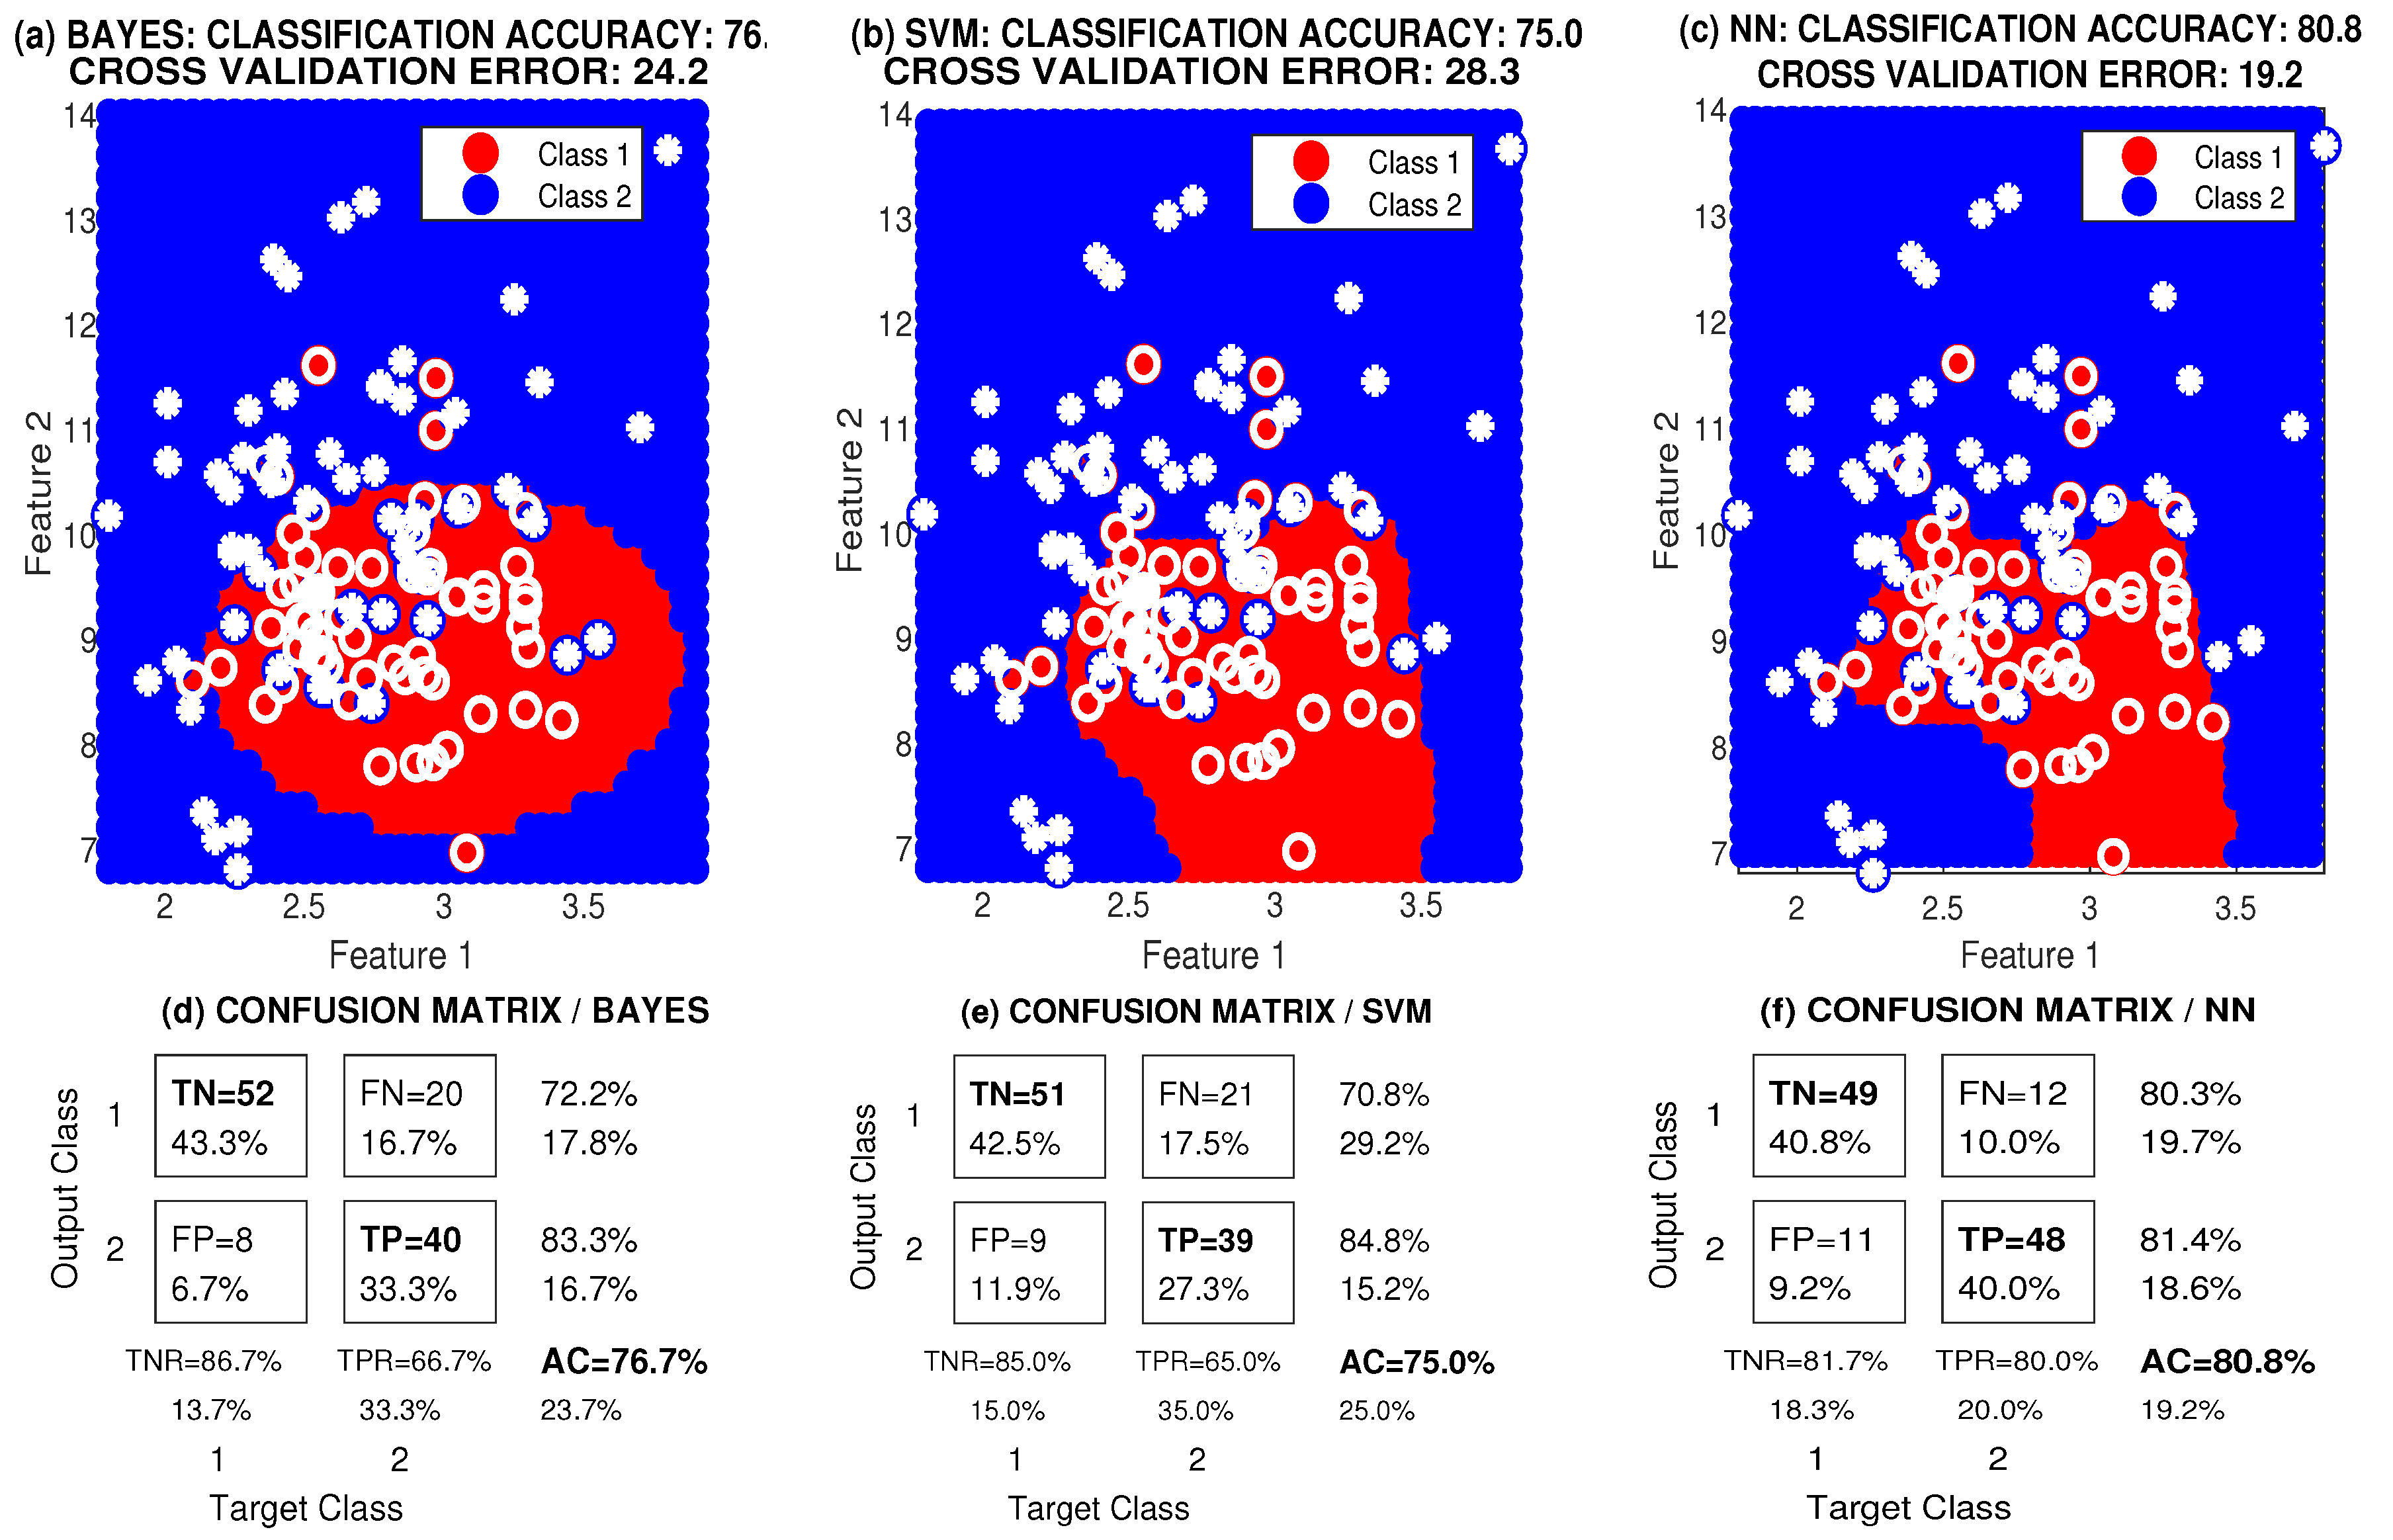
Classification of wavelet features performed by the neural network 2-10-2 (for the training (70%), validation (15%), and test (15%) sets) was compared with results from the k-nearest neighbour, the Bayesian approach, and a support vector machine methods based upon different principles [56]. Figure 5 presents the classification results for experiment , which lasted 180 s, and the Haar wavelet function as specified in Table 2. The characteristics used include the relative energy at the second wavelet decomposition level for the signal recorded by an accelerometer (feature 1) and a gyrometer (feature 2). The features include those for the left leg signals (class 1) and the right leg signals (class 2). This figure compares the class boundaries evaluated by the Bayesian method, a support vector machine, and a two-layer neural network model. Figure 5d–f present associated confusion matrices.
Table 2 presents the classification accuracy and the cross-validation errors estimated by the leave-one-out method and experiments performed for different levels of the load on the exercise bike. The results show that the Haar wavelet functions and features estimated at the second decomposition level provided better accuracy and lower cross-validation errors than the wavelet function, for all classification methods. The best results were obtained by the two-layer neural network: it provided a mean accuracy of 86.1% and mean cross validation error of 0.163. The results also indicated a decreasing accuracy with increasing load, which can be explained by the decreasing distance between the feature clusters for higher loads during the given exercise presented in Table 1.
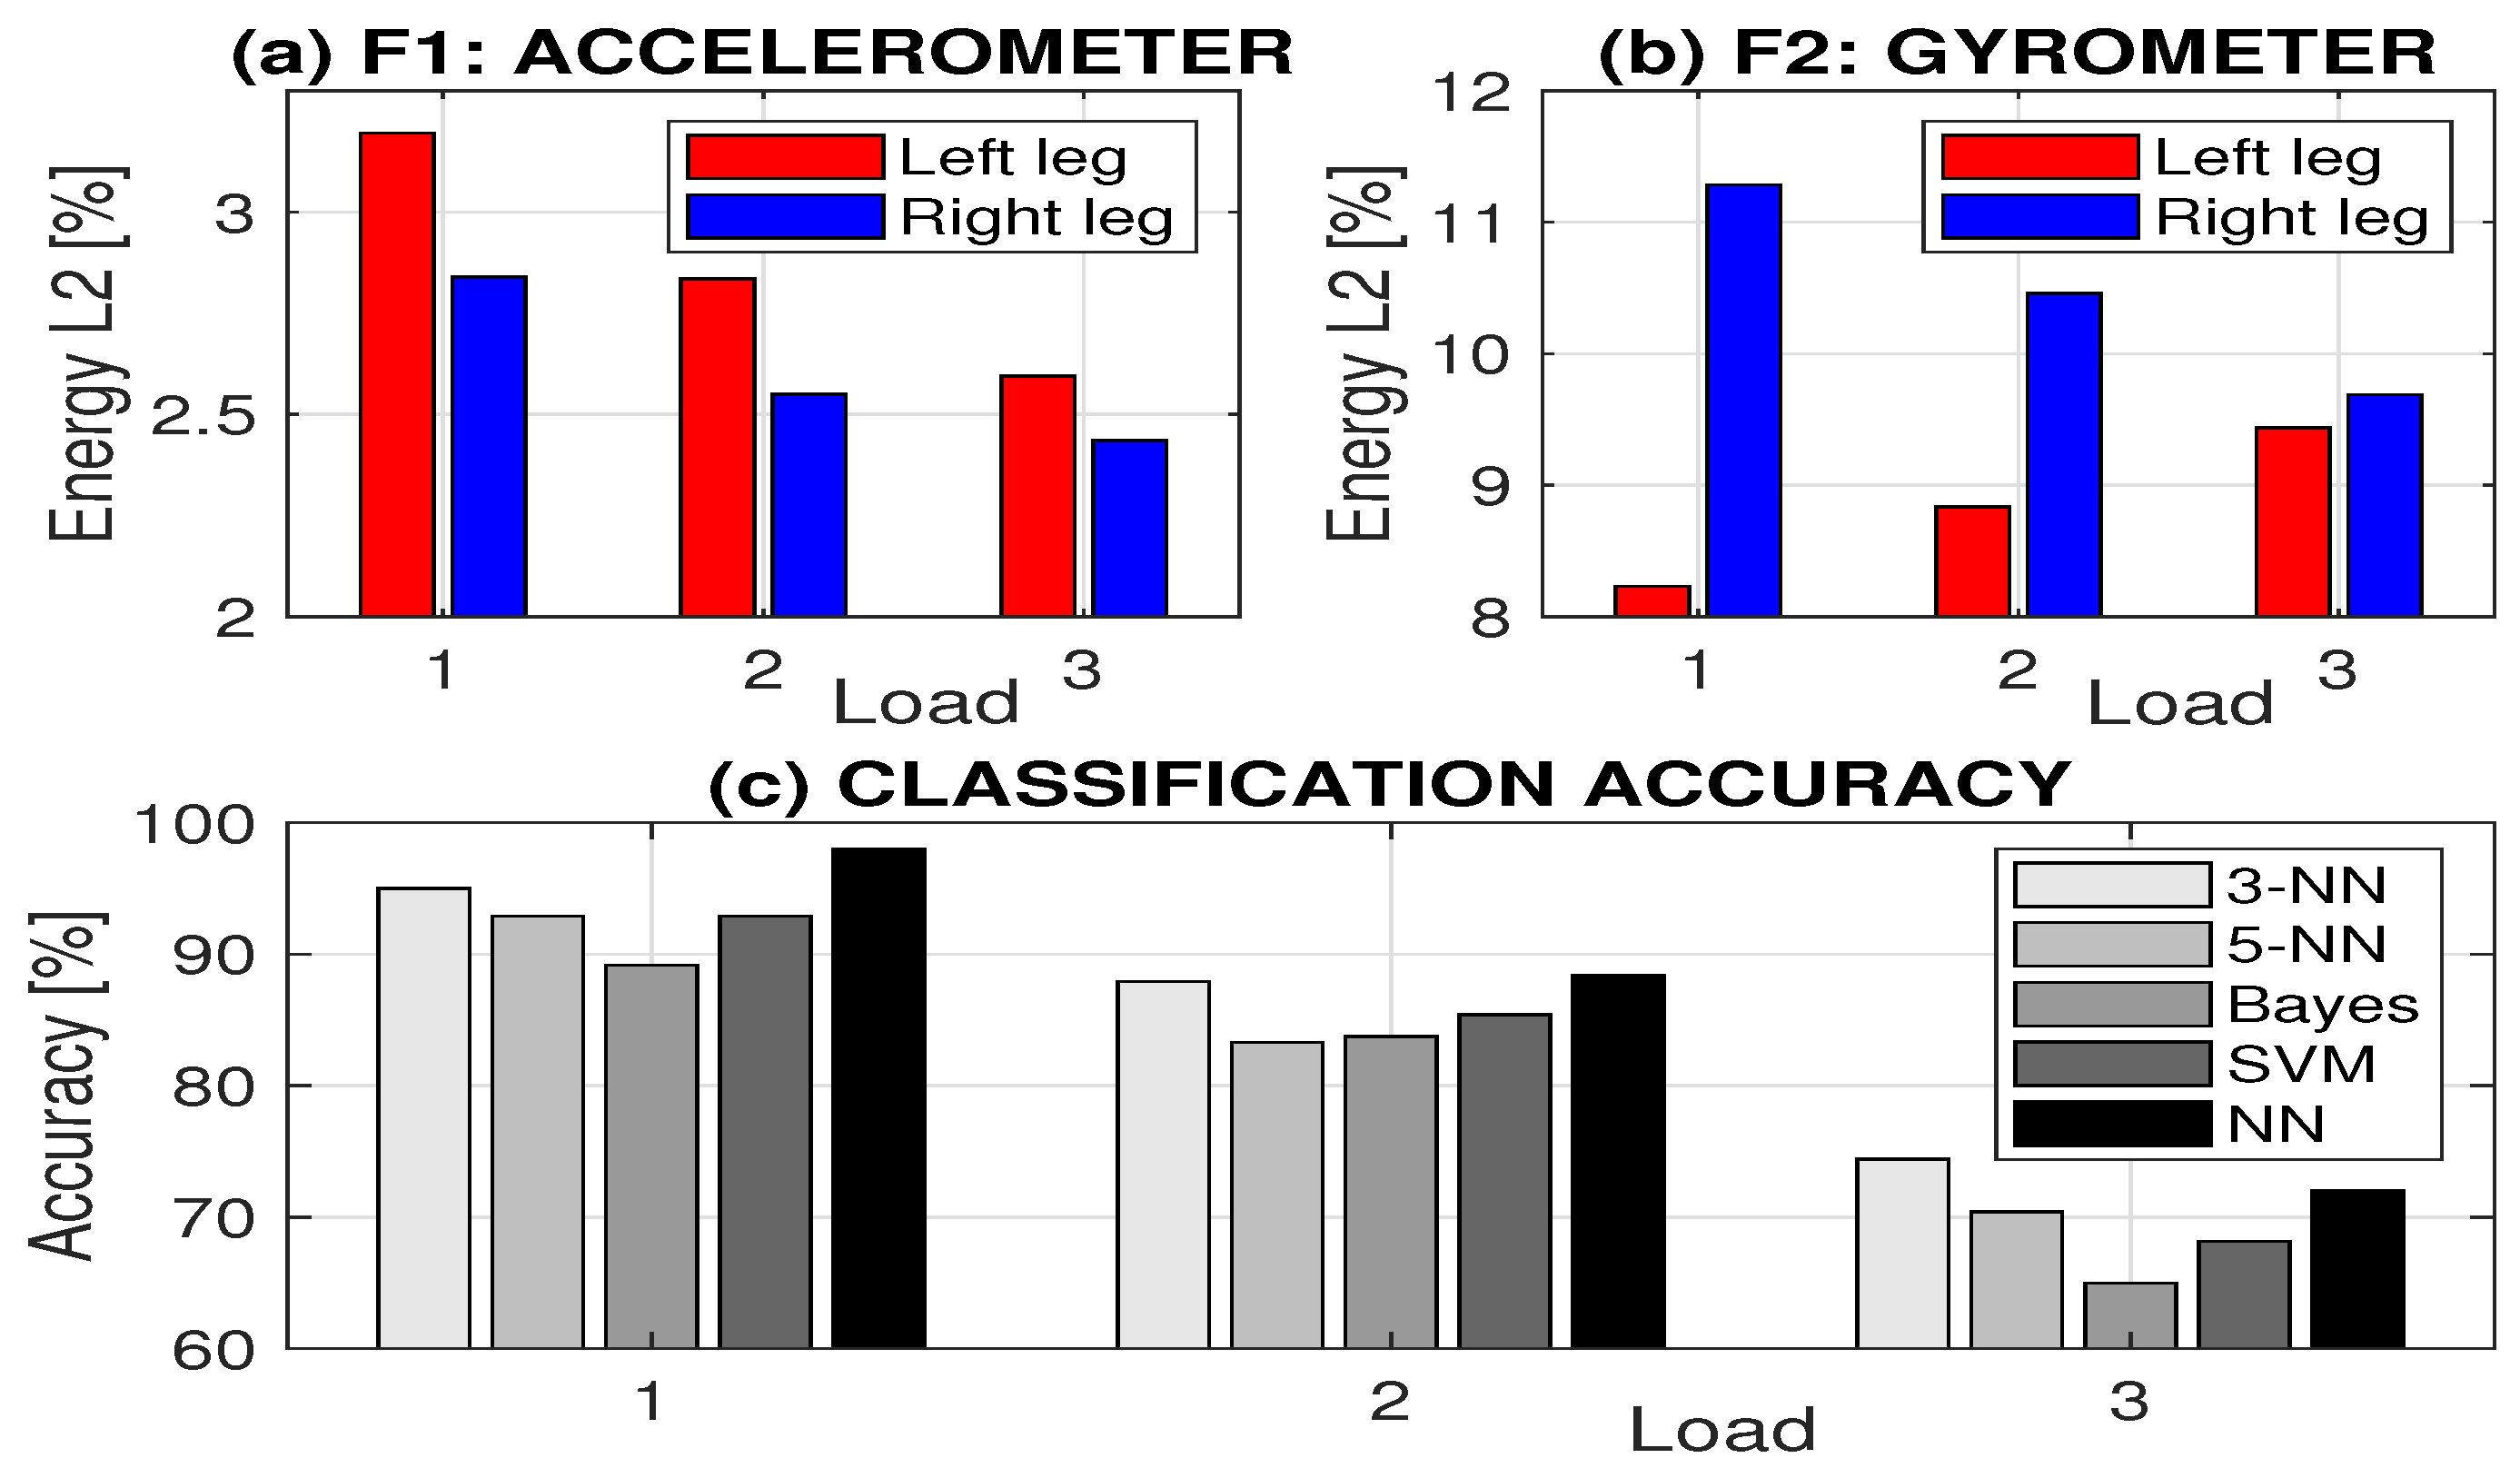
Figure 6a,b compare the mean energy at the second Haar decomposition level for signals recorded by the accelerometer (feature 1) and gyrometer (feature 2) with respect to the load during training on a home exercise bike related to Table 2. Figure 6c presents the classification accuracies obtained by different methods under the same load. Results pointed to the fact that with the increasing load the difference of the mean energy for the left and right legs at the second wavelet level is decreasing. For the resulting overlapping of feature clusters (with close feature values) the accuracy decreased, while the cross-validation errors increased, as presented in Table 2 and Figure 6c.
Results obtained illustrate also the importance of the appropriate features selection, as well as their number. Table 3 presents the comparison of classification results for the use of and wavelet features using data recorded by accelerometer and gyrometer. The complete set of energy distribution using Haar wavelet function for decomposition into the third level shows that the higher number of features provides better results but the similar dependency on the load.
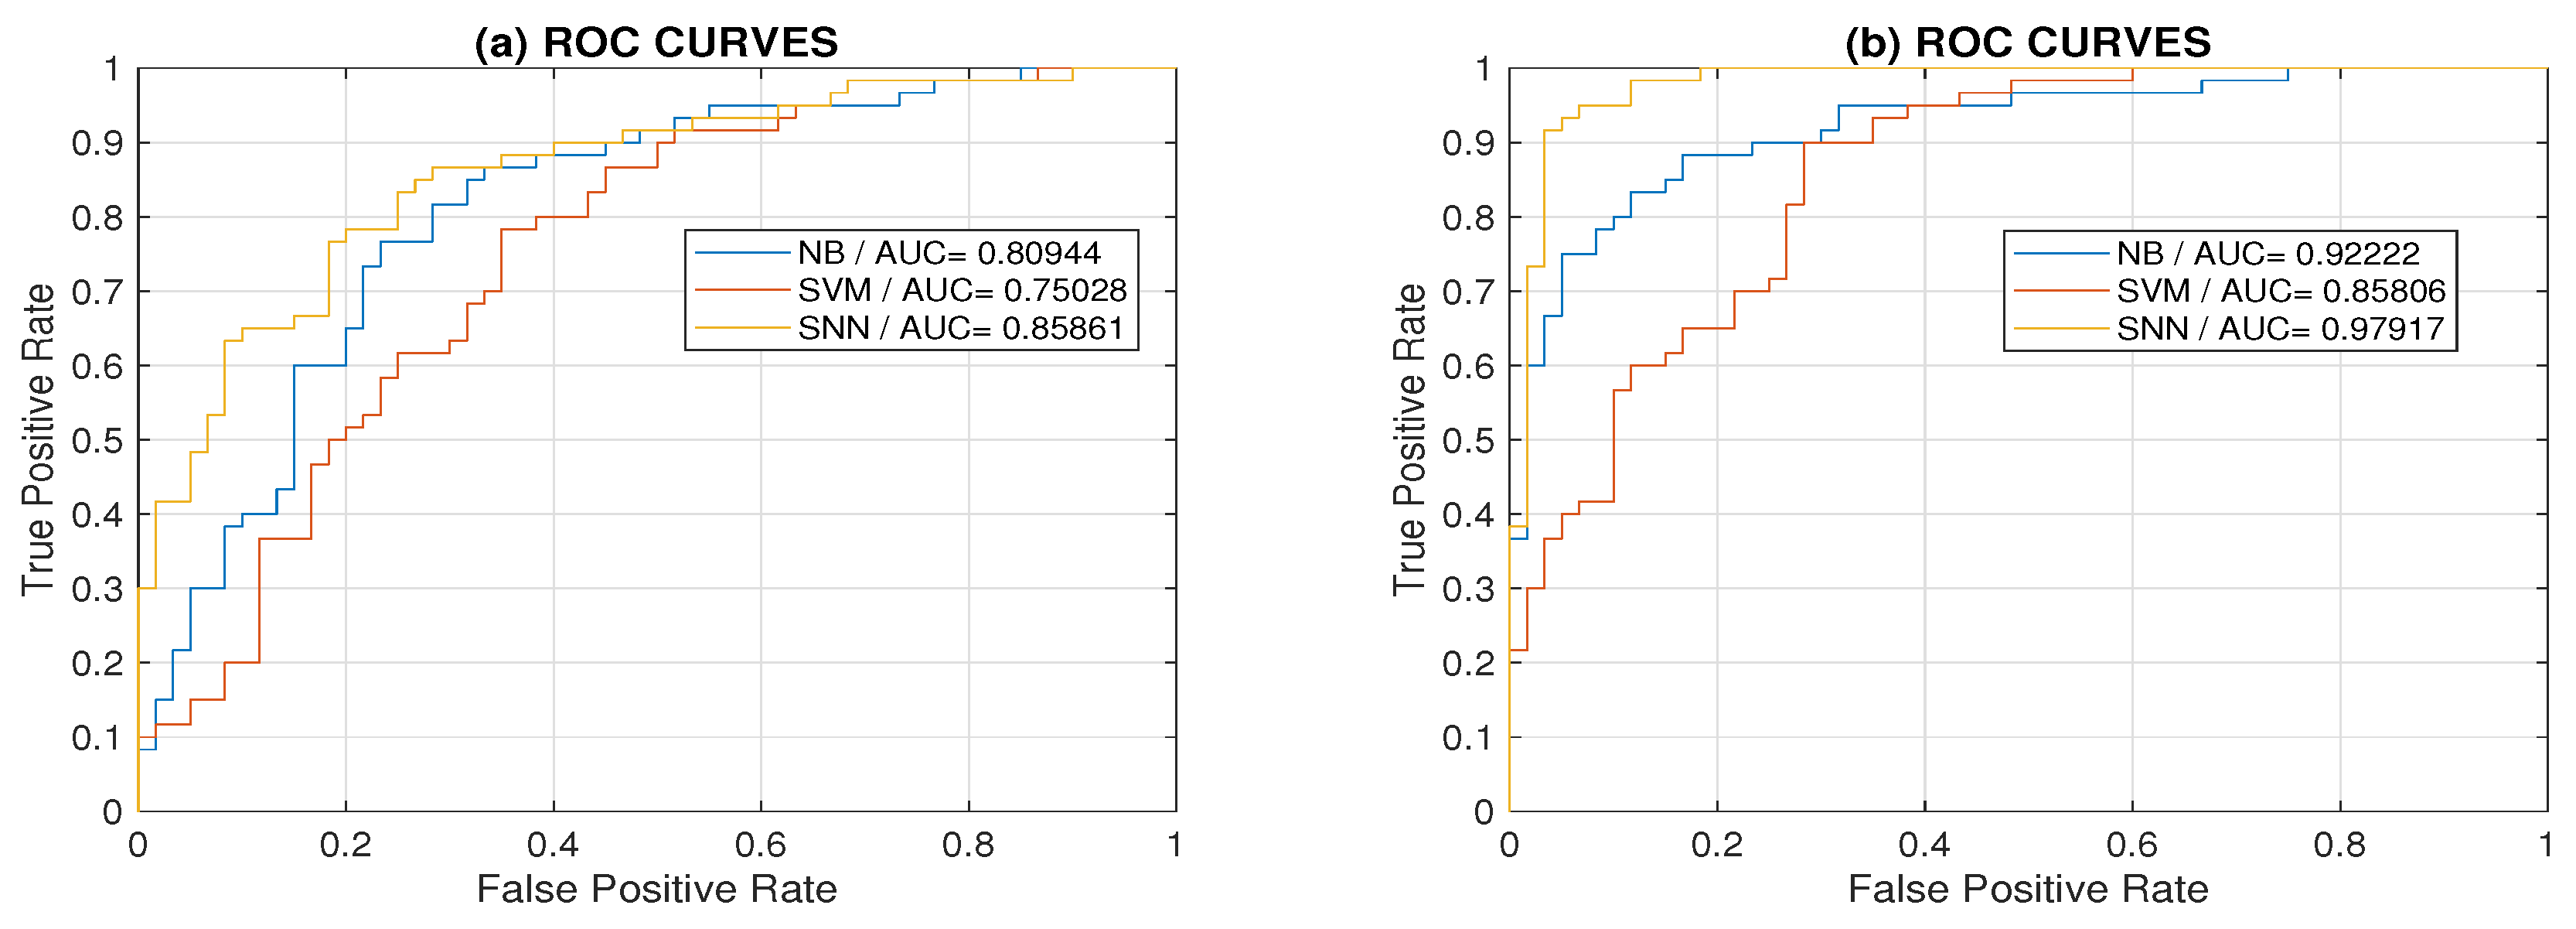
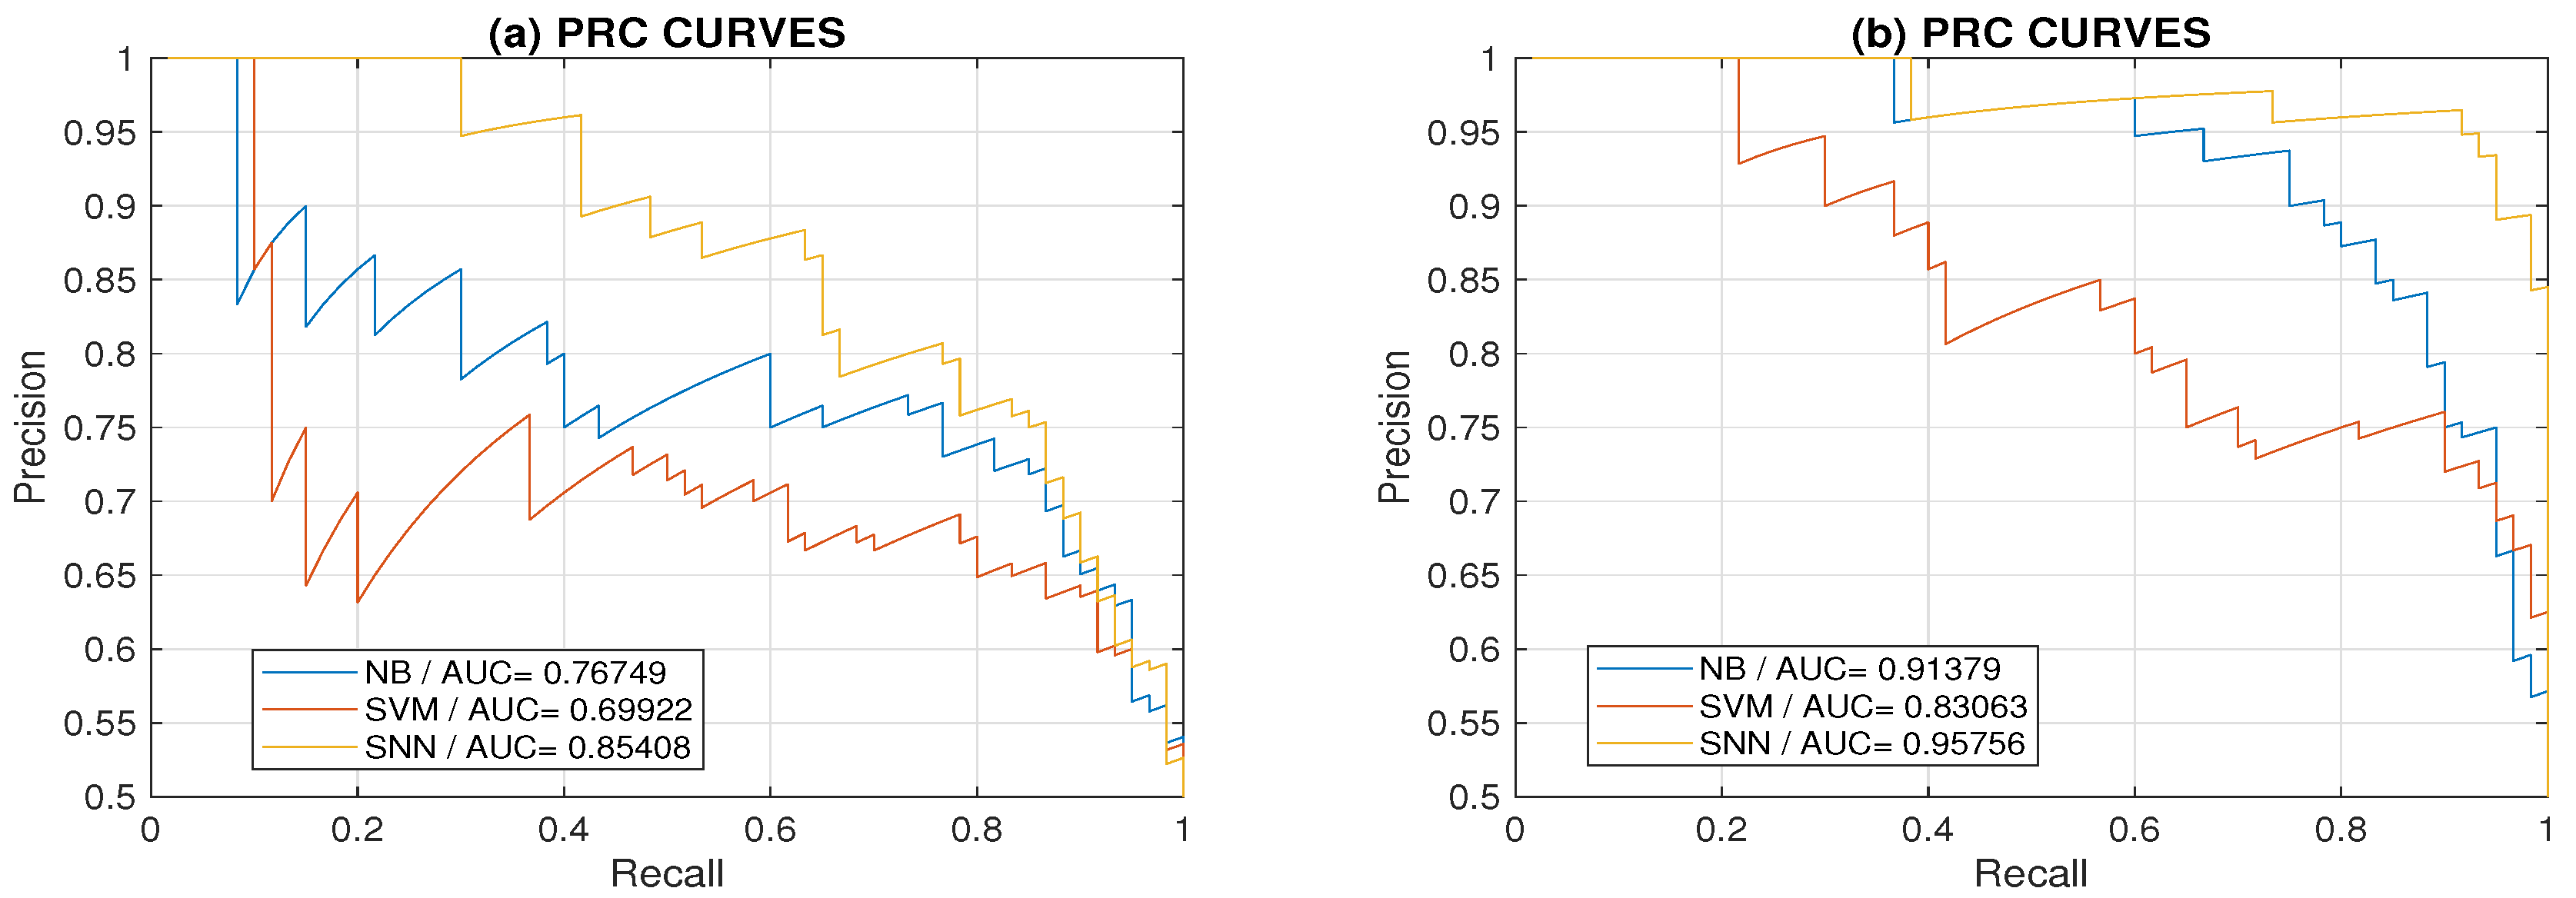
Figure 7 presents a comparison of receiver operating characteristic (ROC) curves for classification by Bayesian, support vector machine, and neural networks methods for the medium load using two and six features. Results show that the area under individual curves was the highest for neural network models. Classification using six features presented in Figure 7b show how the higher number of features increases the true positive rate. Figure 8 presents corresponding precision-recall (PRC) plots. As we used balanced datasets, the use of ROC curves provided sufficient information. In the case of unbalanced datasets, the use of PRC plots is recommended [57].
The difference between the motion of the right and left limbs can have natural or pathological reasons [19,23]. Some papers [58] discuss factors affecting gait symmetry or asymmetry. Abnomalities can be caused by different neurological problems, external conditions, age or gender. The effect of the movement speed on gait symmetry [58] is studied as well. The present paper confirms that the body load can affect the motion symmetry. Features used for symmetry evaluation can include energy evaluation [16] based on data acquired by different mobile sensors or analysis of spatial body position and its motion using video and depth cameras.
4. Conclusions
This paper presents a description of the use of accelerometers and gyrometers for motion monitoring and the use of the discrete wavelet transform for the estimation of their features. The data analyzed include signals recorded during physical activities and exercises performed on a home exercise bike with the different level of the load.
The proposed method is used to analyze the motion symmetry and to compare the movement of the left and the right limbs. The mean classification accuracies are between 72.6% and 91.0% for different wavelet functions and classification methods applied to the analysis of exercises performed during different external conditions. The best results were achieved by the use of a two-layer neural network with the sigmoidal and softmax transfer functions: the mean classification accuracy was 91.0% and the cross validation error 0.091. Results show the dependence of features on the load as well.
The proposed method includes the use of the discrete wavelet transform for estimating motion features, using the relative energy at selected decomposition levels. The results include a comparison of the use of the Daubechies and Haar wavelet functions for the analysis of the features associated with specific physical activities.
Future research will be devoted to the application of the proposed method in rehabilitation monitoring and neurology to evaluate the motion of patients with different neurological disorders. To improve the classification accuracy, a combination of selected and time synchronized sensors will be used for correlation analysis of motion data and brain signals recorded simultaneously. The whole research will form a part of the augmented reality study in connection with the use of new cyber–physical systems, computational intelligence use, and deep learning methods application as well.
Author Contributions
Investigation: A.P.; methodology: O.V.; data curation: H.C.; conceptualization: M.V.
Funding
This research was funded by grant projects of the Ministry of Health of the Czech Republic (FN HK 00179906) and of the Charles University in Prague, Czech Republic (PROGRES Q40), as well as by the project PERSONMED, Reg. No. CZ.02.1.010.00.017_0480007441, co-financed by European Regional Development Fund (ERDF) and the governmental budget of the Czech Republic.
Conflicts of Interest
The authors declare no conflict of interest.
References
- Carpes, F.P.; Mota, C.B.; Faria, I.E. On the bilateral asymmetry during running and cycling—A review considering leg preference. Phys. Ther. Sport 2010, 11, 136–142. [Google Scholar] [CrossRef] [PubMed]
- Hirata, K.; Kokubun, T.; Miyazawa, T.; Yokoyama, H.; Kubota, K.; Sonoo, M.; Hanawa, H.; Kanemura, N. Contribution of Lower Limb Joint Movement in Adapting to Re-establish Step Length Symmetry During Split-Belt Treadmill Walking. J. Med. Biol. Eng. 2018. [Google Scholar] [CrossRef]
- Joukov, V.; Bonnet, V.; Karg, M.; Venture, G.; Kulic, D. Rhythmic Extended Kalman Filter for Gait Rehabilitation Motion Estimation and Segmentation. IEEE Trans. Neural Syst. Rehabil. Eng. 2018, 26, 407–418. [Google Scholar] [CrossRef] [PubMed]
- Dutta, A.; Ma, O.; Toledo, M.; Pregonero, A.; Ainsworth, B.; Buman, M.; Bliss, D. Identifying Free-Living Physical Activities Using Lab-Based Models with Wearable Accelerometers. Sensors 2018, 17, 3893. [Google Scholar] [CrossRef] [PubMed]
- Oudre, L.; Barrois-Müller, R.; Moreau, T.; Truong, C.; Vienne-Jumeau, A.; Ricard, D.; Vayatis, N.; Vidal, P. Template-Based Step Detection with Inertial Measurement Units. Sensors 2018, 18, 4033. [Google Scholar] [CrossRef] [PubMed]
- Vaughn, A.; Biocco, P.; Liu, Y.; Anwar, M. Activity detection and analysis using smartphone sensors. In Proceedings of the 2018 IEEE 19th International Conference on Information Reuse and Integration for Data Science, IRI 2018, Salt Lake City, UT, USA, 6–9 July 2018; pp. 102–107. [Google Scholar]
- Abid, M.; Renaudin, V.; Aoustin, Y.; Le-Carpentier, E.; Robert, T. Walking Gait Step Length Asymmetry Induced by Handheld Device. IEEE Trans. Neural Syst. Rehabil. Eng. 2017, 25, 2075–2083. [Google Scholar] [CrossRef] [PubMed] [Green Version]
- Zhan, A.; Mohan, S.; Tarolli, C.; Schneider, R.; Adams, J.; Sharma, S.; Elson, M.; Spear, K.; Glidden, A.; Little, M.; et al. Using smartphones and machine learning to quantify Parkinson disease severity the mobile Parkinson disease score. JAMA Neurol. 2018, 75, 876–880. [Google Scholar] [CrossRef] [PubMed]
- Procházka, A.; Charvátová, H.; Vyšata, O.; Kopal, J.; Chambers, J. Breathing Analysis Using Thermal and Depth Imaging Camera Video Records. Sensors 2017, 17, 1408. [Google Scholar] [CrossRef]
- Kaneko, M.; Yamashita, Y.; Inomoto, O.; Iramina, K. Soft Neurological Signs in Childhood by Measurement of Arm Movements Using Acceleration and Angular Velocity Sensors. Sensors 2015, 15, 25793–25808. [Google Scholar] [CrossRef] [Green Version]
- Chester, V.L.; Calhoun, M. Gait Symmetry in Children with Autism. Autism Res. Treat. 2012, 2012, 576478. [Google Scholar] [CrossRef]
- Rueangsirarak, W.; Zhang, J.; Aslam, N.; Ho, E.S.L.; Shum, H.P.H. Automatic Musculoskeletal and Neurological Disorder Diagnosis with Relative Joint Displacement from Human Gait. IEEE Trans. Neural Syst. Rehabil. Eng. 2018, 26, 2387–2396. [Google Scholar] [CrossRef] [PubMed]
- Filippeschi, A.; Schmitz, N.; Miezal, M.; Bleser, G.; Ruffaldi, E.; Stricker, D. Survey of Motion Tracking Methods Based on Inertial Sensors: A Focus on Upper Limb Human Motion. Sensors 2017, 17, 1257. [Google Scholar] [CrossRef] [PubMed]
- Sanei, S.; Chambers, J. EEG Signal Processing; John Wiley & Sons Ltd.: Chichester, UK, 2007. [Google Scholar]
- Nixon, M.; Aguado, A. Feature Extraction & Image Processing; Elsevier: Amsterdam, The Netherlands, 2004. [Google Scholar]
- Yap, Y.T.; Gouwanda, D.; Gopalai, A.A.; Zheng, C.Y. Analysis of Instantaneous Energy Symmetry Index in Asymmetrical Gait. In Proceedings of the TENCON 2018—2018 IEEE Region 10 Conference, Jeju, Korea, 28–31 October 2018; pp. 1982–1987. [Google Scholar]
- Chen, P.; Kuang, Y.; Li, J. Human Motion Capture Algorithm Based on Inertial Sensors. J. Sens. 2016, 2016, 4343797. [Google Scholar] [CrossRef]
- Alvarez, D.; Alvarez, J.; Gonzalez, R.; Lopez, A. Upper limb joint angle measurement in occupational health. Comput. Methods Biomech. Biomed. Eng. 2015, 19, 1–12. [Google Scholar] [CrossRef] [PubMed]
- Ishikawa, M.; Yamada, S.; Yamamoto, K.; Aoyagi, Y. Gait analysis in a component timed-up-and-go test using a smartphone application. J. Neurol. Sci. 2019, 398, 45–49. [Google Scholar] [CrossRef] [PubMed]
- Chen, Y.; Shen, C. Performance Analysis of Smartphone-Sensor Behavior for Human Activity Recognition. IEEE Access 2017, 5, 3095–3110. [Google Scholar] [CrossRef]
- Sun, B.; Wang, Y.; Banda, J. Gait Characteristic Analysis and Identification Based on the iPhone Accelerometer and Gyrometer. Sensors 2014, 18, 17037–17054. [Google Scholar] [CrossRef]
- Allseits, E.; Kim, K.; Bennett, C.; Gailey, R.; Gaunaurd, I.; Agrawal, V. A Novel Method for Estimating Knee Angle Using Two Leg-Mounted Gyroscopes for Continuous Monitoring with Mobile Health Devices. Sensors 2018, 18, 2759. [Google Scholar] [CrossRef]
- Staab, W.; Hottowitz, R.; Sohns, C.; Sohns, J.; Gilbert, F.; Menke, J.; Niklas, A.; Lotz, J. Accelerometer and Gyroscope Based Gait Analysis Using Spectral Analysis of Patients with Osteoarthritis of the Knee. J. Phys. Ther. Sci. 2014, 26, 997–1002. [Google Scholar] [CrossRef] [Green Version]
- Jang, J.; Ankit, A.; Kim, J.; Jang, Y.; Kim, H.; Kim, J.; Xiong, S. A Unified Deep-Learning Model for Classifying the Cross-Country Skiing Techniques Using Wearable Gyroscope Sensors. Sensors 2018, 18, 3819. [Google Scholar] [CrossRef]
- Ellis, K.; Kerr, J.; Godbole, S.; Lanckriet, G.; Wing, D.; Marshall, S. A random forest classifier for the prediction of energy expenditure and type of physical activity from wrist and hip accelerometers. Physiol. Meas. 2014, 35, 2191–2203. [Google Scholar] [CrossRef] [PubMed]
- Ebara, T.; Azuma, R.; Shoji, N.; Matsukawa, T.; Yamada, Y.; Akiyama, T.; Kurihara, T.; Yamada, S. Reliability of smartphone-based gait measurements for quantification of physical activity/inactivity levels. J. Occup. Health 2017, 59, 506–512. [Google Scholar] [CrossRef] [PubMed]
- Procházka, A.; Vaseghi, S.; Charvátová, H.; Ťupa, O.; Vyšata, O. Cycling Segments Multimodal Analysis and Classification Using Neural Networks. Appl. Sci. 2017, 7, 581. [Google Scholar] [CrossRef]
- Procházka, A.; Vyšata, O.; Vališ, M.; Ťupa, O.; Schatz, M.; Mařík, V. Bayesian classification and analysis of gait disorders using image and depth sensors of Microsoft Kinect. Digit. Signal Process Rev. J. 2015, 47, 169–177. [Google Scholar] [CrossRef]
- Procházka, A.; Charvátová, H.; Vaseghi, S.; Vyšata, O. Machine Learning in Rehabilitation Assessment for Thermal and Heart Rate Data Processing. IEEE Trans. Neural Syst. Rehabil. Eng. 2018, 26, 1209–1214. [Google Scholar]
- Khandoker, A.; Lai, D.; Begg, R.; Palaniswami, M. Wavelet-Based Feature Extraction for Support Vector Machines for Screening Balance Impairments in the Elderly. IEEE Trans. Neural Syst. Rehabil. Eng. 2007, 15, 587–597. [Google Scholar] [CrossRef] [PubMed]
- Hošťálková, E.; Vyšata, O.; Procházka, A. Multi-dimensional biomedical image de-noising using Haar transform. In Proceedings of the 2007 15th International Conference on Digital Signal Processing, Cardiff, UK, 1–4 July 2007; pp. 175–179. [Google Scholar]
- Goodfellow, I.; Bengio, Y.; Courville, A. Deep Learning; MIT Press: Cambridge, MA, USA, 2016. [Google Scholar]
- Antoniades, A.; Spyrou, L.; Martin-Lopez, D.; Valentin, A.; Alarcon, G.; Sanei, S.; Took, C. Detection of Interictal Discharges with Convolutional Neural Networks Using Discrete Ordered Multichannel Intracranial EEG. IEEE Trans. Neural Syst. Rehabil. Eng. 2017, 25, 2285–2294. [Google Scholar] [CrossRef] [PubMed]
- Carpinella, I.; Gervasoni, E.; Anastasi, D.; Lencioni, T.; Cattaneo, D.; Ferrari, M. Instrumental Assessment of Stair Ascent in People With Multiple Sclerosis, Stroke, and Parkinson’s Disease: A Wearable-Sensor-Based Approach. IEEE Trans. Neural Syst. Rehabil. Eng. 2018, 26, 2324–2332. [Google Scholar] [CrossRef] [PubMed]
- Li, H.; Trocan, M. Deep learning of smartphone sensor data for personal health assistance. Microelectron. J. 2019, 88, 164–172. [Google Scholar] [CrossRef]
- Chambon, S.; Galtier, M.; Arnal, P.; Wainrib, G.; Gramfort, A. A Deep Learning Architecture for Temporal Sleep Stage Classification Using Multivariate and Multimodal Time Series. IEEE Trans. Neural Syst. Rehabil. Eng. 2018, 26, 758–769. [Google Scholar] [CrossRef]
- Sadouk, L.; Gadi, T. Convolutional Neural Networks for Human Activity Recognition in Time and Frequency-Domain. Adv. Intell. Sys. Comput. 2019, 756, 485–496. [Google Scholar]
- Almaslukh, B.; Artoli, A.; Al-Muhtadi, J. A robust deep learning approach for position-independent smartphone-based human activity recognition. Sensors 2018, 18, 3726. [Google Scholar] [CrossRef] [PubMed]
- Kok, M.; Hol, J.; Schon, T. Using Inertial Sensors for Position and Orientation Estimation. Found. Trends Signal Process. 2017, 11, 1–153. [Google Scholar] [CrossRef] [Green Version]
- Liu, H.; Fang, R.; Miao, M.; Zhang, Y.; Yan, Y.; Tang, X.; Lu, H.; Jin, F. Design, Fabrication, and Performance Characterization of LTCC-Based Capacitive Accelerometers. Micromachines 2018, 9, 120. [Google Scholar] [CrossRef] [PubMed]
- Mohammed, Z.; Elfadel, I.M.; Rasras, M. Monolithic Multi Degree of Freedom (MDoF) Capacitive MEMS Accelerometers. Micromachines 2018, 9, 602. [Google Scholar] [CrossRef] [PubMed]
- Xia, A.; Yu, C.; Kong, L. The Development of Micromachined Gyroscope Structure and Circuitry Technology. Sensors 2014, 14, 1394–1473. [Google Scholar] [CrossRef] [PubMed] [Green Version]
- Rezvanian, S.; Lockhart, T.E. Towards Real-Time Detection of Freezing of Gait Using Wavelet Transform on Wireless Accelerometer Data. Sensors 2016, 16, 475. [Google Scholar] [CrossRef] [PubMed]
- Glavinovitch, A.; Swamy, M.; Plotkin, E. Wavelet-Based Segmentation Techniques in the Detection of Microarousals in the Sleep EEG. In Proceedings of the 48th Midwest Symposium on Circuits and Systems, Covington, KY, USA, 7–10 August 2005; pp. 1302–1305. [Google Scholar]
- Johankhani, P.; Kodogiannis, V.; Revett, K. EEG Signal Classification Using Wavelet Feature Extraction and Neural Networks. In Proceedings of the IEEE John Vincent Atanasoff 2006 International Symposium on Modern Computing (JVA06), Sofia, Bulgaria, 3–6 October 2006; pp. 120–124. [Google Scholar]
- Dimoulas, C.; Kalliris, G.; Papanikolaou, G.; Kalampakas, A. Long-Term Signal Detection, Segmentation and Summarization Using Wavelets and Fractal Dimension: A Bioacoustics Application in Gastrointestinal- Motility Monitoring. Comput. Biol. Med. 2007, 37, 438–462. [Google Scholar] [CrossRef] [PubMed]
- Selesnick, I.; Baraniuk, R.; Kingsbury, N. The Dual-Tree Complex Wavelet Transform. IEEE Signal Process Mag. 2005, 22, 123–151. [Google Scholar] [CrossRef]
- Castellanos, N.; Makarov, V. Recovering EEG Brain Signals: Artifact Suppression with Wavelet Enhanced Independent Component Analysis. J. Neurosci. Methods 2006, 158, 300–312. [Google Scholar] [CrossRef]
- Daubechies, I. The Wavelet Transform, Time-Frequency Localization and Signal Analysis. IEEE Trans. Inform. Theory 1990, 36, 961–1005. [Google Scholar] [CrossRef]
- Newland, D. An Introduction to Random Vibrations, Spectral and Wavelet Analysis, 3rd ed.; Longman: Essex, UK, 1994. [Google Scholar]
- Prashar, P. Neural Networks in Machine Learning. Int. J. Comput. Appl. Technol. 2014, 105, 1–3. [Google Scholar]
- He, K.; Zhang, X.; Ren, S.; Sun, J. Deep Residual Learning for Image Recognition. In Proceedings of the 2016 IEEE Conference on Computer Vision and Pattern Recognition, Las Vegas, NV, USA, 27–30 June 2016; pp. 770–778. [Google Scholar]
- Kusumoputro, B.; Lina, L. Infrared Face Recognition System Using Cross Entropy Error Function Based Ensemble Backpropagation Neural Networks. Int. J. Comp. Theory Eng. 2016, 8, 161–166. [Google Scholar] [CrossRef] [Green Version]
- Rimer, M.; Martinez, T. Classification-based objective functions. Mach. Learn. 2006, 63, 183–205. [Google Scholar] [CrossRef] [Green Version]
- Bishop, C. Pattern Recognition and Machine Learning; Springer-Verlag: Berlin, Germany, 2006. [Google Scholar]
- Tharwat, A. Classification assessment methods. Appl. Comput. Inf. 2018, in press. [Google Scholar] [CrossRef]
- Saito, T.; Rehmsmeier, M. The precision-recall plot is more informative than the ROC plot when evaluating binary classifiers on imbalanced datasets. PLoS ONE 2015, 10, e0118432. [Google Scholar] [CrossRef] [PubMed]
- Nasirzade, A.; Sadeghi, H.; Mokhtarinia, H.R.; Rahimi, A. A Review of Selected Factors Affecting Gait Symmetry. Phys. Treat. 2017, 7, 3–12. [Google Scholar] [CrossRef] [Green Version]
Figure 1.
Principle of raw data acquisition (with the sampling frequency of 100 Hz) from a mobile device located on (A) the right limb and (B) the left limb, using (C) the accelerometer and gyrometer during an exercise lasting 60 s, and (D) orientations of the axes for data acquisition.
Figure 1.
Principle of raw data acquisition (with the sampling frequency of 100 Hz) from a mobile device located on (A) the right limb and (B) the left limb, using (C) the accelerometer and gyrometer during an exercise lasting 60 s, and (D) orientations of the axes for data acquisition.

Figure 2.
Shannon wavelet functions presenting (a) their dilation in the time domain, (b) corresponding spectra compression, and (c) distribution of scalogram coefficients.
Figure 2.
Shannon wavelet functions presenting (a) their dilation in the time domain, (b) corresponding spectra compression, and (c) distribution of scalogram coefficients.

Figure 3.
Distribution of features evaluated as the relative energy for the second decomposition wavelet level of signals recorded by the accelerometer and gyrometer on the left and the right legs.
Figure 3.
Distribution of features evaluated as the relative energy for the second decomposition wavelet level of signals recorded by the accelerometer and gyrometer on the left and the right legs.

Figure 4.
A two-layer neural network with sigmoidal and softmax transfer functions for classification of a pattern vector evaluating probabilities of their affiliation into classes .
Figure 4.
A two-layer neural network with sigmoidal and softmax transfer functions for classification of a pattern vector evaluating probabilities of their affiliation into classes .

Figure 5.
Results of classification for a selected experiment 180 s long for wavelet features evaluated for the left leg (class 1) and the right leg (class 2) evaluated by the (a) Bayesian method, (b) support vector machine, (c) neural networks, and (d–f) associated confusion matrices.
Figure 5.
Results of classification for a selected experiment 180 s long for wavelet features evaluated for the left leg (class 1) and the right leg (class 2) evaluated by the (a) Bayesian method, (b) support vector machine, (c) neural networks, and (d–f) associated confusion matrices.

Figure 6.
The comparison of (a) the mean energy at the second Haar decomposition level for signals recorded by the accelerometer (feature ) and (b) gyrometer (feature ), and (c) classification accuracy for different methods for the left leg (class 1) and the right leg (class 2) with respect to the load during the exercise.

Figure 7.
Receiver operating characteristic (ROC) curves for Bayes, support vector machine (SVM) and neural network (NN) classification methods for the medium load using (a) two and (b) six features with areas under individual curves.
Figure 7.
Receiver operating characteristic (ROC) curves for Bayes, support vector machine (SVM) and neural network (NN) classification methods for the medium load using (a) two and (b) six features with areas under individual curves.

Figure 8.
Precision-recall plots for Bayes, SVM and NN classification methods for the medium load using (a) two and (b) six features with areas under individual curves.
Figure 8.
Precision-recall plots for Bayes, SVM and NN classification methods for the medium load using (a) two and (b) six features with areas under individual curves.


Table 1.
Parameters of cluster centers of the left and the right legs for feature 1 (: the mean acceleration energy at the second wavelet level) and feature 2 (: the mean gyrometer energy at the second wavelet level) for different loads.
Table 1.
Parameters of cluster centers of the left and the right legs for feature 1 (: the mean acceleration energy at the second wavelet level) and feature 2 (: the mean gyrometer energy at the second wavelet level) for different loads.
| Wavelet | Load | Mean Energy [%] | Standard Deviation | ||||||
|---|---|---|---|---|---|---|---|---|---|
| Left Leg | Right Leg | Left Leg | Right Leg | ||||||
| db2 | 1a | 3.82 | 3.50 | 3.14 | 4.71 | 0.67 | 0.76 | 0.64 | 0.78 |
| 1b | 3.50 | 3.36 | 3.25 | 4.17 | 0.69 | 0.71 | 0.63 | 0.65 | |
| 2a | 3.50 | 3.32 | 2.78 | 3.93 | 0.59 | 0.56 | 0.52 | 0.52 | |
| 2b | 3.68 | 3.42 | 3.05 | 3.95 | 0.74 | 0.58 | 0.67 | 0.55 | |
| 3a | 3.34 | 3.50 | 3.07 | 3.58 | 0.63 | 0.48 | 0.41 | 0.49 | |
| 3b | 3.34 | 3.59 | 3.39 | 3.54 | 0.48 | 0.45 | 0.42 | 0.40 | |
| Haar | 1a | 3.27 | 8.33 | 2.78 | 11.90 | 0.60 | 1.10 | 0.48 | 1.55 |
| 1b | 3.12 | 8.13 | 2.90 | 10.67 | 0.54 | 1.28 | 0.55 | 1.36 | |
| 2a | 2.90 | 8.45 | 2.51 | 10.69 | 0.44 | 1.12 | 0.30 | 1.42 | |
| 2b | 2.77 | 9.22 | 2.59 | 10.23 | 0.35 | 0.88 | 0.47 | 1.66 | |
| 3a | 2.69 | 9.23 | 2.46 | 9.85 | 0.40 | 0.89 | 0.29 | 1.57 | |
| 3b | 2.50 | 9.64 | 2.51 | 8.97 | 0.37 | 1.01 | 0.33 | 1.61 | |
Table 2.
Classification accuracies () and cross-validation () errors to evaluate experiments under different loads and using different methods: k-nearest neighbors (NN), Bayesian, support vector machine, and neural networks, using features evaluated by different wavelet functions.
Table 2.
Classification accuracies () and cross-validation () errors to evaluate experiments under different loads and using different methods: k-nearest neighbors (NN), Bayesian, support vector machine, and neural networks, using features evaluated by different wavelet functions.
| Wavelet | Load | 3-NN | 5-NN | Bayes | SVM | NN | |||||
|---|---|---|---|---|---|---|---|---|---|---|---|
| [%] | [%] | [%] | [%] | [%] | |||||||
| db2 | 1a | 83.3 | 0.183 | 86.7 | 0.217 | 83.3 | 0.175 | 82.5 | 0.242 | 85.0 | 0.175 |
| 1b | 80.8 | 0.325 | 77.5 | 0.325 | 73.3 | 0.292 | 78.3 | 0.283 | 77.5 | 0.242 | |
| 2a | 85.8 | 0.258 | 84.2 | 0.225 | 82.5 | 0.183 | 85.8 | 0.183 | 86.7 | 0.175 | |
| 2b | 86.7 | 0.267 | 81.7 | 0.258 | 79.2 | 0.242 | 81.7 | 0.242 | 82.5 | 0.175 | |
| 3a | 76.7 | 0.475 | 72.5 | 0.433 | 65.0 | 0.383 | 70.0 | 0.392 | 72.5 | 0.308 | |
| 3b | 75.0 | 0.600 | 60.8 | 0.533 | 52.5 | 0.550 | 66.7 | 0.558 | 69.2 | 0.367 | |
| Mean: | 81.4 | 0.351 | 77.2 | 0.332 | 72.6 | 0.304 | 77.5 | 0.317 | 78.9 | 0.240 | |
| Haar | 1a | 99.2 | 0.042 | 97.5 | 0.042 | 95.8 | 0.042 | 97.5 | 0.050 | 99.2 | 0.025 |
| 1b | 90.8 | 0.150 | 88.3 | 0.167 | 82.5 | 0.192 | 88.3 | 0.167 | 96.7 | 0.058 | |
| 2a | 93.3 | 0.133 | 90.8 | 0.100 | 90.8 | 0.108 | 92.5 | 0.133 | 95.0 | 0.025 | |
| 2b | 82.5 | 0.367 | 75.8 | 0.300 | 76.7 | 0.242 | 75.0 | 0.283 | 80.8 | 0.200 | |
| 3a | 75.8 | 0.592 | 68.3 | 0.525 | 62.5 | 0.425 | 65.8 | 0.408 | 72.5 | 0.350 | |
| 3b | 73.0 | 0.495 | 72.5 | 0.470 | 67.5 | 0.330 | 70.5 | 0.333 | 71.5 | 0.320 | |
| Mean: | 85.8 | 0.297 | 82.2 | 0.267 | 79.3 | 0.223 | 82.2 | 0.229 | 86.1 | 0.163 | |
Table 3.
and errors to evaluate experiments under different loads and using different methods: k-NN, Bayesian, support vector machine, and neural networks, using features evaluated by Haar wavelet functions and different number of features.
Table 3.
and errors to evaluate experiments under different loads and using different methods: k-NN, Bayesian, support vector machine, and neural networks, using features evaluated by Haar wavelet functions and different number of features.
| Number of Features | Load | 3-NN | 5-NN | Bayes | SVM | NN | |||||
|---|---|---|---|---|---|---|---|---|---|---|---|
| [%] | [%] | [%] | [%] | [%] | |||||||
| 1 | 95.5 | 0.096 | 92.9 | 0.105 | 89.2 | 0.117 | 92.9 | 0.109 | 97.9 | 0.042 | |
| 2 | 87.9 | 0.25 | 83.3 | 0.200 | 83.8 | 0.175 | 83.9 | 0.208 | 87.9 | 0.112 | |
| 3 | 74.4 | 0.54 | 70.4 | 0.498 | 65.0 | 0.378 | 68.2 | 0.371 | 72.0 | 0.335 | |
| Mean: | 85.8 | 0.297 | 82.2 | 0.267 | 79.3 | 0.223 | 82.2 | 0.229 | 86.1 | 0.163 | |
| 1 | 94.6 | 0.100 | 92.1 | 0.104 | 94.6 | 0.071 | 97.5 | 0.117 | 98.4 | 0.002 | |
| 2 | 90.1 | 0.188 | 85.4 | 0.221 | 88.8 | 0.137 | 90.8 | 0.283 | 92.9 | 0.088 | |
| 3 | 80.0 | 0.404 | 76.3 | 0.383 | 71.7 | 0.304 | 84.2 | 0.317 | 81.7 | 0.183 | |
| Mean: | 88.2 | 0.231 | 84.6 | 0.236 | 85.0 | 0.171 | 90.8 | 0.239 | 91.0 | 0.091 | |
© 2019 by the authors. Licensee MDPI, Basel, Switzerland. This article is an open access article distributed under the terms and conditions of the Creative Commons Attribution (CC BY) license (http://creativecommons.org/licenses/by/4.0/).
Share and Cite
MDPI and ACS Style
Procházka, A.; Vyšata, O.; Charvátová, H.; Vališ, M. Motion Symmetry Evaluation Using Accelerometers and Energy Distribution. Symmetry 2019, 11, 871. https://doi.org/10.3390/sym11070871
AMA Style
Procházka A, Vyšata O, Charvátová H, Vališ M. Motion Symmetry Evaluation Using Accelerometers and Energy Distribution. Symmetry. 2019; 11(7):871. https://doi.org/10.3390/sym11070871
Chicago/Turabian StyleProcházka, Aleš, Oldřich Vyšata, Hana Charvátová, and Martin Vališ. 2019. "Motion Symmetry Evaluation Using Accelerometers and Energy Distribution" Symmetry 11, no. 7: 871. https://doi.org/10.3390/sym11070871
Note that from the first issue of 2016, this journal uses article numbers instead of page numbers. See further details here.