1. Introduction
The building sector is responsible for 36% of CO
2 emissions and for around 40% of energy consumption in the European Union (EU) [
1]. Therefore, new buildings in the EU will have to be nearly zero-energy buildings as of 31 December 2020 [
2]. Logistics buildings will also have to ensure a very high-energy performance. The very low amount of energy still required should then be covered to a high extent via energy from renewable sources.
Logistics and building planners, architects, developers, investors, and operators are faced with the challenge of planning, designing, and implementing energy-efficient and ultra-low CO2 emitting concepts for their logistics buildings and the equipped material handling and storage technologies. This is so because building technology, such as heating or lighting systems, the building skin with windows and loading bays, as well as intra-logistics, such as material handling, storage, and flow technology, all have an impact on the total energy performance of logistics centers, accounting for energy-related CO2 emissions.
In order to achieve the highest energy efficiency, one should consider, in addition to the individual areas of intra-logistics, building technology, and building skin (and the particular equipment or processes therein), the total logistics center as one system. Only in this way can synergy effects be exploited and possible energy interrelations be considered. However, this important insight about energy interactions is missing. The impact of building and intra-logistics design options on total energy demand when assessing alternative options during the design phase of new logistics centers must be considered.
This is because, on the one hand, in the field of logistics, current research activities focus on decarbonizing supply chains through increasing efficiency without considering logistics centers as important nodes of the network, as explained by Dhooma and Baker [
3], Marchet
et al. [
4], and Fichtinger
et al. [
5] too. In particular, logistics research has concentrated on improving transport with new approaches for traffic shifting, avoiding transport, or by employing alternative drives for transport vehicles as described by Thomson [
6]. Regarding the concentrated research on transport, other aspects focus on evaluating the willingness to pay for reducing the environmental impacts of road transportation as investigated by Lera-López
et al. [
7] or for green transport and distribution like Schniederjans
et al. [
8] explored in their study. Additional work focuses on new methodological approaches for evaluating the performance of green supply chains and transport, like the green transport balanced scorecard model developed by Stas
et al. [
9] or for evaluating supply chain strategies and their effects on business such as the relationship between the adoption of green supply chain management practices and competitive advantage which Hazen
et al. investigated in the case of green reverse logistics [
10]. Warehousing operations and logistics centers have received little attention as a part of the supply chain. Nevertheless, they waste energy, cause carbon emissions and environment pollution, and contribute to soil sealing due to their high space consumption.
On the other hand, in the building sector, most of the research has focused on assessing the energy and sustainability performance of residential and office buildings. Very little research exists on industrial buildings, especially logistics centers. Rai
et al. [
11] state this fact in their study, in which they illustrate the relative importance of operational and embodied energy in a flexible use light distribution warehouse by analyzing the effects of material substitution in building skins on operational and embodied CO
2 emissions. Besides different types of insulation and material for the skin, Cook
et al. [
12] also examine the effect of material substitution and design options for windows, window glazing, and lighting on the energy balance of a retail warehouse building. In these cases, the impact on the total energy demand and CO
2 emissions of intra-logistics and the material handling installed in the building was not investigated. Pudleiner and Colton [
13] assess the relative importance of building controls and architectural design parameters on building energy demand of a primary vaccine warehouse to evaluate the necessity of an integrated design method to reduce building energy consumption. In their study, Pudleiner and Colton include electric forklift trucks as a source of plug load in their model. However, they did not investigate the impact of different intra-logistics equipment or the effect of a higher degree of intra-logistics automation on total energy demand.
In general, there is limited research available which evaluates the energy performance of logistics centers considering intra-logistics in conjunction with the building. One work by Fichtinger
et al. [
5] documents an integrated simulation model to assess environmental impacts of inventory and warehouse management on warehouse-related greenhouse gas emissions. Fichtinger
et al. differentiate between energy factors related to storage space or building characteristics and energy factors related to storage and retrieval operations and determine total energy demand using energy parameters. These energy parameters are taken from literature and product brochures from storage equipment companies. The findings show that the storage equipment has, among other things, an impact on costs and emissions. Though Fichtinger
et al. mention the effects of different factors like climatic conditions at the site or the degree of automation of material handling, they did not investigate the effects of these factors and the impact of further options for intra-logistics equipment, building construction, and technology. With a similar but less sophisticated approach, Arikan
et al. determined CO
2 emissions of logistics centers in the supply chain as well with energy parameters in their study [
14]. They use benchmark values with average energy consumption parameters of warehouses from the United Kingdom. The aim was to evaluate the impact of transportation lead-time variability on the economic and environmental performance of inventory systems. However, they only considered power and fossil-fuel consumption for lighting and heating. Further, Dhooma and Baker [
3] developed and applied a framework to identify significant energy conservation opportunities based on existing energy audit approaches. The aim of their work was to evaluate energy-saving measures for existing logistics centers. This framework is not appropriate to evaluate measures or design options in the planning phase of warehouses that have not yet been built because of the need to meter actual energy use. The only known research study considering the energy relationship between intra-logistics and building technology as well as the effects on total energy demand came from Meneghetti
et al. [
15]. They introduced an optimization model using constraint programming for the design of sustainable refrigerated automated storage and retrieval systems within food supply chains including energy requirements, both for refrigeration and system storage/retrieval operations. However, they only focused on a refrigerated automated storage and retrieval system. Other logistics center subsystems, such as goods receipt and issue area, as well as an energy examination of the subsystems, are not considered. These latter aspects certainly need to be explored. Therefore, the research question is: Which energy-efficient measures, respectively building and intra-logistics design options, are most suitable for a given type of logistics center, considering the logistical requirements of achieving nearly zero-energy and low-carbon warehousing?
To evaluate this, there is no holistic methodological approach to predict the total energy demand of different types of logistics centers as one system, which includes intra-logistics equipment and operations in conjunction with building technology, as well as the type of construction. However, all of these are needed to examine the impacts of design options on energy performance. The aforementioned studies use average energy parameters or simulation studies to determine energy demand in buildings or intra-logistics systems. Further published studies related to the energy demand of particular material handling, storage, and flow technology examine energy demand and the effects of different parameters on energy performance on the basis of real system measurements. However, the use of average energy parameters is problematic due to the uniqueness of logistics systems according to specific demands regarding the logistics performance and therefore the use of different intra-logistics and building equipment. Simulation studies and measurements of real systems provide more accurate results but are too complex and time-consuming. Hence, these approaches are not appropriate during the planning phase for evaluating energy demand and impact of design options on the total energy balance of future logistics center as well as for the purpose of this work. Therefore, an analytical calculation approach is considered to be appropriate for determining the energy demand of intra-logistics systems and the building in order to evaluate the total energy balance and the impact of design options, and to examine the energy interrelations between intra-logistics and the building. An analysis of published calculation approaches for analytically determining the energy demand of logistics centers shows that there are reliable methods within the areas of intra-logistics and building, but only for individual plants. Detected existing calculation approaches for intra-logistics which are not based on numerical integration or metrological investigation are offered by Habenicht
et al. [
16], Lottersberger
et al. [
17], Tappia
et al. [
18], Lerher
et al. [
19,
20], and Zajac [
21], focusing on conveying and storage equipment. A prerequisite for these approaches, which complicates their adoption, are known technical parameters and logistics requirements like throughput. Within the building sector, methodologies for calculating the energy demand of buildings are well developed and used [
22]. In Germany, established rules to calculate buildings’ energy demands for such purposes as heating, cooling, ventilation, domestic hot water, and lighting exist with the pre-standards of series DIN V 18599, Part 1 through Part 10 [
23]. Part 10 of these standards defines boundary conditions for the monthly energy demand calculation of warehouses according to the so-called reference building method. However, these do not take intra-logistics operations within the building and therefore heat losses of intra-logistics equipment into account as heat sources.
The first aim of this paper is to introduce a developed holistic framework for predicting the total energy demand of logistics centers. This is a necessary prerequisite for the second and main aim of this research work. It sets forth an integrated approach that overcomes the shortcomings of the existing approaches and provides a knowledge base for planners and managers to aid in the selection of different intra-logistics and building options during the planning phase and thus to progress towards energy-efficient and low-carbon logistics centers.
The remaining parts of this paper are organized as follows:
Section 2 proposes a methodological framework designed for the examination. It contains the analysis of the system logistics center and its energy interrelations, the development of a calculation model for determining the energy demand, and the design of reference building models for the examinations. Further on, the energy balancing for the created reference building models is performed, and the approach of the parameters studies described.
Section 3.1 contains the results of the conducted parameter studies for evaluating the impacts of design options on the operational energy demand and total CO
2 emissions to deduce useful design options for reducing the energy demand and related CO
2 emissions.
Section 3.2 presents the results from the application of the useful design options in combination with the reference building models, and the total energy- and CO
2 emission-saving potentials. The paper concludes with a discussion of the achieved results in
Section 4.
2. Framework and Input for Determining and Analyzing the Energy Demand of Logistics Centers
2.1. Methodological Outline
The overall system logistics center was investigated with a systemic approach to answer the above-mentioned questions.
Figure 1 shows the methodological framework used for the research work that was implemented in this paper.
Systems analysis and mathematical modeling, described in
Section 2.2 and
Section 2.3, were conducted in accordance with the general approaches by Schmidt [
24] and Bossel [
25] to analyze different systems and design appropriate models for the examination of a system’s behavior, carrying out a literature analysis and field studies. Within the scope of the field studies, eight different existing logistics centers were surveyed, and 26 operators were questioned about their current building technologies and intra-logistics equipment, building construction, and operational requirements. The approach and results of these investigations are documented in [
26]. Boundaries were determined on the basis of the outcomes of these studies. System-related factors and their specific attributes were identified and described by means of abstraction and idealization in accordance with the functions required to provide a logistical performance. A system structure was defined which describes the functional connection between the system elements, the influence on the system from the environment, and therefore the effects of the system’s behavior qualitatively within an abstract model that is representative of different types of logistics centers. Based on the abstract model, a formal analytical integrated model was created using mathematical formalization for calculating and predicting the energy demand of different types of logistics centers. Therefore, a component model for intra-logistics was created and linked to the energy calculation model for the building. The system’s behavior prediction and, as a consequence, the examination of energy interrelations and impacts of design options on the total energy demand of different types of logistics centers were investigated using parameter studies described in
Section 2.6. For this, reference building models, which represent characteristic types of logistics centers, were designed and are described in
Section 2.4. Their specific boundary conditions and input values for the parameters were initially set as base cases on the basis of the outcomes of the field studies to represent common building practices and calculate total energy demand for the examination of impacts. Energy demand and distribution within the reference building models for the base cases is conducted in
Section 2.5, using the developed formal analytical integrated model to calculate the energy demand of intra-logistics and the energy demand of the building based on DIN V 18599 [
23] with the aid of the ZUB Helena 2012 Ultra v6.27 [
27] software. Description and analysis of the achieved results regarding the main impacts of design options on the determined energy demand and the interrelation and impacts of design options in combination are performed in
Section 3.
2.2. Systems Analysis
The system logistics center is regarded as a technical object system according to Ropohl [
28]. Hereafter, the purpose defines the system boundaries, the hierarchical level for the examination of the system and the level of modeling. For this research, the purpose is to examine logistics centers as one system comprising the areas of intra-logistics, building technology, and skin to identify the energy interrelations inside and among these areas and to investigate the impact of building and intra-logistics design options such as different material handling or heating systems and insulation on the total operational energy balance for varying types of logistics centers. The insights gained through this research should provide guidelines for planning and designing energy-efficient and low-carbon emissions logistics centers. The location of the site and the buildings skin are set as the boundaries for the system logistics center examined in this work. It does not include site selection, embodied energy, or the ratio of embodied and operational energy of different design options. The environment on the site of the logistics center is set as the hierarchical super-system. The area’s building technology, building skin, and intra-logistics are treated as sub-systems. Modeling is done at the plant or machine level. The goal is to investigate energy of various types, describing the state of the system as a physical quantity and, in the mechanical sense, the ability to execute work. Energy, matter, and information are determined as input quantities. Energy is converted into the output quantities of mechanical work, light, or heat with specific losses as energy that is no longer useful through the transformation by the system elements of the sub-systems. This energy use of the system elements serves to generate logistics performance altering matter in the form of goods with regard to type, quantity, and quality through processes by aid of information within a specific period of time. In these processes, system elements are differentiated into process-oriented and process-independent elements. Elements of the sub-system intra-logistics are process-oriented due to the dependence of their energy use on logistics performance provided from the logistics systems. Process-independent elements include the sub-systems, building technology, and building skin. Energy use of these elements is not linked to the logistics performance and the throughput of goods. The system logistics center interacts with the environment via the building skin. In addition to supply chains for electricity and natural gas or district heat, heat energy is exchanged through radiation or transmission on the surface of the building skin. Matter is interchanged through loading gates. Thermal, mechanical, and chemical energy stored in received or issued goods or in packaging or loading tackle is not accounted for in the energy balance. This idealized consideration decreases the complexity of the system and enables the development of manageable models, as each good possesses different storage capabilities due to its particular material composition and mass. Otherwise, too many variables need to be considered in the model, especially those without a specific application. Subject under examination is the operational energy demand of the system logistics center and the energy distribution within the system including all relevant energy flows. Energy balancing is made for one year on a monthly basis for the building and on an hourly basis for the intra-logistics according to the provided logistics performance, conditions of use, and climatic conditions at the site. Energy demand for air compression and information technology as well as domestic hot water are excluded. Office and social area energy demands are also not considered since these areas normally claim only five to ten percent of the total floor space of logistics centers and are not relevant in the examination of the energy interrelations between intra-logistics and the building.
After setting the boundaries for the system logistics center, system relevant elements are identified, and their crucial attributes described for energy determination. Different types of logistics centers are investigated by combining the system-related factors for modeling purposes. These elements are deduced and described with a top-down approach in accordance with the outcomes of the literature analysis and the conducted field research of surveying 34 real logistics centers.
Figure 2 shows the identified base elements of the sub-systems intra-logistics, building technology, and building skin classified in accordance with their function to fulfill within a logistics center.
Besides the identification and classification of the systems base elements, their attributes concerning relevant characteristics to determine the condition of the base elements for energy calculation also have to be analyzed and described. Thereby, attributes are distinguished into specific parameters, like throughput or dimensions of the building, technical parameters, such as degree of efficiency or conveying length, and boundary parameters, which apply to all of the elements, e.g. operating hours.
Bringing together the system boundaries, the identified base elements and their attributes, the systems structure can be modeled to create an abstract model that qualitatively outlines system behavior. The system’s structure is shown as an abstract model in
Figure 3. This includes qualitatively investigated impacts and energy interrelations between the sub-systems and the base elements (w), behavioral impacts of base elements due to their parameters (v), and impacts from the environment (u) on the energy demand of the sub-systems. Thus, the state (Z) of the base elements and therefore the energy demand of the sub-system is dependent upon these impacts. The base elements of the building skin sub-system have a passive role because they affect the energy demand of the building indirectly without active consuming energy for their fulfillment of performance. This developed abstract model, containing the identified base elements and the examined system structure, describes the behavior of the real system logistics center qualitatively and serves as an adequate basis for the following mathematical modeling for energy examinations of the system.
2.3. Mathematical Modeling
The abstract model is transferred into a formal analytical integrated model by deriving simple calculation methods for calculating the energy demand of different types of logistics centers. The purpose of the formal analytical integrated model is the determination of the logistics center energy balance in order to quantify the influence of the identified impacts on the energy demand by varying parameters with alternative design options for the base elements. As shown in Equation (1), the total operation energy balance for logistics centers
results from the sum of process-oriented energy demand of the sub-system intra-logistics
and the sum of the process-independent energy demand of the sub-system building technology
:
Using this, logistics requirements determine material flow layout and the kind of material handling equipment used as well as the degree of automation. Therefore, the energy demand of the intra-logistics sub-system notably depends on the logistics performance required, such as throughput of goods within the system. Furthermore, the kind of goods handled determines requirements regarding space conditions, in particular the indoor temperature and humidity. Staff and workstation demands determine additional requirements. The sub-system intra-logistics has an influence on space conditioning and therefore a direct impact on sub-system building technology related to material handling and storage technology operations and employees involved, which are considered as internal heat sources (technological and physiological loads as a process-oriented heat source). Further, sub-system building technology energy demands are reliant on the design of the sub-system building skin and the characteristics of the base elements, which are not active energy consumers. Energy demand of intra-logistics base elements and the share of their energy losses have to be defined first in order to calculate total energy balances. In consideration of these additional process-orientated internal loads, the energy demand of the sub-system building technology is calculated in conjunction with the sub-system building skin. The total energy balance is defined for each energy source in kWh for one year on hourly and monthly bases.
The energy demand of the sub-system intra-logistics
results from the sum of the energy demand
of each base element
k of the functional classes with
n base elements within the sub-system, shown in Equation (2):
For the base element industrial trucks of the class convey as well as for the base elements manual storage for stock management and person-to-goods picking as picking aids of the classes store and picking/sorting, the energy demand
for one type
i of the different kinds of industrial trucks is calculated with Equation (3):
where
is the average energy consumption per hour for performing the VDI cycle according to VDI 2198 [
29],
is the total number of industrial trucks of
i types within the system,
are the operating hours per year of the trucks, and
is the charging efficiency of industrial truck battery charging depending on the charger for the truck type
i by
m truck types.
The energy demand
for a kind
k of large load or small load conveyor of the class convey as well as for a kind
k of sorting systems from the class picking/sorting is calculated as per Habenicht
et al. [
16] with Equation (4):
where
is the energy demand from
m different cycle characteristics, and
are their frequencies of occurrence within a year. Therefore, the energy demand
for one cycle
i is determined by Equation (5):
where
is the duration of one cycle’s section,
a is the quantity of cycle’s sections, and
is the average power within the cycle’s section
j. One cycle is defined by a fixed number of conveyor units which are transported (block size or pile length).
The calculation in Equation (6) of energy demand
for handling equipment and palletizing robots of the type
k of the class handle is done through extrapolation and summation of the condition-oriented electrical power consumption
in the condition
i for the condition period
, where
n are the different conditions in which the base element
k dwells within a year
a:
The conditions
i for this calculation are divided into the shares of productive, waiting, idle, and stand-by time for handling per unit. If energy-relevant, the productive time can be additionally divided into the shares acceleration, constant movement, deceleration, lifting, and lowering according to the movement patterns of the automated handling equipment.
The energy demand of the base element automated high-bay warehouse and automatic small parts warehouse of the class store is calculated by multiplying the energy demand for one crane with the number of cranes within the automated warehouse. The energy demand of one crane for a year
is calculated with Equation (7) as per Ertl [
16,
30,
31]:
where
is the average cycle time of a single cycle,
is the time for single cycle operation (storage) in a year,
. is the average energy power consumption for a single cycle (storage),
is the time for single cycle operation (disbursement) in a year,
is the energy power consumption for a single cycle (disbursement),
is the average cycle time of a double cycle,
is the time for double cycle operation in a year,
is the average energy power consumption for a double cycle,
is the base-load power, and
is the corresponding idle time in a year.
For determination of the energy demand
of a packaging or load securing machine
k of the class packaging the energy needed per packed unit
is multiplied by the amount of packed units
within a year
a, as shown in Equation (8).
The basic load consumption
is added, which is multiplied by the corresponding time slice within a year
of the non-productive time of the packaging or load securing machine
k.The energy losses of the sub-system intra-logistics have to be quantified to use them as a heat source in the calculation of building energy demand. The intra-logistic sub-system
losses from overall energy demand
of the sub-system are determined using specific overall efficiency
of each base element
with Equation (9):
The sum of the energy losses of the intra-logistics sub-system can now be considered as heat sources within the building technology sub-system energy demand calculation for total energy balancing of different logistics centers.
This overall energy demand of the building technology
is the result of Equation (10):
This calculation of the sub-system building technology energy demand is made using the German pre-standard DIN V 18599 [
23] Parts 1–10 for each zone. This pre-standard includes all analytical calculation methods for the buildings’ energy demand. Calculations carried out with these pre-standards also follow an integral approach and enable a joint assessment of the building skin and the building technology. However, the process-oriented energy losses of installed equipment within a logistics center are not included in this pre-standard. Therefore, the calculation of the energy demand of the building technology is done according to DIN V 18599 with the determined energy losses as heat sources of the sub-system intra-logistics. The total energy demand and the energy balance of a logistics center results from the sum of the energy demand of the sub-system intra-logistics and the sum of the sub-system building technology, taking into consideration the building skin and the intra-logistics according to Equation (1).
2.4. Reference Building Modeling
Based on the identified system-relevant base elements, reference building models were built to investigate the energy interrelations between the sub-systems intra-logistics, building technology, and building skin using the developed analytical model. Therefore, according to an increasing degree of intra-logistics automation, logistics centers are classified into three types representing realistic base cases for different kinds of logistics facility usages. Hereafter, the modeling is described subsequently.
First, the reference building model “G1: manual warehouse,” with manually performed intra-logistics processes, was set up. Second, building on this model, the reference building models “G2: semi-automated logistics center” and “G3: fully automated distribution center” were established with a higher logistics performance and therefore increased automated processes, using more intra-logistics equipment each.
Table 1 shows the defined boundary conditions that apply for each of the three reference building models G1–G3 and arise from surveyed data from field research.
The size of the initial reference building model G1—100-m-long and 100-m-wide—builds on a previous study [
32] and is widely spread in related studies [
33,
34]. Hence, the developed reference building model G1 has a square ground plan and a height of 14 m.
Figure 4a shows the exterior view with the modeled 13 loading gates on the south side. The layout of G1 as shown by
Figure 4b encompasses one temperature zone: the main hall. It consists of the goods-receiving and -issuing area and the shelf warehouse with 18 racking aisles and 5 storage levels. Logistics performance amounts to 120 storage and retrieval operations per hour, performed with seven reach trucks. Further assumed specific parameters for G1 can be found in
Appendix A,
Table A1.
The exterior view of the second reference building model G2 can be found in
Figure 5a. It can be seen that the cubature of the east–west-oriented main hall is executed rectangularly. The 14-m height of the temperature zone main hall also exists in G2 due to the shelf warehouse within the order-picking area. The additional order-picking area, non-existent in G1, represents the extended logistics performance of G2 in comparison with G1. Sixteen loading gates and 2 gates on ground level are situated on the south side of the façade. On the north side, the automated high-rack warehouse (HRW) with a height of 32.5 m and width of 84.4 m is attached to the main hall and lengthens the west side of it. The layout and interior view of G2 can be found in
Figure 5b. The order-picking operations of 120 pallets per hour, basing on the person-to-goods principle, take place within the shelf warehouse with 11 rack aisles and by the aid of seven horizontal order pickers. Resupply and shelf warehouse operations are performed by seven reach trucks with 120 storages and 120 disbursements of pellets each hour. The main hall and automated high-rack warehouse are connected via large load conveyors. Further specific parameters of G2 are listed in
Appendix A,
Table A1.
The exterior view of G3 is shown in
Figure 6a, whereas
Figure 6b illustrates the interior and layout. Contrary to G1 and G2, the height of the main hall of G3 is only 7 m due to the displaced supply for order picking from a manual shelf warehouse to an automated small parts warehouse (ASPW). Therefore, the whole main hall is downsized and contains 16 loading gates on the south side. The automated high-rack warehouse and small parts warehouse are situated at the north façade of the main hall. The automated high-rack warehouse is identical to that in G2, solely the yearly throughput of the system was increased. Further specific parameters of G3 are listed in
Appendix A,
Table A1.
Besides the types of utilization of the logistics facilities represented by the three designed reference building models with an increasing degree of logistics performance and intra-logistics automation, the requirements of goods with regard to the space conditioning were examined. For that, three levels of temperature, which can be found in
Table 2, were determined.
For the first heated temperature level, an indoor temperature of 12 °C is assumed, as required by the pre-standard DIN V 18599. This temperature level applies to the main hall zone where people are working. Within the automated zones HRW and ASPW, a temperature level of at least 4 °C is assumed, as required by the frost protection of the sprinkler system. Because the visits of different logistics centers during the field studies revealed that some of the companies provide a higher temperature level for their employees, the second heated temperature level of 17 °C was additionally examined. To represent a chilled logistics center, a chilled temperature level of a maximum 6 °C indoor temperature for all zones with stored or handled goods is defined as the third. Each of the temperature levels can be combined with each reference building model for investigations. Therefore, with the defined temperature levels and the built reference building models G1 to G3, a wide spectrum of real logistics centers can be covered and investigated regarding their energy demand.
2.5. Operational Energy Calculation
The total operational energy demands of the built reference building models G1 to G3, each in combination with the set temperature levels, were calculated for the subsequent examinations of the impacts of design options on the energy demand with the created formal analytical integrated model in
Section 2.3. For that, the assumptions for the boundary conditions and specific parameters for the designed reference building models as base cases were made in
Section 2.4. The technical parameters for the specification of the modeled base elements, which are listed in
Appendix B,
Table B1,
Table B2 and
Table B3, were taken from the literature, supplier’s catalogues, and from the pre-standard DIN 18599 [
35].
For the calculation of the energy demand of the sub-system intra-logistics of the reference building models, a constant hourly logistics performance and throughput was assumed and projected for a year, according to the operating time. For each of the modeled base elements of the sub-system intra-logistics, the yearly energy demand was calculated with the developed integrated model and set values for the specific and technical parameters. Afterwards, the heat losses of the base elements were determined and summed for each temperature zone. These sums of the heat losses of the sub-system intra-logistics were then included as heat sources within the calculation of the energy demand of the sub-system building technology and building skin. Energy calculation for the building is then done according to DIN V 18599 with the aid of ZUB Helena 2012 Ultra v6.2 [
27] software. Depending on the temperature level of the reference building and the loading gate opening rates experienced in loading processes, different air flow rates were used to calculate infiltration heat losses. For the loading gates, it is estimated that, during a loading process, a gap of 5 cm occurs between the truck and the gate, resulting in air exchange.
Total energy demand was calculated for each built reference building model in combination with each determined temperature level using the described energy calculation approach. The resulting total energy balance and the energy distribution within the G1 system for the base case with the temperature level 17 °C is shown in
Figure 7, for G2 in
Figure 8, and for G3 in
Figure 9 in the form of a Sankey diagram. The illustration of the energy distribution for the temperature levels 12 °C and 6 °C for the base cases of G1 to G3 can be found in the Appendix of [
26].
In principle, the energy demand in G1 for space heating is the highest, followed by the low demand (in comparison with the energy demand for heating) for industrial truck battery charging and lighting. The energy demand of G2, compared to G1, and of G3, compared to G2, has risen due to increasing intra-logistics automation. The energy demand for heating has declined from G1 to G3 due to a decreasing volume to be conditioned.
CO
2 coefficients were applied to the calculated total energy demand for each utilized energy source to determine the amount of CO
2 emissions resulting from the energy use for operations. CO
2 coefficients were taken from the GEMIS database 4.1.3 (IINAS, Darmstadt, Germany) using the software ZUB Helena 2012 Ultra v6.2 [
27]. A CO
2 avoidance factor was applied [
36] for calculation of CO
2 credits gained from the electricity-producing photovoltaic system as a design option.
Table 3 lists the CO
2 coefficients applied for each energy source used.
2.6. Parameter Studies
After the executed systems analysis for describing the system logistics center and the development of a calculation model for determining the total energy demand, reference building models were created as a necessary prerequisite for the following investigation of the impacts of building and intra-logistics design options on the total operational energy demand and related CO
2 emissions. For this, parameter studies were performed to identify useful energy-efficient alternatives for reducing energy consumption and CO
2 emissions of the total system logistics center. Therefore, alternative design options for the identified base elements within built reference building models were investigated using an evaluation of available technologies and a literature review of possible organizational measures as control strategies for energy efficiency. The design options used for the base elements of the sub-systems, which were examined by parameter studies using the example of the reference building models, are shown in
Figure 10. Each of the design options was separately investigated by varying more than one technical parameter of the base case element within each reference building model in combination with each temperature level with the set boundary conditions and specific parameters of the models. In addition, a photovoltaic system for the use of further renewable energy sources was investigated for all reference build models. A total of 119 different design options were examined. For the parameter studies within the sub-system intra-logistics, it is assumed that the temperature level has no influence on the energy demand of the intra-logistics elements within the three reference building models. Furthermore, no influence of the intra-logistics design options on the energy demand of other intra-logistics base elements is estimated, so the energy demand calculation for each design option was done separately and compared to the set base case. This is different for the parameter studies within the sub-systems building technology and building skin. In these cases, the total energy demand of the building is calculated for each design option in consideration of the heat losses of the sub-system intra-logistics for each reference building model and temperature level to analyze the impacts.
Based on the findings of the parameter studies, which are described in
Section 3.1, useful design options for the modeled base elements were chosen for each reference building model to create optimized reference building models. The aim was to examine the interrelations and total energy and CO
2 emission conservation potential of combined design options. Because of the interactions between the base elements, the corresponding individual design options influence each other within the total system. Therefore, total energy and CO
2 conservation potential is lower in combination with the variety of the optimized elements compared to the sum of the single optimized element. Results of the examination of combined parameter studies are described in
Section 3.2.
2.7. Summary of Results
In
Section 2, the holistic framework for predicting and evaluating the total energy demand of logistics centers was developed because of the shortages of existing approaches to predict the total energy demand for different types of logistics centers as one system. This is a necessary prerequisite for the main aim of this work, which is to examine energy interrelation between the sub-systems building skin, building technology, and intra-logistics and, moreover, to evaluate the impacts of building and intra-logistics design options on the total operational energy demand and related CO
2 emissions for different types of logistics centers. For this, the developed framework contains a qualitative description of the system logistics center and its energy interrelations as well as a calculation model for determining the total energy demand of different logistics center systems. Based on the systems analysis, reference building models, which represent real-life construction practices, were created and introduced as input data for the following examination. Energy demand and distribution of these reference building models were then determined for nine base cases with the developed calculation model to evaluate the impact of replacing the base elements of the sub-systems with energy-efficient design options. Therefore, possible design options for the sub-systems intra-logistics, building technology and building skin were identified, and parameter studies with these alternatives were conducted. It is now possible to determine the energy demand and to evaluate the impacts of design options on energy demand and related CO
2 emissions to gain insights on the most effective levers for different kinds of logistics centers in order to design energy-efficient and CO
2-neutral systems using the framework and built reference building models.
3. Evaluating the Impacts of Design Options on the Energy Demand and Related CO2 Emissions
3.1. Design Options Main Impact Sensitivity
In the following, the results of the parameter studies are presented in the order of the sub-systems intra-logistics, building skin, and building technology and their functional classes according to
Figure 10. In the examples of the designed reference building models in
Section 2.4 and their determined total operational energy demand in
Section 2.5, the building and intra-logistics design options in
Section 2.6 for the base case elements were each examined regarding their impact on the total operational energy demand and the related CO
2 emissions of each reference building model. This identifies levers for the highest energy efficiency and lowest CO
2 emissions for different types of logistics centers to design and progress towards energy-efficient and CO
2-neutral systems.
3.1.1. Intra-Logistics
Design options for different types of industrial trucks and conveying systems were investigated within the class convey and picking/sorting. The share of the total energy demand for industrial trucks depends on the number of trucks within the system. For the reference building models examined, the impact of the design option of an energy-efficient battery-charging system for industrial trucks (for goods receiving, and transporting within the facility) amounts to less than 1% CO2 emission savings on the total CO2 emissions for G1 and less than 2% for G3. Nevertheless, by considering the energy demand for industrial trucks only, there is an energy-saving potential of up to 20% due to the design option of efficient battery charging. Additional costs for this alternative can be amortized over a few years. Regarding the large load chain and roller conveyor, an intermittent operating mode as a design option, instead of a continuous operation as in the base case model, accounts for a nearly 3% CO2 emission reduction from the total CO2 emissions of the reference building models G2 and G3. However, here too, regarding only the conveyor system, the impact on the energy demand is very high; energy saving potential for the chain and roller conveyor energy demand range between 70% and 85% for examined models G2 and G3, for example.
Furthermore, manual and automated storage systems for large and small load of the functional class store were investigated. Energy-efficient battery charging of the high-reach trucks for the manual storage system within the models G1 and G2 as well as energy recuperation for the miniload cranes of the HRW and ASPW within G2 and G3 were examined as design options. The impact on the total CO2 emissions of an efficient battery-charging system for the high-reach trucks is, as for the rest of the industrial trucks, low, with potential CO2 savings of around 3% for G1 and 2% for G2. Energy recovery units for the miniload cranes of the HRW have a high impact on total CO2 emissions for reference building models G2 and G3, as around 16% of the total CO2 emissions can be saved within both models with this design option. For G3, the impact of implementing this design option only to the ASPW accounts for 8% CO2 emission savings. In general, it is possible to reduce the energy demand of the miniload cranes by up to 35% with energy recovery units. Due to the high share of the energy demand of the HRW on the total energy demand of G2 and G3, the impact and saving potential is correspondingly high.
An energy-efficient operating mode as a design option for the de-palletizing robot modeled within the reference building model G3; thus, the impact on the total CO2 emissions of the system was analyzed. Because only one robot is integrated in the model, and due to the initial low share of the de-palletizing robot’s energy demand and related CO2 emissions in comparison with the other base elements, there is hardly any impact on total energy demand of the design option (energy-efficient operating mode) for the de-palletizing robot. However, looking only at the energy demand of the de-palletizing robot, 11% can be saved with a demand-oriented control by switching off the de-palletizing robot instead of going to stand-by.
In total, considering the energy demand of the sub-system intra-logistics, it is possible to reduce the energy-related CO2 emission per m3 space volume of this sub-system within a year through the application of all of the above-mentioned design options for the modeled reference buildings with a temperature of 17 °C by 37% for G1, 36% for G2, and 35% for G3. Nevertheless, in these cases, the CO2 emissions related to the sub-system building technology and building skin climb by 4% for G1, 11% for G2, and by 15% for G3 due to the reduced heat losses of the intra-logistics sub-system. However, in the same case, with temperatures of 6 °C, the building-related CO2 emissions per m3 within a year decrease for the same reason by 4% for G1, by 24% for G2, and by 30% for G3.
3.1.2. Building Skin
For the examination of the class insulation within the sub-system building skin, insulating properties of the exterior walls, roof, perimeter insulation, and loading gates were incrementally improved. Thereby, the U-value defines the heat conductivity of the components. A lower value means a better insulating property. With a very high insulation standard and a perimeter insulation CO2 emission savings of up to 14% of the total CO2 emissions of the reference building, G1 can be obtained for a temperature of 17 °C. However, the costs for the very high insulation standard are not economically viable in comparison with the energy cost savings. Therefore, a high insulation standard with 12% CO2 emission savings of the total operational CO2 emissions of G1 appears to be a useful design option. Additionally, for G2 and G3, only the main hall should be equipped with the high insulation standard for heating. In these cases, the impact of a better insulation compared against G1 drops to 4% for G2 and to slightly over 2% for G3. Again here, looking at the energy demand and the related CO2 emissions of the sub-systems building technology and building skin without the intra-logistics of G3, it means 10% CO2 savings of the building-related emissions with a high standard of insulation. The impact of better insulation standards for the chilled reference building models with high insulation for the main hall, HRW, and ASPW, on the total CO2 emissions, is lower than for the heated cases. This is due to the fact that an average external air temperature of 8.6 °C according to the test reference year was assumed for the examinations, so that a temperature reduction to 6 °C entails less energy expenditure than an increase to 17 °C.
Only one design option for the class cubature was examined. A longish layout was investigated for the reference building model G1, where the space volume of the warehouse remains the same but the heat transferring surface grows by 80%. The smaller this ratio is, the lower the specific energy demand per m3 of heated space under equal conditions. In the case of G1 at 17 °C, enlargement of the surface results in substantially higher transmission heat losses, for which solar radiation yields over the opaque surface cannot compensate. This leads to an increase of total CO2 emissions of 20%. In the case of the chilled model G1, the design option of a longish layout of the building results in increased CO2 emissions by 46%. These useful design options for the cubature of logistics centers are compact layouts.
Since the base cases of the reference building models contain no façade windows, design options with a different number and size of windows and insulation standard for glazing were investigated in combination. All windows are equipped with an automated shading device. The results show that the impact on energy demand and CO2 emissions of façade windows within the example of G1 at a temperature of 17 °C is very low. This is so because the electricity demand for artificial lighting cannot be reduced significantly due to the large depth of the building and the fact that no more natural light can enter into the space. Additionally, heat losses through windows are higher than through walls because of their higher U-value. Therefore, the design options of façade windows can only lower the total CO2 emissions in the heated cases of G1 by no more than 5%. For the chilled case of G1, there are even increased energy demands for all examined combinations of the design option façade windows. The impact of different design options for façade windows on the total CO2 emissions of G2 amounts to 2% and of G3 to less than 1%. Therefore, façade windows have hardly any impact on the energy demand and CO2 emissions of the examined reference building models. However, one should not neglect the great importance and effect that façade windows have on the comfort of the building users due to the daylight exposure and a visual outdoor connection they afford. In summary, windows on the southern façade have the most influence in combination with a high glazing insulation standard of the design options for façade windows. North-, west- or east-oriented windows have hardly any influence on energy demand. Only very high insulation of the windows for all heated reference buildings can deliver low CO2 emissions. Façade windows in various designs for all chilled reference buildings are not worthwhile in regard to CO2 savings.
Besides windows in the façade, natural light can be brought into the building with skylights. To additionally ensure good air quality for the building’s users, a 2% proportion of window area to the floor area can be used as orientation for skylights, as is assumed for the base case reference building models. While the number of skylights remains the same, the size of the skylights and the glazing properties differ from the investigated design options. The results of the parameter studies show that, for G1, the total CO2 emissions even increase with an expansion of the skylights when the glazing insulation standard remains the same as that for the base cases. However, an expansion of the skylights in combination with a very high insulation standard leads to CO2 emission savings of 3% of the total CO2 due to fewer heat losses over a larger window area. The same holds true for the chilled cases of G1, so that less solar radiation enters the building when reducing the SHGC-value when applying a very high glazing standard; therefore, CO2 savings of 2.5% can be achieved. However, here too, CO2 emissions rise with the base case when enlarging the size of the skylights. The impact of design options on the total CO2 emissions of G2 and G3 remains similar to G1. Because of the smaller proportion of the energy demand of the building on the total energy demand, the increases in related CO2 emission savings are smaller for G2 too and non-existent for G3. Therefore, due to the high costs for the very high glazing standard and the fact that there are no electricity savings for lighting, as in the cases of the façade windows, the examined design options for skylights are not useful regarding the CO2 emissions of the reference building models.
Instead of curtains, sluices were examined as a design option for the loading bays. With this construction, continuous insulation of the façade without thermal bridges can be achieved in addition to lower air exchanges. This results in CO2 emission savings, for the 17 °C-heated G1 model, of 13% and, for the chilled G1 model, only 7%. Due to the smaller conditioned space volume in the G2 and G3 reference building models, the heat energy and the related CO2 emission saving potential of the design option of sluices for the loading bays is appropriately smaller for this type of logistics center. It accounts for 6% of CO2 emission savings for G2 (17 °C) and for 3% for G3 (17 °C). Nevertheless, this design option is still a useful measure for reducing CO2 emissions of G2 and G3; by looking only at the CO2 emissions of the sub-systems building technology and building skin, 17% savings in CO2 emissions can be achieved within G3.
3.1.3. Building Technology
Lighting systems for all reference building models is assumed to be automatically controlled in accordance with available daylight. An investigated design option for the lighting system is a motion control system with presence sensors. This design option was examined only for the G1 shelf warehouse, as 100% occupancy by employees is adopted for goods-issuing and -receiving areas of all reference building models and for G2 and G3, as well for the picking zones. Assuming a class-based storage policy, the storage area of the shelf warehouse was divided into three zones according to the turnover of the goods and therefore their access frequency. For the first third of the rack aisles, enclosed to the goods-issuing and receiving area, , 50% presence is supposed, 35% presence for the second third, and 5% presence for the rest. This application of a motion control within G1, a temperature of 17 °C, leads to a slight increase in heat energy demand according to lower heat losses of the lighting. However, total CO2 emissions can be reduced by around 6% due to a lower lighting electricity demand. Within the chilled reference building model G1, the impact is reversed and therefore even higher due to fewer heat losses and a lower electricity demand, resulting in a total reduction of the CO2 emissions by 13%.
A mechanical ventilation system and a mechanical ventilation system with heat recovery were examined as design options for the G1-heated reference building models. The results show an increase of the total CO2 emissions of nearly 10% because of the higher electricity demand for the ventilation. Adding heat recovery to the system does not reduce the total CO2 emissions, which still climb by 3% for this design option. Therefore, if the goods do not require a special space conditioning, natural ventilation should be maintained for all types of logistics facilities. If mechanical ventilation is required, heat recovery should be implemented.
Several design options are examined for the heating system, as mentioned in
Figure 10. For the G1 reference building model, all design options lead to significant reductions of total CO
2 emissions compared to the base cases. With a wood chip direct air heating system, it is possible to reduce total CO
2 emissions at a temperature of 17 °C by 50%, followed by a ground water heat pump with floor heating, which reduces CO
2 emissions by 40%. However, the CO
2 emission conservation potential for the G2 and G3 reference building models by design options for the heating system is lower than that for G1 because of a higher share of energy demand for the sub-system intra-logistics on total energy demand, in addition to a lower energy demand of the building sub-systems, due to a smaller space volume for air conditioning. Nevertheless, it is still possible for the G2 reference building model (17 °C) to reduce total CO
2 emissions by almost 20%, and for G3 (17 °C) by 11% with an indirect air heating system with wood chips.
Regarding the chilling system, it is possible to reduce total CO2 emissions of the G1 reference building model by 9% with the design option split system in comparison with the base case chilling system using compression refrigeration with fan-coils. With a variable refrigerant flow system (VRF-system) the total CO2 emission savings rise to 19% of total CO2 emissions, due to lower auxiliary energy demand for pump performance and no energy distribution losses in comparison with the base case with a central cold generation. The same impacts of the design options for the chilling systems occur in the G2 and G3 reference building models. However, CO2 emission saving potential is again lower due to a lower share of the energy demand for the building on the total energy demand. A VRF-system leads to CO2 emissions reductions of around 11% within G2 and 9% within G3.
To further reduce CO2 emissions of the reference building models, a photovoltaic system (PV system) was investigated as a design option. For G1 (17 °C), it is possible to compensate 41% of the total CO2 emissions with a photovoltaic system installed on the roof. For G2 and G3, the façade of the HRW and ASPW is used alongside the roofs for an installation of a PV system. With these design options, it is possible to compensate 39% of CO2 emissions of G2 and 34% of G3. Although more than double the surface of G2 and G3 is installed with PV systems in comparison with G1, total CO2 compensation potential is lower for these reference building models. This is attributable to the described higher degree of intra-logistics automation and therefore to an increased energy demand of intra-logistics, resulting in total higher CO2 emissions of G2 and G3.
3.2. Interrelations and Impact of Combined Design Options
To gain more insight into energy interrelations between combined design options and to examine how much energy efficiency can be achieved for different types of logistics centers, optimized models were created using the design options that have been discovered to be useful within the parameter studies. Every modeled base element for each reference building model was replaced by a useful design option to create optimized reference building models and then to examine the energy interrelations and the total energy and CO2 emission conservation potential. The results of this investigation provide a knowledge base for planners and managers to aid in the selection of different intra-logistics and building options during planning and are described in the following sections.
3.2.1. Optimized Manual Warehouse Model
For the G1-optimized reference building model, the squared shape of the base case is maintained for all temperature levels, but a higher insulation is applied to the building façade in accordance with the results of parameter studies. Sluices are additionally attached to the loading gates, as opposed to only curtains as a dock shelter of the base case models. The form and glazing of the skylights of the base cases is maintained within the optimized models for the heated temperature levels; a higher insulation standard is applied to the skylights of the optimized chilled model. Façade windows are not implemented. The heating system substitutes circulating air heating with natural gas through a ground water heat pump with floor heating. The chilling system, at a temperature of 6 °C, of the base case model is changed to a VFR-system. A mechanical ventilation system with heat recovery is not able to reduce CO
2 emissions due to a higher electrical consumption. Therefore, the optimized models remain naturally ventilated. The situation is different with the lighting, as in this case the lighting is added with motion controls since it lowers power consumption with little investment. Within the sub-system intra-logistics, battery-charging systems for the industrial trucks with a higher efficiency factor are implemented. A photovoltaic system is implemented on the roof of the optimized model to cover the remaining electricity demand. The useful design options and their technical parameters chosen for the G1-optimized models are summarized in
Appendix B,
Table B1.
Figure 11 illustrates the resulting energy distribution of all energy sources used within the G1-optimized model for the 17 °C temperature level due to the replaced base elements with energy-efficient design options. The illustrations of the energy distribution for the temperature levels 12 °C and 6 °C within the G1-optimized models are included in [
26]. In
Figure 11, it can be seen that the energy-G1-optimized model uses renewable energy source ground water for thermal energy storage instead of non-renewable energy natural gas. Electricity produced by the installed photovoltaic system can only be partially used; hence, the rest of it must be fed into the grid (or power reserve). Therefore, a part of the electricity needs must still be obtained from an energy provider to cover total energy demand. However, the part fed into the grid is greater than the obtained one. Basically, it is possible to reduce the electricity and heat energy demand considerably as compared to the base case model G1 by combining optimized design options for the base elements. As a result of this, it is possible, for this type of manual warehouse, to create not only a CO
2-neutral and net-zero-energy logistics center but also a plus-energy logistics center.
The relative impact of the design options chosen for the base elements on the overall CO
2 emissions of the base case reference building model G1 is shown in
Figure 12 for each temperature level. Based on the overall energy-related CO
2 emissions in kg per m
3 within a year of the reference base case (left bar), the influence of individual base elements replaced by energy-efficient design options and the impact of the combination of all optimized elements within a model are shown to the right. The results indicate, for all three temperature levels, a positive effect on CO
2 emissions when better insulation for the façade is used. A modification of the heating system or rather chilling system shows the highest CO
2 conservation potential. However, these design options should always be implemented together. An optimization of all elements of the sub-system intra-logistics also leads to a reduction of the overall CO
2 emissions, even though it results in increasing CO
2 emissions of the building technology for the heated models because of fewer heat losses of the intra-logistics equipment and therefore a higher heat energy demand. The yield of the photovoltaic system saves around 2 kg of CO
2/m
3a and compensates the emitted CO
2 emissions for all temperature levels of the optimized building model G1.
3.2.2. Optimized Semi-Automated Logistics Center
In general, the design options chosen for G2 are equal to those of G1. However, these optimized models do not contain a motion control for the lighting due to continuous occupancy within the racking aisles in the shelf warehouse of the main hall. Furthermore, the automated high-rack warehouse of the heated versions is equipped with the same façade as in the base case-heated models, as only frost protection is needed. Besides the installation of a photovoltaic system on the roof of the main hall, the G2-optimized models have an additional photovoltaic system on the roof and the façade of its high-rack warehouse. Nevertheless, the electricity produced is still not enough to cover only the electricity demand of the intra-logistics sub-system. Therefore, the electrically driven heat pumps in the G1-optimized heating systems are replaced with the design option of circulating air heating with wood pallets as an energy source. Considering the intra-logistics, further types of industrial trucks of the optimized models are charged as well with efficient battery-charging systems. Furthermore, it is assumed that, in comparison with base case G2 models, all industrial trucks operate more efficiently within optimized models. The large load chain and roller conveyor with a continuous operation mode are replaced by conveyors with an intermittent operation mode in the optimized models. The miniload cranes in the automated high-rack warehouse are now equipped with energy recovery units. Technical parameters for the design options of the optimized models G2 are listed in
Appendix B,
Table B2.
Figure 13 reveals modified energy distribution within the G2-optimized system for a temperature of 17 °C. Illustrations of energy distribution for temperatures of 12 °C and 6 °C within the G2-optimized models are included in [
26]. With the higher automation of the intra-logistics due to the raised logistics performance, the electricity demand of G2 increases in comparison with G1. Most of the electricity is needed for operating and, in the chilled case, for conditioning the automated high-rack warehouse. The chilling system uses more energy to generate higher amounts of process cooling required for the main hall and the high-rack warehouse. Therefore, it is not possible to create a CO
2-neutral and net-zero-energy logistics center, not only for the chilled but also for the heated base cases of G2.
Nevertheless, there is a very high potential for energy and CO
2 conservation. The combination of design options to G2-optimized models show that high energy reductions can be achieved, especially within the sub-system intra-logistics. Natural gas, a non-renewable energy source for heat energy, can easily be replaced by renewable energy sources. This impact of a changed heating system on total CO
2 emissions of the base case model per m
3 within a year for an indoor temperature of 17 °C is illustrated in
Figure 14. CO
2 emissions of the base case G2 model are shown in the first bar for 17 °C, 12 °C, and 6 °C. Further,
Figure 14 also shows that the energy demand and therefore the related CO
2 emissions of the intra-logistics are considerably higher than the CO
2 emissions caused by the sub-system building technology per m
3 in comparison with G1. However, the heating system still holds high potential to reduce energy-related CO
2 emissions. The biggest lever to reduce CO
2 emissions is the sum of the design options for intra-logistics, even though a higher energy demand for heating of the building occurs due to lower heat losses in intra-logistics. This effect is contrary to the chilled temperature level. The design options for intra-logistics become the most important measures for reducing CO
2 emissions due to their high energy demand. Another reason for this is the fact that electricity has a higher CO
2 coefficient (see
Table 3) than other energy sources. Therefore, CO
2 savings are higher when reducing electricity demand than when reducing the same amount of energy demand from other energy sources.
3.2.3. Optimized Fully Automated Distribution Center
The modeled energy-efficient design options for the base elements of the G3-optimized models resemble the design options of G2. Changes were solely made within the sub-system intra-logistics. One of it is for the loading and unloading of the freight vehicles, now with lithium–iron–phosphate batteries for the pedestrian-controlled trucks instead of lead-gel batteries. Further, the additional miniload cranes of the ASPW are equipped with energy recovery units like the miniload cranes within the HRW. As for the large load conveyor and for the de-palletizing robot, an energy-efficient operating mode was chosen for the G3-optimized models. An automated hood stretching system and the small load conveyor were not varied due to missing energy parameter for the design options to calculate. Therefore, the base cases for these system elements were considered within the optimized model and energy calculation. Technical parameters for the G3-optimized models are stated in
Appendix B,
Table B3.
The altered energy demand and distribution for a temperature of 17 °C within the optimized model G3 is shown in
Figure 15, and energy distribution for the temperature levels 12 °C and 6 °C can be seen in [
26]. The used energy-efficient design options for G3 have a huge impact on the total operational energy demand of the system. Similar to G2, energy interrelations of the sub-system intra-logistics to the sub-system building technology are the same, and the heat energy demand can be fully replaced with renewable energy sources within optimized heated models. The electricity produced by the photovoltaic system on the roofs and the façade can almost entirely be used by the facility itself. However, even in combination with all useful design options for the base elements of the sub-systems intra-logistics, building technology, and building skin as well as the self-produced electricity, there is still a large proportion of electricity demand to cover and to obtain from the grid.
The relative impact of these design options for the base elements on the overall CO
2 emissions of the base case reference build model G3 is shown in
Figure 16 for each temperature level. The intra-logistics sub-system is, in comparison with the manual warehouse type, the largest source of CO
2 emissions. Due to the smaller room volume, heat energy demand for temperatures of 17 °C and 12 °C is very low in proportion to the electricity demand. The same applies to CO
2 emissions.
Energy demand and CO2 emissions for chilling are higher than those for heating because, at a temperature of 6 °C, all of the areas have to be chilled, not just the main hall. The heating system within the sub-systems building technology and building skin is, as with the G1 and G2 models, the most effective lever to reduce CO2 emissions. Total CO2 conservation potential for a temperature of 6°C is lower because the energy demand of the design option for the chilling system cannot be replaced by renewable energy resources; therefore, electricity is still needed and will cause higher emissions.
3.3. Summary of Findings
Energy interrelation between the building skin, building technology, and intra-logistics areas in logistics centers were investigated using design reference building models. Useful design options, resulting from performed parameter studies, were proposed in order to examine the impact of building and intra-logistics design options on the total operational energy demand and related CO2 emissions.
To examine whether it is possible to create CO2-neutral logistics centers for low carbon warehousing, and how far energy efficiency can be achieved, the deduced useful design options for the base elements were applied for the reference building models to create optimized models. Interrelations and the impacts on total CO2 emissions and energy demand of useful design options in combination within the reference building models were investigated. Here, it became evident that it is possible to significantly lower the CO2 emissions of warehousing operations through a combination of energy-efficient design options for elements of the sub-systems intra-logistics, building technology, and building skin. However, there are clear differences between the different types of logistics centers regarding the greatest potential for energy and energy-related CO2 emission conservation.
Very little energy is used for material flow, handling, and storage equipment in the manual warehouse. In this case, the building has the highest impact on total energy demand and yields the highest potential for reducing CO2 emissions. Key measures of the building in this case are heating and cooling applications with renewable energy sources in connection with good insulation. For all three different temperature levels in the manual warehouse model, it is possible to reduce the energy demand through a combination of energy-efficient design options, provided that the photovoltaic system on the roof meets the remaining low-energy needs of the building and intra-logistics. A CO2-neutral logistics center is feasible in this case for these types of manual warehouses.
In the case of semi-automated logistics centers, energy demands and distribution change significantly. While, in the case of the manual warehouse with 17 °C required room temperature, the building technology is responsible for almost 80% of total CO2 emissions, the share declines to one-third in the semi-automated logistics center. Consequently, optimization of the intra-logistics sub-system is the best way to reduce electric energy demand and CO2 emissions. Nevertheless, there is still potential for optimization of the building technology and skin in this example of the semi-automated logistics centers, to further reduce the total energy demand. It is possible for the examined semi-automated logistics center model to avoid around 92% of total CO2 emissions in the base case reference scenario by implementing energy-efficient design options for the sub-systems intra-logistics, building technology, and building skin using an integrated photovoltaic system in the building.
In the fully automated distribution center, the share of energy demand of the intra-logistics equipment increases up to 85%. The building technology and the building skin have very little influence on total CO2 emissions compared to the electricity requiring material handling, storage, and flow technology. Therefore, the CO2 saving potential for the optimized fully automated distribution center ranges between 70% and 75% compared to the base case reference models of this type, depending on the required room temperature concerning heating or cooling.
4. Conclusions
The aim of this work is the evaluation of the energy interrelation between the areas of intra-logistics, building skin, and building technology within logistics centers and, further on, the examination of the impacts of intra-logistics and building design options on the total operational energy demand and related CO2 emissions for different types of logistics centers. The purpose is to gain insight as to the most effective levers for designing optimally energy-efficient and CO2-neutral logistics centers and to provide a model of a simplified methodology to account for operational energy use, integrating the intra-logistics and the building. This improves decision-making during the rough planning and designing of energy-efficient facilities.
Therefore, a holistic framework was developed, first, due to the existing lack of methodological approaches, to predict the total energy demand of different types of logistics centers as one system, taking the intra-logistics equipment and operations in conjunction with building technology into consideration as well as the type of construction. A systems analysis was performed to characterize different types of logistics centers and their energy interrelations in order to overcome the shortcomings of existing approaches. Afterwards, mathematical modeling was performed to deduce a formal analytical integrated model for determining the total energy demand of different types of logistics centers. Reference building models, representing different types of logistics centers of the real building practice, were designed according to the findings of the systems analysis to utilize this approach and to examine the energy interrelations and impacts on case examples.
The outcomes of these systems analyses and the deducted formal analytical integrated model provide an initial step towards understanding energy interrelations and to determine and evaluate energy use regarding these interrelations for different types of logistics centers. However, a drawback of the proposed framework is that a lot of input assumptions are needed for the calculation of total energy demand. These values, and especially the energy parameter for the intra-logistics elements, are often not known in the rough planning stage. Mainly condition-oriented energy consumption parameters for intra-logistics equipment are often nonexistent due to the individually required logistics performance and unique forms of material handling, storage, and flow systems, influencing the use of energy. In the meantime, current available parameters for energy consumption from research and suppliers, as assumed in this work, can be used to determine energy demand of logistics centers at the planning stage. The proposed framework and integrated model for energy calculation offer a simple methodology to determine the energy demand of logistics centers and make it possible to evaluate the impacts of design options to create energy-efficient and CO2-neutral systems.
Parameter studies were performed on the example of the built reference building models to facilitate this evaluation and selection of intra-logistics and building design options in the planning stage by providing insights with this work about the impacts of design options on the total energy demand of different types of logistics centers. Energy demand and distribution of the reference building models were determined with the proposed analytical integrated model. For the first time energy distribution within different types of logistics centers could be presented. The findings reveal the share of energy demand of intra-logistics and building technology facilities in the reference building models. These models reveal that the heating and chilling systems are critical components of the type of manual warehouses, accounting for a significant proportion to energy demand. With an increased logistics performance and a higher degree of intra-logistics automation that the shares shift, the energy demand for intra-logistics equipment become the most significant portion of total energy demand in reference building models of semi-automated logistics centers and fully automated distribution centers. In contrast to other commercial buildings, heating, ventilation and air conditioning (HVAC), and lighting do not always account for a significant portion of total energy use of logistics centers, as stated by Anand [
37] in the US and Dhooma and Baker [
3] in the UK, based on their own studies, and in accordance with [
38]. However, energy demand for intra-logistics depends on throughput and the number and size of intra-logistics equipment, and further operating conditions, the energy share, and demand for building technology depends on the geographic location due to the prevailing climatic conditions, the size and construction of the logistics building, and further operating conditions. Besides the age of the building and the facilities, these various parameters are the facts as to why comparing the energy demand of different types of logistics centers is not recommended. Here, it is important to classify and characterize the types, as done in this work with the systems analysis and the reference building models in combination with the temperature levels.
Therefore, the emphasis on examining the energy saving potential related to intra-logistics equipment should be focused on logistics centers with a medium to high degree of intra-logistics automation regarding the energy distribution of the reference building models. In logistics centers with less intra-logistics automation, building technology is the main energy consumer and should reveal the highest energy and CO2 conservation potential. Parameter studies on the example of the reference build models were performed to quantify all the potentials of energy and related CO2-emission savings for different types of logistics centers, and to answer the question about the impact on total energy demand from alternative intra-logistics and building design options. The results of these studies and of the examination of how much energy efficiency can be achieved through the combination of useful design options from the parameter studies provide a deeper understanding of energy interrelations within the system logistics center for decision-making during the planning of energy-efficient and CO2-neutral systems. However, the results provide only a guideline to considering and evaluating alternative design options because the findings cannot be generalized, since the base results used for the calculation of logistics performance depend upon specific boundary conditions and parameters. Therefore, this work and the findings of the impacts are not a full assessment of design options, and judgment of management is still required to choose useful design options for energy efficiency. The results reveal certain tendencies related to which type of logistics center and which intra-logistics and building design options are suitable to achieve the highest energy efficiency and lowest CO2 emissions.
The aforementioned limitations to the proposed framework and the findings of the examinations provide opportunities for further research. Firstly, more research is needed to generate valid reference condition-oriented energy parameters for energy calculation during the planning stage of material flow systems to evaluate different design options. Thus, the accuracy and applicability of the proposed energy calculation model for intra-logistics can improve, as more energy consumption parameters for different kinds of material handling, storage, and flow equipment become available. A dynamic logistics performance and a varying throughput over time should be investigated, as this work is limited in assuming hourly constant throughput of the intra-logistics system for a year. This aspect of the effects of the varying logistics performance on the total energy demand of the system logistics center and building technology for different types is currently not addressed in commonly logistics research. For this further research, the conducted systems analysis and the developed reference building models provide a basis for extension of the investigation into dynamic systems behavior and the effects on energy demand by varying parameters. Additionally, an extension of the system boundaries to include site selection and evaluation in conjunction with other buildings and possibilities of sourcing renewable energies poses further research. Efforts should focus on the evaluation of synergy effects regarding utilization, storage, and supply of renewable energies in conjunction with the total system logistics center and the site.
The findings in this research work provide a deeper understanding of the energy interrelations within the system logistics center for decision-making during the planning of energy-efficient and CO2-neutral systems. This is an important aspect to meet future requirements to achieve warehousing with low carbon emissions, and to decarbonize the whole supply chain in the future.


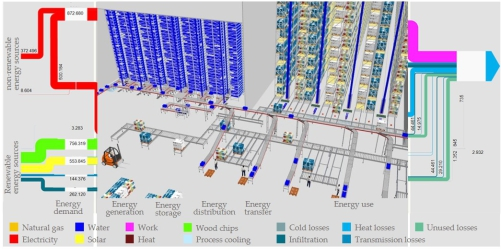
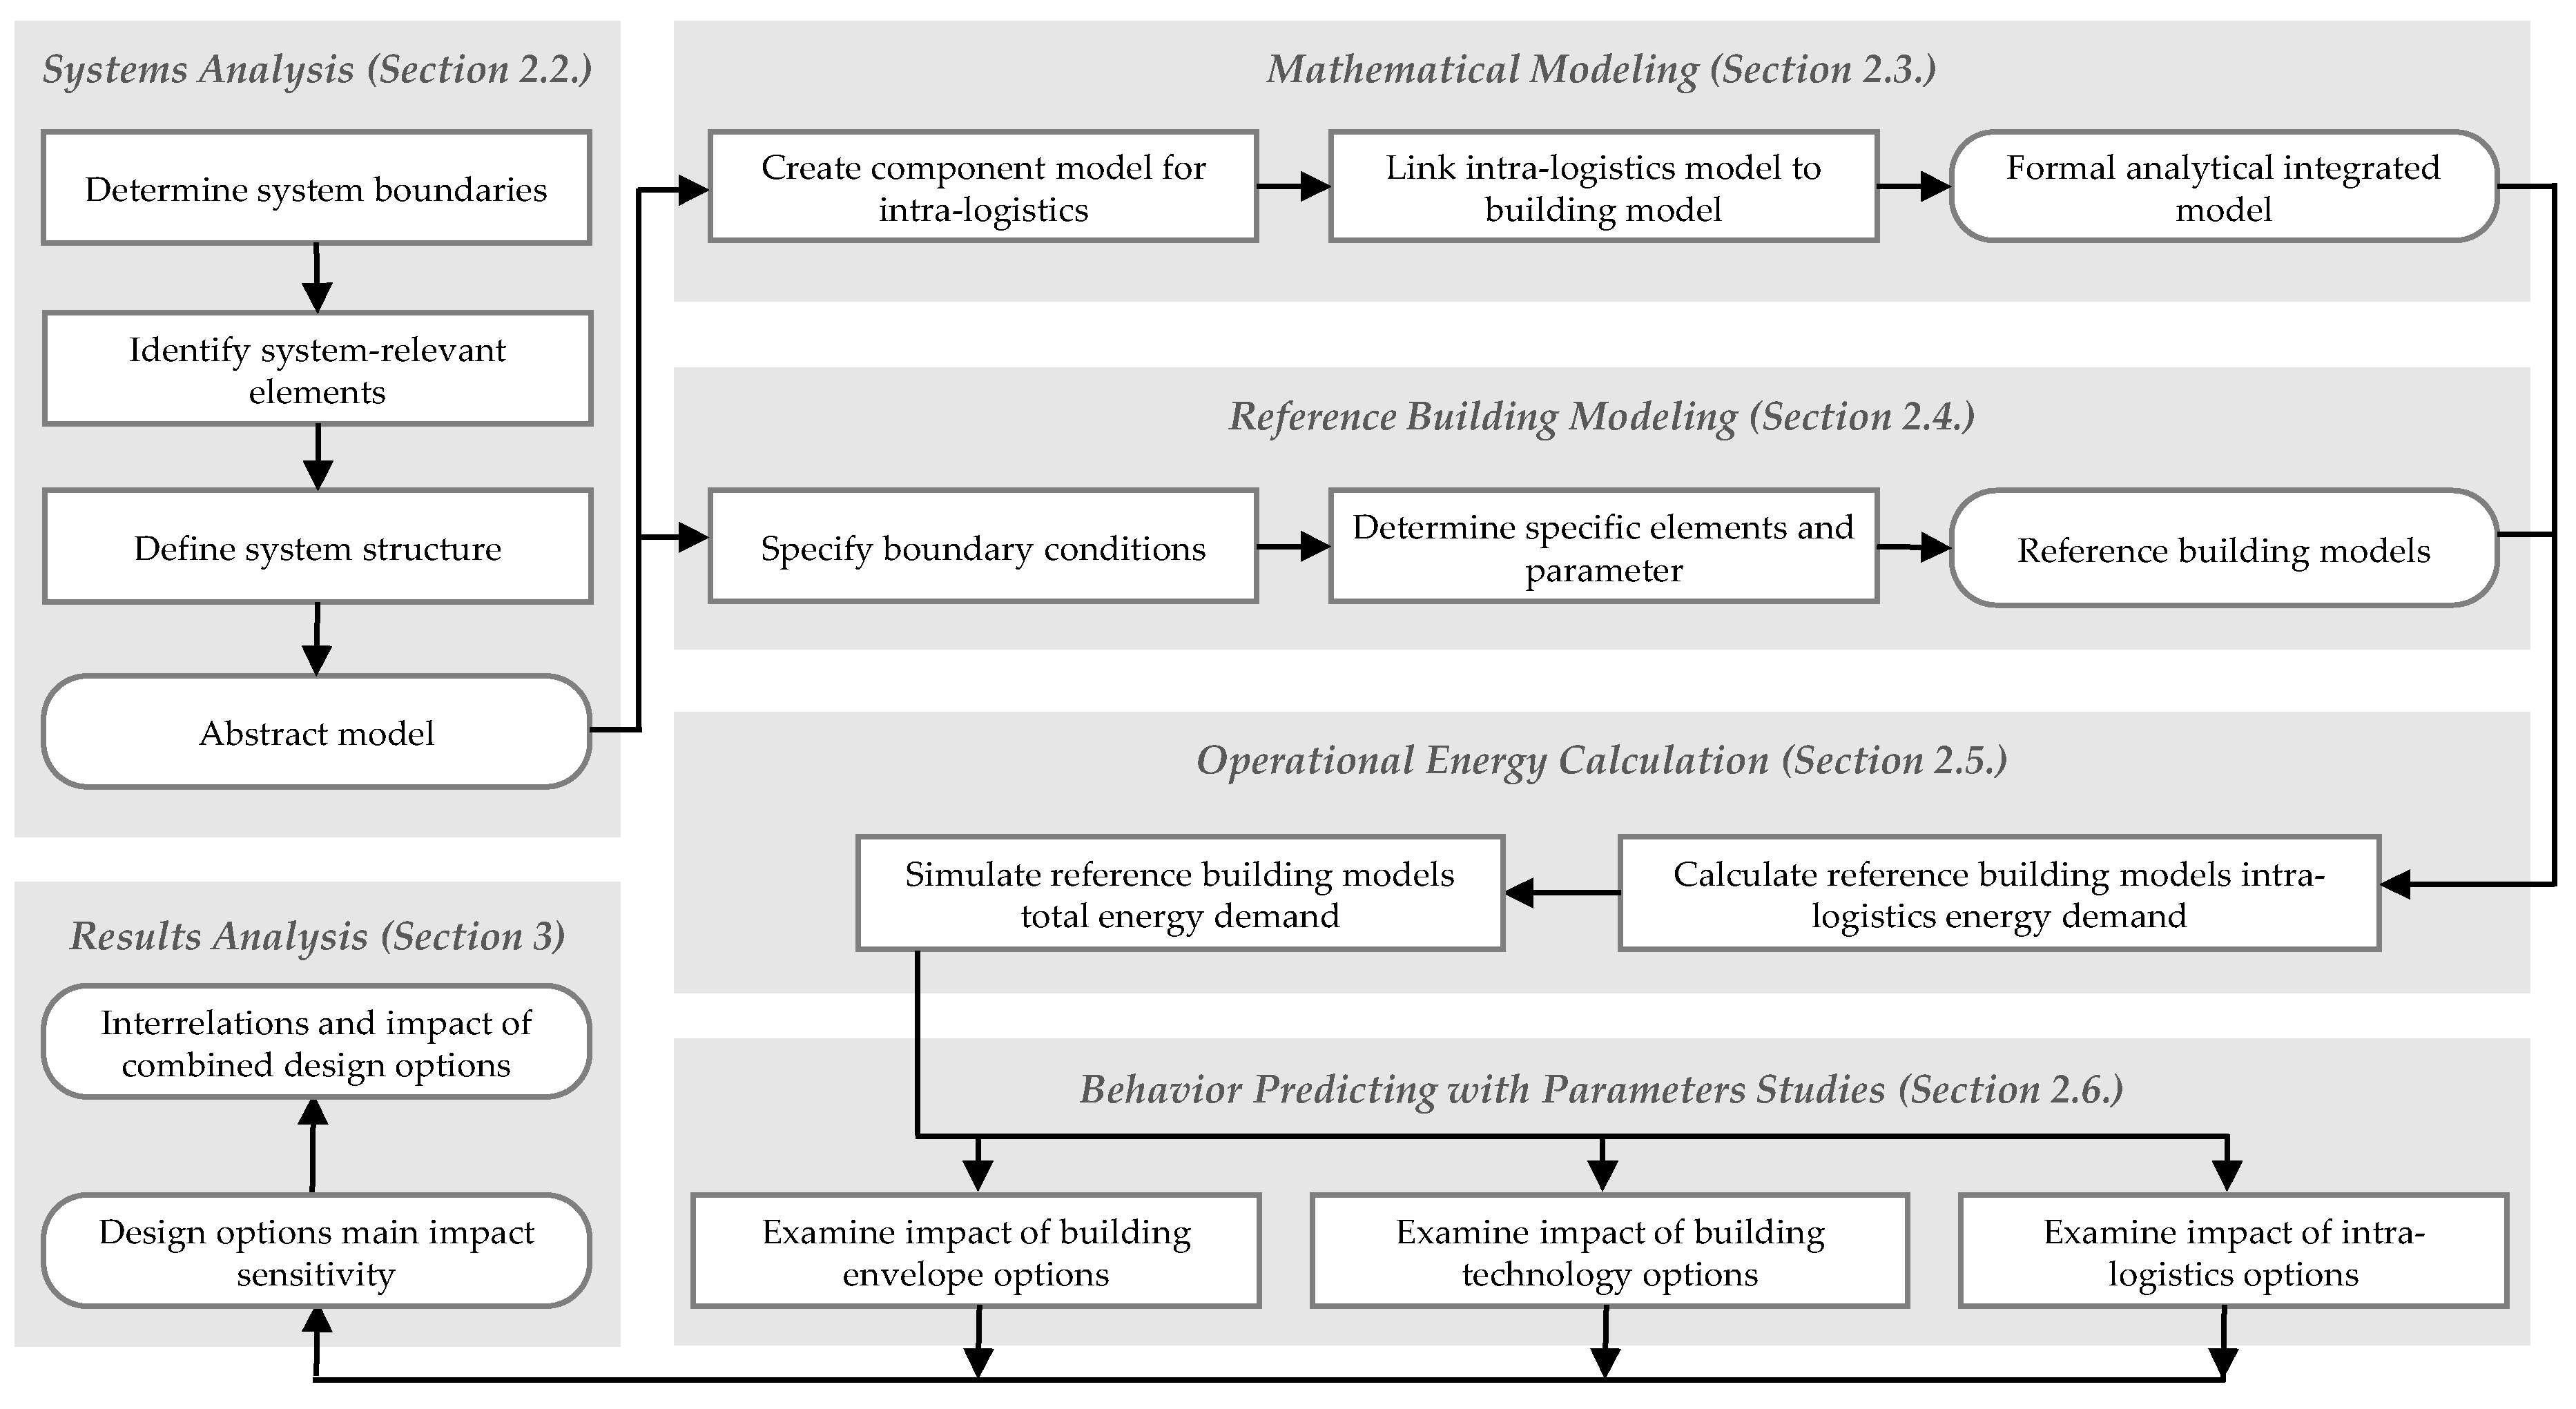
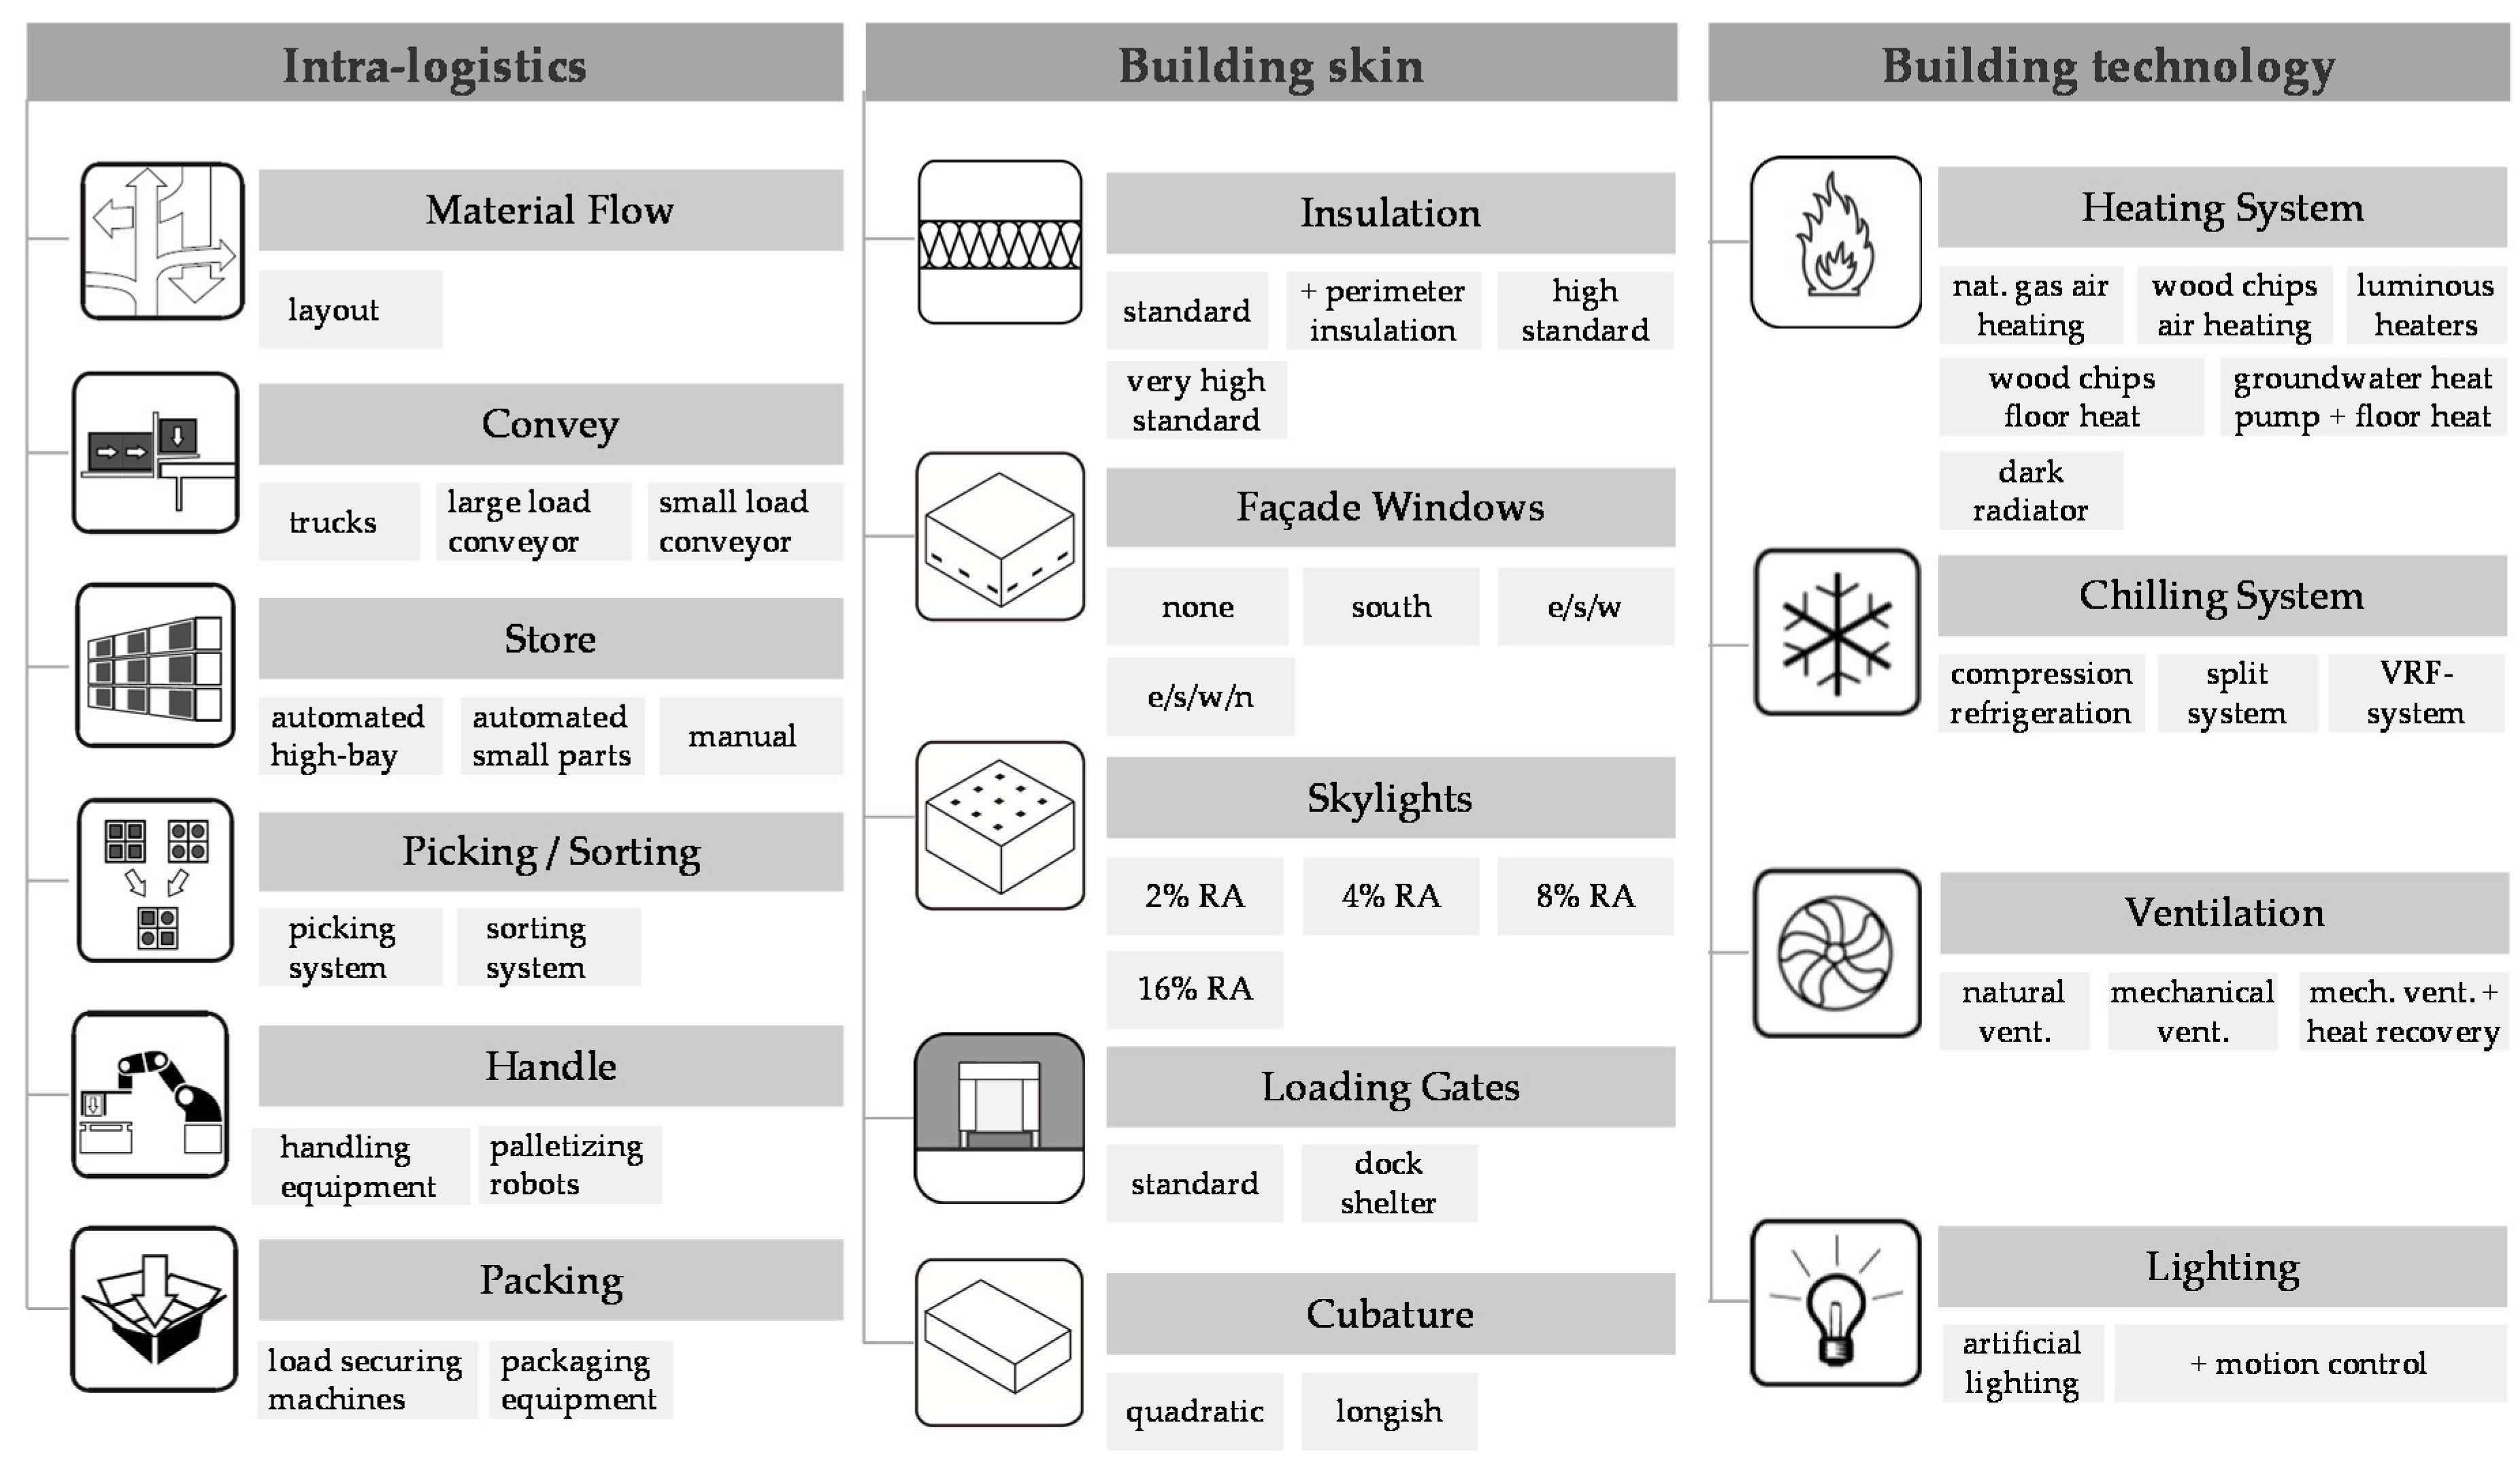
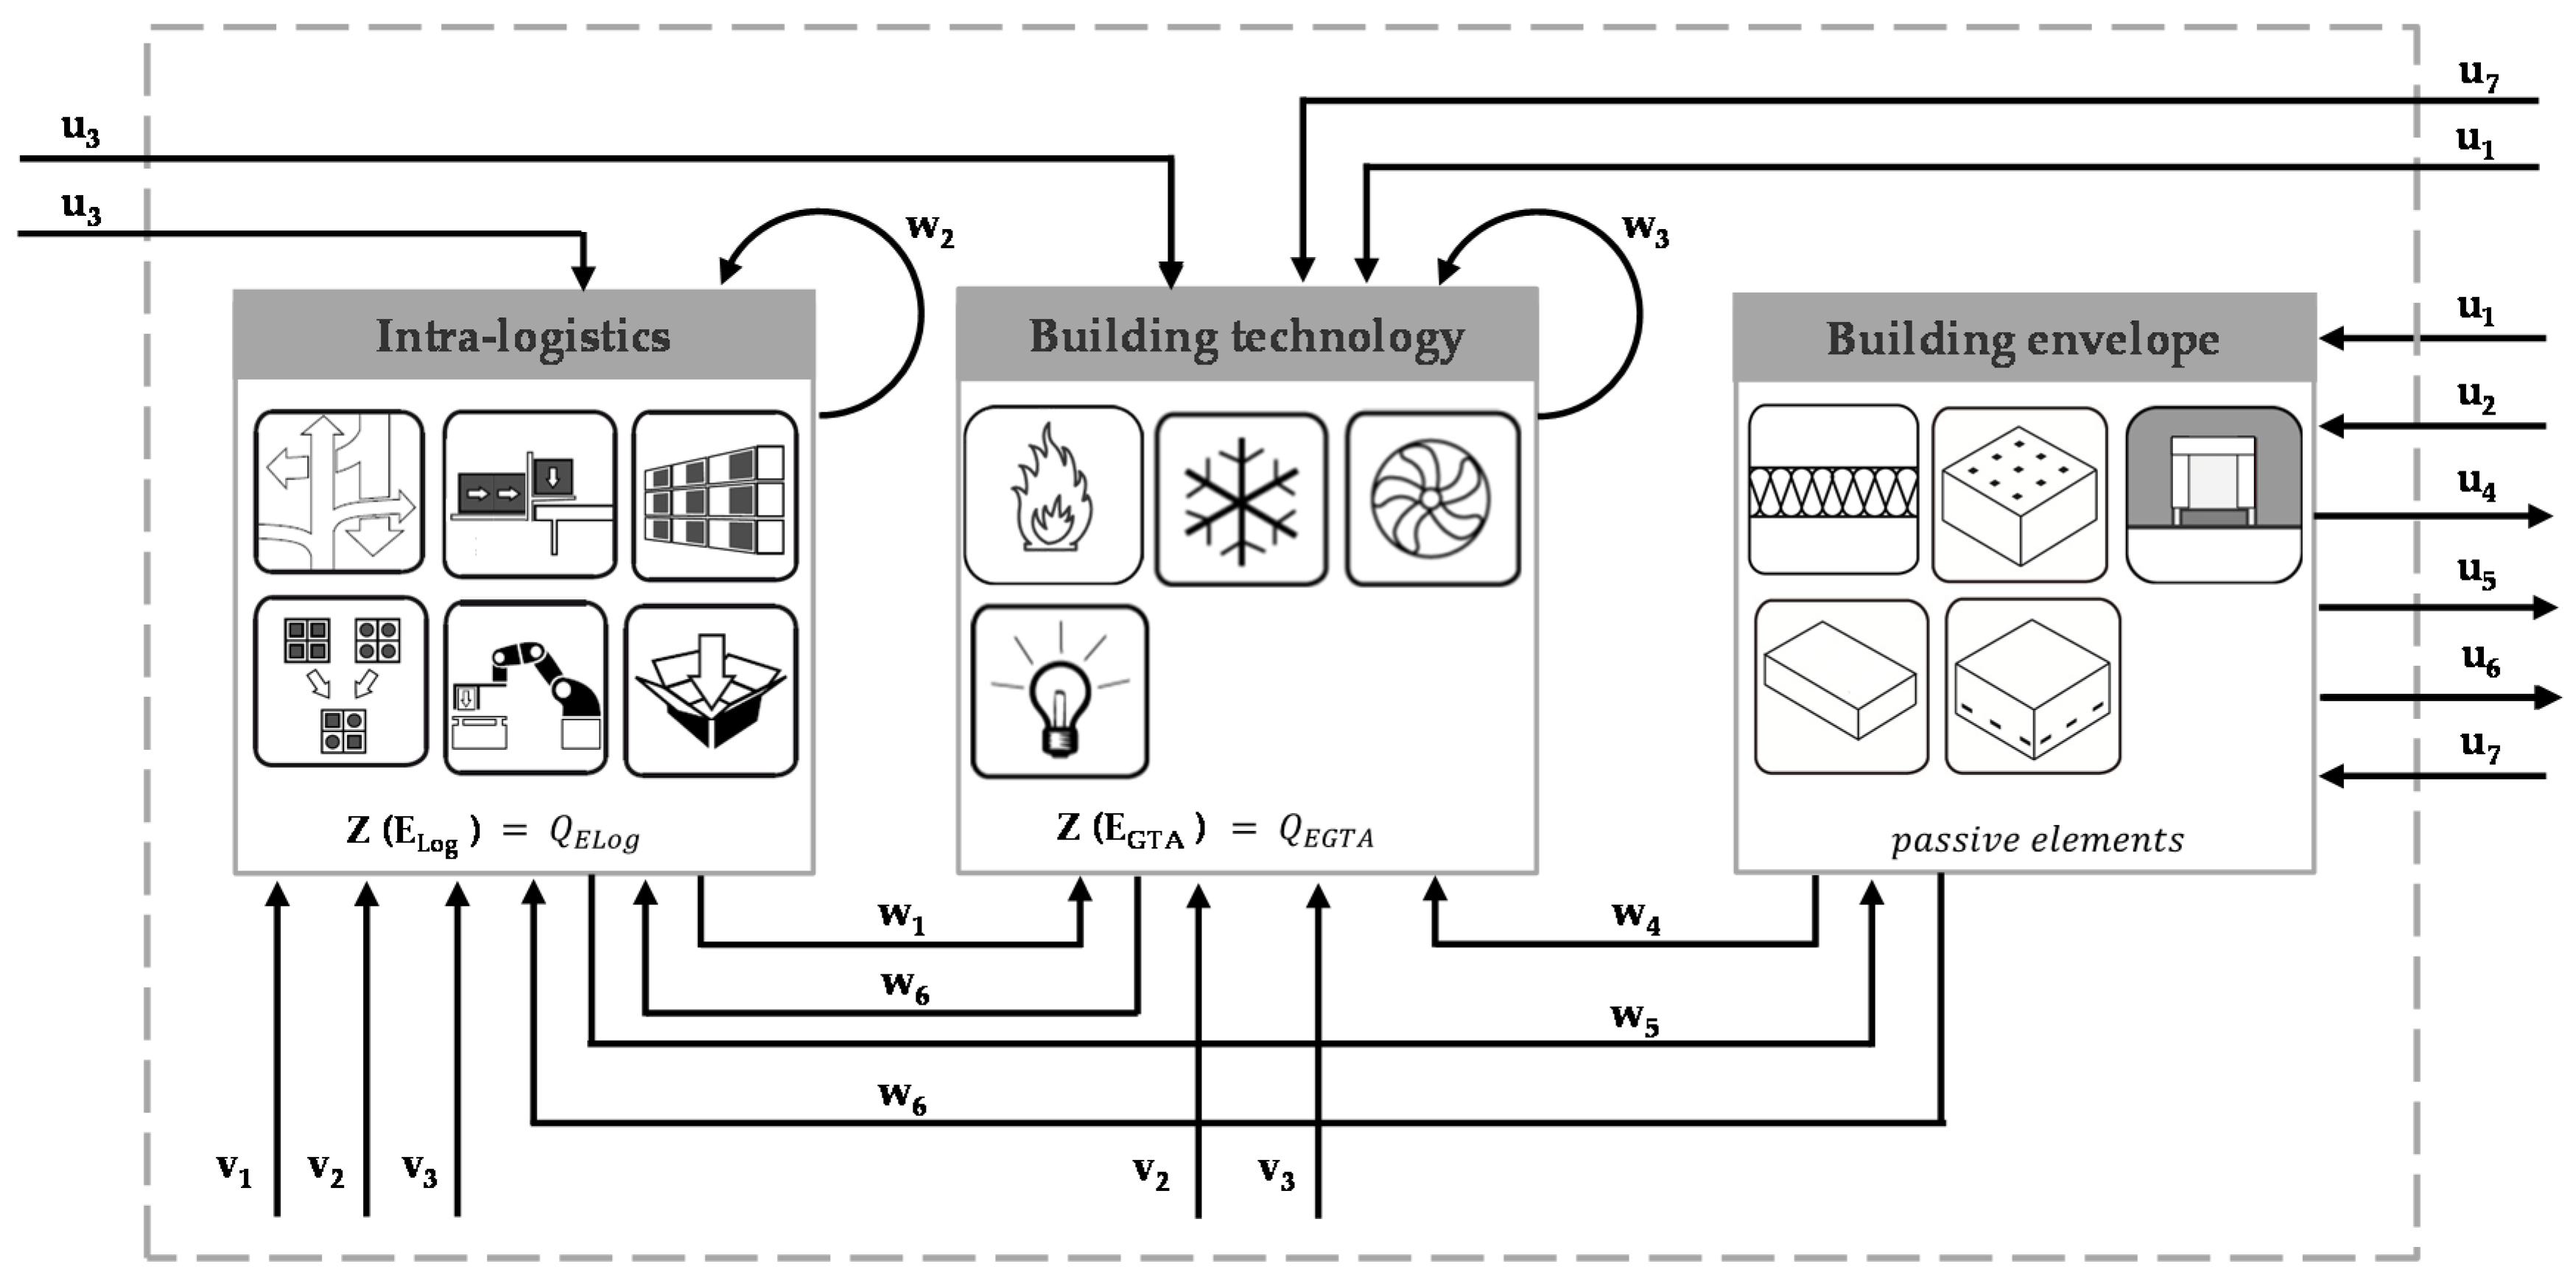
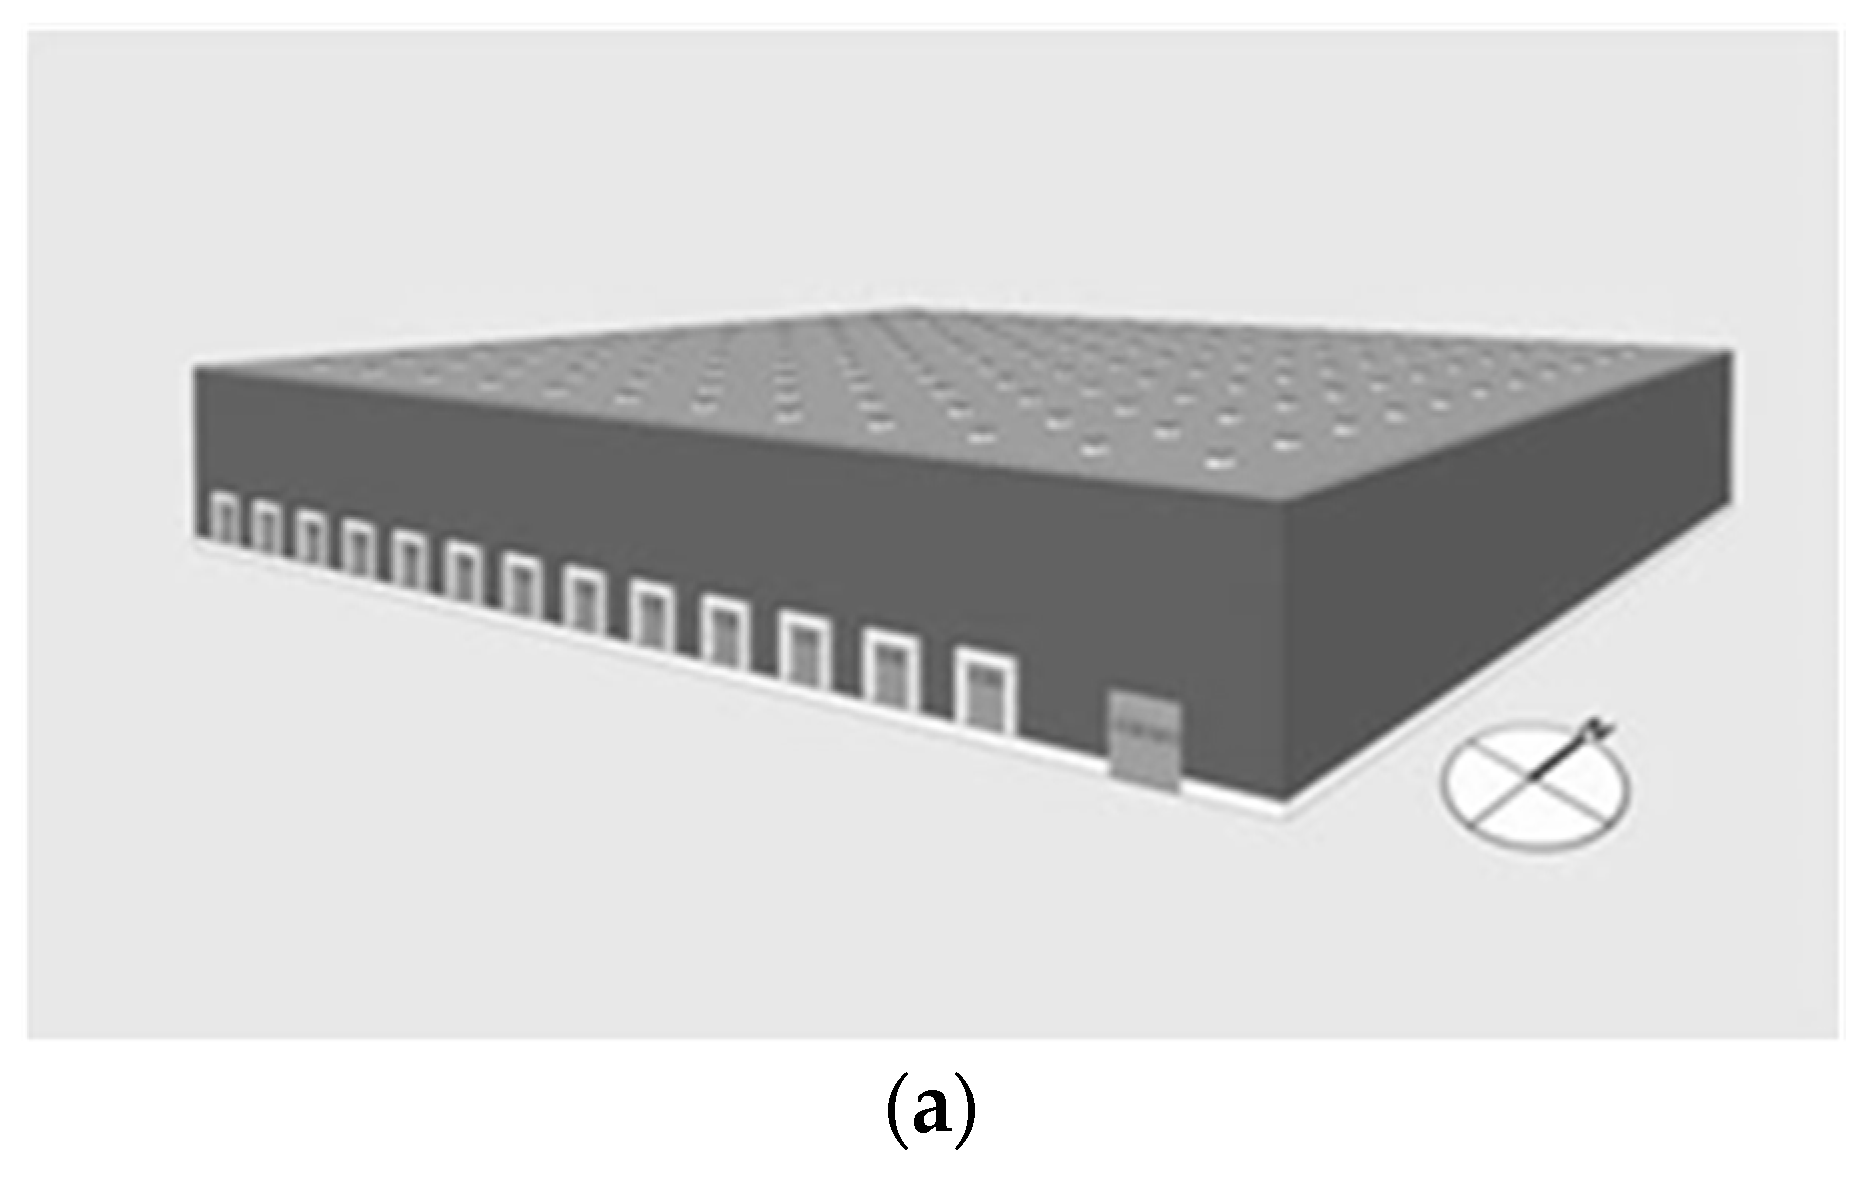
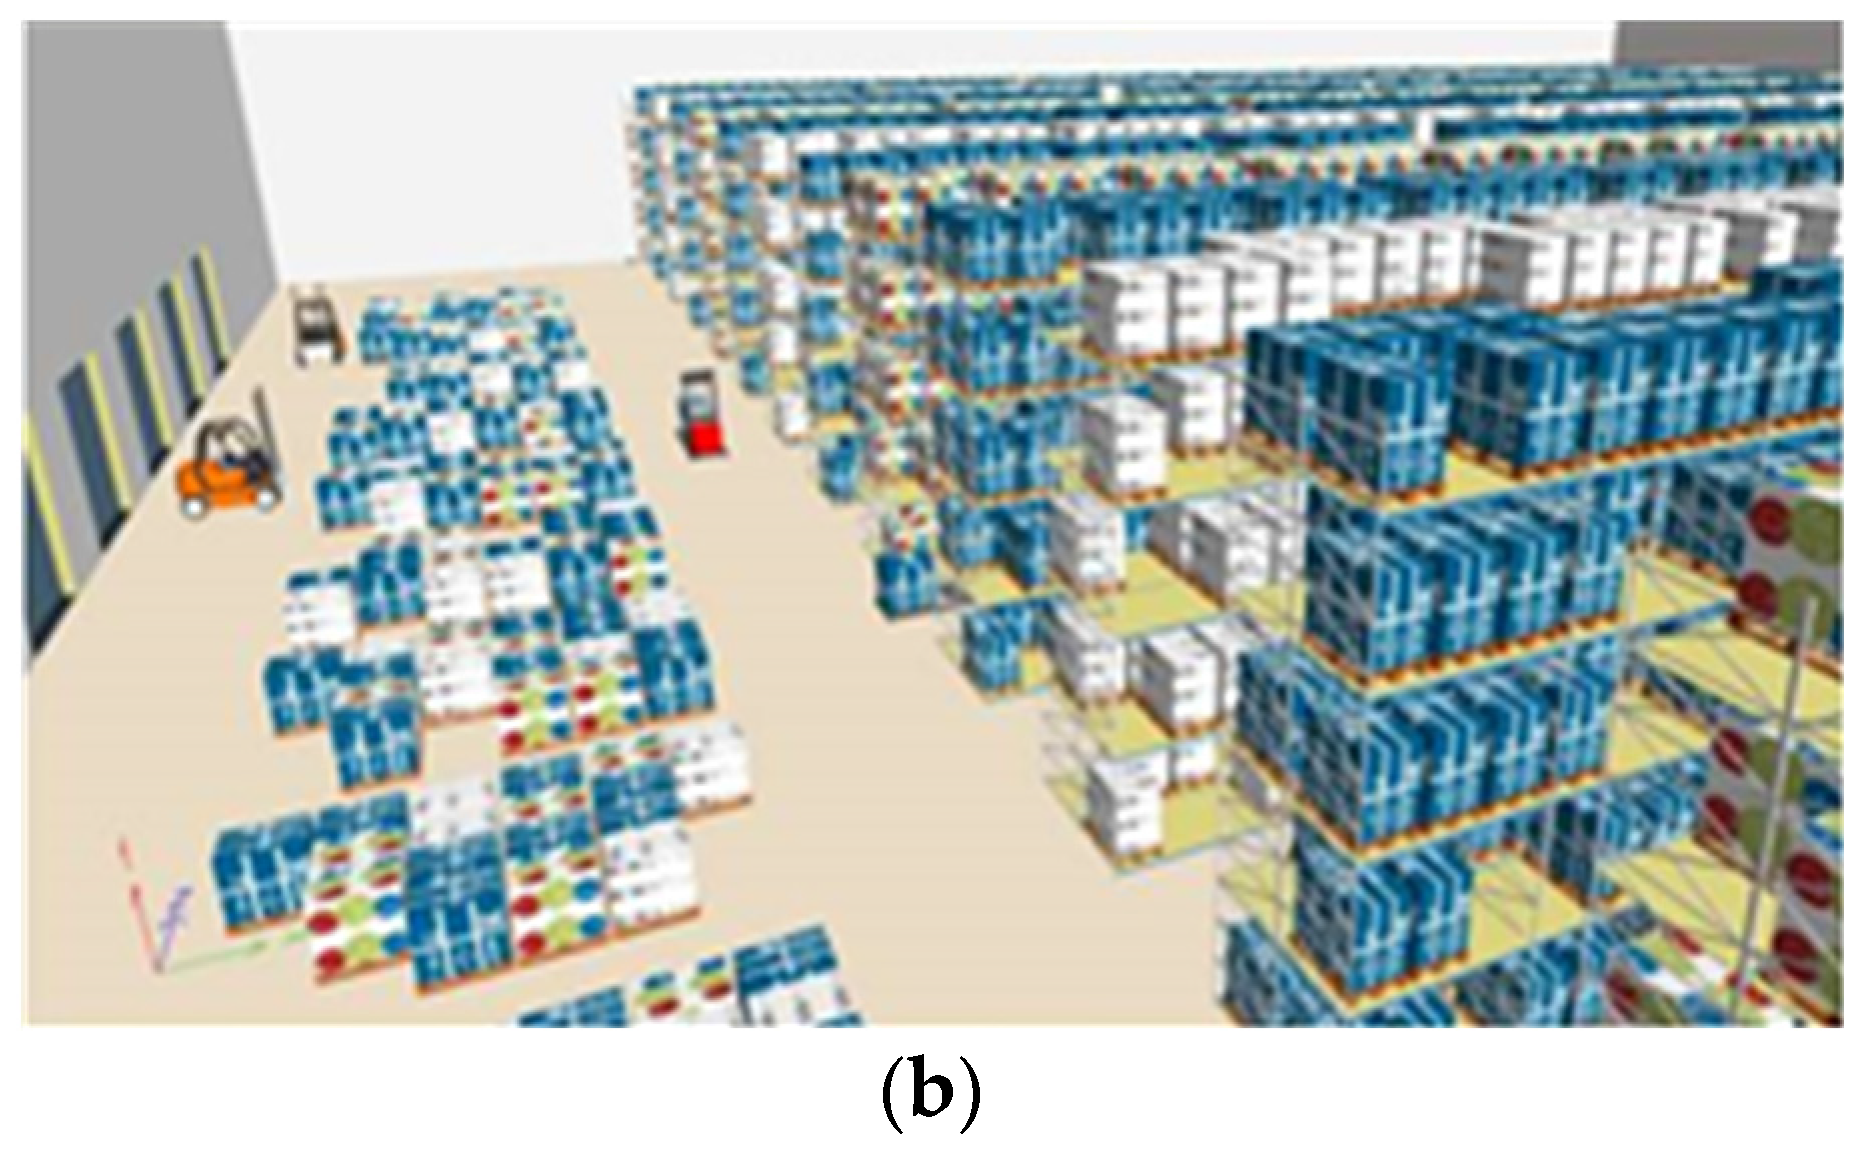
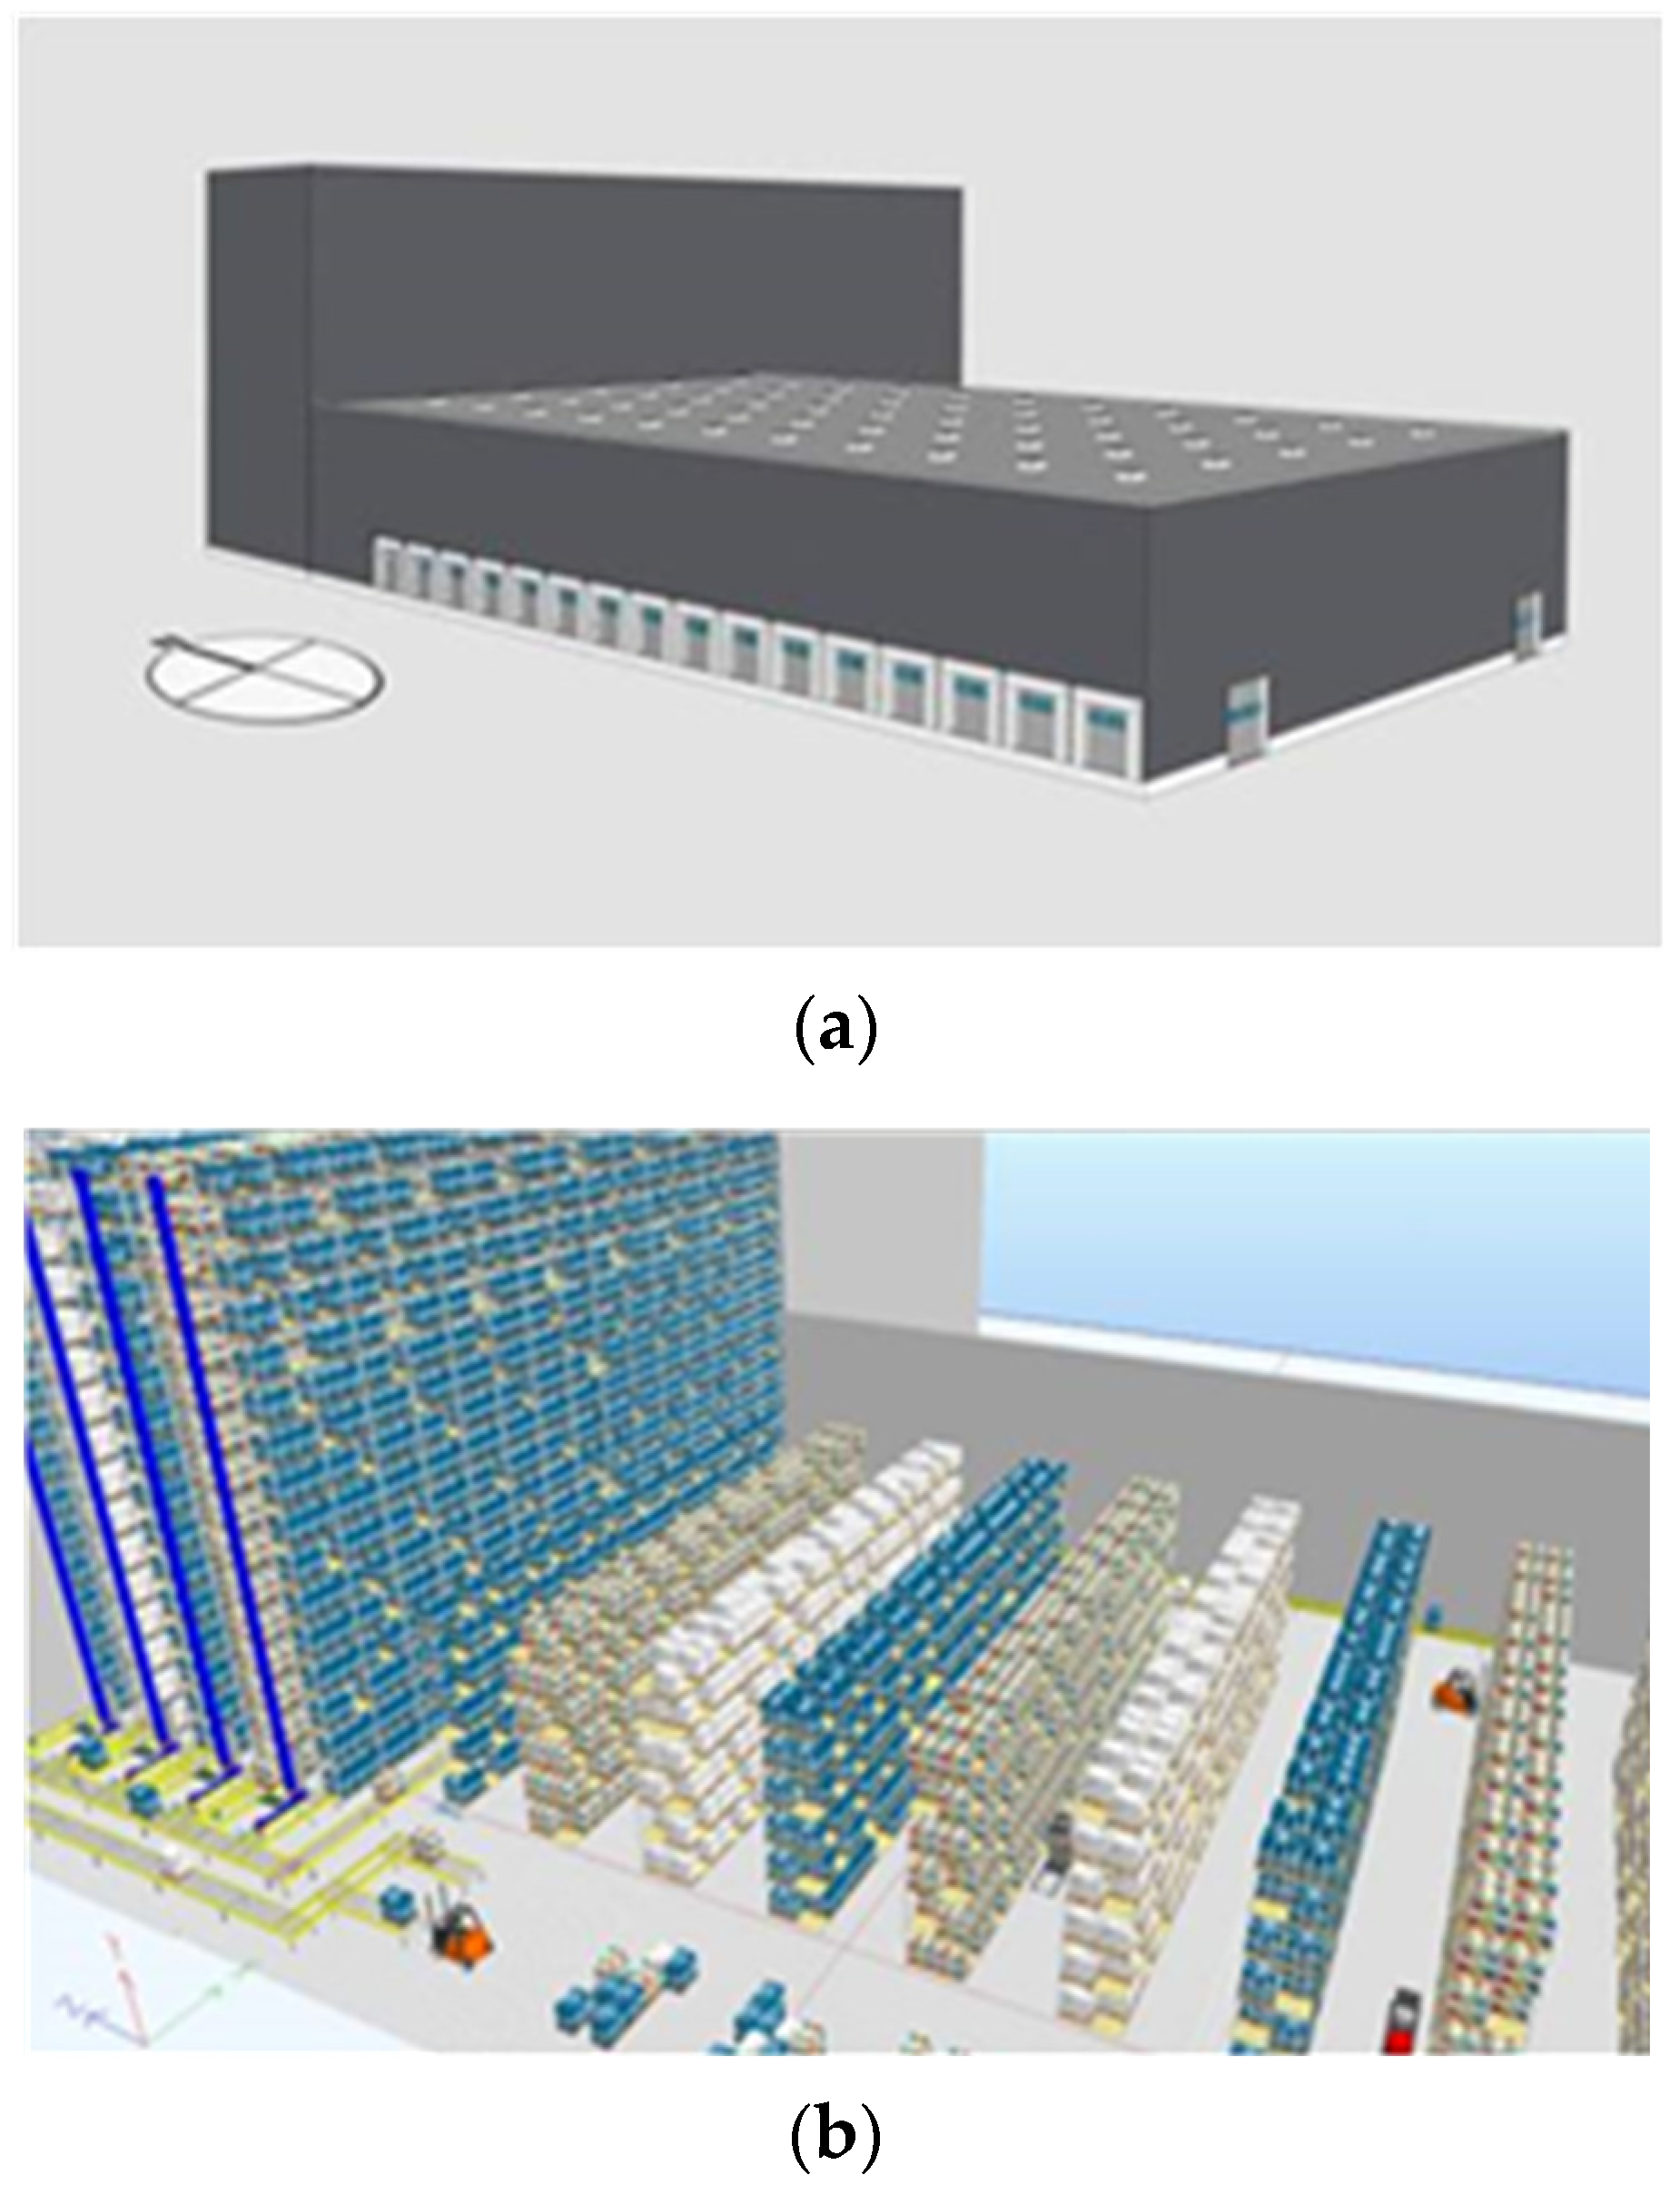
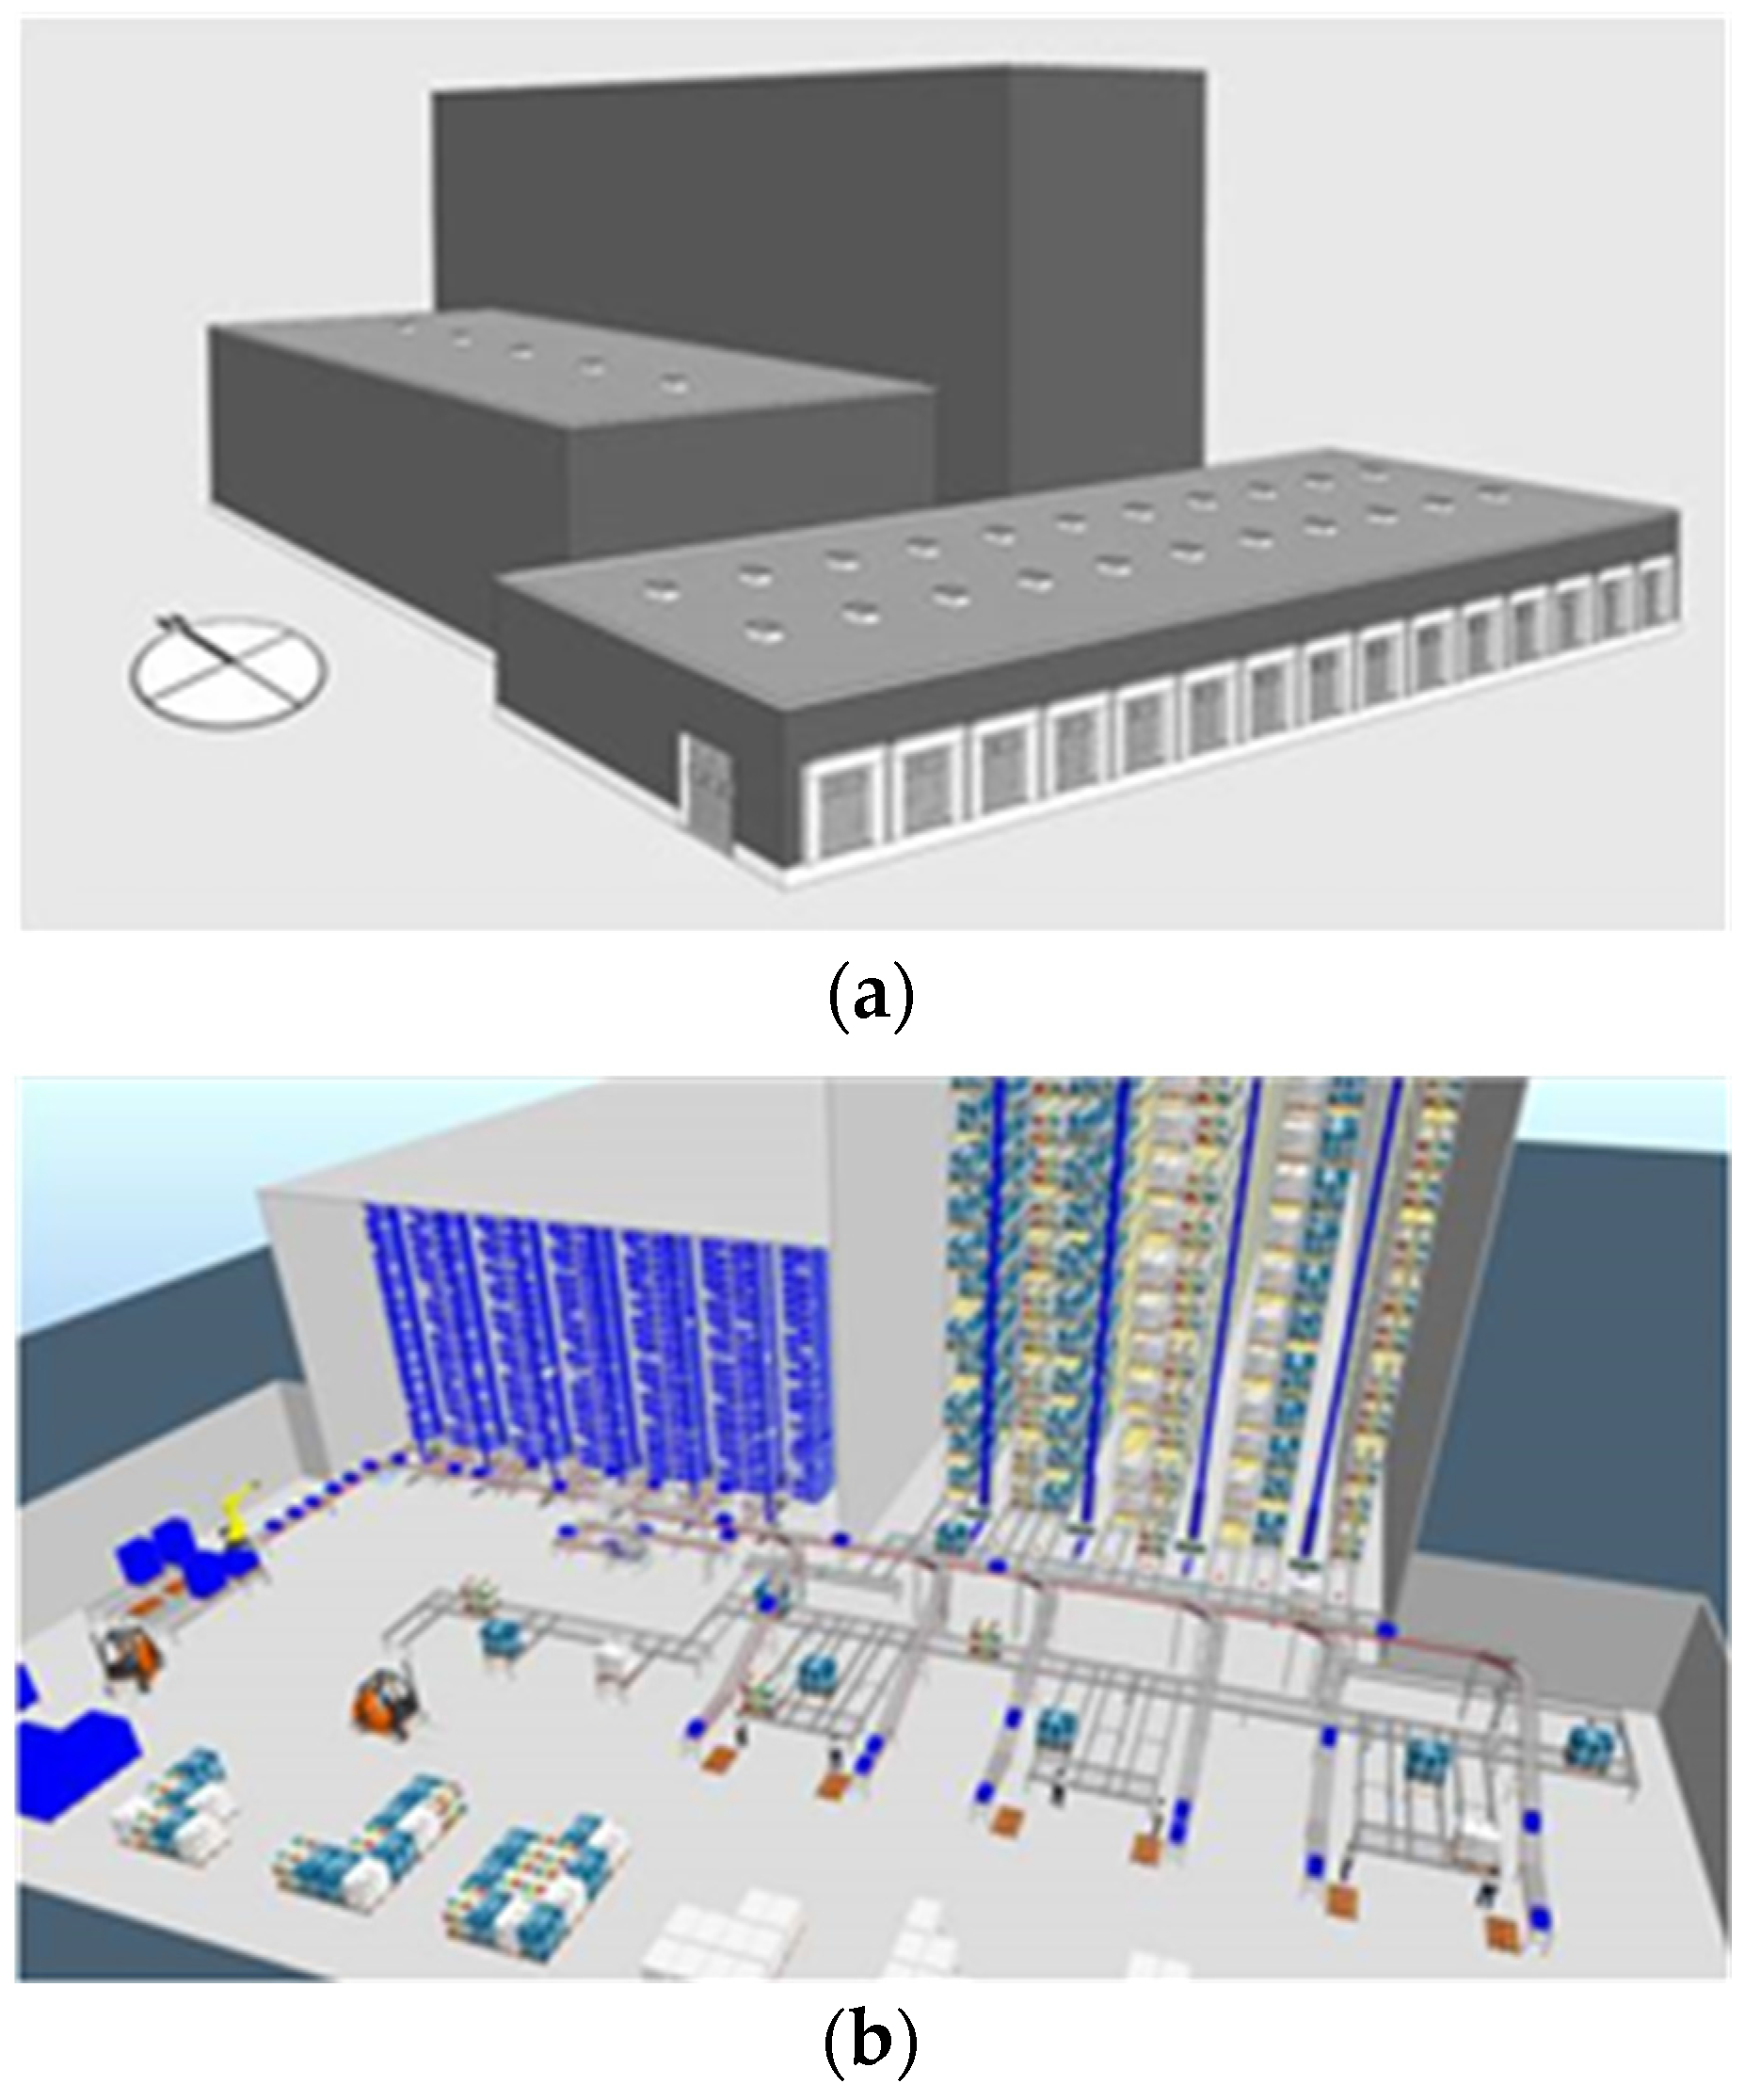
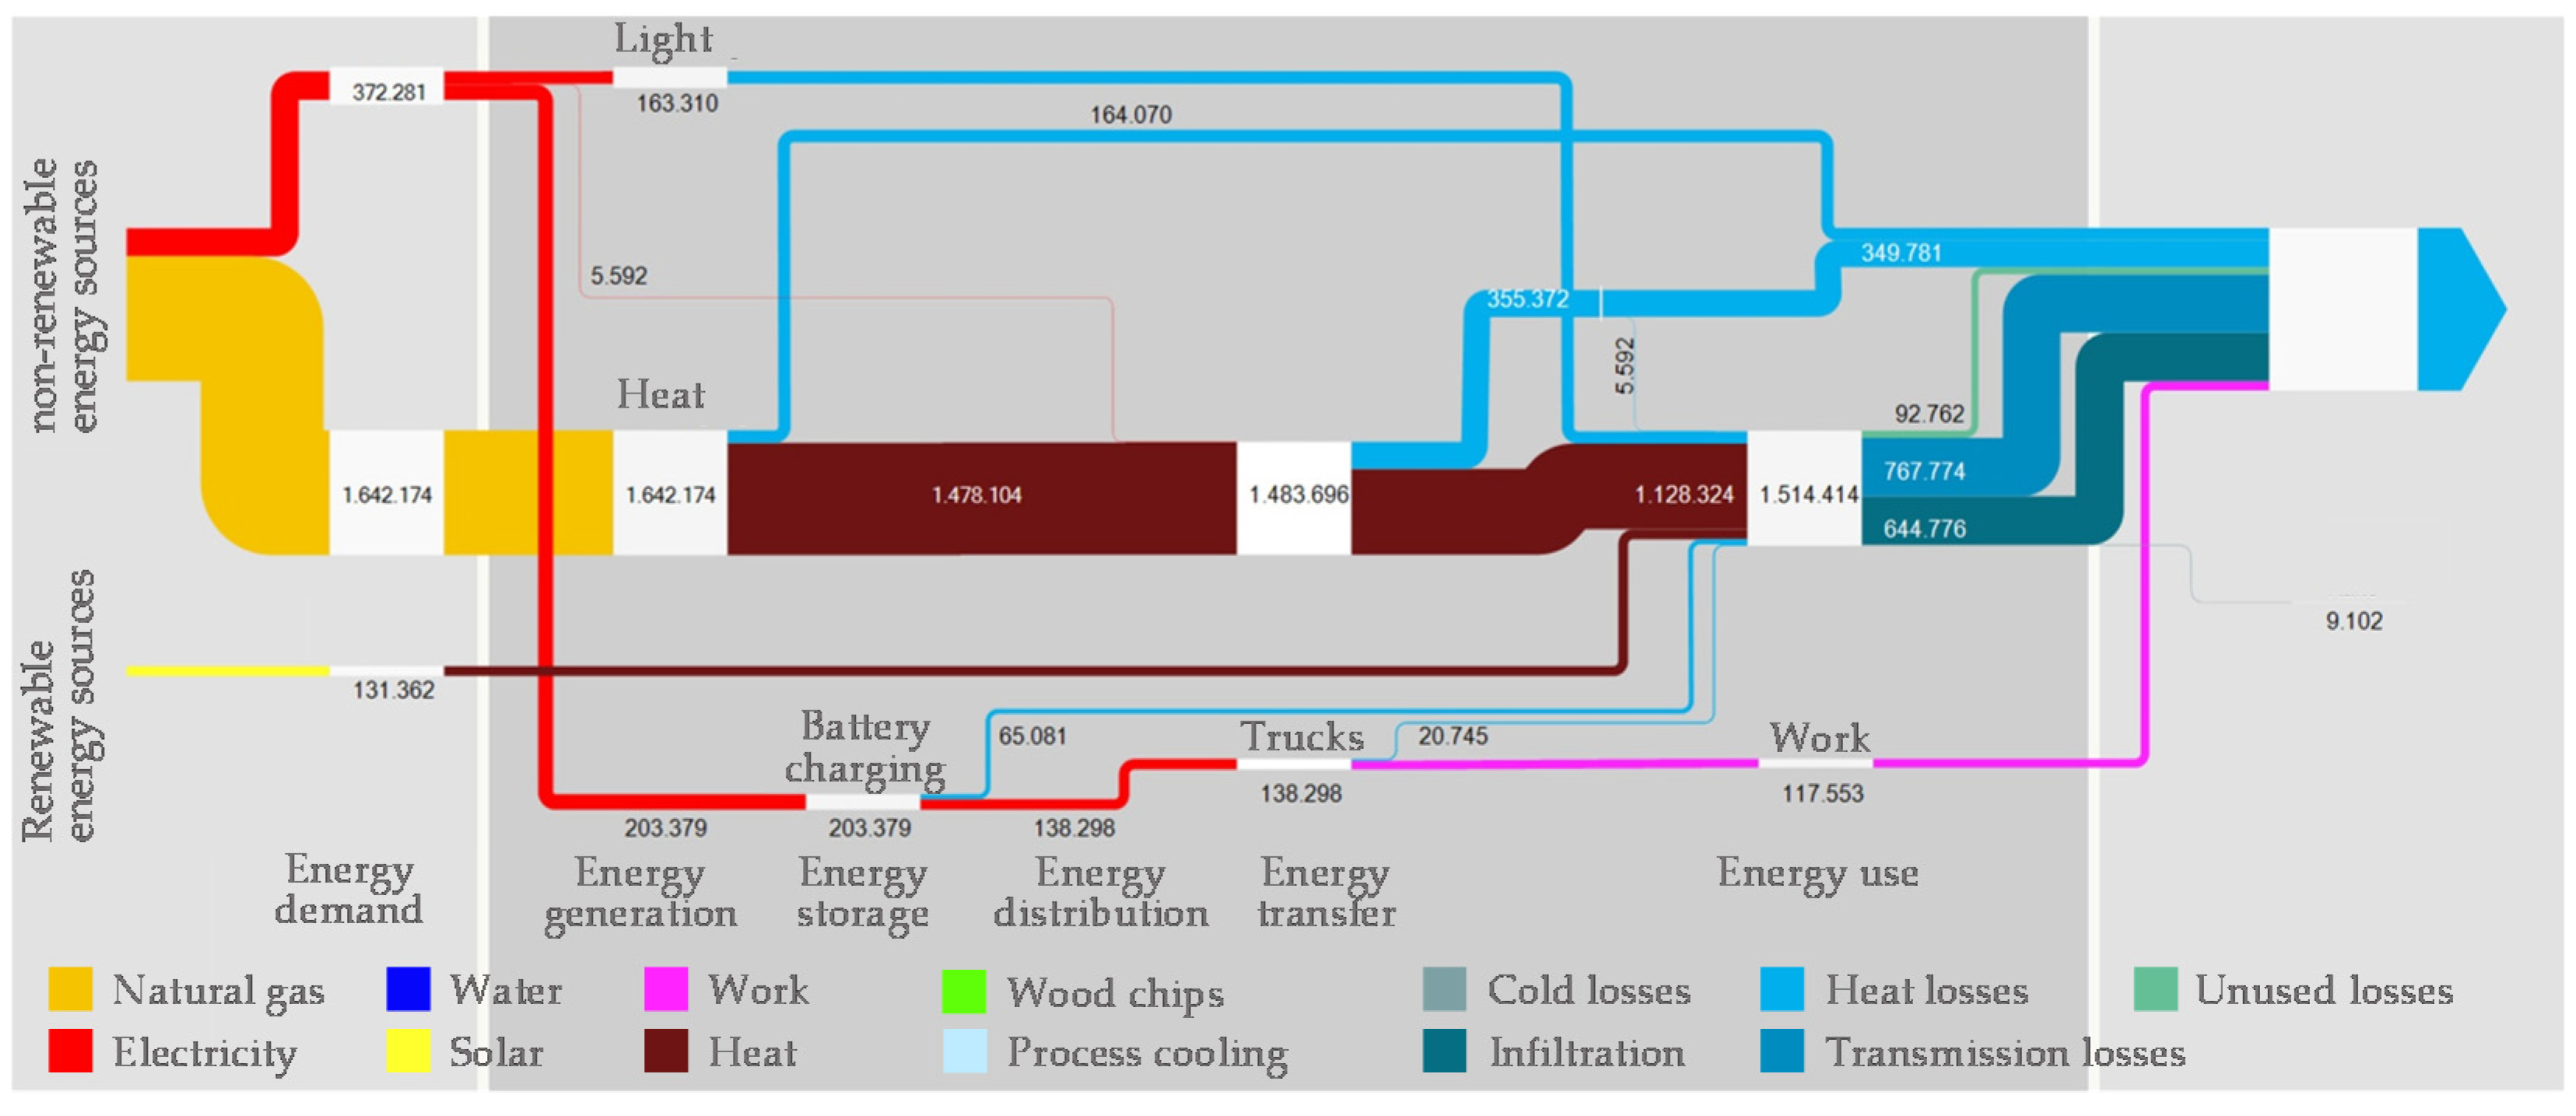
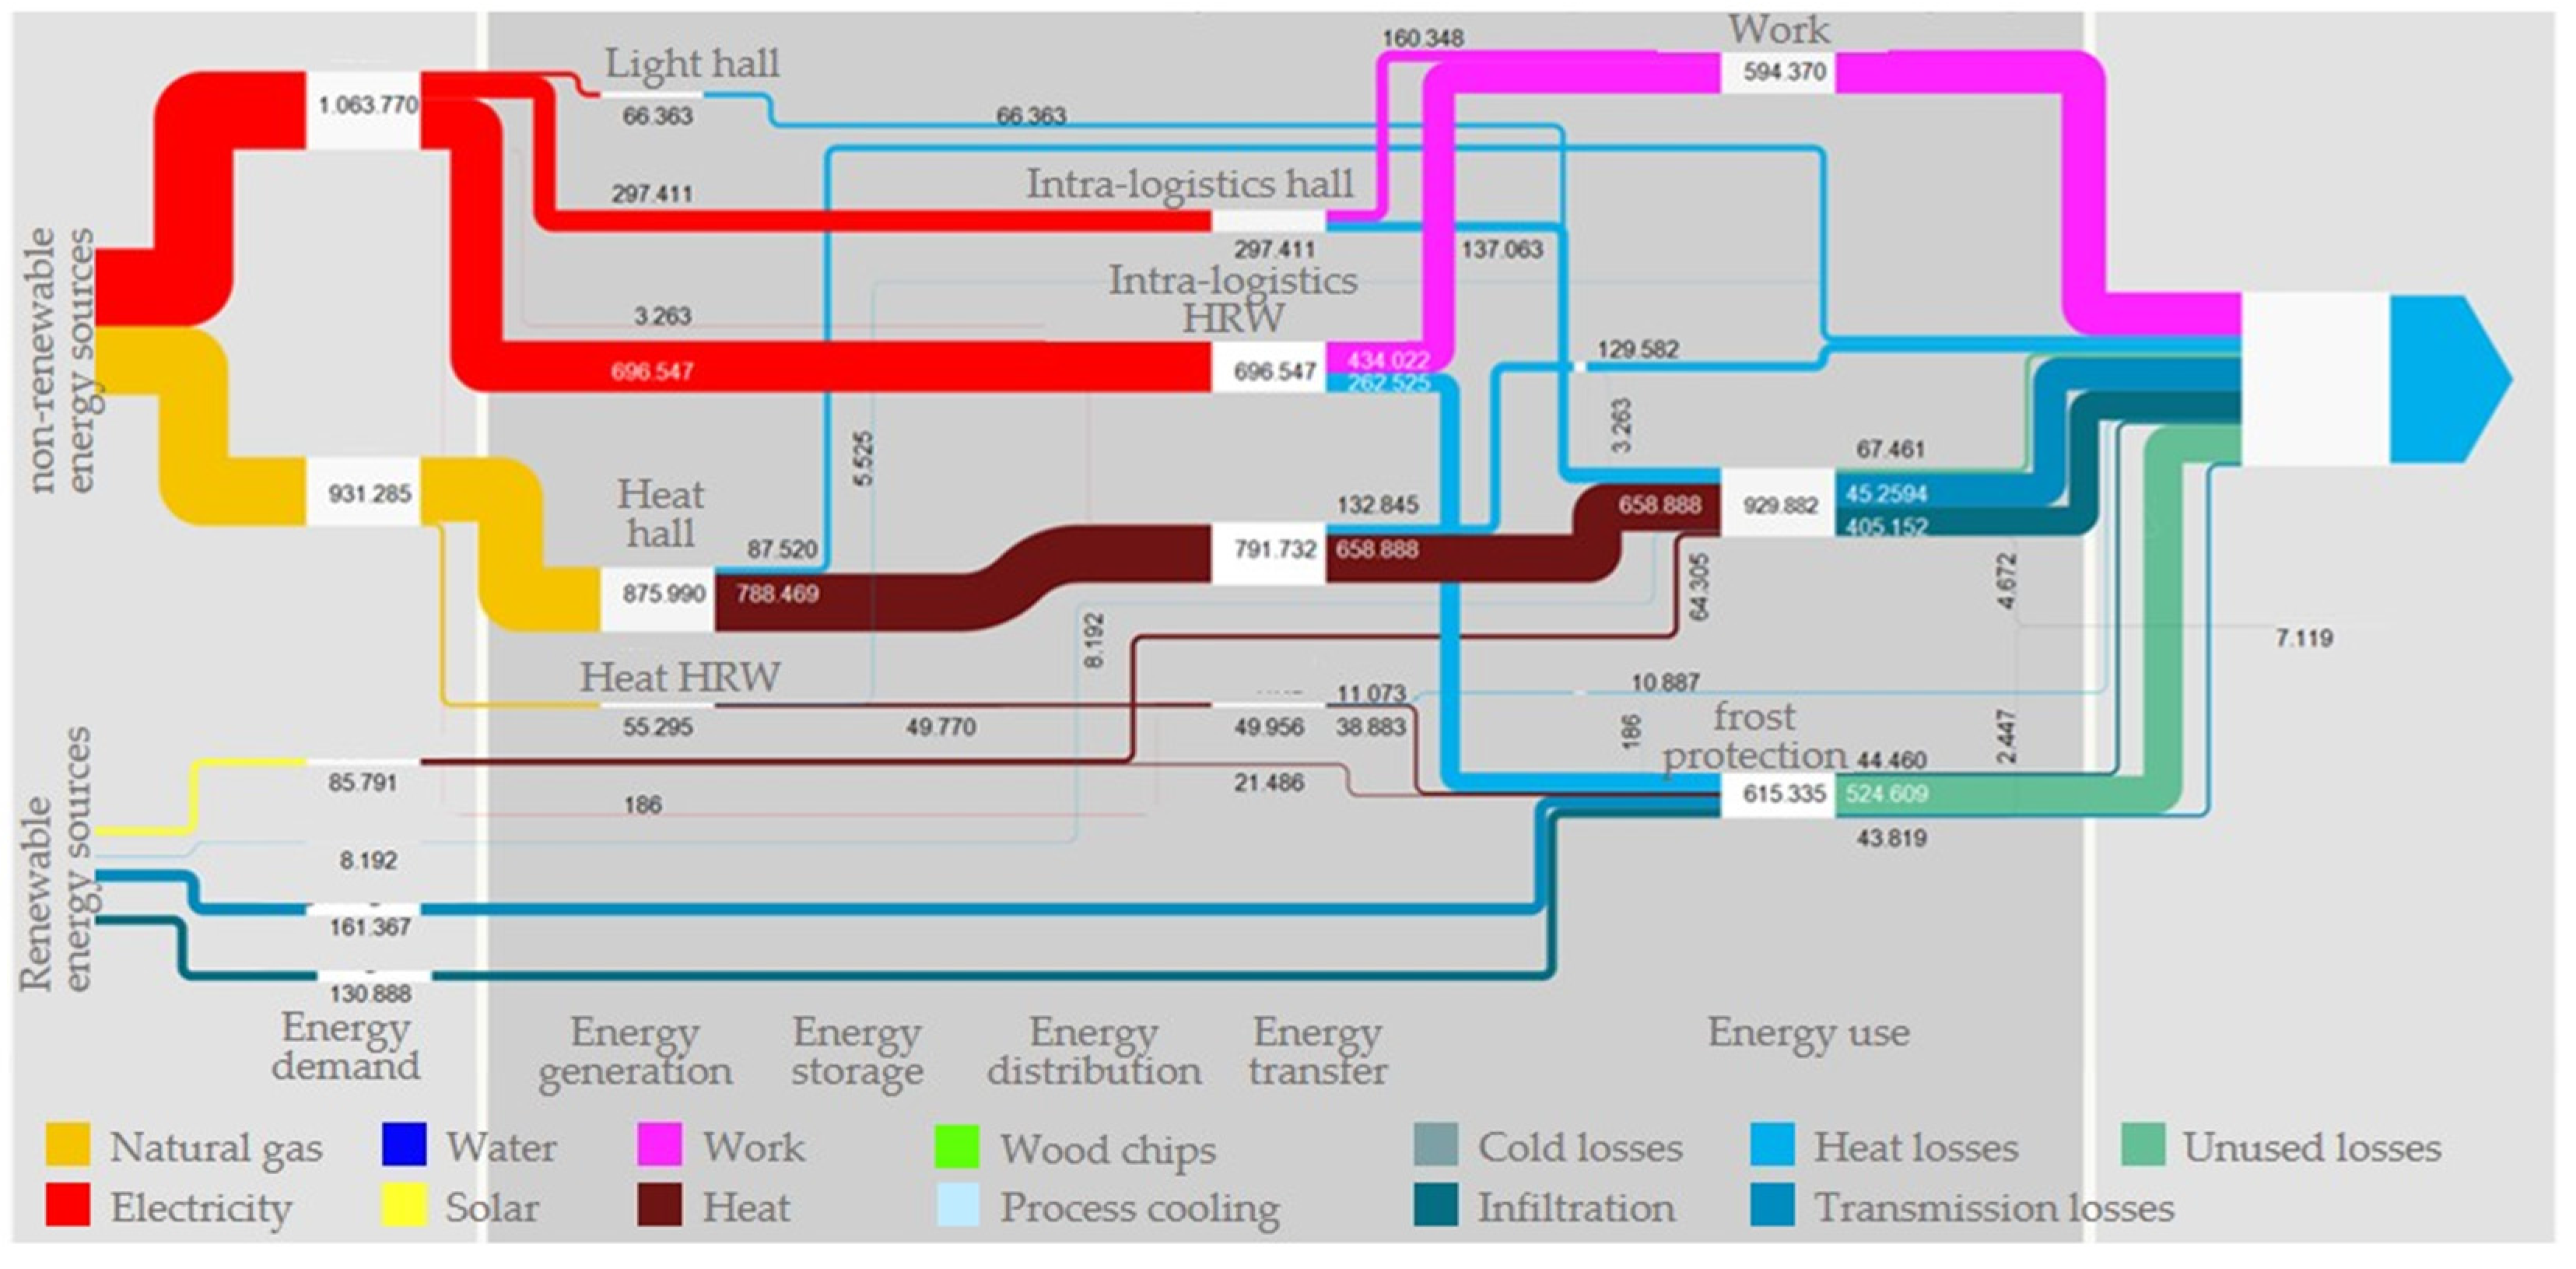
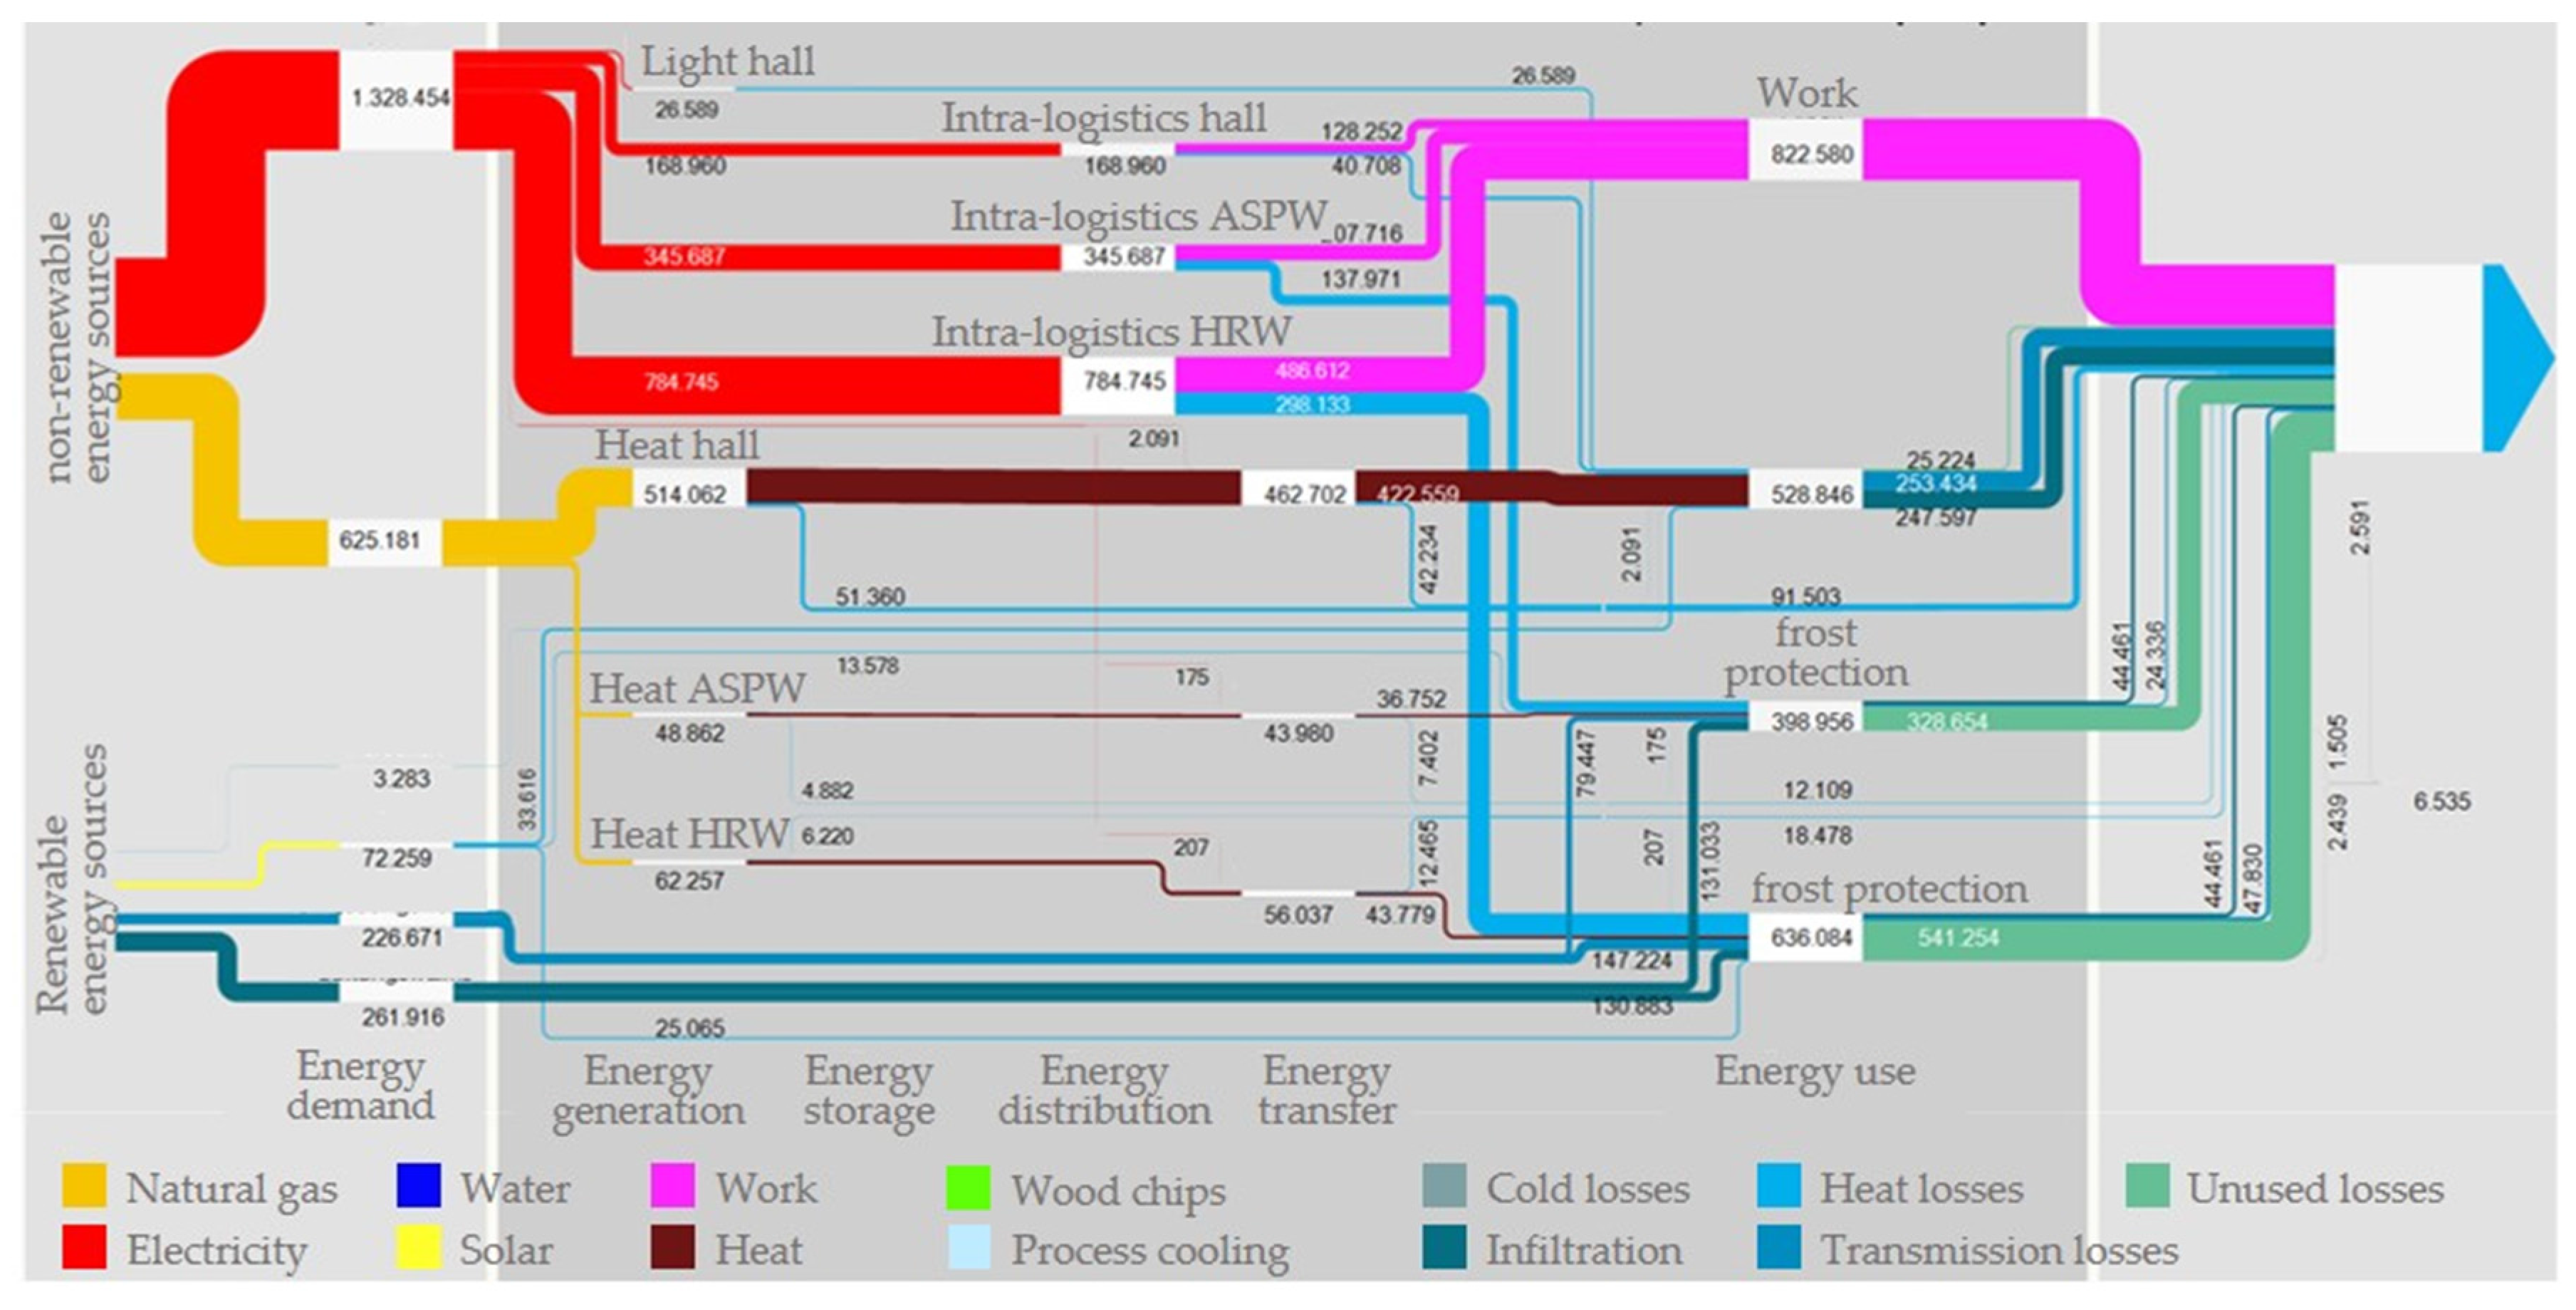
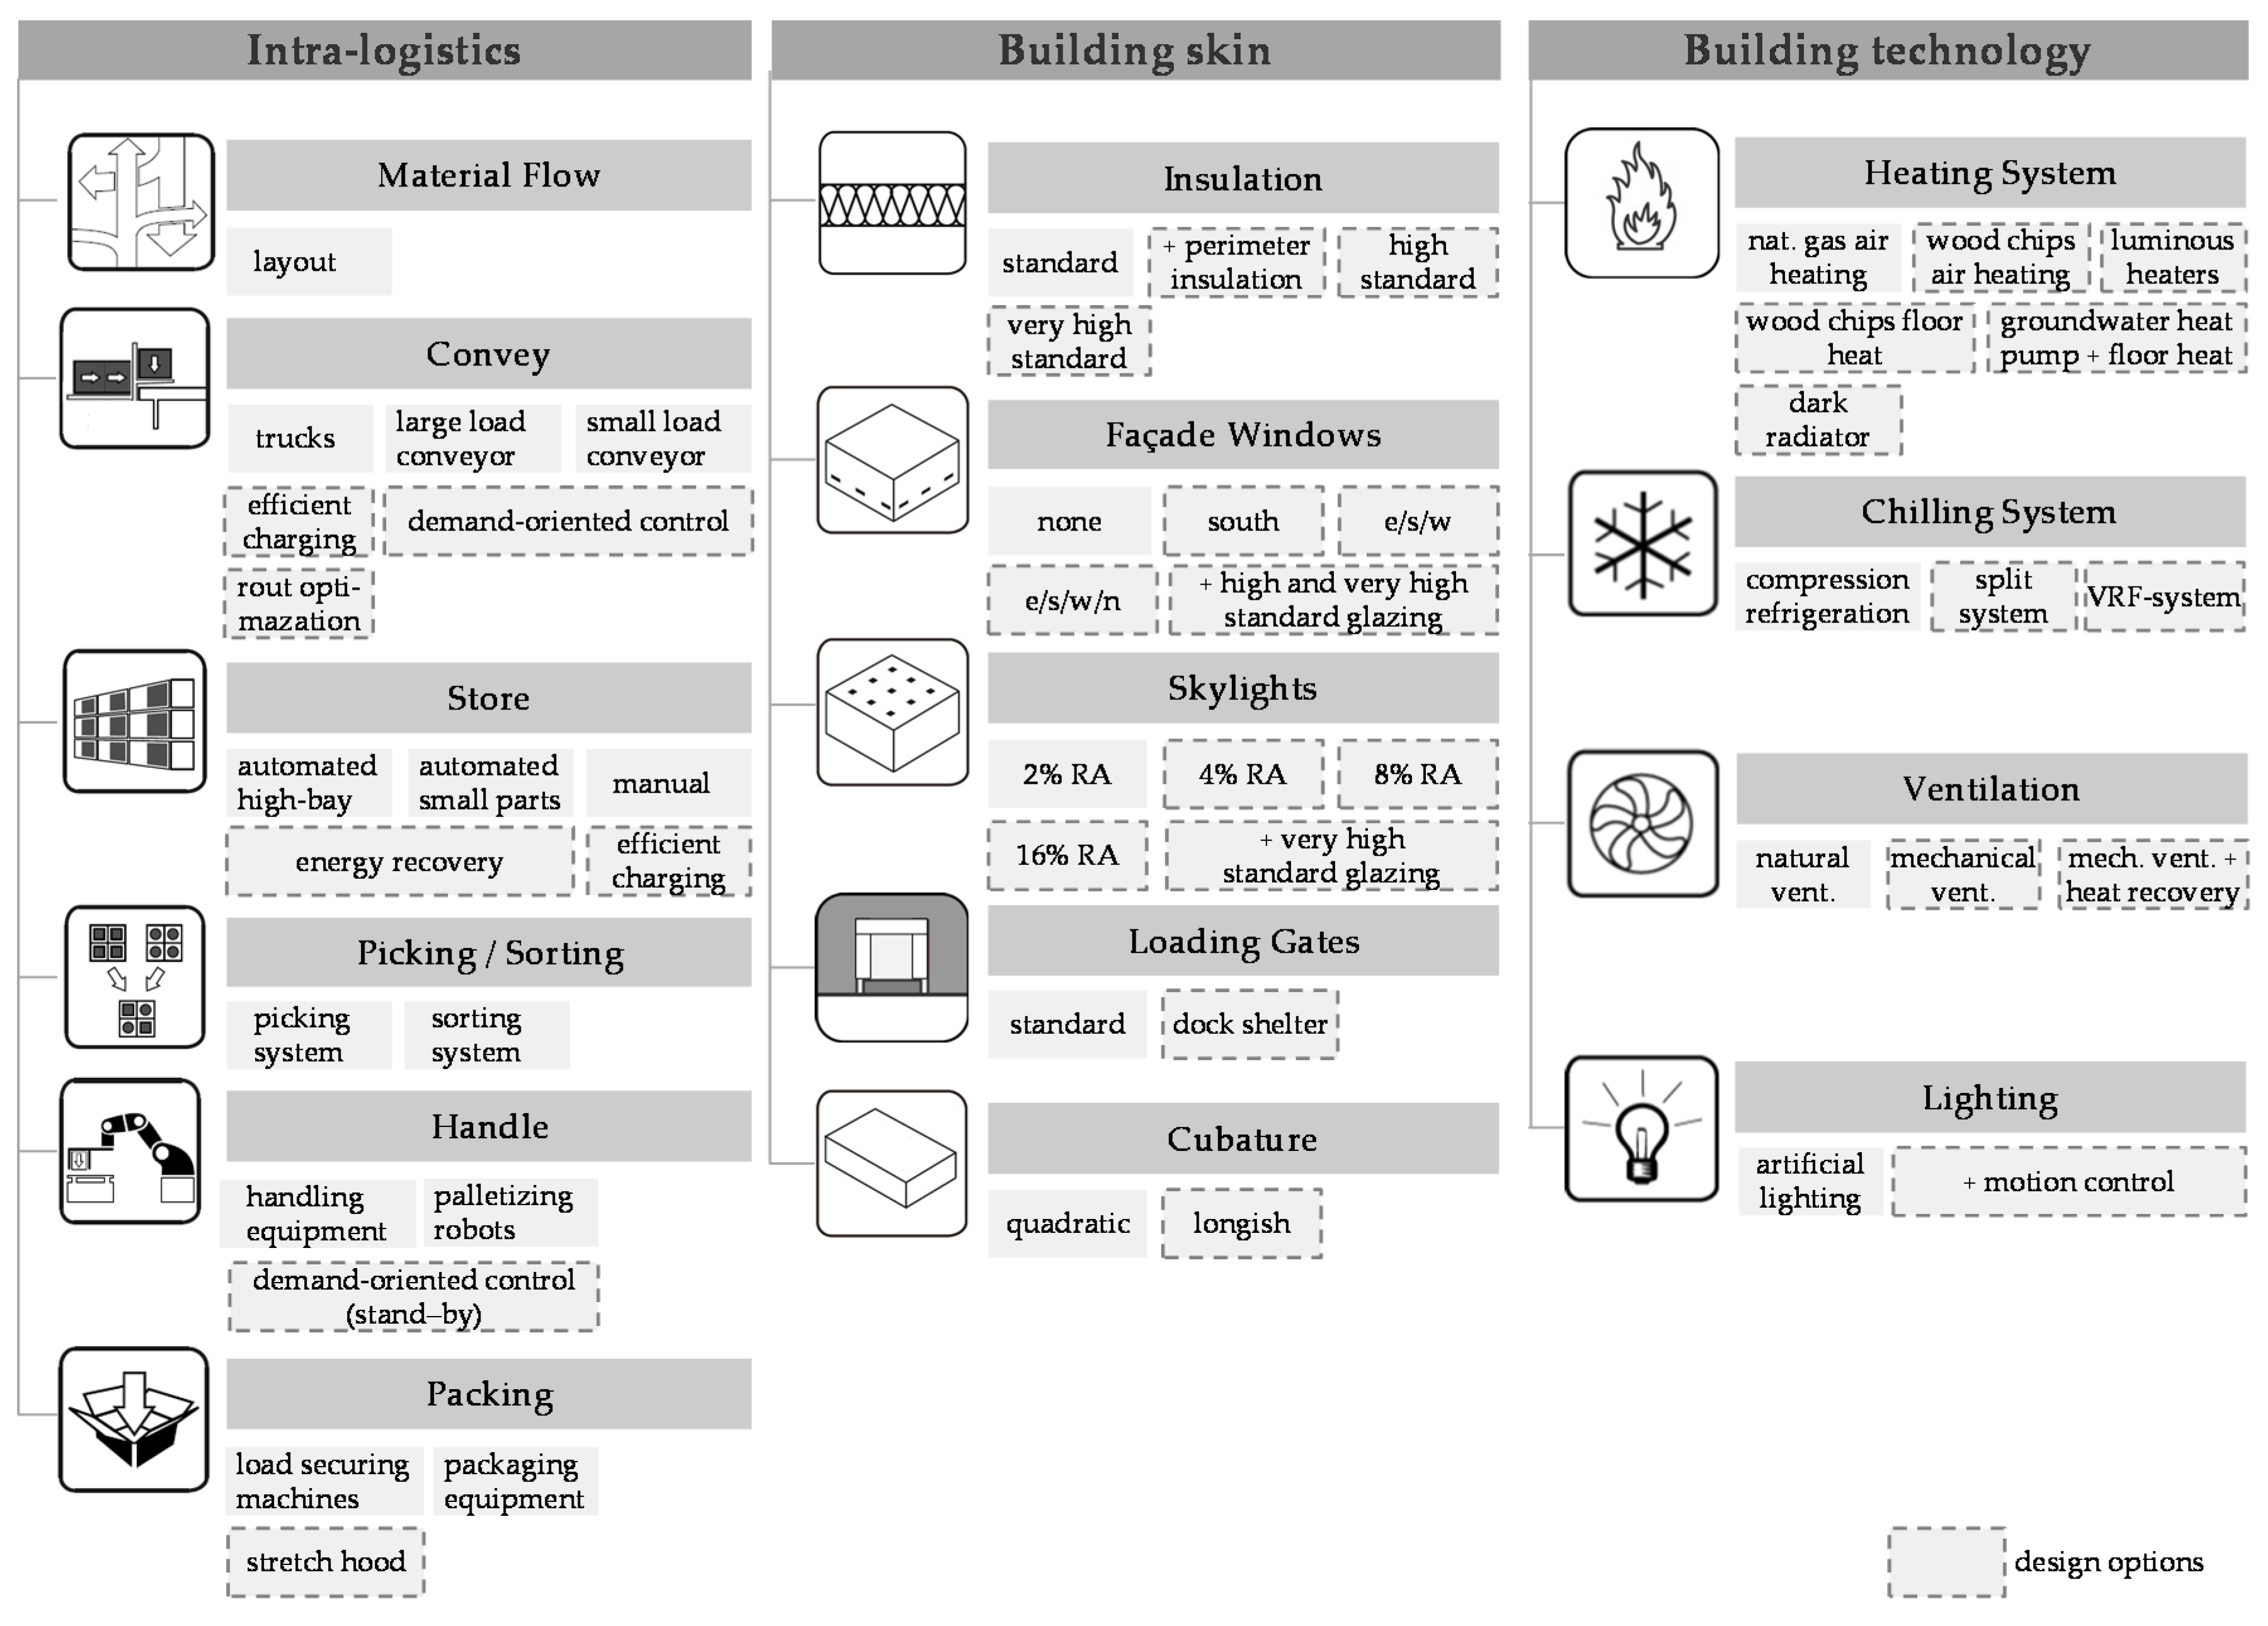
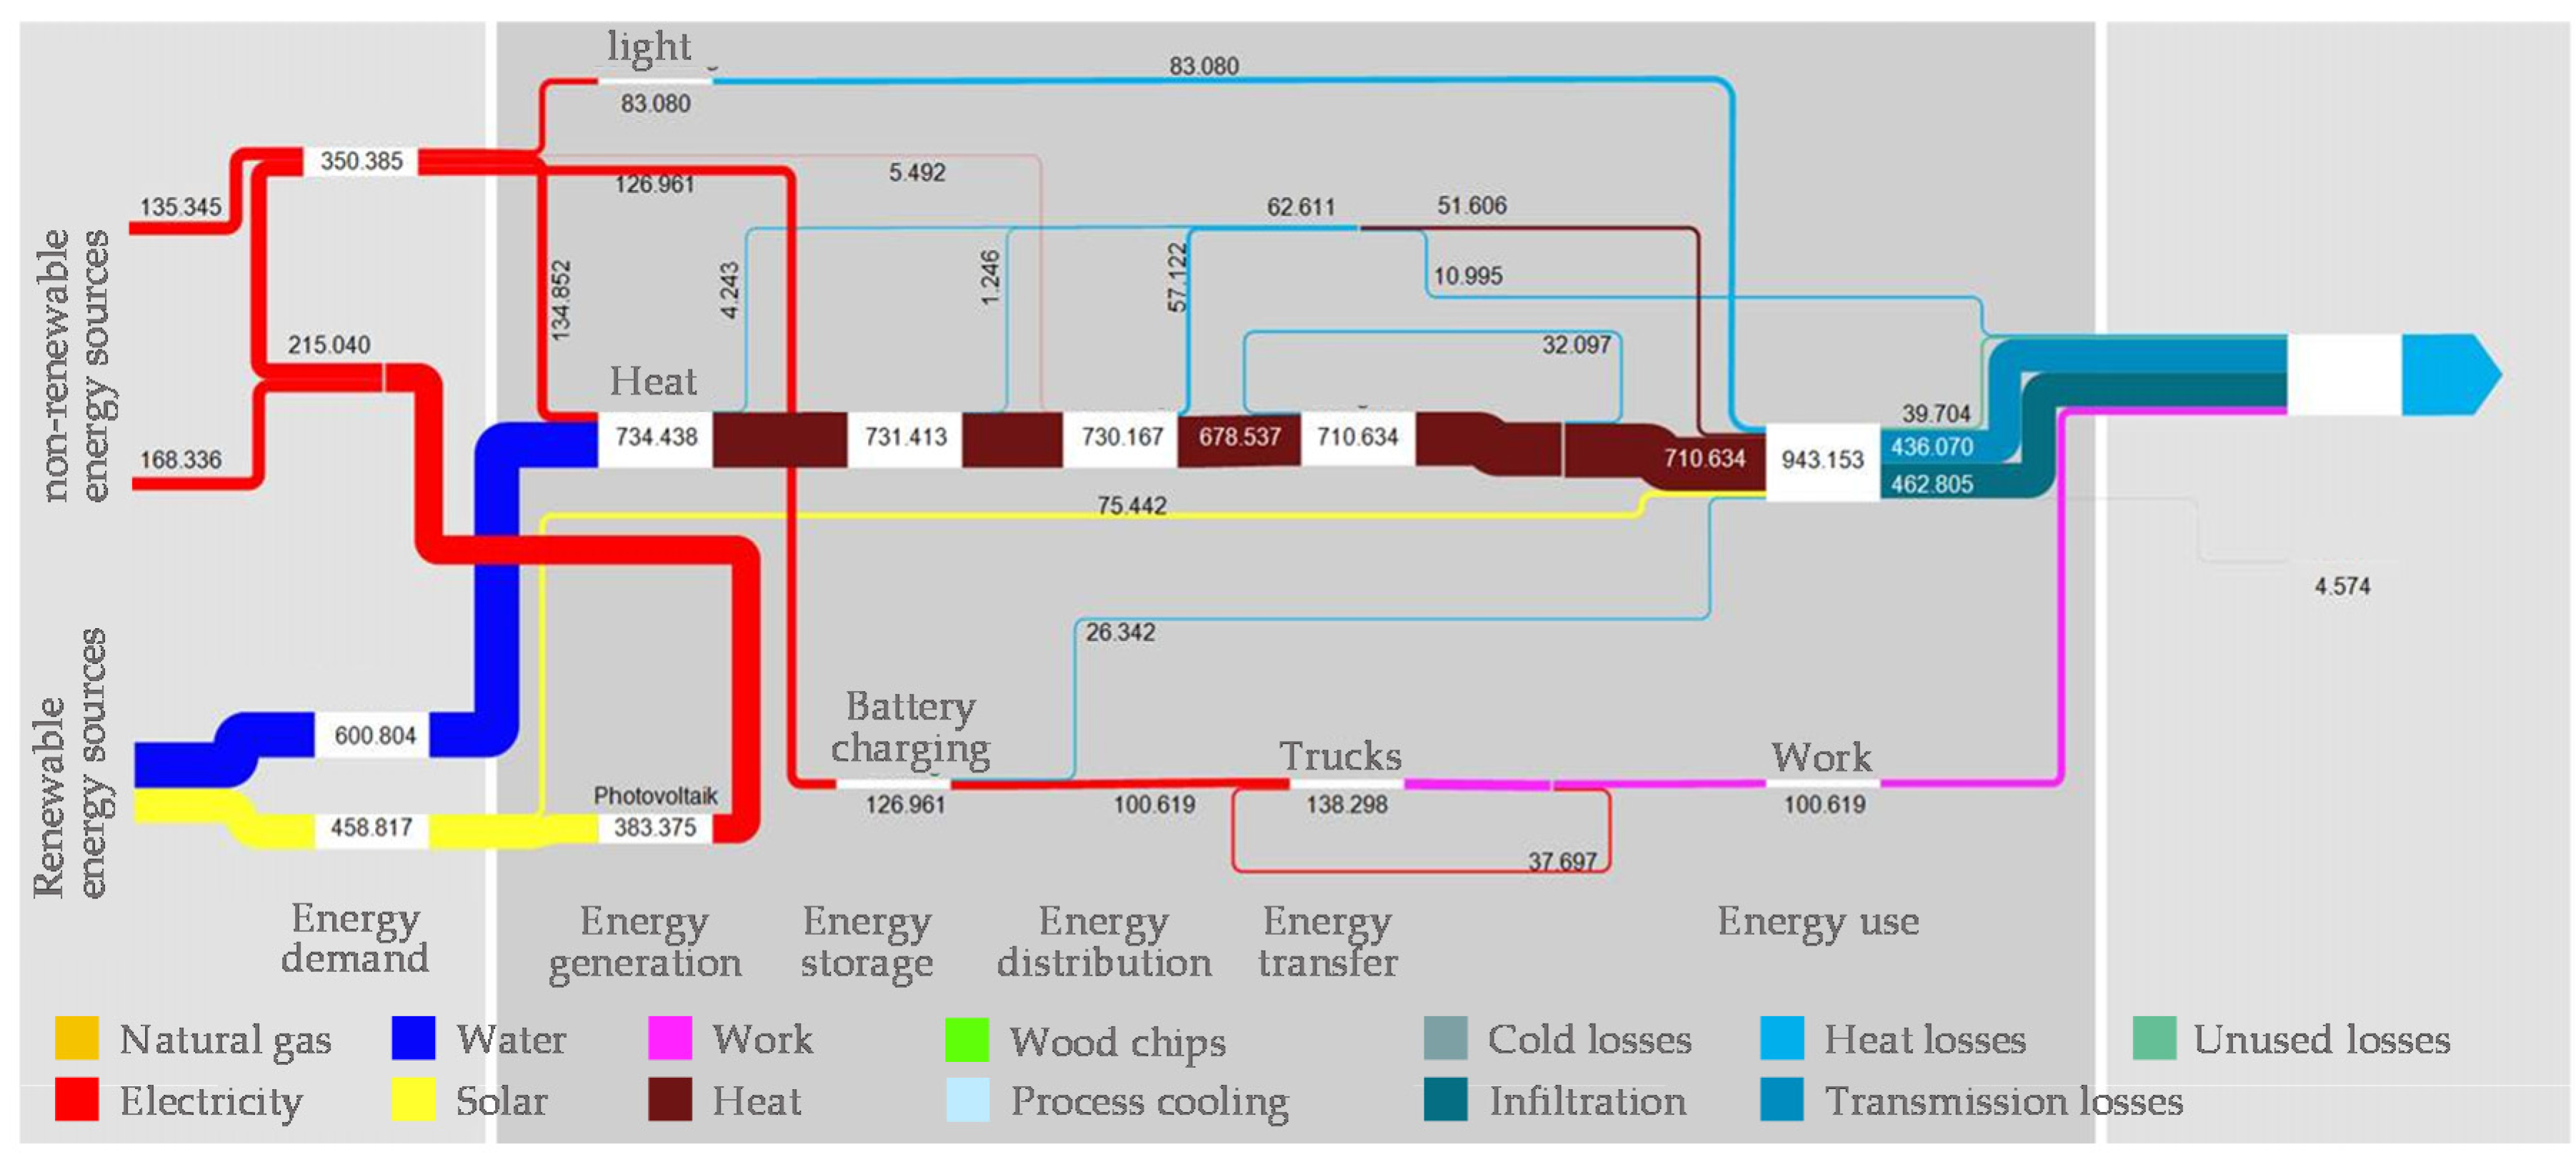
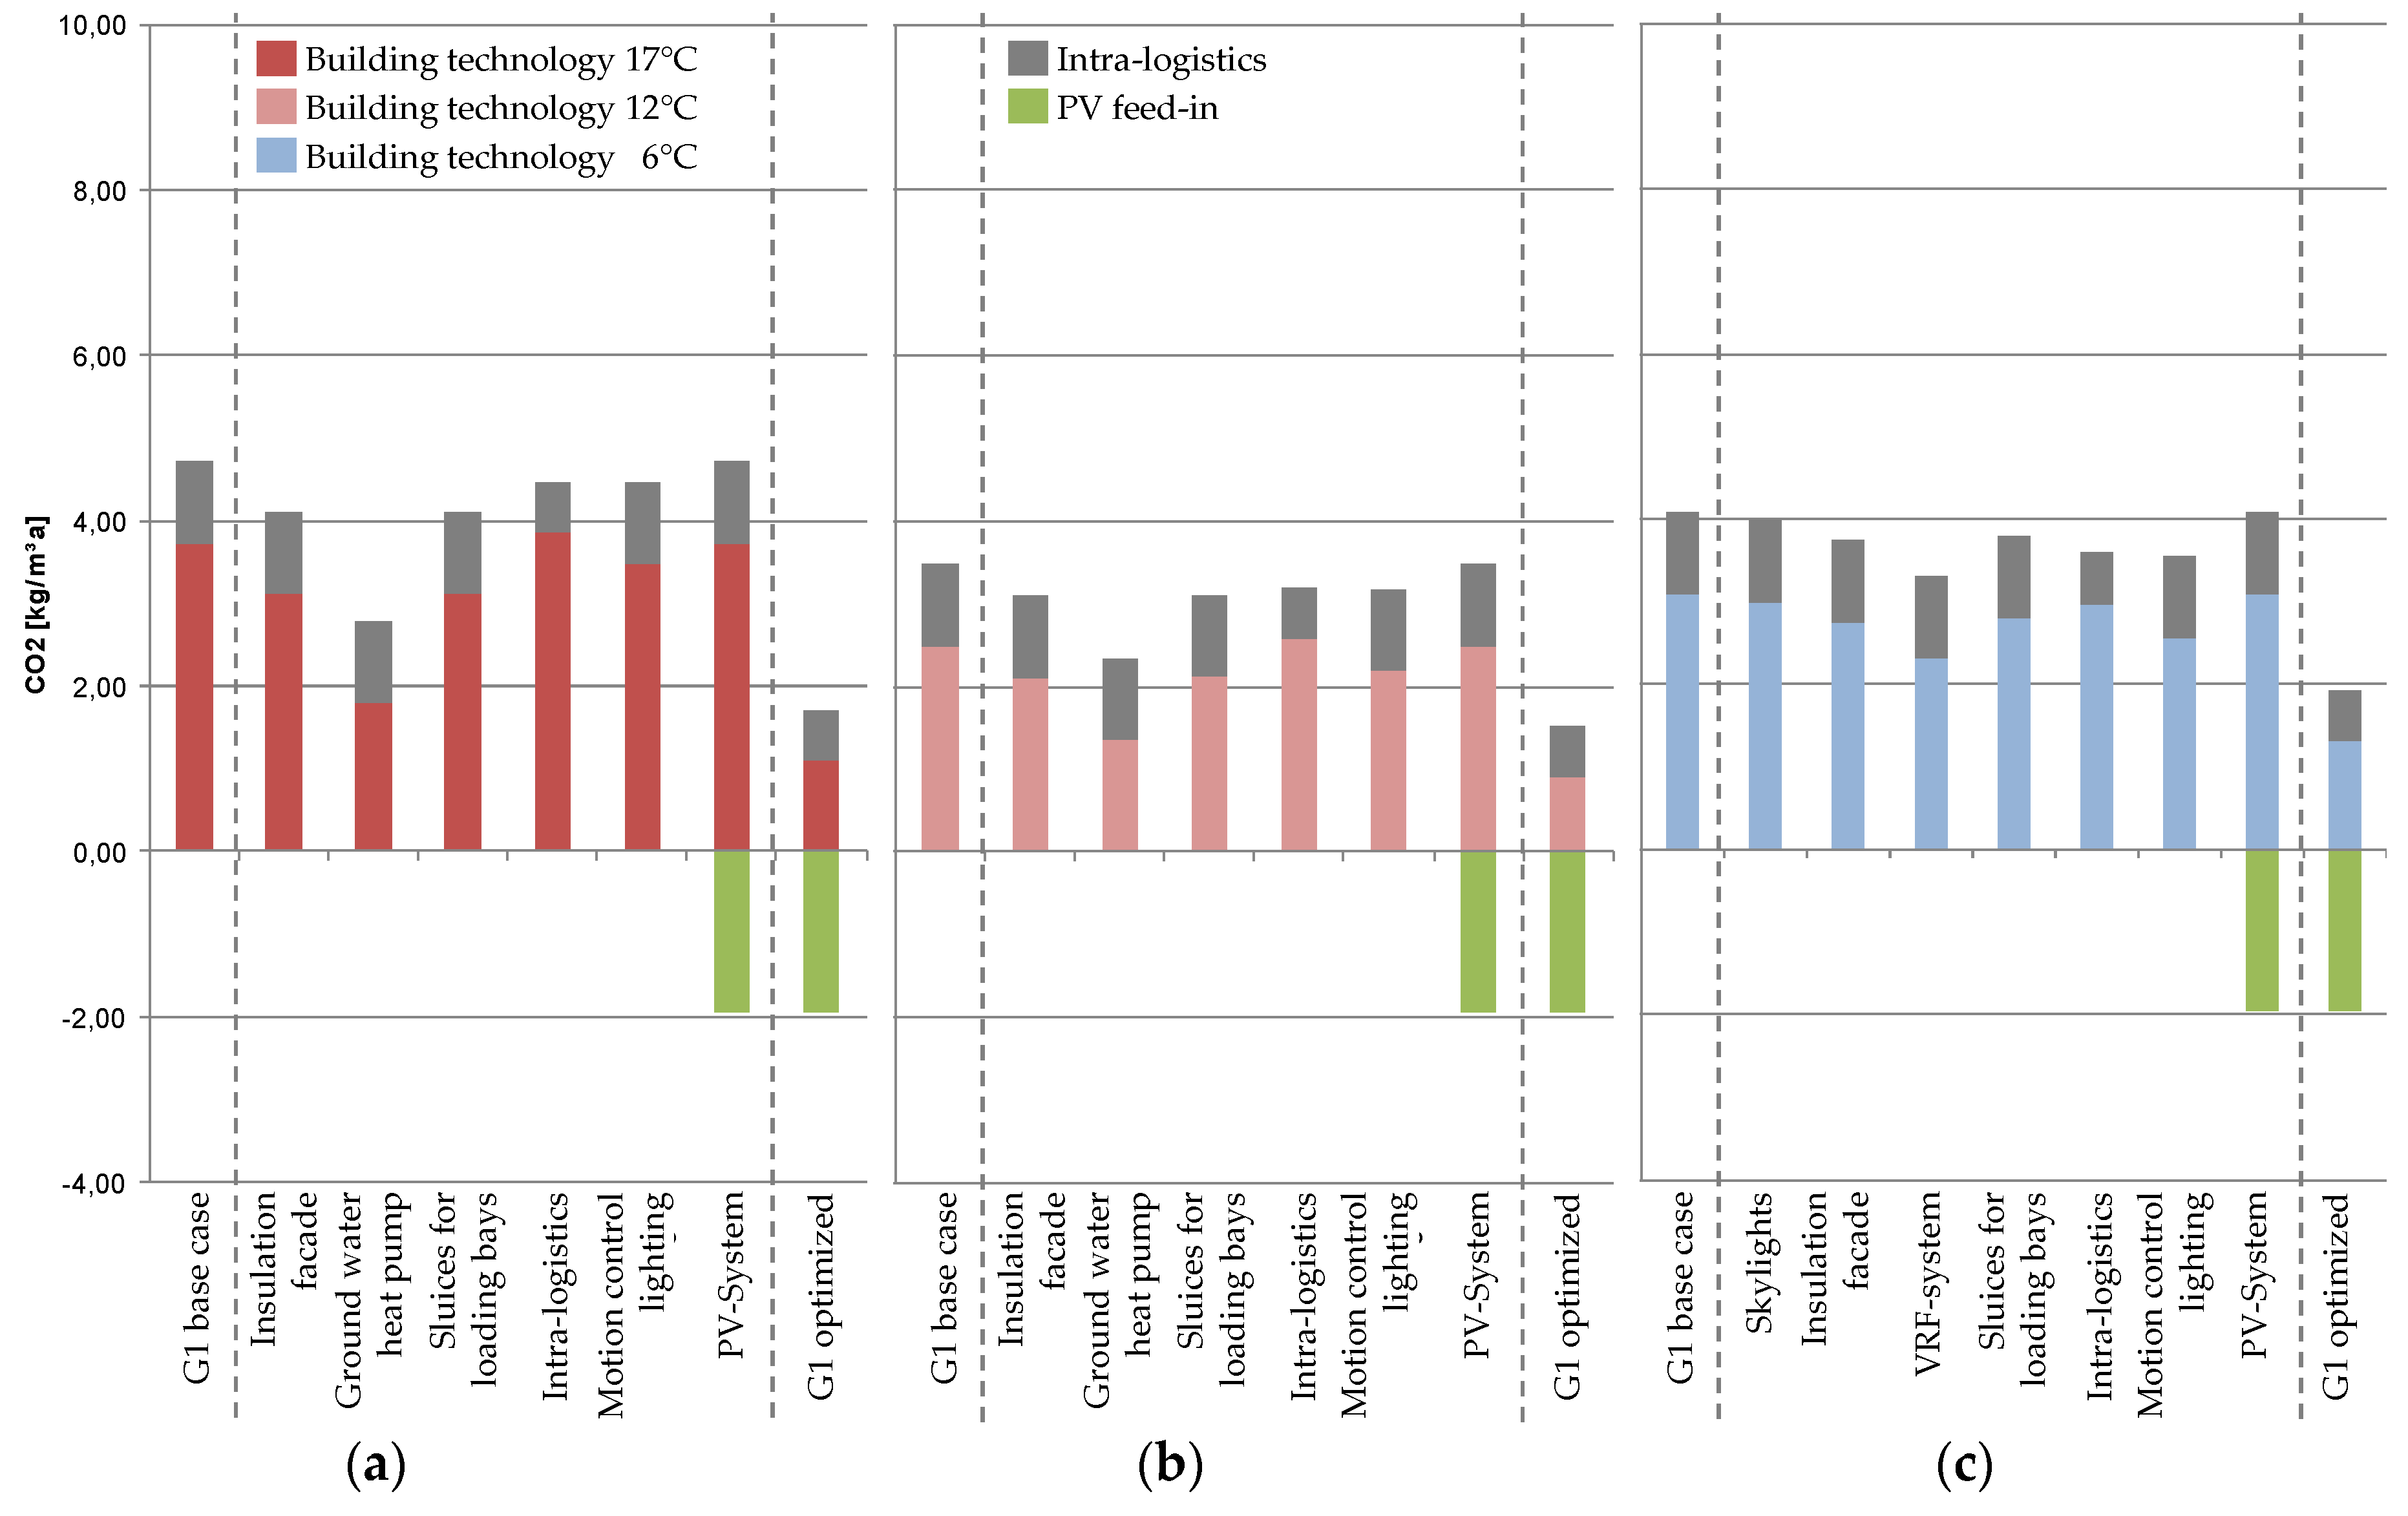
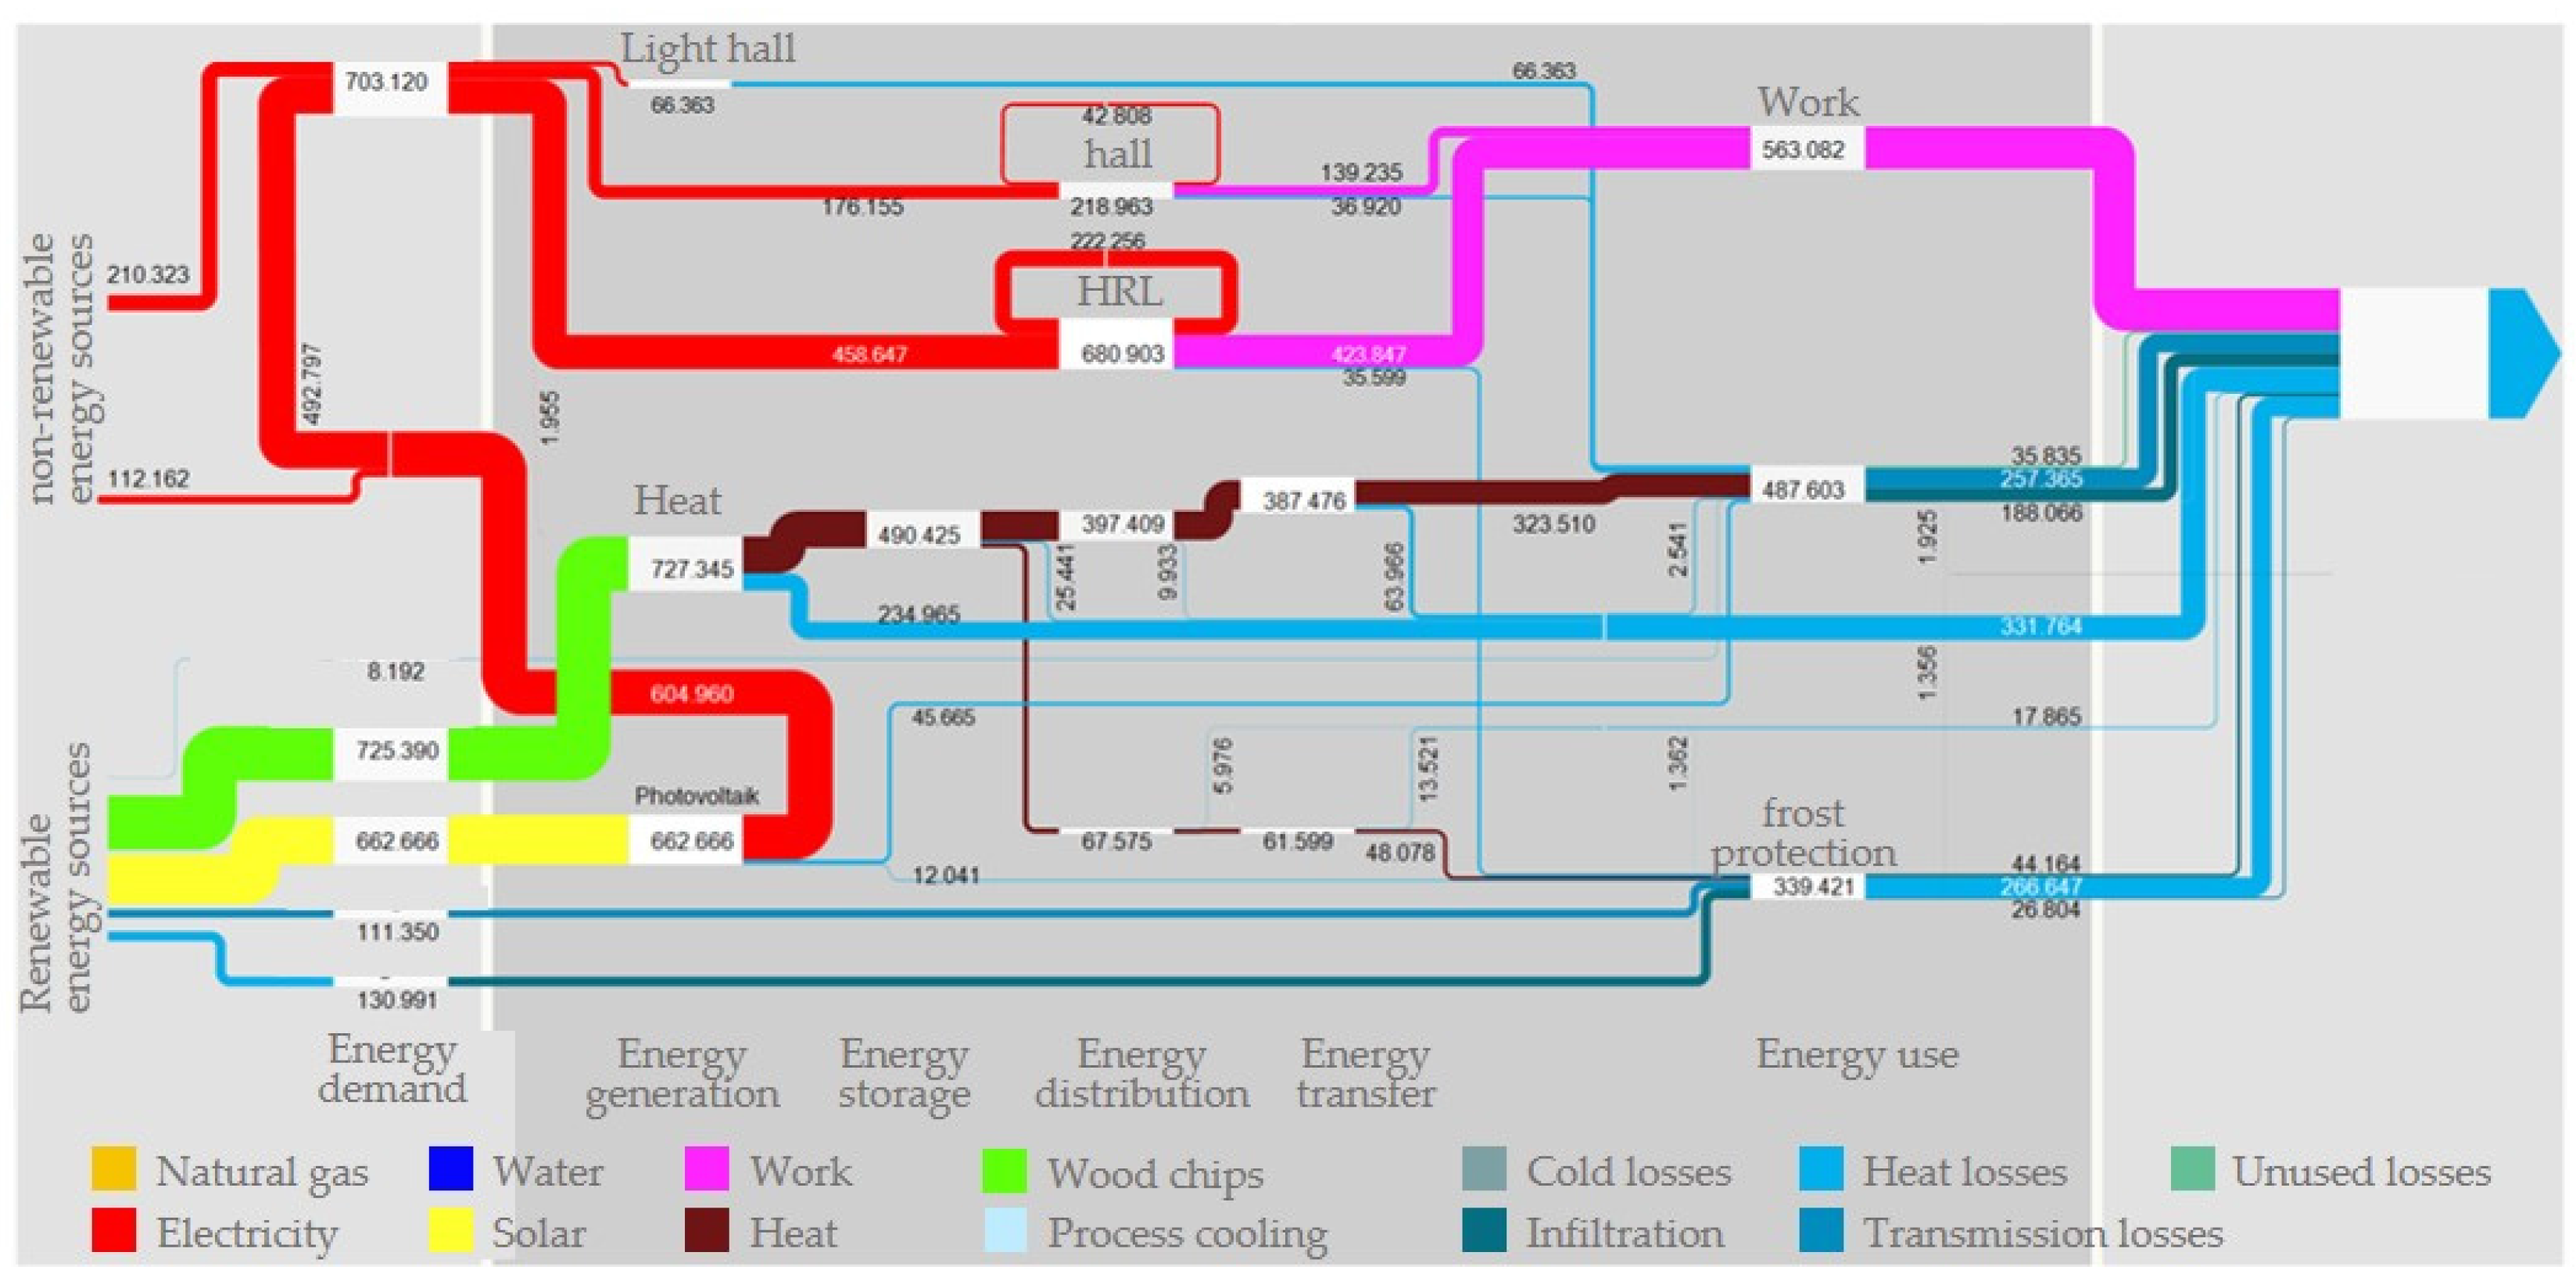
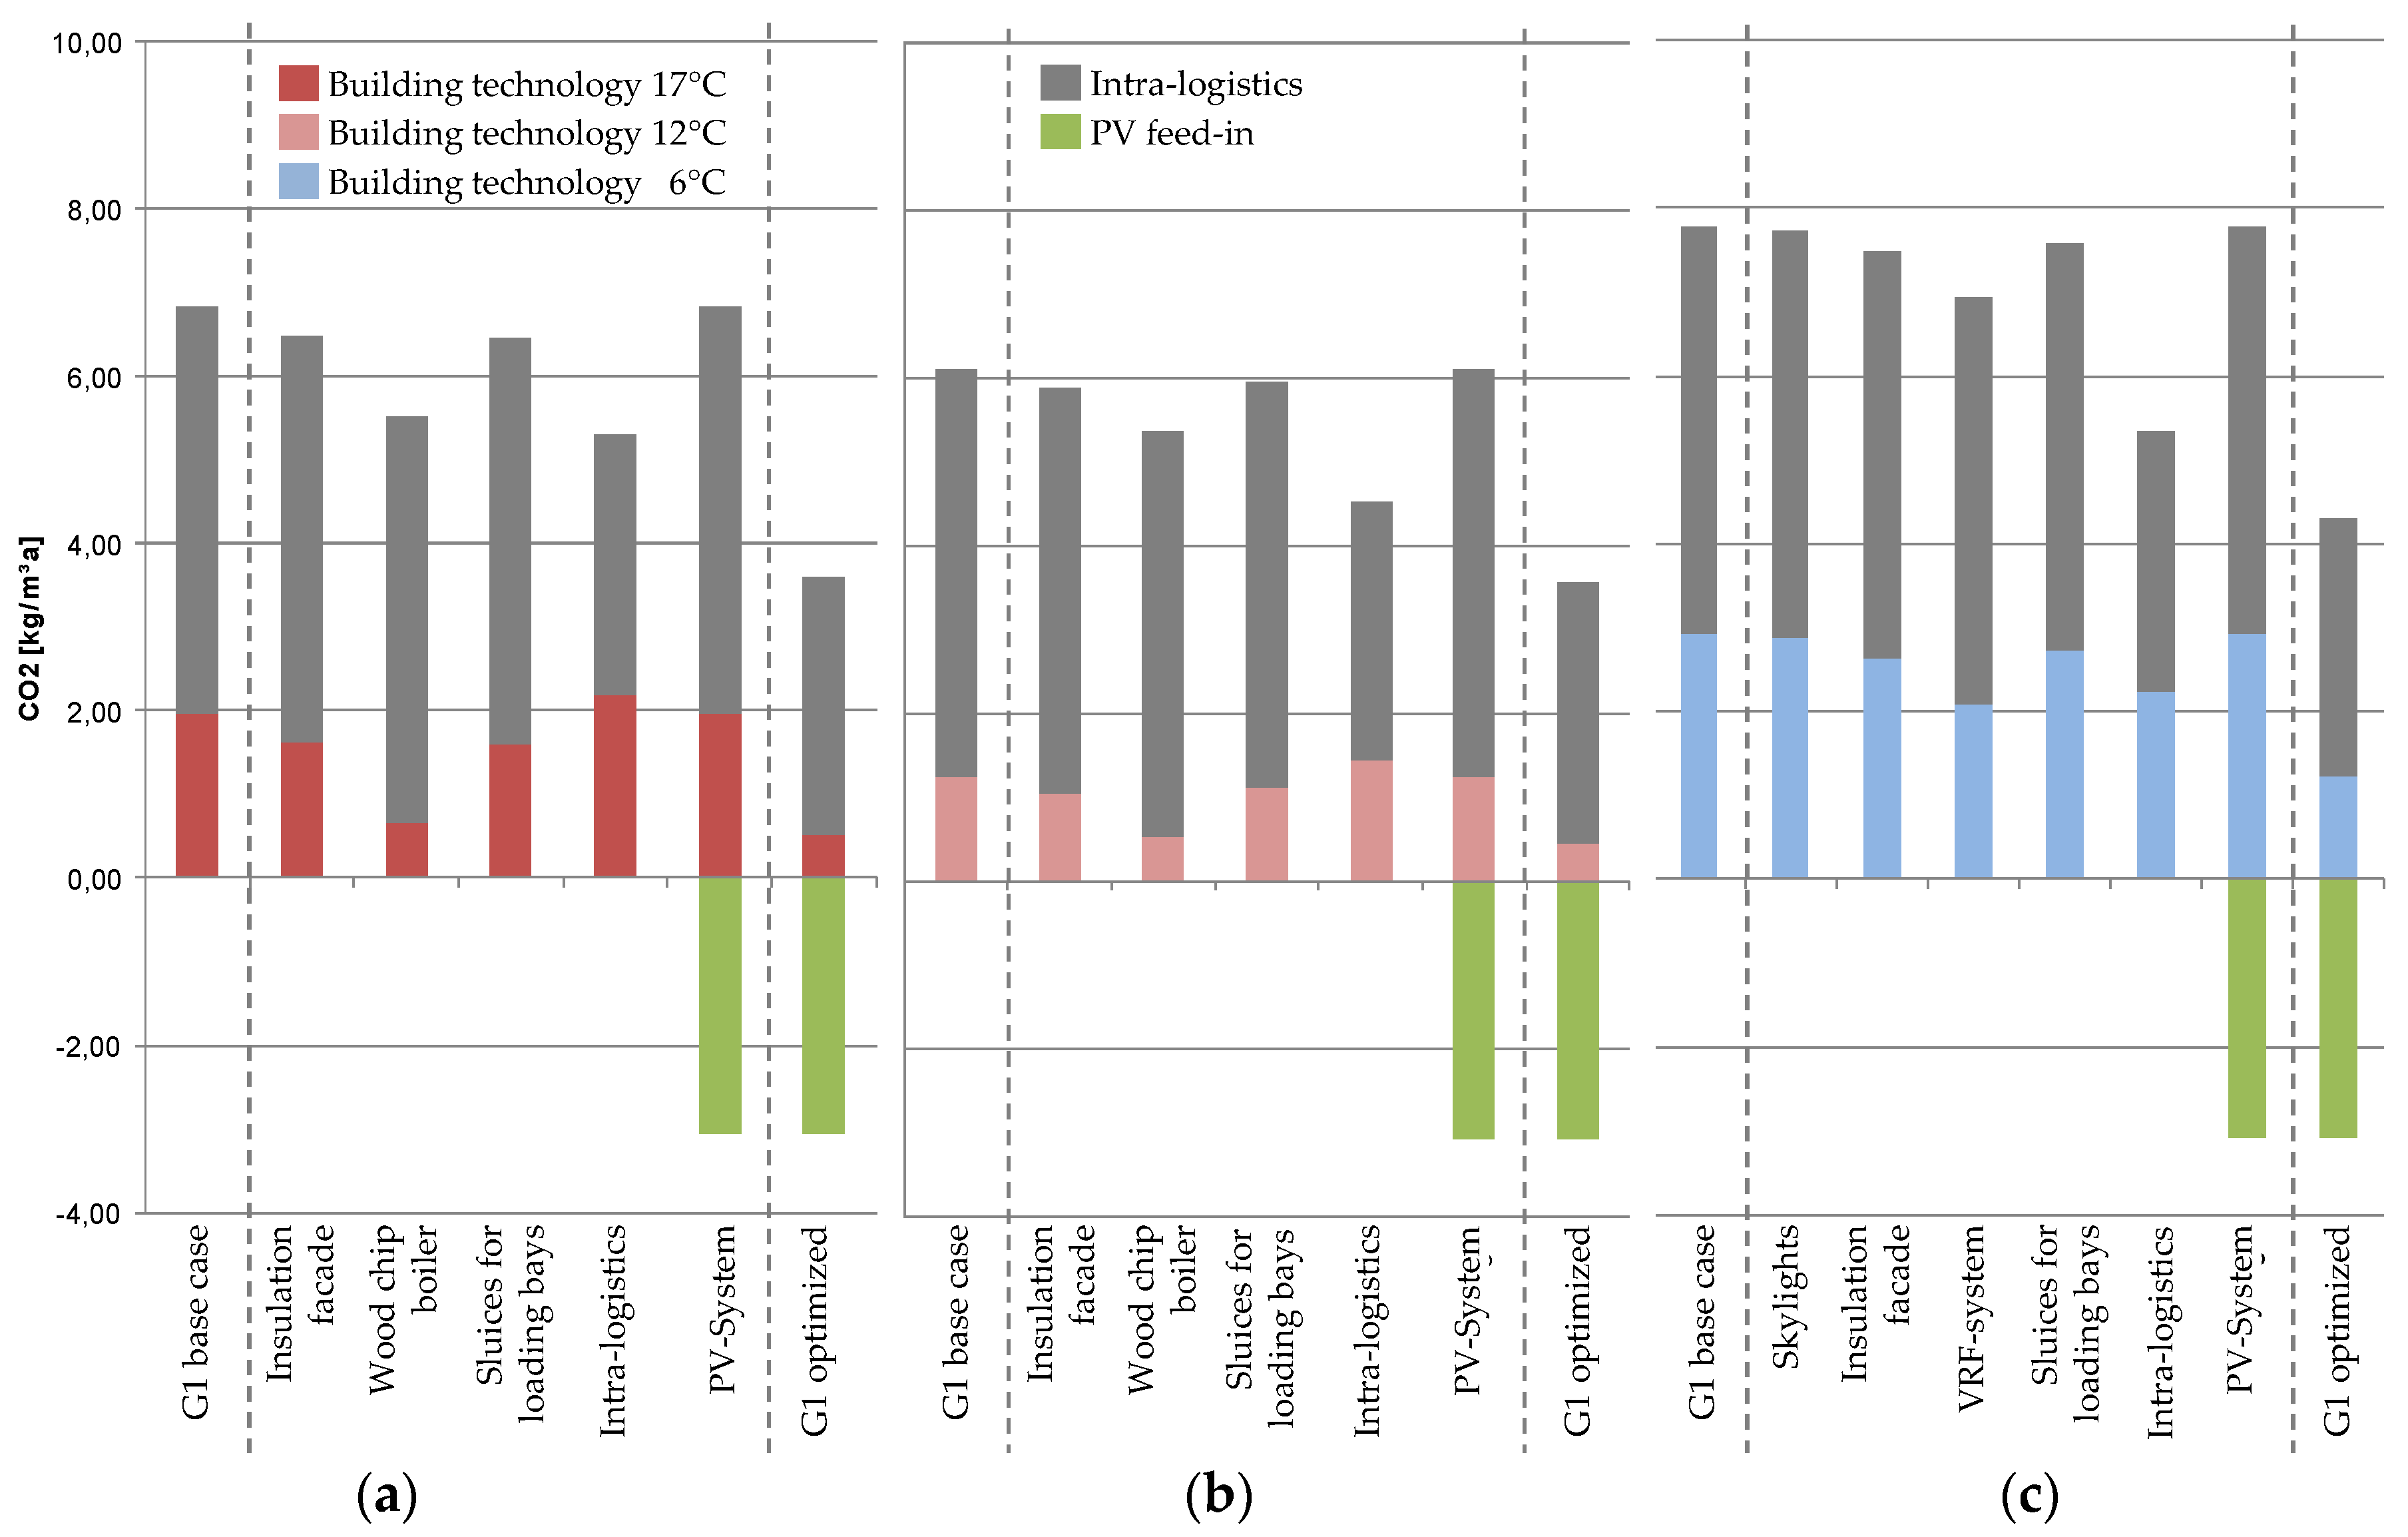
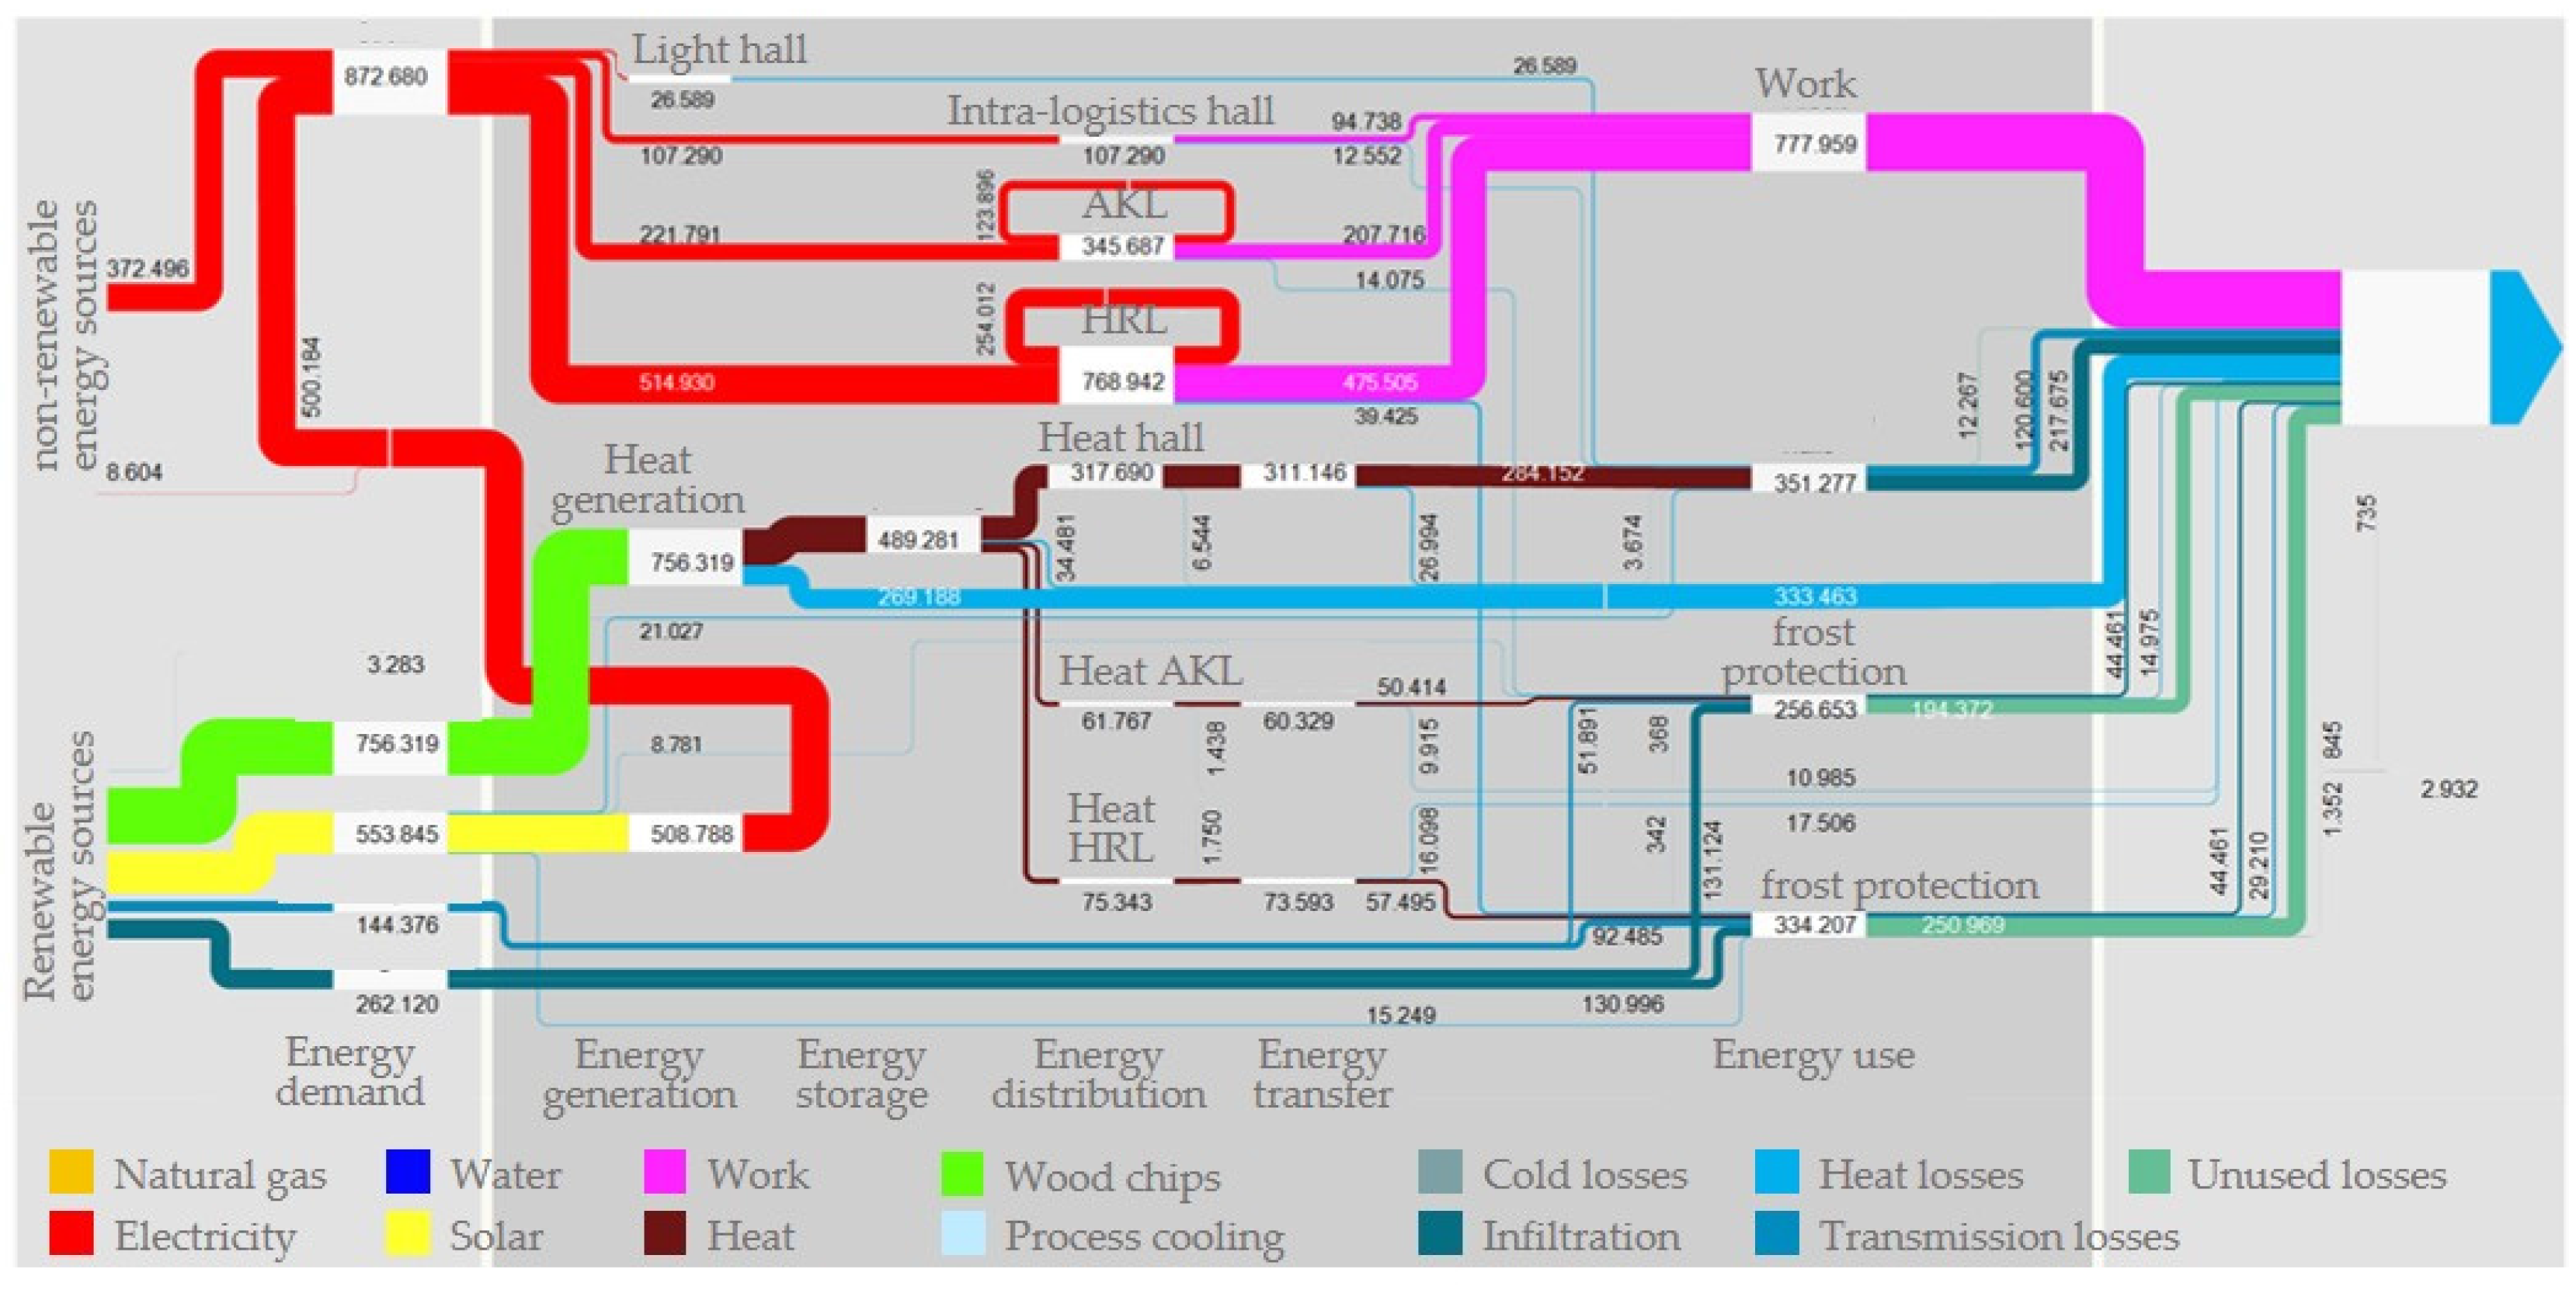


