
Analysis of Land-Use Emergy Indicators Based on Urban Metabolism: A Case Study for Beijing


Abstract
:
1. Introduction
2. Methodology
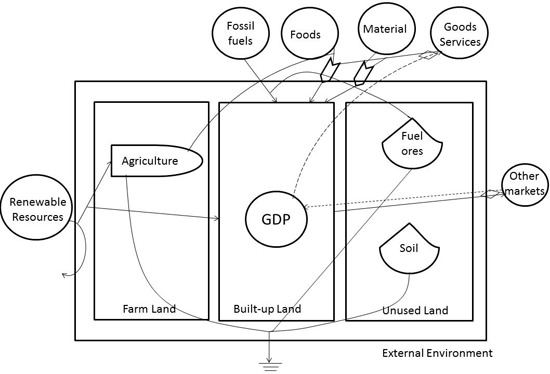
2.1. Conceptual Model of an Urban Metabolic System

2.2. Emergy Accounting
2.3. Emergy-Based Evaluation System of Urban Metabolism

| Indices | Formula | |
|---|---|---|
| Flux(F) | U | |
| Structures | S1 | R/(R + N) |
| S2 | N/U | |
| S3 | IMP/U | |
| Intensity(I) | U/population | |
| Efficiency(E) | GDP/U | |
| Waste Emission Ratio(W) | EW/U | |
2.4. Emergy-Based Evaluation of Land Use
| Indices | Formula |
|---|---|
| Metabolic Density(D) | Ui/Land Area |
| Emergy Yield Ratio(EYR) | Total Land Emergy Output/Total Land Emergy Input |
| Land Environmental Load Ratio(ELR) | (IMP + N)/R |
| Land Emergy Sustainable Indices (ESI) | EYR/ELR |
2.5. Correlation Analysis of Urban Metabolism and Land Use Changes
3. Results
3.1. Emergy-Based Evaluation of the Metabolism of Beijing
| Item | Solar transformity | Solar emergy (×1020 seJ) | ||||||||
|---|---|---|---|---|---|---|---|---|---|---|
| 1996 | 1998 | 2000 | 2002 | 2004 | 2006 | 2008 | 2010 | 2012 | ||
| Renewable sources | ||||||||||
| 1. Sunlight | 1 | 0.72 | 0.72 | 0.72 | 0.72 | 0.72 | 0.72 | 0.72 | 0.72 | 0.72 |
| 2. Wind, kinetic | 2.51 × 10³ | 1.41 | 1.19 | 1.25 | 1.19 | 1.22 | 1.18 | 1.18 | 1.19 | 1.18 |
| 3. Rain, geopotential | 1.74 × 10⁴ | 0.86 | 0.90 | 0.45 | 0.45 | 0.59 | 0.39 | 0.77 | 0.64 | 0.90 |
| 4. Rain, chemical | 3.05 × 10⁴ | 17.33 | 18.09 | 9.18 | 9.16 | 11.95 | 7.86 | 15.49 | 12.92 | 18.13 |
| 5. Earth cycle | 4.70 × 10⁴ | 8.74 | 8.74 | 8.74 | 8.74 | 8.74 | 8.74 | 8.74 | 8.74 | 8.74 |
| 6. Rivers, geopotential | 9.73 × 10⁴ | 5.55 | 5.55 | 5.25 | 4.57 | 7.01 | 5.74 | 11.09 | 6.23 | 15.47 |
| Non-renewable sources | ||||||||||
| 7. Soil losses | 1.70 × 10⁷ | 1.12 | 1.11 | 4.58 | 5.14 | 5.75 | 2.15 | 4.33 | 1.87 | 1.91 |
| Indigenous fossil fuels | ||||||||||
| 8. Coal | 6.69 × 10⁴ | 198.03 | 194.11 | 135.29 | 172.54 | 209.80 | 186.27 | 113.72 | 98.04 | 96.07 |
| Indigenous material input | ||||||||||
| 9. Limestone | 1.68 × 10⁹ | 134.23 | 157.02 | 185.25 | 198.02 | 271.98 | 284.78 | 497.81 | 234.98 | 206.82 |
| 10. Steel | 3.16 × 10⁹ | 261.96 | 253.34 | 253.88 | 258.15 | 274.37 | 258.53 | 207.55 | 250.95 | 91.51 |
| 11. Pig iron | 1.44 × 10⁹ | 100.08 | 108.04 | 111.35 | 111.29 | 115.47 | 113.44 | 64.63 | 59.33 | 0.00 |
| 12. Electricity | 1.74 × 10⁵ | 13.26 | 17.05 | 17.05 | 1.89 | 1.89 | 1.89 | 1.89 | 5.68 | 9.47 |
| Imports and outside sources | ||||||||||
| 13. Agricultural production | 1.43 × 10⁵ | 111.40 | 113.54 | 106.65 | 101.94 | 115.24 | 140.97 | 145.16 | 158.61 | 152.85 |
| 14. Livestock production | 9.15 × 10⁵ | 62.22 | 107.97 | 80.52 | 93.72 | 14.55 | 12.91 | 20.79 | 11.97 | 51.74 |
| 15. Fisheries production | 3.36 × 10⁶ | 6.52 | 32.26 | 31.01 | 22.85 | 17.46 | 12.50 | 7.18 | 9.83 | 8.40 |
| 16. Coal | 6.69 × 10⁴ | 435.28 | 403.91 | 462.73 | 417.63 | 462.73 | 550.96 | 507.82 | 523.51 | 447.04 |
| 17. Coke | 1.10 × 10⁵ | 56.37 | 37.58 | 34.45 | 31.32 | 56.37 | 40.71 | 25.05 | 25.05 | 9.40 |
| 18. Crude oil | 9.08 × 10⁴ | 262.70 | 244.83 | 288.17 | 281.33 | 44.48 | 480.16 | 439.48 | 418.19 | 409.44 |
| 19. Gasoline | 1.05 × 10⁵ | 27.62 | 30.79 | 31.70 | 0.00 | 0.00 | 73.81 | 74.26 | 93.73 | 112.75 |
| 20. Kerosene | 1.10 × 10⁵ | 51.71 | 54.08 | 74.95 | 83.49 | 115.74 | 131.87 | 185.48 | 198.76 | 231.02 |
| 21. Diesel | 1.10 × 10⁵ | 20.20 | 10.80 | 26.78 | 0.00 | 66.24 | 69.99 | 77.04 | 82.68 | 85.03 |
| 22. Fuel oil | 1.10 × 10⁵ | 40.53 | 14.74 | 8.29 | 5.53 | 8.29 | 6.91 | 14.74 | 30.86 | 37.30 |
| 23. Liquefied petroleum gas | 1.11 × 10⁵ | 0.00 | 0.00 | 0.00 | 0.00 | 4.46 | 6.69 | 12.83 | 7.81 | 7.81 |
| 24. Natural gas | 9.85 × 10⁵ | 5.75 | 14.57 | 42.08 | 78.55 | 103.56 | 147.21 | 232.58 | 287.78 | 354.71 |
| Exports | ||||||||||
| 25. Chemical fertilizer | 2.67 × 10⁷ | 0.05 | 0.05 | 0.05 | 0.04 | 0.04 | 0.04 | 0.04 | 0.04 | 0.04 |
| 26. Plastic | 5.39 × 10⁹ | 0.63 | 0.52 | 0.53 | 0.67 | 0.53 | 0.59 | 0.77 | 0.73 | 0.72 |
| 27. Pesticides | 2.49 × 10¹⁰ | 2.85 | 1.27 | 1.35 | 1.17 | 1.33 | 1.16 | 0.96 | 0.99 | 0.98 |
| 28. Electricity | 1.74 × 10⁵ | 269.07 | 318.34 | 377.08 | 488.87 | 587.41 | 678.36 | 875.43 | 1072.49 | 1184.29 |
| 29. Goods in imports | 5.00 × 10¹² | 1059.95 | 999.65 | 1871.55 | 1994.55 | 3700.30 | 6004.15 | 10,712.90 | 12,311.10 | 17,423.75 |
| 30. Services in imports | 5.00 × 10¹² | 118.77 | 176.19 | 333.38 | 547.09 | 922.19 | 1493.96 | 2537.40 | 4298.47 | 7359.51 |
| 31. Foreign investment | 4.00 × 10¹² | 6.88 | 8.67 | 6.74 | 7.17 | 12.34 | 18.21 | 24.33 | 25.46 | 32.17 |
| 32. Agricultural production | 1.43 × 10⁵ | 7.31 | 10.83 | 6.22 | 6.10 | 4.62 | 1.73 | 1.95 | 15.85 | 10.70 |
| 33. Livestock production | 9.15 × 10⁵ | 3.78 | 1.17 | 1.85 | 0.35 | 0.43 | 0.33 | 0.23 | 0.26 | 0.08 |
| 34. Fisheries production | 3.36 × 10⁶ | 1.44 | 3.12 | 4.84 | 5.48 | 6.55 | 2.53 | 1.80 | 1.97 | 1.68 |
| 35. Coal | 6.69 × 10⁴ | 103.92 | 84.31 | 84.31 | 101.96 | 107.84 | 137.25 | 105.88 | 98.04 | 105.88 |
| 36. Coke | 1.10 × 10⁵ | 25.05 | 12.53 | 34.45 | 40.71 | 28.19 | 194.17 | 9.40 | 25.05 | 18.79 |
| 37. Gasoline | 1.05 × 10⁵ | 53.43 | 48.45 | 35.32 | 38.04 | 33.51 | 38.94 | 18.11 | 40.30 | 41.20 |
| 38. Kerosene | 1.10 × 10⁵ | 16.13 | 17.55 | 21.82 | 23.24 | 34.63 | 46.96 | 77.80 | 66.89 | 73.05 |
| 39. Diesel | 1.10 × 10⁵ | 43.22 | 3.76 | 71.87 | 61.54 | 86.43 | 88.78 | 139.52 | 135.76 | 131.06 |
| 40. Fuel oil | 1.10 × 10⁵ | 15.66 | 0.00 | 2.76 | 7.37 | 7.37 | 12.43 | 13.82 | 16.12 | 12.90 |
| 41. Liquefied petroleum gas | 1.11 × 10⁵ | 2.79 | 2.79 | 4.46 | 3.35 | 4.46 | 12.27 | 3.90 | 2.23 | 1.67 |
| 42. Goods in exports | 1.14 × 10¹³ | 925.68 | 1198.48 | 1364.47 | 1438.00 | 2344.87 | 4326.76 | 6549.76 | 6320.05 | 6798.05 |
| 43. Services in exports | 1.14 × 10¹³ | 103.73 | 211.24 | 243.06 | 394.43 | 584.39 | 1076.59 | 1551.34 | 2206.67 | 2871.38 |
| Waste | ||||||||||
| 44. Liquid waste | 9.87 × 10⁶ | 12.96 | 13.20 | 15.20 | 16.50 | 17.30 | 18.50 | 17.80 | 20.61 | 21.20 |
| 45. Solid Waste | 1.80 × 10⁶ | 0.07 | 0.07 | 0.07 | 0.06 | 0.08 | 0.08 | 0.07 | 0.08 | 0.07 |
| Index | Value | ||||||||
|---|---|---|---|---|---|---|---|---|---|
| 1996 | 1998 | 2000 | 2002 | 2004 | 2006 | 2008 | 2010 | 2012 | |
| F a | 3.28 | 3.34 | 4.51 | 4.93 | 7.14 | 10.74 | 16.82 | 20.24 | 28.36 |
| S1 | 4.66% | 4.59% | 3.49% | 3.22% | 3.32% | 2.83% | 4.09% | 4.47% | 10.01% |
| S2 | 21.59% | 21.91% | 15.68% | 15.16% | 12.31% | 7.88% | 5.29% | 3.22% | 1.43% |
| S3 | 77.35% | 77.04% | 83.75% | 84.34% | 87.27% | 91.89% | 94.48% | 96.63% | 98.41% |
| I b | 2.61 | 2.68 | 3.32 | 3.46 | 4.79 | 6.79 | 9.92 | 10.32 | 13.71 |
| E c | 6.56 | 8.61 | 8.47 | 10.58 | 10.20 | 9.55 | 9.51 | 10.30 | 9.99 |
| W | 0.40% | 0.40% | 0.34% | 0.34% | 0.24% | 0.17% | 0.11% | 0.10% | 0.07% |
3.2. Analysis of Land Use Change

3.3. Emergy-Based Indices for Land Use Analysis
3.3.1. Emergy-Based Evaluation of the Whole Urban Area
| Indices | Value | ||||||||
|---|---|---|---|---|---|---|---|---|---|
| 1996 | 1998 | 2000 | 2002 | 2004 | 2006 | 2008 | 2010 | 2012 | |
| D | 2.00 × 10¹³ | 2.03 × 10¹³ | 2.75 × 10¹³ | 3.00 × 10¹³ | 4.35 × 10¹³ | 6.55 × 10¹³ | 1.03 × 10¹⁴ | 1.23 × 10¹⁴ | 1.73 × 10¹⁴ |
| EYR | 0.51 | 0.60 | 0.51 | 0.53 | 0.52 | 0.59 | 0.53 | 0.46 | 0.37 |
| ELR | 93.84 | 93.81 | 175.25 | 197.42 | 235.24 | 435.16 | 441.90 | 663.98 | 627.34 |
| ESI | 5.45 × 10⁻³ | 6.37 × 10⁻³ | 2.92 × 10⁻³ | 2.70 × 10⁻³ | 2.23 × 10⁻³ | 1.36 × 10⁻³ | 1.20 × 10⁻³ | 6.96 × 10⁻⁴ | 5.89 × 10⁻⁴ |
3.3.2. Emergy-Based Evaluation of Farm Land
| Index | Value | ||||||||
|---|---|---|---|---|---|---|---|---|---|
| 1996 | 1998 | 2000 | 2002 | 2004 | 2006 | 2008 | 2010 | 2012 | |
| Industrial energy input (seJ) | 6.49 × 10²⁰ | 5.32 × 10²⁰ | 5.65 × 10²⁰ | 4.99 × 10²⁰ | 5.15 × 10²⁰ | 4.76 × 10²⁰ | 3.89 × 10²⁰ | 3.60 × 10²⁰ | 3.57 × 10²⁰ |
| Industrial energy input per unit area (seJ/m2) | 5.71 × 10¹⁰ | 4.69 × 10¹⁰ | 5.01 × 10¹⁰ | 4.46 × 10¹⁰ | 4.65 × 10¹⁰ | 4.31 × 10¹⁰ | 3.55 × 10¹⁰ | 3.29 × 10¹⁰ | 3.28 × 10¹⁰ |
| D | 4.24 × 10¹¹ | 3.74 × 10¹¹ | 3.75 × 10¹¹ | 3.92 × 10¹¹ | 4.34 × 10¹¹ | 4.18 × 10¹¹ | 6.15 × 10¹¹ | 6.38 × 10¹¹ | 8.06 × 10¹¹ |
| EYR | 7.79 | 9.42 | 10.17 | 11.56 | 10.48 | 9.22 | 6.49 | 6.18 | 4.75 |
| ELR | 1.40 | 1.07 | 2.02 | 2.17 | 2.06 | 2.63 | 2.76 | 3.32 | 3.46 |
| ESI | 5.58 | 8.81 | 5.03 | 5.32 | 5.07 | 3.50 | 2.36 | 1.86 | 1.37 |
3.3.3. Emergy-Based Evaluation of Built-up Land
| Index | Value | ||||||||
|---|---|---|---|---|---|---|---|---|---|
| 1996 | 1998 | 2000 | 2002 | 2004 | 2006 | 2008 | 2010 | 2012 | |
| Energy Emergy Consumption (seJ) | 9.90 × 10²² | 1.13 × 10²³ | 1.26 × 10²³ | 1.38 × 10²³ | 1.59 × 10²³ | 1.74 × 10²³ | 2.14 × 10²³ | 2.43 × 10²³ | 2.57 × 10²³ |
| Unit Energy Consumption (seJ/m2) | 3.65 × 10¹³ | 4.09 × 10¹³ | 4.32 × 10¹³ | 4.48 × 10¹³ | 4.95 × 10¹³ | 5.31 × 10¹³ | 6.34 × 10¹³ | 6.92 × 10¹³ | 7.23 × 10¹³ |
| Cement Emergy Consumption (seJ) | 1.01 × 10²² | 1.18 × 10²² | 1.39 × 10²² | 1.49 × 10²² | 2.04 × 10²² | 2.14 × 10²² | 3.73 × 10²² | 1.76 × 10²² | 1.55 × 10²² |
| Unit Cement Consumption (seJ/m2) | 3.72 × 10¹² | 4.26 × 10¹² | 4.75 × 10¹² | 4.81 × 10¹² | 6.37 × 10¹² | 6.53 × 10¹² | 1.11 × 10¹³ | 5.02 × 10¹² | 4.37 × 10¹² |
| D | 1.13 × 10¹⁴ | 1.10 × 10¹⁴ | 1.46 × 10¹⁴ | 1.52 × 10¹⁴ | 2.18 × 10¹⁴ | 3.22 × 10¹⁴ | 4.92 × 10¹⁴ | 5.70 × 10¹⁴ | 7.92 × 10¹⁴ |
| EYR | 0.74 | 0.89 | 0.73 | 0.75 | 0.69 | 0.73 | 0.64 | 0.57 | 0.45 |
| ELR | 638.53 | 609.53 | 1175.21 | 1227.97 | 1536.00 | 2800.02 | 3000.70 | 3862.92 | 4379.32 |
| ESI | 1.16 × 10⁻³ | 1.46 × 10⁻³ | 6.24 × 10⁻⁴ | 6.08 × 10⁻⁴ | 4.50 × 10⁻⁴ | 2.60 × 10⁻⁴ | 2.13 × 10⁻⁴ | 1.47 × 10⁻⁴ | 1.03 × 10⁻⁴ |
3.4. Correlation Analysis of Urban Metabolism and Land Use Changes
| Land Use Type | Correlation Coefficients | ||||
|---|---|---|---|---|---|
| U | D | EYR | ELR | ESI | |
| Farmland | 0.8586 | 0.8566 | 0.3992 | 0.6321 | 0.8885 |
| Build-up land | 0.9999 | 0.9958 | 0.9485 | 0.8151 | 0.9933 |

4. Conclusions
- (1)
- Waste emission of Beijing was reduced in recent years, and the utilization rate of resources is higher than in most of the fast-growing cities of China. However, Beijing is a typical consumer-economic urban system, which relies on the consumption of materials and energy. The production activities on built-up land depended on exploitation of local non-renewable resources and on external resource input, and the emergy sustainable indices decreased to almost zero. While there is a continued slowdown in emergy utilization and sustainability of farmland, but the farmland still has more utilization potential than in most provinces and cities of China. According to the correlation analysis, urban development in Beijing relies on production activities on built-up land, which is subjected to great environmental pressure during extraction of material resources. However, while the value of metabolic density of built-up land is between 1.46 × 10¹⁴ and 1.97 × 10¹⁴, there is a positive effect on urban environment, which provides a reliable reference for intensive and compact use of urban land.
- (2)
- The research on urban metabolism and land use based on emergy analysis magnifies every link of land use and metabolism, thus revealing the details of urban development. This makes it possible to conduct specific research on different problems, and to bridge the gap in correlation research, between urban metabolism and land use. The measuring units of materials, energy, and capital are always different, thus it is difficult to compare or combine them in one system, while analysis of the dynamics of emergy indices of different kinds of land, can solve the problems of conflicting measurement units, and avoid the disadvantages of subjective assignment. Each kind of industrial and agricultural product produced by different modes and at different levels has different resource input and output, so its solar transformity is different also, but we used a single transformity value for some resources, thus leading to the inaccuracy of material, energy, and capital emergy in the emergy-analysis method. However, the error is acceptable in the research of urban systems [72].
- (3)
- To realize sustainable development of urban social economy and land use, we suggest that it is necessary to reduce the input of external feedback emergy, reuse materials, recycle products, and control wastes [73], to commit to development of a circular economy. Regarding land administration, the concept of urban land use should be changed to traffic accessible, land-use efficient, and ecological “Smart Growth” [74], to reduce energy consumption and environmental cost. Moreover, developing the potential of farmland appropriately, and popularizing metropolitan modern circulating agriculture of plant-production/animal-transformation/microbial-loop/process model, etc. [75] is necessary to reduce the urban load pressure.
- (4)
- To achieve efficient use of land resources and sustainable urban development, we need further research. First, we need more study about the mechanism of effects between land use and urban metabolism. If we find the key point of land use change, and material, energy, and capital flow change, we might then construct a better land use pattern that is less consumption oriented, has high metabolic efficiency, and is more eco-friendly. Second, we need to apply methods and models to more cases, combined with spatial information sciences, and to compare the research results of these different cases on temporal and spatial scales. Then we might give reliable suggestions on land use and urban sustainable development. Third, we need to explore more methods by which to analyze land use and urban metabolism on different scales, and to evaluate the effect of methodological pluralism. In this way, we might provide new ideas for land administration and urban planning, and also provide a basis for solving urban ecological problems.
Acknowledgments
Author Contributions
Conflicts of Interest
References
- Wu, X.J.; Xue, H.F. Complexity Theory and Its Application in Urban System Research; Northwestern Polytechnical University Press: Xi’an, China, 2007; pp. 4–5. (In Chinese) [Google Scholar]
- Wang, J. The problems and solutions of urban ecological civilization in China. J. Zhengzhou Univ. 2015, 48, 76–80. (In Chinese) [Google Scholar]
- Wolman, A. The metabolism of cities. Sci. Am. 1965, 213, 179–190. [Google Scholar] [CrossRef] [PubMed]
- Castán, B.V.; Adriana, A.; Elizabeth, R. Interdisciplinary Perspectives on Urban Metabolism. State Debate 2012, 16, 851–861. [Google Scholar]
- Kimberley, W.R.; Albert, K. Escalating Trends in the Urban Metabolism of Hong Kong: 1971–1997. AMBIO 2001, 30, 429–438. [Google Scholar]
- Rosado, L.; Niza, S.; Ferrão, P. A material flow accounting case study of the Lisbon metropolitan area using the urban metabolism analyst model. J. Ind. Ecol. 2014, 18, 84–101. [Google Scholar] [CrossRef]
- Liang, S.; Zhang, T.Z. Comparing urban solid waste recycling from the viewpoint of urban metabolism based on physical input-output model: A case of Suzhou in China. Waste Manag. 2012, 32, 220–225. [Google Scholar] [CrossRef] [PubMed]
- Zhang, Y.; Yang, Z.F. A method of analyzing the interactions in an urban metabolism system. Acta Sci. Circumst. 2009, 29, 217–224. (In Chinese) [Google Scholar]
- Jennie, M.; Meidad, K.; William, E.R. An urban metabolism and ecological footprint assessment of Metro Vancouver. J. Environ. Manag. 2013, 124, 51–61. [Google Scholar]
- Yan, W.H.; Huang, X. Transformation of urban metabolism during urbanization in Shenzhen, Guangdong province. Urban. Urban Mod. 2003, 1, 40–42. (In Chinese) [Google Scholar]
- Iorgulescu, R.I.; Polimeni, J.M. A multi-scale integrated analysis of the energy use in Romania, Bulgaria, Poland and Hungary. Energy 2009, 34, 341–347. [Google Scholar] [CrossRef]
- Li, D. Hybrid Emergy-LCA (HEML) based metabolic evaluation of urban residential areas: The case of Beijing, China. Ecol. Complex. 2009, 6, 484–493. [Google Scholar] [CrossRef]
- Biesiot, W.; Noorman, K.J. Energy requirements of household consumption: A case study of The Netherlands. Ecol. Econ. 1999, 28, 367–383. [Google Scholar] [CrossRef]
- Yang, D.W.; Kao, W.T.M.; Zhang, G.Q.; Zhang, N.Y. Evaluating Spatiotemporal differences and sustainability of Xiamen urban metabolism using emergy synthesis. Ecol. Model. 2014, 272, 40–48. [Google Scholar] [CrossRef]
- Liu, G.Y.; Yang, Z.F.; Chen, B. Urban metabolism process based on emergy synthesis: A case study of Beijing. Acta Ecol. Sin. 2013, 33, 5078–5089. (In Chinese) [Google Scholar]
- Vega-Azamar, R.E.; Glaus, M.; Hausler, R.; Oropeza-Garcia, N.A.; Romero-Lopez, R. An emergy analysis for urban environmental sustainability assessment, the Island of Montreal, Canada. Landsc. Urban Plan. 2013, 118, 18–28. [Google Scholar] [CrossRef]
- Li, X.Q.; Hua, L.Z. Landscape aesthetic assessment based on experiential paradigm assessment technology. Acta Ecol. Sin. 2012, 32, 2965–2974. (In Chinese) [Google Scholar]
- Liu, G.Y.; Yang, Z.F.; Chen, B. Comparison of different urban development strategy options to the urban metabolism optimal path. Procedia Environ. Sci. 2011, 5, 178–183. [Google Scholar] [CrossRef]
- Wu, W.; Zhen, F.; Wu, Z.Y. Several land-use issues of the urban development. China Land 1999, 9, 31–32. (In Chinese) [Google Scholar]
- Dong, M.; Yang, S. Analyses of land use and development in urban planning. Heilongjiang Sci. Technology Inf. 2010, 8, 82. (In Chinese) [Google Scholar]
- Thinh, N.X.; Arlt, G.; Heber, B.; Hennersdorf, J.; Lehmann, I. Evaluation of urban land-use structures with a view to sustainable development. Environ. Impact Assess. Rev. 2002, 22, 475–492. [Google Scholar] [CrossRef]
- Li, X.B.; Zhu, H.Y.; Tan, M.H.; Xin, L.J. Measurement of land use intensity. Prog. Geogr. 2008, 27, 12–17. (In Chinese) [Google Scholar]
- Peng, J.C.; Xu, C.P.; Wu, Q.; Yu, D.G.; Chen, J. Regional disparities of urban land intensive utilization degree in the Yangtze delta. China Popul. Resour. Environ. 2008, 18, 103–109. (In Chinese) [Google Scholar]
- Salazar, S.D.S.; Menendez, L.G. Public provision versus private provision of industrial land: A hedonic approach. Land Use Policy 2005, 22, 215–223. [Google Scholar] [CrossRef]
- Meng, Y.; Zhang, F.R.; An, P.L.; Dong, M.L.; Wang, Z.Y.; Zhao, T. Industrial land-use efficiency and planning in Shunyi, Beijing. Landsc. Urban Plan. 2008, 85, 40–48. [Google Scholar] [CrossRef]
- Holden, E. Ecological footprints and sustainable urban form. J. Hous. Built Environ. 2004, 19, 91–109. [Google Scholar] [CrossRef]
- Zheng, H.Y.; Shen, L. Evaluation of urban land intensive use: Take the case of a changing city of Shenzhen as an example. J. Nat. Resour. 2008, 23, 1009–1011. [Google Scholar]
- Howley, P. Attitudes towards compact city living: Towards a greater understanding of residential behaviors. Land Use Policy 2009, 26, 792–798. [Google Scholar] [CrossRef]
- Qiu, B.W.; Chen, C.C. Land use change simulation model based on MCDM and CA and its application. Acta Geogr. Sin. 2008, 63, 165–174. (In Chinese) [Google Scholar]
- Crooks, A.; Castle, C.; Batty, M. Key challenges in agent-based modeling for geo-spatial simulation. Comput. Environ. Urban Syst. 2008, 32, 417–430. [Google Scholar] [CrossRef]
- Zhang, H.Z.; Hao, S.Y. Urban space expansion and land intensive utility. Econ. Geogr. 2008, 28, 419–424. (In Chinese) [Google Scholar]
- Walter, C.; Stutzal, H. A new method for assessing the sustainability of land-use systems: Evaluating impact indicators. Ecol. Econ. 2009, 68, 1288–1300. [Google Scholar] [CrossRef]
- Elizabeth, B. Measuring urban compactness in UK towns and cities. Environ. Plan. B Plan. Des. 2002, 29, 219–250. [Google Scholar]
- De Vries, W.; Lewis, J. Are urban land tenure regulations in Namibia the solution or the problem? Land Use Policy 2009, 26, 1116–1127. [Google Scholar] [CrossRef]
- Zhai, W.X.; Huang, X.J.; Zhang, Q.; Zhong, T.Y.; Ma, Q.F. Land intensive use in city development zones based on analytic hierarchy process: A case study of Jiangsu Province. J. Nanjing Univ. Nat. Sci 2006, 42, 96–102. (In Chinese) [Google Scholar]
- Oh, K.S.; Jeong, Y.W.; Lee, D.K.; Lee, W.K.; Choi, J.Y. Determining development density using the urban carrying capacity assessment system. Landsc. Urban Plan. 2005, 73, 1–15. [Google Scholar] [CrossRef]
- Liu, H.Y.; Fang, C.L.; Ban, M.S. Synthetically evaluation on intensive land use of Haidian science parks in Beijing. Econ. Geogr. 2008, 28, 291–296. (In Chinese) [Google Scholar]
- Zheng, X.Q.; Wang, X.M.; Wang, A.P.; Zhang, B. Estimation method of potentials for intensive use of urban parcels: A case of Jinan city. Resour. Sci. 2005, 27, 71–75. (In Chinese) [Google Scholar]
- Wu, Y.Q.; Yan, M.C.; Xu, L.F. Review on the research of Emergy-based urban metabolism. Ecol. Environ. Sci. 2009, 18, 1139–1145. (In Chinese) [Google Scholar]
- Huang, X.J.; Yu, S.T. Studies on material metabolism response of regional land use change. J. Nat. Resour. 2006, 21, 1–8. (In Chinese) [Google Scholar]
- Lee, C.L.; Huang, S.L.; Chan, S.L. Synthesis and spatial dynamics of socio-economic metabolism and land use change of Taipei Metropolitan Region. Ecol. Model. 2009, 220, 2940–2959. [Google Scholar] [CrossRef]
- Wu, Y.Q.; Yan, M.C. Analysis of the indicators between urban metabolism and land use change in Guangzhou. Geogr. Res. 2011, 30, 1380–1389. (In Chinese) [Google Scholar]
- Vega-Azamar, R.E.; Romero-López, R.; Glaus, M.; Oropeza-Garcia, N.A.; Hausler, R. Sustainability assessment of the residential land use in seven boroughs of the Island of Montreal, Canada. Sustainability 2015, 7, 2454–2472. [Google Scholar] [CrossRef]
- Odum, H.T.; Odum, E.C. A Prosperous Way Down; University Press of Colorado: Boulder, CO, USA, 2001; pp. 89–130. [Google Scholar]
- Odum, H.T. Environmental Accounting: Energy and Environmental Decision Making; John Wiley and Sons Inc.: New York, NY, USA, 1996. [Google Scholar]
- Zhang, Y.; Yang, Z.F.; Yu, X.Y. Evaluation of urban metabolism based on emergy synthesis: A case study of Beijing (China). Ecol. Model. 2009, 220, 1690–1696. [Google Scholar] [CrossRef]
- Odum, H.T.; Brown, M.T.; Brandt-Williams, S.B. Handbook of Emergy Evaluation: A Compendium of Data for Emergy Computation Issued in a Series of Folios; Center for Environmental Policy, University of Florida: Gainesville, FL, USA, 2000. [Google Scholar]
- Huang, S.L.; Lee, C.L.; Chen, C.W. Socioeconomic metabolism in Taiwan: emergy synthesis vs. material analysis. Resour. Conserv. Recycl. 2006, 48, 166–196. [Google Scholar] [CrossRef]
- Lan, S.F.; Qin, P.; Lu, H.F. Emergy Analysis on Ecological-Economic Systems; Chemical Industry Press: Beijing, China, 2002; pp. 78–87. (In Chinese) [Google Scholar]
- Li, S.C.; Cai, Y.L. Emergy-based analysis on land sustainability. Econ. Geogr. 2002, 22, 346–350. (In Chinese) [Google Scholar]
- Beijing Bureau of Statistics. Beijing Statistical Year Book (1997–2013); China Statistics Press: Beijing, China, 1997–2013. (In Chinese)
- National Bureau of Statistics, Ministry of Environmental Protection. China Statistical Year Book on Environment (1997–2013); China Statistics Press: Beijing, China, 1997–2013. (In Chinese)
- National Bureau of Statistics. China Industry Statistical Year Book (1997–2013); China Statistics Press: Beijing, China, 1997–2013. (In Chinese)
- State Forestry Administration. China Forestry Statistical Year Book (1997–2013); China Forestry Press: Beijing, China, 1997–2013. (In Chinese)
- National Bureau of Statistics. China Rural Statistical Year Book (1997–2013); China Statistics Press: Beijing, China, 1997–2013. (In Chinese)
- National Bureau of Statistics, National Development and Reform Commission. China Energy Statistical Year Book (1997–2013); China Statistics Press: Beijing, China, 1997–2013. (In Chinese)
- Brown, M.T.; Bardi, E. Handbook of Emergy Evaluation: A Compendium of Data for Emergy Computation Issued in a Series of Folios. Folio 3, Emergy of Ecosystems; Center for Environmental Policy, Environmental Engineering Sciences University of Florida: Gainesville, FL, USA, 2001. [Google Scholar]
- Zhang, Y.; Yang, Z.F.; Liu, G.Y.; Yu, X.Y. Emergy analysis of the urban metabolism of Beijing. Ecol. Model. 2011, 222, 2377–2386. [Google Scholar] [CrossRef]
- Song, T.; Cai, J.M.; Du, S.S.; Ni, P.; Ding, Y. Emergy analysis of urban metabolism in Beijing. J. Arid Land Resour. Environ. 2015, 29, 37–42. (In Chinese) [Google Scholar]
- Ulgiati, S.; Brown, M.T. Monitoring patterns of sustainability in natural and man-made ecosystems. Ecol. Model. 1998, 108, 23–26. [Google Scholar] [CrossRef]
- Hu, X. The Ecological Construction of World City and the Choice of Beijing. Urban Insight 2012, 4, 75–82. (In Chinese) [Google Scholar]
- Wang, R.P.; Rong, X.M.; Hou, X.H. Energy analysis theory and its application in agro-ecosystem: A case of Shanxi. J. Hum. Agric. Univ. (Nat. Sci.) 2009, 35, 331–334. (In Chinese) [Google Scholar]
- Wang, W.W.; Cao, F.X.; Kang, W.X.; Sha, J.X.; He, J.N. Emergy index analysis of agro-ecological economic system of Jiangxi province. Chin. Agric. Sci. Bull. 2011, 27, 208–213. (In Chinese) [Google Scholar]
- Zhang, X.B. Energy based analysis of developmental situation and countermeasures for sustainable development of agricultural eco-economic systems of Gansu. Agric. Res. Arid Areas 2007, 25, 165–171. (In Chinese) [Google Scholar]
- Du, B.Y.; Meng, M.X.; Xu, H.; Wang, S.T.; Qi, Y.P.; Li, X.W. Comprehensive evaluation of environmental resources and farmland ecosystems in Hebei province based on emery theory. Resour. Sci. 2008, 30, 1236–1242. (In Chinese) [Google Scholar]
- Zhu, Y.L. Study on Agro-Ecosystem’s Sustainable Development of Hunan Based on the Emergy Theory. Ph.D. Thesis, Central South University of Forestry and Technology, Changsha, China, 2010. [Google Scholar]
- Huang, F.P.; Huang, M.S.; Li, X.L.; Jiang, W. The sustainable utilization research of agricultural land in Fujian based on the emergy Analysis. Chin. Agric. Sci. Bull. 2013, 29, 61–66. (In Chinese) [Google Scholar]
- Liang, S.S.; Zhang, C.Z.; Li, S.Q.; Wang, L.X. Assessment on and approaches to farmland sustainability via energy value in Xi’an city. Resour. Ind. 2007, 9, 36–40. (In Chinese) [Google Scholar]
- Jing, D.; Bian, Z.F. Structure, function and sustainability assessment of eco-economic system of cultivated land in Xuzhou. China Land Sci. 2010, 24, 38–44. (In Chinese) [Google Scholar]
- Jiang, J.; Shi, Y.J. Study on the status, problems, and suggestions of urban modern agriculture in Beijing. Res. Agric. Mod. 2015, 36, 168–173. (In Chinese) [Google Scholar]
- Jiang, H.F.; Feng, J.G.; Xue, Z.Q.; Zhang, Y. The issues of Beijing new-type urbanization under the background of ecological vivilization. Chin. J. Agric. Resour. Reg. Plan. 2014, 35, 1–5. (In Chinese) [Google Scholar]
- Lan, S.F.; Qin, P.; Lu, H.F. Emergy Analysis on Ecological-Economic Systems; Chemical Industry Press: Beijing, China, 2002; p. 75. (In Chinese) [Google Scholar]
- Wen, Z.B. Study on synergic development of city land-use system. Sci. Surv. Map. 2014, 39, 42–47. (In Chinese) [Google Scholar]
- Hou, J.X.; Liu, Y. The reference of “Smart Growth” strategy for Beijing’s new suburban towns’ construction. Ecol. Econ. 2010, 5, 163–167, 174. (In Chinese) [Google Scholar]
- Zheng, W.T.; Deng, R.; Hu, B.G.; Tian, S.M. Practical exploration of developing metropolitan modern circulating agriculture in Beijing. J. Beijing Univ. Agric. 2014, 29, 82–86. (In Chinese) [Google Scholar]
© 2015 by the authors; licensee MDPI, Basel, Switzerland. This article is an open access article distributed under the terms and conditions of the Creative Commons Attribution license (http://creativecommons.org/licenses/by/4.0/).
Share and Cite
Huang, Q.; Zheng, X.; Hu, Y. Analysis of Land-Use Emergy Indicators Based on Urban Metabolism: A Case Study for Beijing. Sustainability 2015, 7, 7473-7491. https://doi.org/10.3390/su7067473
Huang Q, Zheng X, Hu Y. Analysis of Land-Use Emergy Indicators Based on Urban Metabolism: A Case Study for Beijing. Sustainability. 2015; 7(6):7473-7491. https://doi.org/10.3390/su7067473
Chicago/Turabian StyleHuang, Qing, Xinqi Zheng, and Yecui Hu. 2015. "Analysis of Land-Use Emergy Indicators Based on Urban Metabolism: A Case Study for Beijing" Sustainability 7, no. 6: 7473-7491. https://doi.org/10.3390/su7067473